Article

The Temporal Evolution Characteristics of Extreme Rainfall in Shenzhen City, China

1
School of Water Resource and Environment, China University of Geosciences, Beijing 100083, China
2
Key Laboratory of Groundwater Conservation of MWR, China University of Geosciences, Beijing 100083, China
*
Author to whom correspondence should be addressed.
These authors contributed equally to this work.
Sustainability 2025, 17(8), 3512; https://doi.org/10.3390/su17083512
Submission received: 21 February 2025 / Revised: 7 April 2025 / Accepted: 9 April 2025 / Published: 14 April 2025
(This article belongs to the Special Issue Groundwater Management, Pollution Control and Numerical Modeling)

Abstract

:
Global climate change has led to frequent urban flooding, and extreme rainfall has become the main cause of urban flooding due to its short duration and rapid occurrence. The study of the trend of extreme rainfall can provide an important reference for the prevention, control, and management of urban flooding. At present, there are abundant studies on the evolution characteristics of rainfall in Shenzhen, but there are relatively few studies on the evolution characteristics of extreme rainfall. To analyze the interannual variation in extreme rainfall in Shenzhen and provide a scientific basis for water resource management, this paper systematically analyses the interannual evolutionary characteristics and cyclical patterns of rainfall in Shenzhen based on the daily rainfall data of the city from 1958 to 2022 using the 3-year moving average method, linear regression model, Mann–Kendall mutation test, and wavelet analysis. Hurst index analysis was also used to predict the future trends of extreme rainfall and its frequency. The results indicate that the intensity and frequency of extreme rainfall in Shenzhen exhibit frequent fluctuations, with an overall slow downward trend and no sudden changes causing a decline. Periodic analysis reveals that extreme rainfall intensity and frequency exhibit significant wet–dry alternation characteristics on a time scale of 10–65 years, with the most prominent change occurring on a 63-year scale; in the main cycle, the wet–dry alternation cycle is about 44 years. The trend of the main cycle and wet–dry alternation cycle indicates that in recent years, the rainfall pattern in Shenzhen has developed towards short-term rainfall. The Hurst index analysis shows that the H values of extreme rainfall intensity and frequency are 0.666 and 0.631, respectively, both only slightly greater than 0.5, indicating weak positive persistence of the two indicators. This suggests that extreme rainfall events in Shenzhen may show a downward trend, but this trend does not have strong certainty.

1. Introduction

Global warming and rapid urbanization have driven significant hydrological cycle changes, increasing extreme rainfall frequency and intensity globally [1,2,3,4], and exacerbating flood disaster risks. Meanwhile, rainfall not only causes floods but also triggers geological disasters such as landslides [5,6]. Rainfall-related parameters, such as rainfall intensity and precipitation, are key factors for landslide disaster prediction and warning. In addition, rainfall can also cause changes in groundwater, which in turn affects faults and the transport of their water substances. To solve problems such as disasters and faults, we cannot only focus on the properties of rock, soil, and groundwater [7]. We also need to pay close attention to and strengthen in-depth research on rainfall [8] to effectively address issues such as faults caused by rainfall [9] and water and sediment seepage and transport [10,11]. Therefore, studying the rainfall patterns in various regions is particularly important. The study of extreme rainfall patterns has garnered increasing attention from scholars worldwide, yielding significant advancements in understanding their underlying mechanisms and trends [12]. Mishra et al. [13], in their investigation of extreme climatic evolution across 217 cities globally, identified a marked increase in the frequency of extreme rainfall events in India and South America. Wang Weiping et al. [14] found that based on observation data from 75 meteorological stations in Xinjiang from 1961 to 2020, the annual precipitation and the intensity and frequency of extreme rainfall events in the region showed a significant upward trend. Wang Lihong et al. [15], in their analysis of the “7.20” extreme rainstorm event in Henan Province, highlighted its prolonged duration and exceptional intensity.
Under the synergistic effect of monsoons and tropical cyclones, extreme rainfall events in China have shown characteristics of prolonged duration and increased frequency [16,17,18,19], leading to a significant increase in the risk of flooding disasters in many areas. Shenzhen is a sub-provincial city in Guangdong Province, a national economic special zone, and a core engine city in the Guangdong Hong Kong Macao Greater Bay Area [20]. Analysis of regional rainfall data from 1979 to 2018 reveals that Shenzhen’s annual rainfall consistently exceeds the provincial average (Figure 1). It indicates that its rainfall characteristics are significantly different from the rest of Guangdong Province. This uniqueness may be caused by a combination of factors such as geographic location, topographic features, and urbanization process. The study of the evolution of extreme rainfall characteristics in Shenzhen can help to reveal its local climate patterns and provide an important reference for rainfall research in Guangdong Province and even in South China. Moreover, the precipitation in Shenzhen is characterized by abundant annual rainfall, long rainy season duration, high rainfall intensity, and frequent extreme rainstorm events, which often induce secondary disasters such as floods and landslides. As represented in Figure 2, the section of Chau Shek Road underneath the bridge of Hezhou Expressway in Shenzhen City was subject to traffic disruption due to water on the road surface in rain showers in different years. This phenomenon highlights the practical significance of studying the evolutionary characteristics of extreme rainfall. The results of the study can provide a scientific basis for the Shenzhen Municipal Government to formulate flood prevention and drainage policies, optimize the urban drainage system, and improve the transportation infrastructure, to reduce the impacts of extreme rainfall on urban operations. Additionally, as the core city of Guangdong Province, Shenzhen will significantly enhance its development resilience by reducing the impact of natural disasters on the economy and optimizing regional economic planning. This will not only contribute to the sustainable development of Shenzhen itself but also further enhance Guangdong Province’s comprehensive competitiveness both domestically and internationally [21,22,23,24].
Recent studies have made significant progress in understanding the evolution characteristics of rainfall in Shenzhen. However, research on the temporal evolution and future trends of extreme rainfall remains limited, representing a critical knowledge gap. Lin Kairong et al. [25] analyzed rainfall data from 1963 to 2009 and found a non-significant increasing trend over the past 50 years, with notable spatial variability. Ding Nan et al. [26], using data from 1961 to 2011, reported increasing trends in annual precipitation, precipitation days, rainfall intensity, and rainfall during both flood and non-flood seasons. Huang Guoru et al. [27], using the M-K trend test method, analyzed extreme climate indicators in Shenzhen from 1953 to 2012 and found that extreme rainfall was primarily concentrated in summer across all four seasons. Wang Junyang et al. [28], based on rainfall data from 1979 to 2018, observed that the locations of high-risk extreme rainfall zones transitioned from dispersed to concentrated patterns with urbanization. The monthly average number of heavy rainfall days and monthly maximum daily rainfall both increased across decades, while annual precipitation showed a decreasing trend. Extreme rainfall is one of the most direct causes of urban waterlogging disasters [29]. Therefore, it is necessary to study the mechanism and future prediction of extreme rainfall events in Shenzhen.
This study utilizes daily rainfall data from Shenzhen Station spanning 1958 to 2022, employing the 3-year moving average method, linear regression model, and wavelet analysis to examine the intraannual distribution, variation characteristics, and periodicity of rainfall in Shenzhen. Additionally, the Mann–Kendall mutation test and Hurst exponent analysis were applied to conduct mutation detection and trend prediction for extreme rainfall intensity and frequency in Shenzhen.

2. Materials and Methods

2.1. Study Area

Shenzhen (Figure 3) is a coastal city in southern China, adjacent to Hong Kong, located south of the Tropic of Cancer, between longitudes 113°43′ E–114°38′ E and 22°24′ N–22°52′ N. It is situated in the southern part of Guangdong Province, on the eastern shore of the Pearl River Estuary [30]. Shenzhen has a subtropical monsoon climate, characterized by mild weather throughout the year. The region has sufficient rainfall, with an average annual rainfall of about 1933.3 mm, which is much larger than the average rainfall in China (about 648 mm). This climate type is typical of coastal regions in southern China, with distinct wet and dry seasons. During summer, southeasterly winds prevail, bringing high temperatures and abundant rainfall. These winds are driven by the Pacific monsoon system, which dominates the region’s weather patterns during this season. As a result, summer is the wettest season in Shenzhen [31], accounting for the majority of the city’s annual precipitation. This seasonal concentration of rainfall has significant implications for urban planning and disaster management. Rainfall distribution is spatially uneven, with higher precipitation in the southeast and less in the northwest, showing a decreasing gradient from southeast to northwest [32,33]. This study focuses on the urban area of Shenzhen, where the rainfall station is located, to analyze the temporal evolution characteristics of extreme rainfall in the region.

2.2. Data Source

This study utilized the China Meteorological Forcing Dataset (1979–2018) from the National Tibetan Plateau Data Center and the China Surface Basic Meteorological Observation Dataset (1958–2022) from the National Meteorological Science Data Center as precipitation data, and DEM (Digital Elevation Model) [34] from the Geospatial Data Cloud for regional visualization analysis. The data have undergone strict quality control, and to ensure its reliability, linear interpolation is used to replace missing data.

2.3. Definition of Extreme Precipitation

According to the “Precipitation Level” definition by the China Meteorological Administration, rainfall is classified into six levels based on the amount of water falling to the ground from the atmosphere: extremely heavy rain > 200 mm d−1; heavy rain > 100 mm d−1; rainstorm > 50 mm d−1; heavy rain > 25 mm d−1; moderate rain > 10 mm d−1; and light rain > 0.1 mm d−1 [35,36]. However, due to China’s vast territory and the significant differences in topography and precipitation across regions, fixed values are not typically used to determine precipitation conditions in various areas. When studying extreme events and their trends, the internationally accepted threshold method is usually chosen, defining a specific percentile value as the extreme value. Rainfall events exceeding this defined value are considered extreme rainfall events [37]. This paper first arranges all the daily rainfall data in ascending order. According to the definition of extreme rainfall, the 99th percentile is taken as the threshold for extreme rainfall events. Rainfall exceeding this threshold is termed an extreme rainfall event [38].

2.4. Research Methods

To comprehensively analyze the changing characteristics of extreme rainfall in Shenzhen, multiple complementary statistical methods are used in this study. First, the wavelet analysis is used to identify cyclical patterns of extreme rainfall, revealing its multi-scale variability and major cycles. Second, the Mann–Kendall mutation test is used to trend the extreme rainfall amount and frequency in Shenzhen and help identify change points, thus providing insight into the temporal evolution of these variables. Finally, the Hurst index is utilized to assess the persistence of rainfall trends and thus predict whether future trends are likely to be consistent with past patterns. Together, these methods, ranging from trend detection and periodicity analysis to long-term trend prediction, provide a holistic understanding of the characteristics of extreme rainfall variability in Shenzhen.

2.4.1. Wavelet Analysis

The wavelet analysis method combines time-frequency domain analysis capabilities and can identify periodic features, making it an effective tool for studying the periodicity of rainfall time series [39,40].
Due to the characteristics of the precipitation time series, this paper uses the Morlet continuous wavelet transform. When the selected sample size is n, the sampling interval is ∆T, and the finite energy signal is f(t) L2(R), the continuous wavelet transform is defined as follows [41]:
ψ a , b ( T ) = | a | 1 2 ψ ( T b a ) ( b R , a R , a 0 )
W f ( a , b ) = | a | 1 2 Δ T k = 1 n ( k Δ T ) ψ ¯ ( k Δ T b a )
In the equation, ψa,b(T) is the mother wavelet; a is the frequency parameter; b is the time parameter, reflecting the characteristics of frequency and time parameters as a and b change; Wf(a, b) is the wavelet coefficient; and ψ(T) is the complex conjugate of ψ(T).
Regarding the wavelet, variance is defined in the following equation:
V a r ( a ) = 1 n b = 1 n W ( a , b ) 2
The process of varying with the frequency parameter is called the wavelet variance plot, which reflects the distribution of the fluctuation energy as the parameter varies.

2.4.2. Mann–Kendall Mutation Test Method

The Mann–Kendall mutation test is a nonparametric statistical method widely used to determine whether data have undergone significant changes over time, such as rainfall and temperature. Due to its robustness, flexibility, and independence from data sequences, the M-K test has become a popular tool in climate and environmental research [42,43,44,45,46]. The basic principle of this method is that [47] for a random independent time series x with n samples, the cumulative number of values at time i greater than at time j is constructed as the following sequence:
S k = i = 1 k r i , k = 2 ,   3 , , n
including,
r i = + 1 , x i > x j 0 , x i x j , j = 1 , 2 , 3 , , i
The mean of Sk is denoted as E(Sk), and the variance of Sk is denoted as Var(Sk). They can be expressed by the following formulas:
E ( S k ) = n ( n 1 ) 4
V a r ( S k ) = n ( n 1 ) ( 2 n + 5 ) 72
The time series calculated according to the order of X results in the statistical sequence UF(k). UF(k) follows a standard normal distribution and can be defined by the following formula:
U F ( k ) = S k E ( S k ) V a r ( S k ) ( k = 1 , 2 , n )
when the confidence level takes α, by checking the normal distribution table, when |UF(k)| > Uα, from the figure it is found that the UF curve passes through the horizontal line with confidence level α, i.e., there is a significant trend of change in the sequence; the above steps are carried out for the inverse of the original sequence X, and the time change in the inverse of the sequence is noted for the inverse of UB(k), and is defined as follows:
U B ( k ) = U F ( k ) ( k = n , n 1 , , 2 ) , U B 1 = 0
The mutation years and trend changes in the sequence can be visually described by the UF(k) and UB(k) curves.

2.4.3. Hurst Index Analysis Method

The Hurst exponent or coefficient analysis method, first proposed by Harold Edwin Hurst in 1951, is a powerful tool for revealing the long-term dependence and changing trends of time series data [48,49]. It has been widely applied in various research fields, particularly in the study of rainfall trends, where it helps to identify persistent or anti-persistent patterns in precipitation data over time. The basic principle of this method is to [50,51] construct a time series {θ(t), t = 1, 2,…, n} and define the mean value as follows:
θ τ = 1 τ t = 1 τ θ ( t ) , τ = 1 , 2 , , n
Define the cumulative deviation as follows:
X ( t , τ ) = t = 1 τ θ ( t ) θ τ , 1 t τ
Define the range of the series as the difference between the maximum and minimum values corresponding to the same value as follows:
Z ( τ ) = max 1 t τ X ( t , τ ) min 1 t τ X ( t , τ ) , τ = 1 , 2 , , n
Define the standard deviation of the series as follows:
S ( τ ) = 1 τ t = 1 τ θ ( t ) θ ( τ ) 2
Finally, make the following definition:
Z ( τ ) S ( τ ) = ( m τ ) H
When Equation (14) holds, taking the logarithm on both sides yields the H value as follows:
lg Z ( τ ) S ( τ ) = H ( lg m + lg τ ) H
In Equations (14) and (15), m is a constant.
According to Equation (15), the slope of the linear regression is the H value, which reveals the future trend of the time series. There are three forms of the H value [52,53]:
(1) When 0 < H < 0.5, it indicates that the future changes in the time series θ(t) have anti-persistence relative to past trends, and the smaller the H value, the stronger the anti-persistence.
(2) When H = 0.5, it indicates that the future changes in the time series θ(t) are unrelated to past trends and are random, i.e., unpredictable.
(3) When 0.5 < H < 1, it indicates that the future changes in the time series θ(t) have positive persistence relative to past trends, and the larger the H value, the stronger the trend persistence or long-memory property of the time series.

3. Results

3.1. Evolutionary Characterization and Mutability Analysis

3.1.1. Characterization of the Intraannual Evolution of Extreme Rainfall and Analysis of Sudden Variability

According to the definition of extreme precipitation events used in this study, all the daily rainfall data were first arranged in ascending order, and the value at the 99th percentile was set as the threshold for extreme rainfall events. The 99th percentile was chosen as the threshold because it represents the most intense 1% of rainfall events, which are typically associated with significant impacts on infrastructure, ecosystems, and human activities and can effectively identify extreme heavy rainfall events. Compared to the 90th or 95th percentile, this standard is more stringent and particularly suitable for assessing extreme rainfall risks in rapidly urbanizing coastal cities such as Shenzhen. Based on the above method, the threshold for extreme rainfall events in Shenzhen is determined to be 127.9 mm. The total annual rainfall of all extreme rainfall events is called the annual extreme rainfall. On this basis, the annual extreme rainfall in Shenzhen was calculated. As represented in Figure 4a, the trend of temporal variation in the annual extreme rainfall in Shenzhen is presented.
This section employs the 3-year moving average method and linear regression analysis to systematically study the interannual variation trend of extreme rainfall in Shenzhen from 1958 to 2022. We used the 3-year moving average method mainly to smooth out interannual fluctuations, highlight long-term trends, effectively preserve the main changing characteristics of the studied data, and remove random fluctuations. The research results show that the annual extreme rainfall in Shenzhen from 1958 to 2022 exhibits significant interannual fluctuations and a slow downward trend overall (Figure 4a), with a decline rate of −2.762 mm/a, which is consistent with the trend of daily maximum rainfall variation studied by Huang Guoru et al. [27]. The 3-year moving average curve indicates that extreme rainfall exhibits periodic fluctuations of 4–10 years, with the fluctuation period extending over time. During the research period, the annual average extreme rainfall was 248.1 mm, with a peak of 897.3 mm in 1964, which was 3.6 times the annual average and accounted for 37% of the total annual rainfall; in 2008, it was 737.2 mm, accounting for 27% of the total annual rainfall. It is worth noting that the cumulative positive rainfall during the research period only accounted for 13% of the total rainfall, highlighting the anomalies in 1964 and 2008. This extreme rainfall characteristic is closely related to the rapid urbanization process in Shenzhen, indicating that urban development has a significant impact on local rainfall patterns.
Additionally, the M-K mutation test method was used to analyze the mutation characteristics of the annual extreme rainfall in Shenzhen from 1958 to 2022. UF is a positive time series statistic, the positive and negative values of which represent the increasing and decreasing trend of the series, respectively; the critical value corresponding to the 0.05 level of significance is ±1.96 [54] (hereinafter referred to as the “0.95 confidence line”), and when the UF is greater than 1.96 or less than −1.96, it means that the trend of the series increasing or decreasing is significant. UB is a reverse chronological statistic. The possible mutation point of the sequence is the intersection of the UF and UB curves within the confidence line.
As represented in Figure 4b, since 1970, the UF value has remained negative, indicating a decreasing trend in extreme rainfall. Although there are multiple intersections between the UF and UB curves at a confidence level of 0.95, it can be determined that there has been no significant change in extreme rainfall over the past 65 years as the UF value has never exceeded the confidence interval. This conclusion is consistent with the research results of Wang Junyang et al. [28] based on rainfall data from 1979 to 2018.

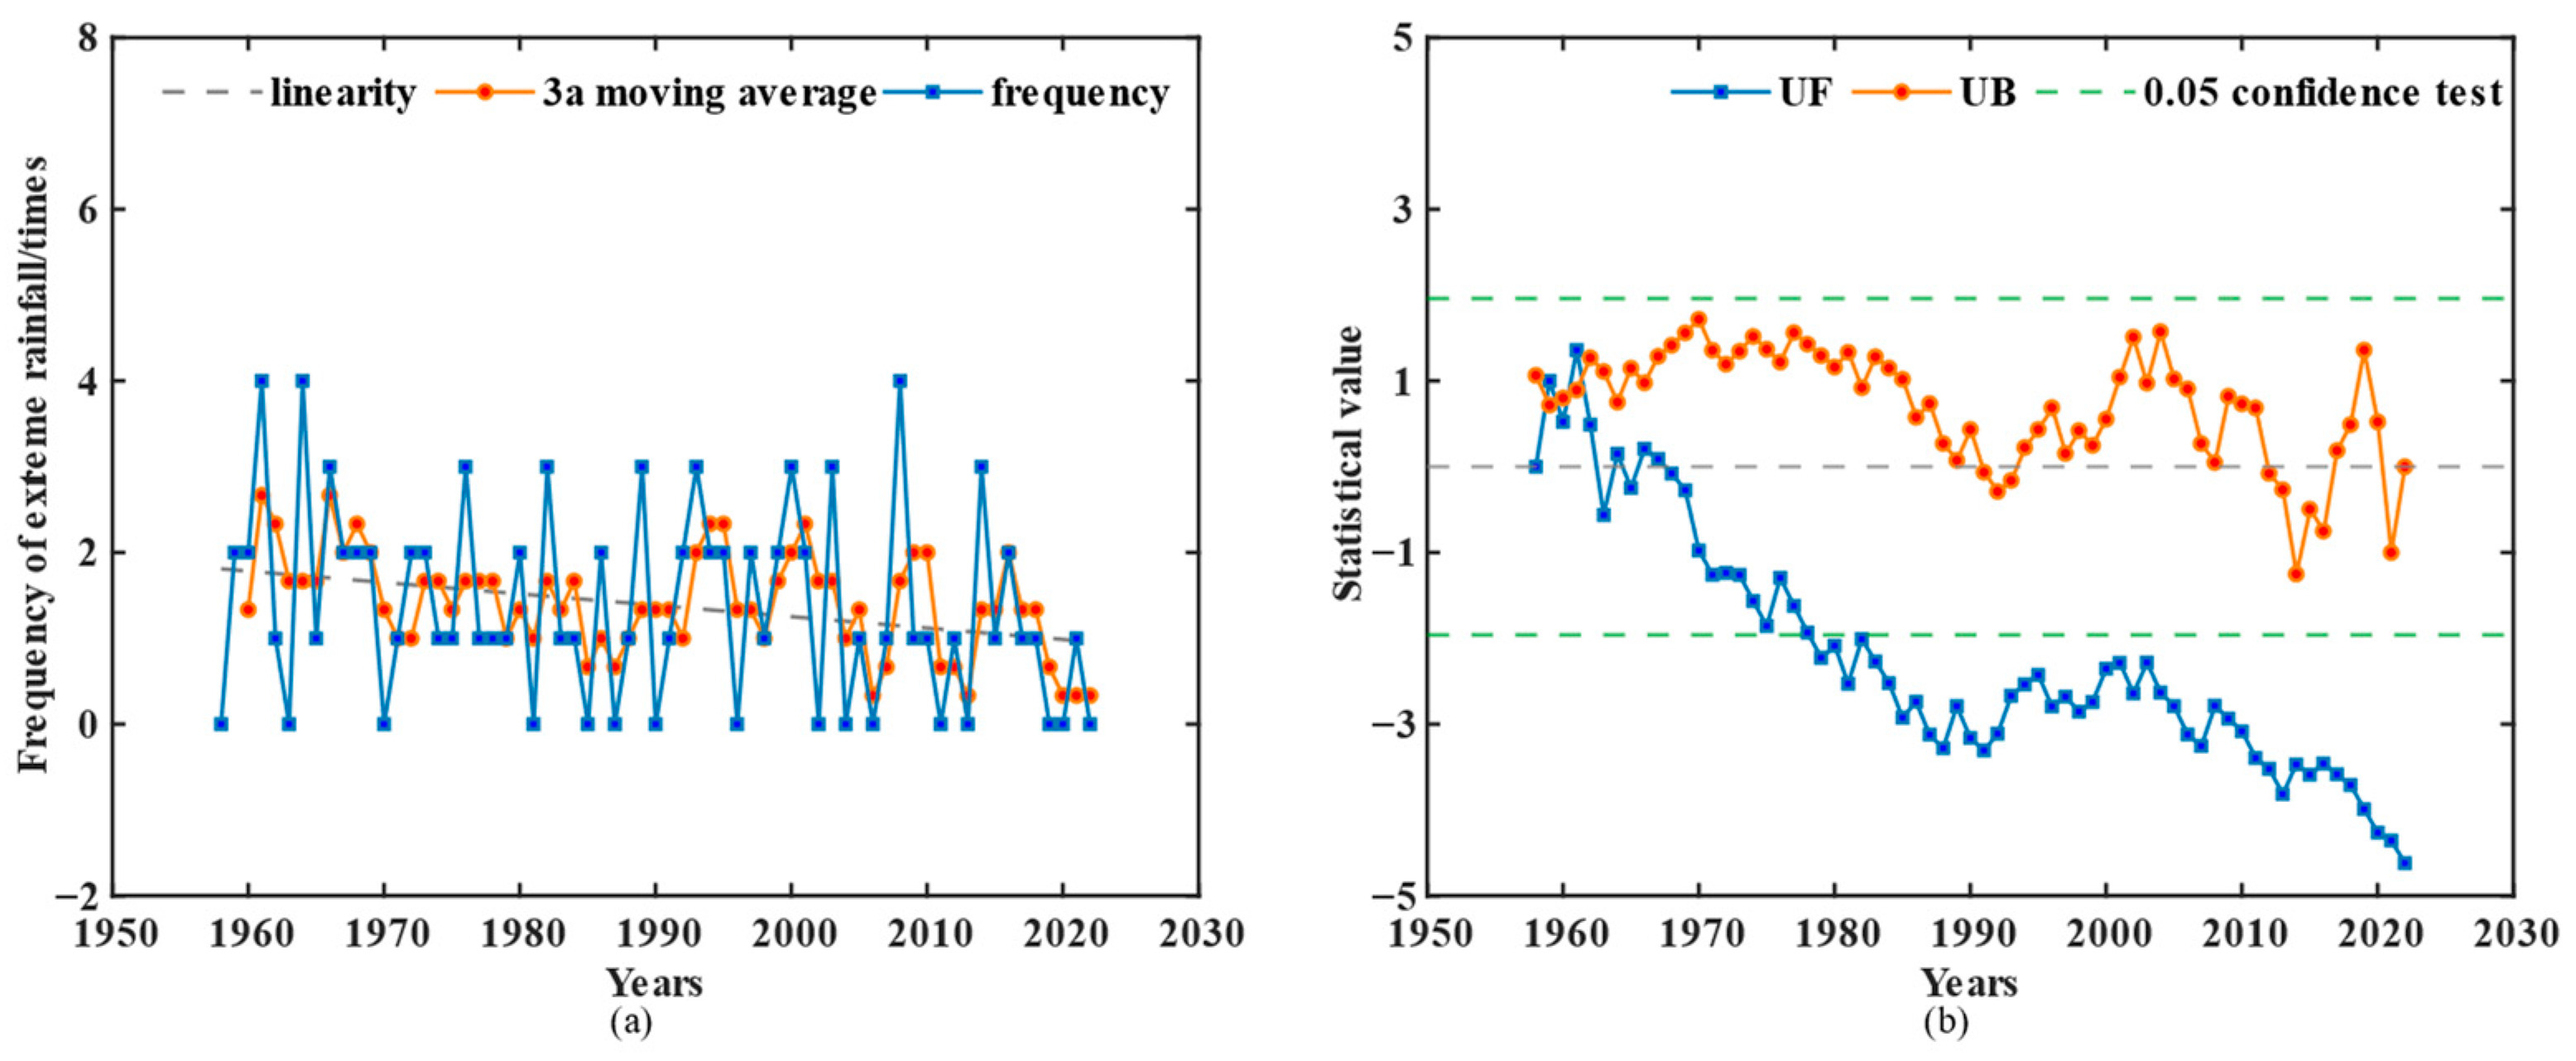
3.1.2. Characterization of the Intraannual Evolution of Extreme Rainfall Frequency and Analysis of Sudden Variability

This study defines the annual extreme rainfall frequency as the number of days exceeding a threshold and uses a 3-year moving average method and linear regression analysis to reveal the temporal variation characteristics of extreme rainfall frequency in Shenzhen from 1958 to 2022 (Figure 5a).
According to Figure 5a, the linear regression trend shows that the frequency of extreme rainfall events in Shenzhen from 1958 to 2022 exhibits a slow downward trend, with a decline rate of −0.013 events/a. The frequency of extreme rainfall shows significant interannual fluctuations, with particularly prominent anomalies in 1961, 1964, and 2008, with four extreme rainfall events per year, more than twice the annual average. The 3-year moving average analysis shows that these abnormal years are closely related to ENSO events: 1961 and 1964 are typical La Niña years, and their enhanced southeast monsoon leads to increased precipitation in southern China [55]; in 2008, it was in a phase of significant global warming, exacerbating the frequency and intensity of extreme rainfall. A typical case is on 13 June 2008, when Shenzhen experienced a once-in-a-century heavy rainfall event [56]. As a coastal city in southern China, Shenzhen’s extreme rainfall characteristics are significantly affected by the combined effects of La Niña and global warming.
As shown in Figure 5b, the UF value has remained negative since 1968, indicating a decreasing trend in the frequency of extreme rainfall. Although there are multiple intersections between the UF and UB curves at a confidence level of 0.95, none of them exceed the confidence interval, indicating that there has been no significant abrupt change in the frequency of extreme rainfall over the past 65 years. This result is consistent with the mutation analysis conclusion of the M-K test.

3.2. Cycle Analysis

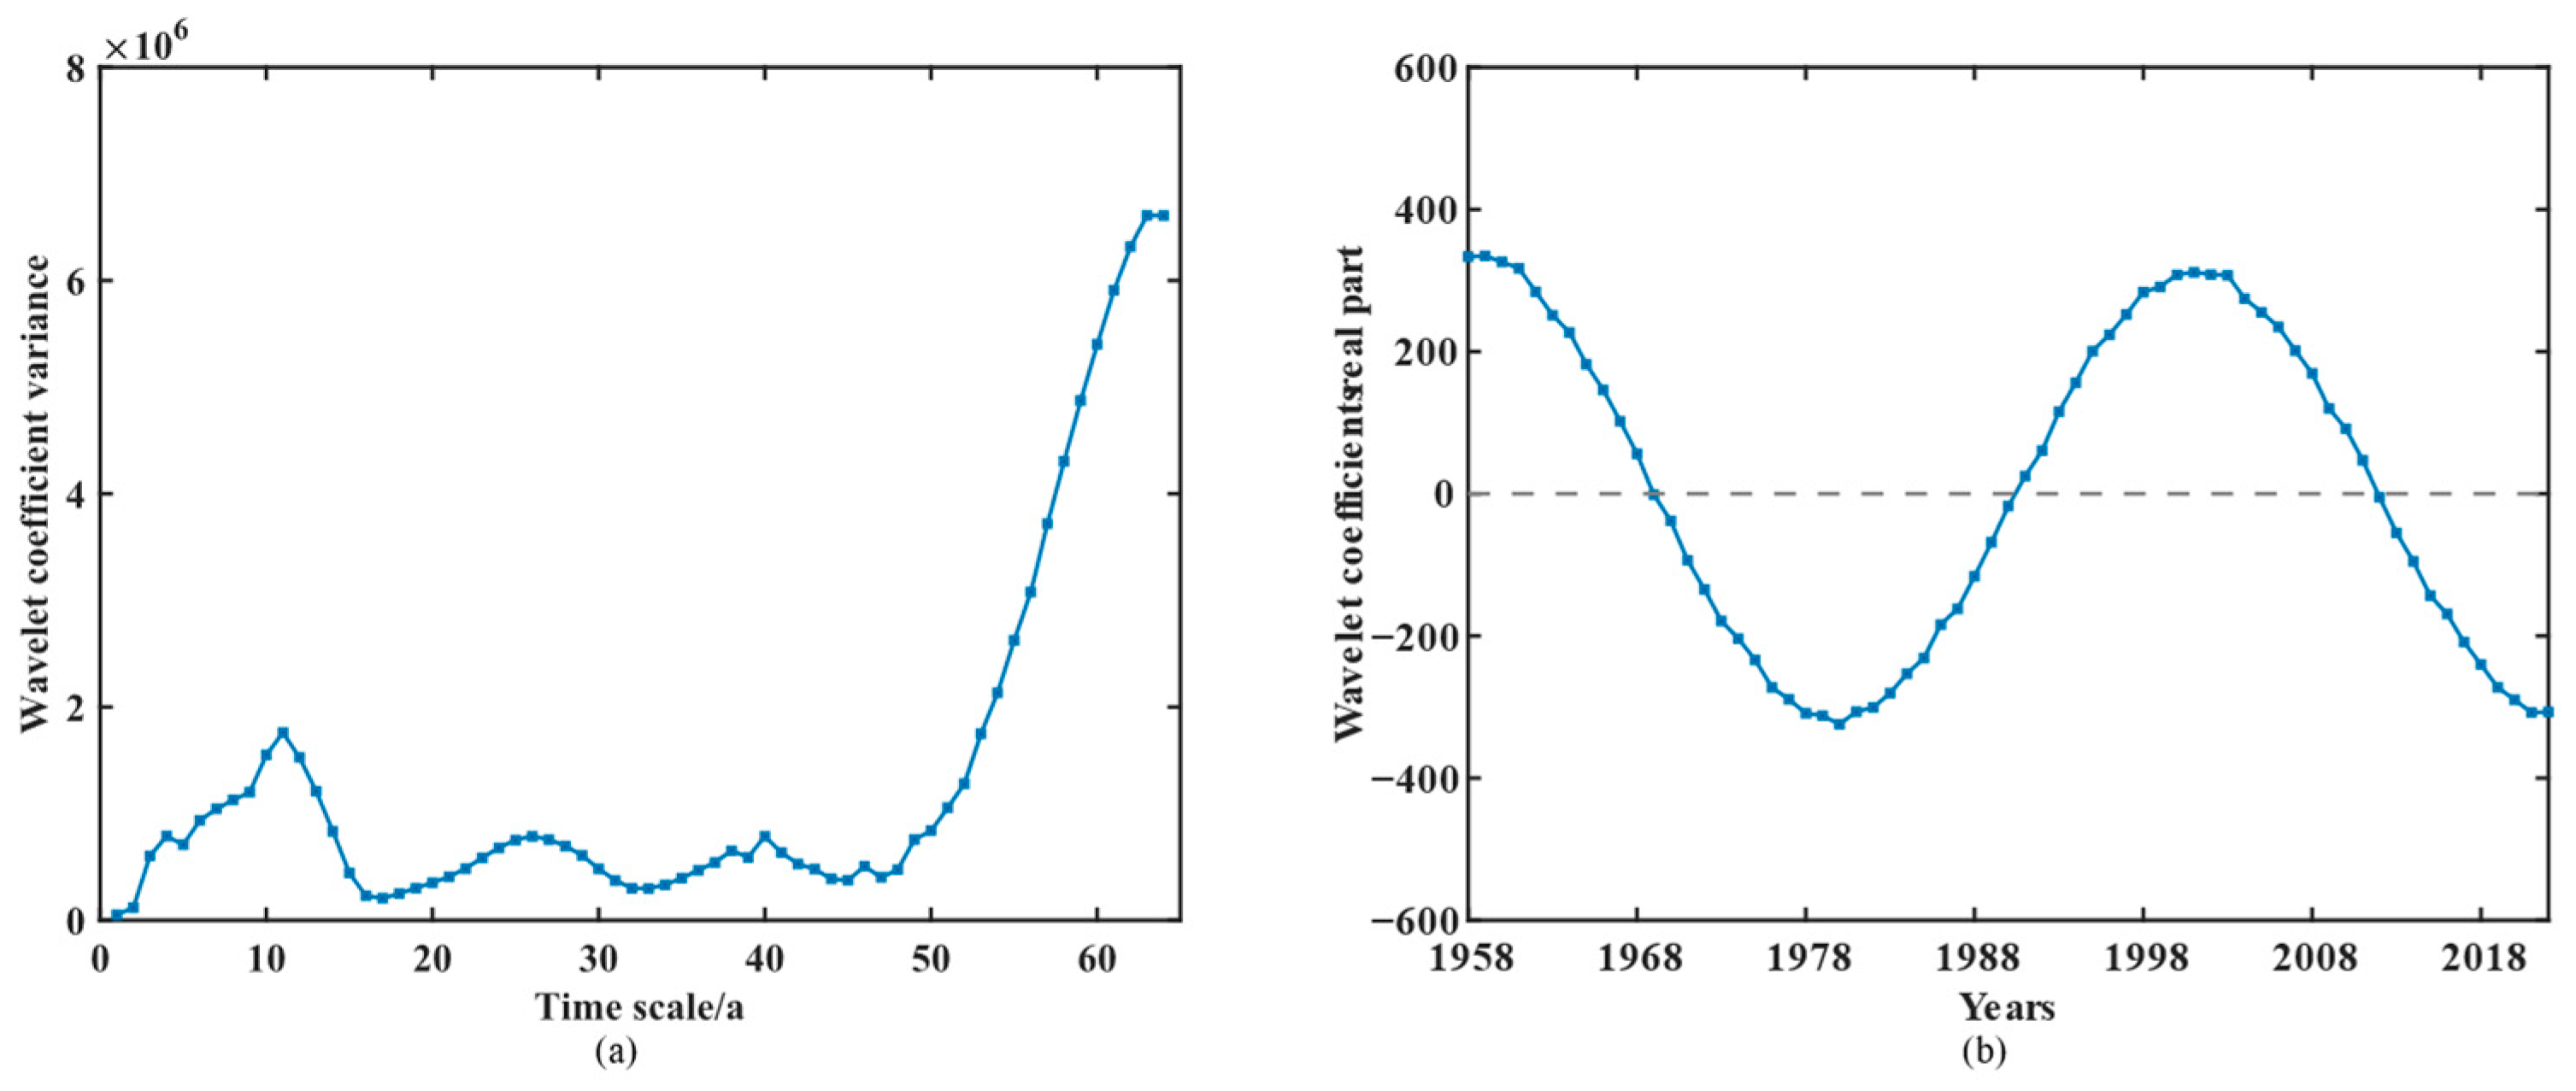
3.2.1. Cycle Analysis of Rainfall

Figure 6a,b display the distribution of wavelet coefficients for the rainfall time series in Shenzhen across different time scales. The time scale is the period of change in the data under study. As shown in Figure 6a, the three-dimensional structure diagram of the wavelet analysis shows the multi-scale evolution characteristics of rainfall from 1958 to 2022, where the x-axis is the time series, the y-axis is the 1–64-year time scale, and the color scale represents the wavelet coefficients (red: wet period; blue: dry period). The results showed significant long-term periodic fluctuations on a scale of 20–45 years, while high-frequency oscillations were observed on a scale of 5–15 years, revealing the dynamic changes in rainfall over time and scale.
Figure 6b shows the contour map of wavelet coefficients, which serves as a plane projection of the three-dimensional structure and reveals the wet–dry alternation characteristics of rainfall. An analysis shows that there are three complete wet–dry alternation cycles on a scale of 20–45 years, with an average cycle of about 22 years; on a scale of 5–15 years, there are seven alternating cycles, with an average cycle of about 9 years. These periodic fluctuations have reproducibility, but there are significant differences in their amplitude and duration.
Figure 7a shows the wavelet coefficient variance map for the rainfall time series in Shenzhen. There are three variance peaks, corresponding to periods of 6 years, 11 years, and 31 years. Among them, the 31-year period corresponds to the highest variance coefficient, indicating the maximum fluctuation energy at this time scale, and suggesting that the main time scale for rainfall in Shenzhen is 31 years, i.e., the first principal cycle. Figure 7b shows the trend of the main cycle of the real part of the wavelet coefficients corresponding to the 31-year time scale. As can be seen, a complete wet–dry cycle of annual rainfall in Shenzhen on a 31-year time scale is about 20 years.

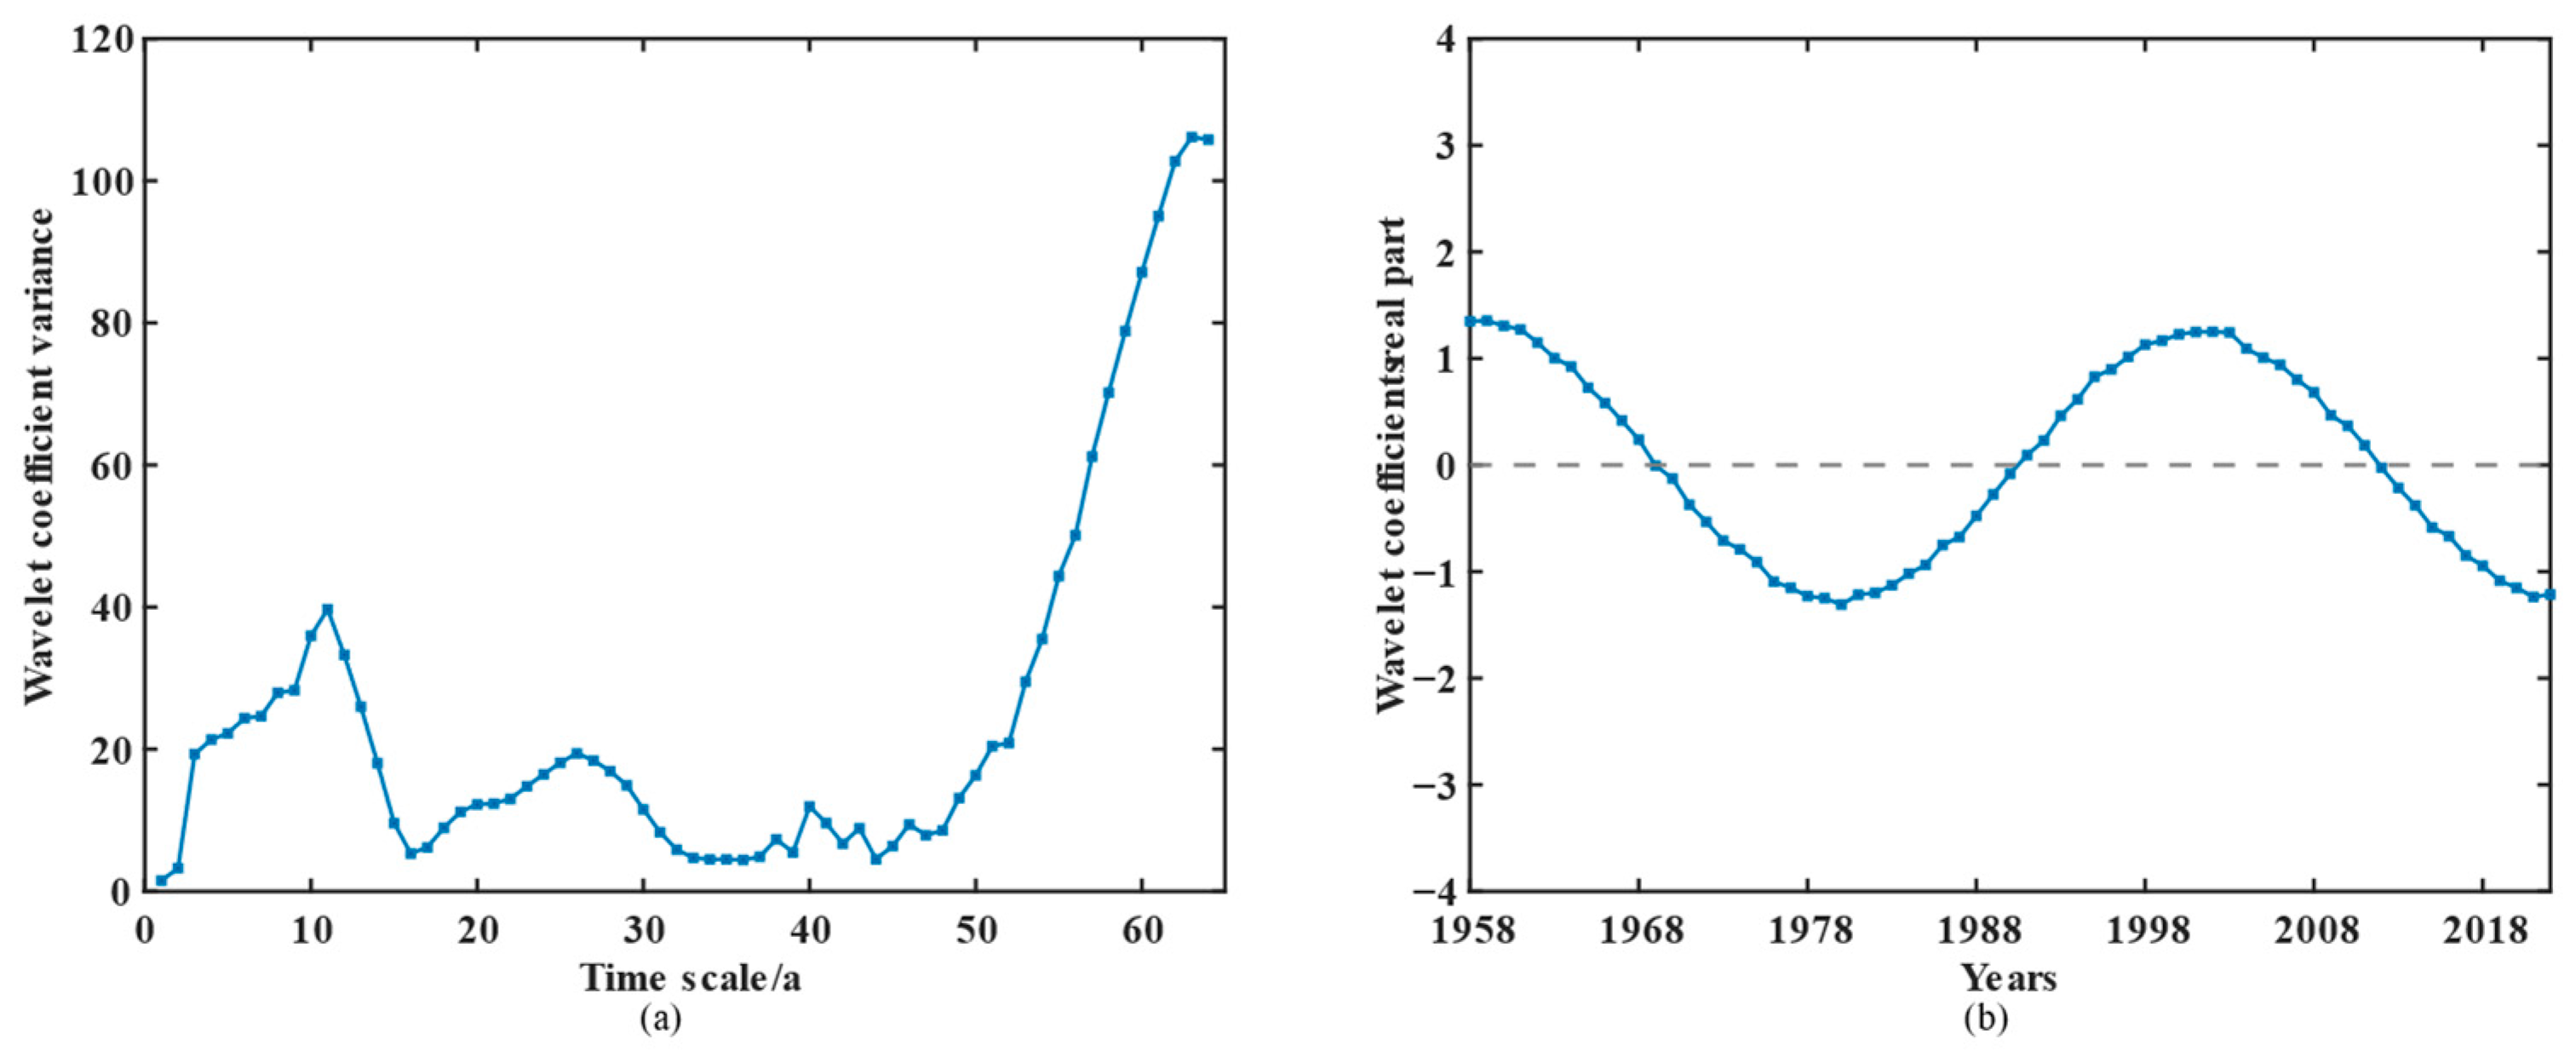
3.2.2. Cycle Analysis of Extreme Rainfall

Figure 8a,b show the distribution of wavelet coefficients of the extreme rainfall time series in the Shenzhen area on different time scales. Figure 8a shows the three-dimensional distribution of wavelet coefficients for extreme rainfall in Shenzhen from 1958 to 2020, where the x-axis is the time series and the y-axis is the 1–64-year time scale. The color scale represents the wavelet coefficients (red: wet period; blue: dry period). Analysis shows that extreme rainfall exhibits multi-scale fluctuation characteristics: it shows low-frequency oscillations throughout the entire time domain on a 50–64-year scale, reflecting long-term trends; on a 3–15-year scale, high-frequency fluctuations were observed between 1990 and 2020, exhibiting clear cyclical characteristics.
As shown in Figure 8b, there is a complete cycle of wet–dry alternation on a scale of 50–64 years, approximately 44 years; on a scale of 5–15 years, the wet–dry alternation cycle is most intense from the early 20th century to the 2020s, with five complete wet–dry alternation cycles and an average cycle of about 6 years. These cycle changes are relatively stable.
Figure 9a shows the wavelet coefficient variance map for the extreme rainfall time series in Shenzhen, with two peaks, corresponding to 63 years and 11 years, respectively. Among them, the peak corresponding to 63 years is the highest, with the largest variance coefficient, indicating that this time scale has the highest fluctuation energy, representing the first principal cycle of annual extreme rainfall in Shenzhen; the 11-year period follows as the second principal cycle. The main cyclic trends in the real part of the wavelet coefficients corresponding to the 63-year time scale are shown in Figure 9b, from which it is clear that the complete primary decrease–increase cycle is about 44 years.

3.2.3. Cycle Analysis of Extreme Rainfall Frequency

Figure 10a,b show the wavelet coefficient distribution characteristics of extreme rainfall frequency in Shenzhen. The three-dimensional wavelet analysis in Figure 10a shows that the frequency of extreme rainfall exhibits significant multi-scale fluctuations: it shows low-frequency oscillations throughout the entire time domain at the 50–64-year scale, revealing long-term trends; on a 3–15 year scale, high-frequency fluctuations were observed between 2000 and 2020, exhibiting clear cyclical characteristics.
As shown in Figure 10b, the main periods of extreme rainfall frequency are 63 years, 11 years, and 26 years, respectively. Among them, the 63-year scale presents a complete and clear cycle of wet–dry alternation, which is about 44 years; the 11-year time scale presents five complete wet–dry alternation cycles between 2000 and 2020, with an average cycle of 6.6 years; and the 26-year time scale only showed weak fluctuation signals from the early twentieth century to the 1920s.
Figure 11a shows that the wavelet variance plot of extreme rainfall frequency in Shenzhen presents three peaks, corresponding to 63 years, 11 years, and 26 years cycles, respectively. Among them, the variance of the 63-year cycle is the largest, indicating that its fluctuation energy is the strongest and it is the first main cycle. Figure 11b further illustrates the wet–dry alternation cycle on a 63-year time scale, which is approximately 44 years.

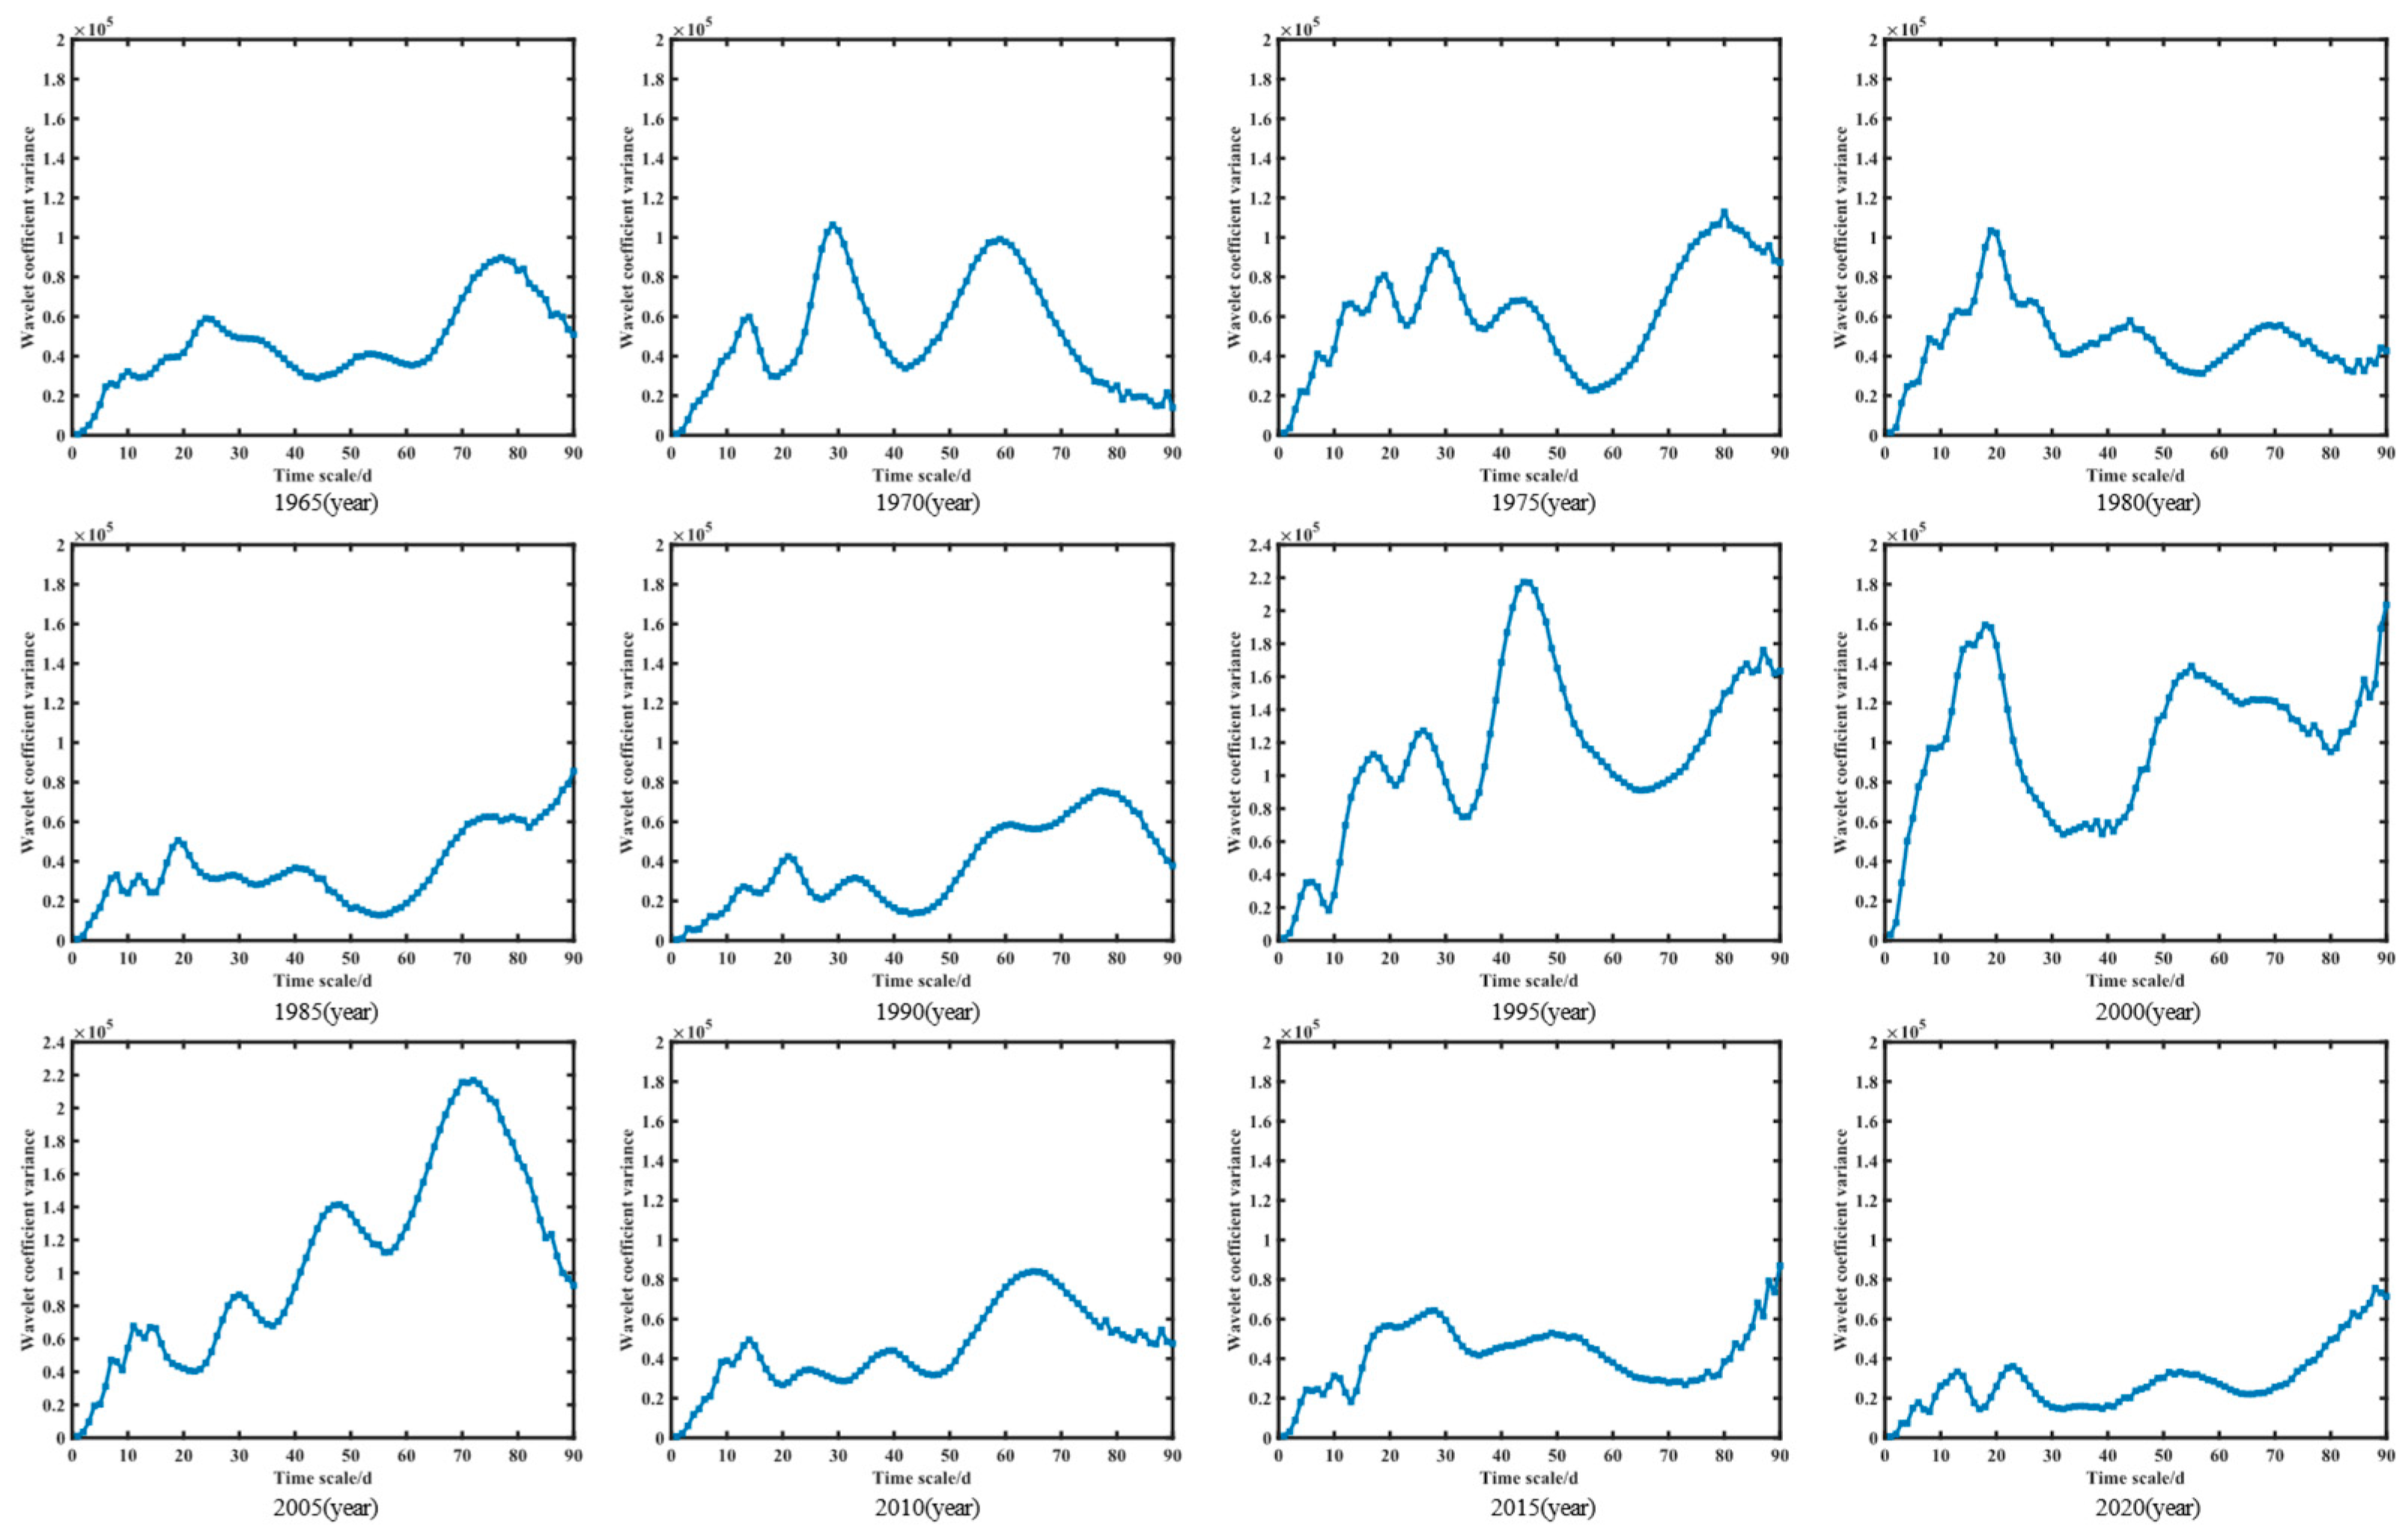
3.3. Characteristics of Main Cycle Evolution in Shenzhen Based on Daily Rainfall Wavelet Variance

This part selects the daily rainfall data of every five years from the beginning of 1965 to the end of 2020 from the period of 1958–2022, and carries out wavelet coefficient ANOVA on the daily rainfall data of the selected years to determine the length of the main cycle of these years, and then analyzes the law of change in the main cycle of rainfall in different years, as shown in Figure 12.
From the figure, it can be observed that there are about 3–5 distinct peaks in each year, and the time scale corresponding to the peaks is the main cycle of the daily rainfall data for that year, with the highest peak corresponding to the first main cycle, the second highest peak corresponding to the second main cycle, and so on. It can be seen that the first main cycle in 1965, 1975, 1990, 2005, and 2010 is on a longer time scale (70–80 days) and the rest of the years are on a shorter time scale (10–30 days). According to the study by Gan Beibei et al. [57] on the dry–wet evolution characteristics of the Minjiang River Basin, ENSO has a significant impact on the dry–wet alternation in the Minjiang River Basin. From this, we infer that there is also a certain relationship between the wet–dry alternation characteristics in Shenzhen and ENSO events. However, this conclusion still needs to be analyzed and validated in the future.
According to the information of the first main cycle of the selected year, the alternating cycle of daily rainfall dry and wet in Shenzhen under the first main cycle was further analyzed. As shown in Figure 13, the figure is a real-part analysis of the wavelet coefficient of the first main period of each year, and the positive and negative values of the graph reveal the bias of rainfall, with positive values indicating that rainfall is higher than the average and negative values indicating that the rainfall is lower than the average, to obtain the alternating dry and wet cycles under the first main cycle. It can be seen from the figure that under the first main cycle, the rainfall in 1970, 1980, 1985, 2015, and 2020 had a short period of dry and wet alternation, indicating that the rainfall fluctuation in these years was more frequent. The large and volatile rainfall in 1970, 1980, 1995, and 2005 indicates significant changes in rainfall intensity during these years. Combined with the frequency and amplitude of fluctuations, it can be seen that short-term heavy rainfall events occurred frequently in 1970 and 1980. From 2010 to 2020, it can be seen that the recent annual rainfall has changed towards shorter rainfall, which is consistent with the characteristics of short-term heavy rainfall due to global warming.
Figure 14a,b, the x-axis in Figure 14a,b represents the selected year, the y-axis in (a) represents the first main cycle of the selected year, and the y-axis in (b) represents the cycle of a complete wet–dry alternation process under the first main cycle of the selected year. Therefore, (a) and (b) represent the time series diagrams of the first main period and corresponding wet–dry alternation period of the selected 12-year daily rainfall data, respectively. As can be seen in Figure 14a, the duration of the first main cycle exhibits periodic fluctuations and has shown a downward trend in recent years, indicating that the duration of the precipitation cycles has become shorter, which may mean an increase in the frequency of precipitation events in the region. This change is related to the pattern of climate change associated with global warming. Compared to this, the dry–wet alternation cycle Figure 14b shows a consistent trend. In recent years, both cycles have shown a downward trend, indicating an increase in the frequency of short-term heavy rainfall events, which is consistent with the IPCC [58] report that global warming has led to an increase in the frequency of extreme precipitation events.
In summary, the changes in the two cycles indicate that the precipitation dynamics in Shenzhen are changing, and the frequency of extreme precipitation events may be increasing, with shorter intervals between the wet and dry periods. This trend may be related to global climate change and local environmental factors, and further research and monitoring are needed.

3.4. Projections of Future Trends in Extreme Rainfall Events

Analyzing extreme rainfall events helps to gain a deeper understanding of climate change patterns, particularly in predicting future climate change trends. This study uses the Hurst index analysis method to predict the future trend of extreme rainfall events in Shenzhen, focusing on two indicators: extreme rainfall and extreme rainfall frequency, to infer the possible future changes in extreme rainfall events in the Shenzhen region. The results of the analysis are shown in Figure 15a,b. The x-axis represents the logarithm of the year, and the y-axis represents the standardized logarithm of extreme rainfall and extreme rainfall frequency, respectively. This graph is used to illustrate the persistent trends of extreme rainfall and extreme rainfall frequency.
According to Figure 15a,b, the H values for extreme rainfall and extreme rainfall frequency in the Shenzhen area are 0.666 and 0.631, respectively. The continuity of the time series is determined by the H values. As can be seen in the figure, the H values for both extreme rainfall and extreme rainfall frequency are between 0.5 and 1, indicating that the trends of these two evaluation indicators are positively persistent (future trends are likely to follow the same pattern as in the past). However, the H values of both indicators are only slightly above 0.5, so this positive persistence is weak. This suggests that there are potential uncertainties in both the amount and frequency of extreme rainfall in Shenzhen in the future and that it is not possible to indicate with certainty the relationship between future trends in extreme rainfall and the past.

4. Discussion

Against the backdrop of global climate change, people’s attention to extreme rainfall events continues to increase. By studying the daily rainfall data of Shenzhen from 1958 to 2022, it was found that the annual extreme rainfall and annual extreme rainfall frequency showed a slow downward trend. This result is consistent with the analysis by Miao Zhengwei et al. [1] on the R99p (extreme rainfall exceeding the 99% percentile) and RX1day (extreme rainfall intensity) indicators in the Beijing–Tianjin–Hebei region. In addition, Xu Xiaoming et al. [59] found that the extreme rainfall index R99p in Shenzhen did not show a significant downward trend from 1961 to 2019, and had large interannual fluctuations. This study further confirms the accuracy of the conclusions drawn in this study regarding the characteristics of extreme rainfall changes in Shenzhen.
In addition, when using the rainfall at the 99th percentile as the threshold for extreme rainfall, this study found that the maximum annual extreme rainfall occurred in 1964, followed by 2008. This is because 1964 was a continuous wet period following the dry period of 1963, and the rainfall was abnormally high that year; the typical rainfall in 2008 was abnormal, and the most typical event was the “6.13” rainstorm in 2008. During the whole rainstorm process, the strong East Asia blocking high pressure and the deep Ural long wave trough enabled cold air to continuously move southward and invade the coast of South China. The strong low-level torrents and active southwest monsoon provided good water vapor and capacity conditions, resulting in serious floods [60].
The results of the mutation analysis (Figure 4b and Figure 5b) show that the UF statistics of the annual extreme rainfall and extreme rainfall frequency in Shenzhen from 1970 to 2022 are both negative, indicating a downward trend in extreme rainfall events during this period. However, multiple intersections of the UF and UB curves within the confidence interval indicate that this downward trend did not reach statistical significance (p > 0.05). This phenomenon indicates that although there is a decreasing trend in extreme precipitation and frequency, this trend may be affected by random fluctuations in data and has not yet shown clear climate change characteristics. This is consistent with the research findings of Xu Xiaoming et al. [59] on the extreme rainfall index in Shenzhen. Although some extreme precipitation indicators in Shenzhen experienced climate changes from 1961 to 2019, such as maximum 1-day rainfall and maximum 5-day rainfall, most other extreme precipitation indicators, including R99p, did not show significant changes. This result may reflect the complexity of the climate system in Shenzhen and the long-term variation characteristics of precipitation patterns, further indicating the unpredictability and instability of extreme precipitation trends.
The wavelet periodicity analysis shows that the first main period of the annual extreme rainfall and extreme rainfall frequency in Shenzhen is 63 years, and the second main period is 11 years. For the 63-year cycle scale, the trend is more pronounced across the entire time scale, indicating that this cycle has a strong long-term impact on extreme precipitation in Shenzhen. In contrast, the cyclical trend of the 11-year cycle scale became more apparent after the 1990s, indicating that the changes in extreme precipitation during this period may have been influenced by shorter cycle factors, reflecting the patterns of climate change. It is worth noting that the trend of the 11-year cycle is consistent with the research results of Ding Nan et al. [26] on rainfall data in Shenzhen from 1961 to 2011, which to some extent verifies the reliability of the results of this study. Due to different studies selecting different time scales, no other relevant research on the 63-year cycle scale has been found so far. However, the results of the 11-year cycle are consistent with previous studies. This indicates that this periodic variation is reliable. Future research can further explore the role of the 63-year cycle scale in extreme precipitation changes in Shenzhen, especially in the context of climate change, where long-term changes may exacerbate the frequency and intensity of extreme precipitation events.
By selecting one year every five years to study the periodic variation characteristics of daily rainfall, it was found that since 2010, the wet–dry alternation period of annual rainfall has gradually become shorter. This indicates that there has been a significant change in the annual rainfall pattern in Shenzhen, with an increase in the frequency of short-term rainfall events and a more compact interval between these events. This trend may reflect the profound impact of climate change on rainfall patterns in Shenzhen. Li Deshuai’s research on the South China region indicates that global climate change may cause changes in precipitation patterns by affecting the activity of the Western Pacific Subtropical High [61]. Specifically, the strengthening of the Western Pacific Subtropical High may lead to changes in atmospheric circulation, thereby affecting the precipitation characteristics of the region. In this context, the increase in the frequency of short-term rainfall events in Shenzhen is likely closely related to the thermodynamic changes caused by climate warming, especially the increase in atmospheric water vapor content and the enhancement of local convective activity. The increase in temperature exacerbates atmospheric instability, providing more impetus for the occurrence of heavy precipitation events. Specifically, as the water vapor content increases and the temperature rises, the thermal instability in the air intensifies, leading to more local convective precipitation events. This mechanism can also explain the frequency and intensity of short-term rainfall events in Shenzhen. However, the specific mechanism of this process still requires more objective and quantitative analysis, evaluation, and in-depth research to more accurately reveal how climate warming affects precipitation patterns through these thermodynamic changes.
This study used the Hurst exponent analysis method to predict the trend of future extreme precipitation events. The H values of extreme rainfall and extreme rainfall frequency were 0.666 and 0.631, respectively, both slightly greater than 0.5. This indicates relatively weak positive persistence and suggests that future changes still have significant uncertainty. Therefore, although extreme rainfall events may continue to show a certain trend in the future, their weak persistence leads to poor stability. As a result, future rainfall changes cannot be accurately predicted. Therefore, in the context of climate change, the prediction of extreme rainfall events should be cautious and further analyzed in conjunction with more long-term observational data and more accurate climate models.

5. Conclusions

Based on daily rainfall data from 1958 to 2022, this article studied the trend of precipitation changes in Shenzhen city, and the main conclusions are as follows:
(1) From 1958 to 2022, the annual extreme rainfall and frequency in Shenzhen showed a significant downward trend, with decreasing rates of −2.762 mm/a and −0.013 events/a, respectively.
(2) The M-K test showed that the UF values of extreme rainfall and frequency remained negative from 1970 to 2022, and the intersection points with the UB curve were mostly within the 0.95 confidence interval, confirming that neither of them experienced significant mutations.
(3) The wavelet analysis reveals that extreme rainfall and frequency exhibit a 63-year main cycle on a 1–6-year scale, with a complete wet–dry alternation period of approximately 44 years. The two indicators have consistent characteristics.
(4) The wavelet variance analysis based on typical years shows that rainfall in Shenzhen exhibits significant wet–dry alternation on a 10–30-day scale, revealing the short-term wet–dry alternation characteristics of rainfall within the year.
(5) The Hurst exponent analysis shows that both extreme rainfall (H = 0.666) and frequency (H = 0.631) exhibit weak positive persistence (0.5 < H < 0.7), indicating uncertainty in future trends. This uncertainty stems mainly from the complexity of the time-series data and the impact of external factors (such as climate change and human activities), and therefore, its results need to be used in conjunction with other analyses for a comprehensive judgment.
The above research results not only deepen the understanding of the changes in extreme rainfall in Shenzhen but also provide an important scientific basis for urban flood control and disaster reduction. For example, optimizing urban drainage design standards and improving the flood control level of key facilities such as transportation hubs and underground spaces.

Author Contributions

Methodology, X.W. and J.S.; writing—original draft, X.W.; writing—review and editing, J.S.; supervision, J.S. All authors have read and agreed to the published version of the manuscript.

Funding

This work was not supported by any funding or financial grants.

Institutional Review Board Statement

Not applicable.

Informed Consent Statement

Not applicable.

Data Availability Statement

The data are available upon reasonable request to the authors.

Acknowledgments

This study used data from the National Meteorological Science Data Center and the Geospatial Data Cloud. We would like to thank the relevant institutions for providing the data support.

Conflicts of Interest

The authors declare no conflicts of interest.

References

  1. Miao, Z.; Li, N.; Lu, M.; Xu, L. Change characteristics of extreme precipitation events in Beijing-Tianjin-Hebei region from 1961 to 2017. Water Resour. Hydropower Technol. 2019, 50, 34–44. [Google Scholar]
  2. Cheng, X.; Liu, C.; Li, C.; Yu, Q.; Li, N. Characteristics of flood risk evolution and urban resilience enhancement strategies in changing environments. J. Water Resour. 2022, 53, 757–768+778. [Google Scholar]
  3. Singh, J.; Karmakar, S.; PaiMazumder, D.; Ghosh, S.; Niyogi, D. Urbanization Alters Rainfall Extremes over the Contiguous United States. Environ. Res. Lett. 2020, 15, 074033. [Google Scholar] [CrossRef]
  4. Chaubey, P.K.; Mall, R.K.; Srivastava, P.K. Changes in extremes rainfall events in present and future climate scenarios over the teesta river basin, India. Sustainability 2023, 15, 4668. [Google Scholar] [CrossRef]
  5. Zhang, Z.; Sun, J. Regional Landslide Susceptibility Assessment and Model Adaptability Research. Remote Sens. 2024, 16, 2305. [Google Scholar] [CrossRef]
  6. Sun, J.; Zhou, F. Stability and support analysis of coverage rock-soil aggregate of Longhuguan landslide. Pol. J. Environ. Stud. 2017, 26, 2747–2757. [Google Scholar] [CrossRef]
  7. Sun, J. Permeability of particle soils under soil pressure. Transp. Porous Media 2018, 123, 257–270. [Google Scholar] [CrossRef]
  8. Zheng, Y.; Sun, J. Monitoring Ground Deformation in Beijing and Analysis of Influencing Factors. Int. J. Ground Sediment Water 2025, 21, 1557–1578. [Google Scholar]
  9. Sun, J.; Wang, G. Research on underground water pollution caused by geological fault through radioactive stratum. J. Radioanal. Nucl. Chem. 2013, 297, 27–32. [Google Scholar]
  10. Sun, J. Ground sediment transport model and numerical simulation. Pol. J. Environ. Stud. 2016, 25, 1691–1697. [Google Scholar] [CrossRef]
  11. Sun, J. Survey and research frame for ground sediment. Environ. Sci. Pollut. Res. 2016, 23, 18960–18965. [Google Scholar] [CrossRef] [PubMed]
  12. Yumei, X. Analysis of spatial and temporal distribution of extreme rainfall in Hebei Province and accuracy test of prediction model. Water Resour. Dev. Manag. 2023, 9, 65–72. [Google Scholar]
  13. Mishra, V.; Ganguly, A.R.; Nijssen, B.; Lettenmaier, D.P. Changes in observed climate extremes in global urban areas. Environ. Res. Lett. 2015, 10, 024005. [Google Scholar] [CrossRef]
  14. Wang, W.; Liu, Y.; Zhao, Q.; Qin, Y.; Meng, X.; Zhang, M.; Jin, Z. Characteristics of spatial and temporal variability of extreme precipitation and its response to temperature changes in Xinjiang. J. Agric. Eng. 2022, 38, 133–142. [Google Scholar]
  15. Wang, L.; Huang, H.; Cui, S.; Fang, X. Spatial and temporal dynamics of the “7.20” flood disaster in Henan Province. Disaster Sci. 2022, 37, 205–211. [Google Scholar]
  16. Narimani, R.; Jun, C.; Saedi, A.; Bateni, S.M.; Oh, J. A multivariate decomposition–ensemble model for estimating long-term rainfall dynamics. Clim. Dyn. 2023, 61, 1625–1641. [Google Scholar] [CrossRef]
  17. Zhang, C.; Wang, G.; Li, T. Countermeasures and suggestions for urban storm water disaster defense in changing environments. Proc. Chin. Acad. Sci. 2022, 37, 1126–1131. [Google Scholar]
  18. Ummenhofer, C.C.; Meehl, G.A. Extreme weather and climate events with ecological relevance: A review. Philos. Trans. R. Soc. B Biol. Sci. 2017, 372, 20160135. [Google Scholar] [CrossRef]
  19. Liang, Y.; Liao, W.; Wang, h. Efficient Urban Flooding Management: A Multi-Physical-Process-Oriented Flood Modelling and Analysis Method. Sustainability 2025, 17, 1124. [Google Scholar] [CrossRef]
  20. Shenzhen Municipal Bureau of Statistics; Survey Team of Shenzhen, National Bureau of Statistics. 2023 Statistical Bulletin of Shenzhen’s National Economic and Social Development. Shenzhen Special Zone Daily, 28 April 2024.
  21. Zhao, Y.; Xu, Z.; Tan, Q.; Liu, J.; Chen, H. Analysis of spatial and temporal evolution patterns of precipitation characteristics in Shenzhen. J. Beijing Norm. Univ. (Nat. Sci. Ed.) 2019, 55, 564–571. [Google Scholar]
  22. Fowler, H.J.; Lenderink, G.; Prein, A.F.; Westra, S.; Allan, R.P.; Ban, N.; Barbero, R.; Berg, P.; Blenkinsop, S.; Do, H.X.; et al. Anthropogenic intensification of short-duration rainfall extremes. Nat. Rev. Earth Environ. 2021, 2, 107–122. [Google Scholar] [CrossRef]
  23. Fofana, M.; Adounkpe, J.; Larbi, I.; Hounkpe, J.; Koubodana, H.D.; Toure, A.; Bokar, H.; Dotse, S.-Q.; Limantol, A.M. Urban Flash Flood and Extreme Rainfall Events Trend Analysis in Bamako, Mali. Environ. Chall. 2022, 6, 100449. [Google Scholar] [CrossRef]
  24. Zhang, Y.; Pang, X.; Xia, J.; Shao, Q.; Yu, E.; Zhao, T.; She, D.; Sun, J.; Yu, J.; Pan, X.; et al. Regional patterns of extreme precipitation and urban signatures in metropolitan areas. J. Geophys. Res. Atmos. 2019, 124, 641–663. [Google Scholar] [CrossRef]
  25. Lin, K.; He, Y.; Lei, X.; Cheng, H.; Mei, X. Analysis of spatial and temporal variations of rainfall in Shenzhen from 1960 to 2009. China Rural Water Conserv. Hydropower 2013, 15, 18–23. [Google Scholar]
  26. Ding, N.; Yu, F.; Liu, J.; Wang, T.; Hua, P.; Gao, Y. Trend analysis of precipitation changes in Shenzhen from 1961 to 2011. J. Water Resour. Water Eng. 2017, 28, 61–64. [Google Scholar]
  27. Huang, G.; Xian, Z. Analysis of changes in extreme weather events in Shenzhen from 1953 to 2012. J. Water Resour. Water Eng. 2014, 25, 8–13. [Google Scholar]
  28. Wang, J.; Shi, H. Characterization of spatial and temporal evolution of extreme precipitation in Shenzhen. J. North China Univ. Water Resour. Hydropower (Nat. Sci. Ed.) 2023, 19, 1–14. [Google Scholar]
  29. Che, R.; Lin, S.; Fan, Z.; Li, W.; Zeng, F.; Mao, B.; Shi, L.; Huang, Z. Analysis of the impact of continuous extreme rainfall on water quality in the Dongjiang River Basin. Environ. Sci. 2019, 40, 4440–4449. (In Chinese) [Google Scholar]
  30. Zhao, X.; Li, W.; Wang, W.; Han, L.; Zhou, W. Evolution of air quality and its regulation in typical cities in China—A case study of Shenzhen City from 2000 to 2017. J. Ecol. 2020, 40, 5894–5903. [Google Scholar]
  31. Zhang, J.; Qin, H.; Zhai, Y. Dynamic change law of evaporation strength of permeable paving and analysis of influencing factors. J. Peking Univ. (Nat. Sci. Ed.) 2019, 55, 934–940. [Google Scholar]
  32. Xie, S.; Xie, H. Changing roles of urban river landscape in the context of high-quality development—An example of upgrading river landscape planning in Dameisha, Shenzhen. In Proceedings of the Spatial Governance for High Quality Development—Proceedings of the Annual Conference on Urban Planning in China 2020 (12 Landscape and Environmental Planning), Chengdu, China, 25 September 2021; Volume 6, pp. 483–496. [Google Scholar]
  33. Huang, S.; Wang, H.; Liu, G.; Huang, J.; Zhu, J. System comprehensive risk assessment of urban rainstorm–induced flood-water pollution disasters. Environ. Sci. Pollut. Res. 2023, 30, 59826–59843. [Google Scholar] [CrossRef] [PubMed]
  34. Shi, H.; Chen, J.; Li, T.; Wang, G. A new method for estimation of spatially distributed rainfall through merging satellite observations, raingauge records, and terrain digital elevation model data. J. Hydro-Environ. Res. 2020, 28, 1–14. [Google Scholar] [CrossRef]
  35. Li, Z.; Gong, Y.; Xiang, N. Characteristics of 60-year changes in diurnal rainfall days at different levels over the Tibetan Plateau and Southwest China. Clim. Environ. Res. 2023, 28, 367–384. [Google Scholar]
  36. Yin, C.; Wang, J.; Yu, X.; Li, Y.; Yan, D.; Jian, S. Definition of extreme rainfall events and design of rainfall based on the copula function. Water Resour. Manag. 2022, 36, 3759–3778. [Google Scholar] [CrossRef]
  37. Chi, X.; Yin, Z.; Wang, X.; Sun, Y. A comparative study of methods for determining extreme precipitation thresholds in China. Disaster Sci. 2015, 30, 186–190. [Google Scholar]
  38. Chen, C.; Li, T.; Feng, J.; Li, L.; Xing, L.; Huang, G. Trend analysis of the evolution of extreme rainfall events in Haikou City. J. Water Resour. Water Eng. 2016, 27, 6–10+17. [Google Scholar]
  39. Zhang, C.; Sun, J. Analysis of temporal evolution characteristics of precipitation in Beijing. Int. J. Ground Sediment Water 2023, 30, 1141–1157. [Google Scholar]
  40. Ye, M.; Zhang, P.; Wang, W. Trend analysis of runoff from three sources in the upper Tarim River Basin. J. Water Resour. Water Eng. 2010, 21, 10–14. [Google Scholar]
  41. Zhang, Y.; Duan, Y.; Guo, C.; Peng, G. Morlet wavelet analysis of precipitation in Henan Province from 1951 to 2012. People’s Yellow River 2015, 37, 25–28. [Google Scholar]
  42. Sa’adi, Z.; Shahid, S.; Ismail, T.; Chung, E.-S.; Wang, X.-J. Trends analysis of rainfall and rainfall extremes in Sarawak, Malaysia using modified Mann–Kendall test. Meteorol. Atmos. Phys. 2019, 131, 263–277. [Google Scholar] [CrossRef]
  43. Ugwu, E.B.I.; Ugbor, D.O.; Agbo, J.U.; Alfa, A. Analyzing Rainfall Trend and Drought Occurrences in Sudan Savanna of Nigeria. Sci. Afr. 2023, 20, e01670. [Google Scholar]
  44. Jin, J.; Wang, G.; Zhang, J.; Yang, Q.; Liu, C.; Liu, Y.; Bao, Z.; He, R. Impacts of Climate Change on Hydrology in the Yellow River Source Region, China. J. Water Clim. Change 2020, 11, 916–930. [Google Scholar] [CrossRef]
  45. Sharma, S.; Swayne, D.A.; Obimbo, C. Trend analysis and change point techniques: A survey. Energy Ecol. Environ. 2016, 1, 123–130. [Google Scholar] [CrossRef]
  46. Yimer, S.M.; Kumar, N.; Bouanani, A.; Tischbein, B.; Borgemeister, C. Homogenization of daily time series climatological data in the Eastern Nile basin, Ethiopia. Theor. Appl. Climatol. 2021, 143, 737–760. [Google Scholar] [CrossRef]
  47. Du, Y.; Hou, J.; Chai, J.; Bai, G.; Li, X.; Zhang, H.; Zhang, Z.; Chen, G.; Li, B. Characterization of temporal evolution of extreme rainfall in Xi’an. Environ. Eng. 2022, 40, 41–46. [Google Scholar]
  48. Zhong, X.; Li, J.; Wang, J.; Zhang, J.; Liu, L.; Ma, J. Linear and Nonlinear Characteristics of Long-Term NDVI Using Trend Analysis: A Case Study of Lancang-Mekong River Basin. Remote Sens. 2022, 14, 6271. [Google Scholar] [CrossRef]
  49. Nie, X.; Hu, Z.; Zhu, Q.; Ruan, M. Research on Temporal and Spatial Resolution and the Driving Forces of Ecological Environment Quality in Coal Mining Areas Considering Topographic Correction. Remote Sens. 2021, 13, 2815. [Google Scholar] [CrossRef]
  50. Lu, X.; Lu, B.; Dang, S. Characterization of precipitation and trend prediction in Hangzhou in the last 63 years. Hydropower 2015, 41, 17–20. [Google Scholar]
  51. Mandelbrot, B.B.; Wallis, J.R. Robustness of the rescaled range R/S in the measurement of noncyclic long run statistical dependence. Water Resour. Res. 1969, 5, 967–988. [Google Scholar] [CrossRef]
  52. Gong, C.; Dong, X.; Dong, L.; Wu, H.; Ouyang, X. Characterization of precipitation and its future trend in REOF sub-district of Yalong River Basin. Soil Water Conserv. Res. 2022, 29, 78–87. [Google Scholar]
  53. Wang, W.; Yan, J.; Liu, Y. Changing characteristics of extreme precipitation events in Guangdong Province. Soil Water Conserv. Bull. 2016, 36, 293–299. [Google Scholar]
  54. Hu, Q.; Ma, X.; Hu, L.; Wang, Y.; Xu, L.; Pan, X. Application of Matlab in teaching meteorology majors M-K test mutation analysis of meteorological elements. Lab. Res. Explor. 2019, 38, 48–51+107. [Google Scholar]
  55. Gong, D.; Wang, S. ENSO events and their intensities in the past century. Chin. Sci. Bull. 1999, 3, 315–320. [Google Scholar]
  56. Li, H.; Wang, H. The major meteorological disaster events affecting Shenzhen in 2008. Shenzhen Business Daily, 17 February 2009; A08. [Google Scholar]
  57. Gan, B.; Liu, M. Dry-wet evolution characteristics and response to ENSO events in the Minjiang River basin from 1962 to 2021. South--North Water Transf. Water Sci. Technol. 2024, 22, 545–556. [Google Scholar]
  58. IPCC. Climate change 2021: The physical science basis. In Contribution of Working Group I to the Sixth Assessment Report of the Intergovernmental Panel on Climate Change; Cambridge University Press: Cambridge, UK, 2021. [Google Scholar]
  59. Xu, X.; Zhang, X. Extreme precipitation changes in Shenzhen from 1961 to 2019. J. Nat. Disasters 2021, 30, 43–51. [Google Scholar]
  60. Wang, H.; Liu, W.; Liu, P.; Pan, W. The great floods in Shenzhen in 2008. J. Meteorol. Sci. 2010, 30, 256–261. [Google Scholar]
  61. Li, D. Research on the Spatiotemporal Characteristics of Hourly Precipitation over South China During the Warm Season and Its Possible Causes; Lanzhou University: Lanzhou, China, 2016. [Google Scholar]
Figure 1. Comparison of annual rainfall between Shenzhen and Guangdong Provinces.
Sustainability 17 03512 g001
Figure 2. Scenes of flooding in Shenzhen (source: microblogging Shenzhen traffic police, https://weibo.com/1792702427/Jn2Lpp1dH (accessed on 30 September 2024) and https://weibo.com/1792702427/M3Ab7ph4Z (accessed on 30 September 2024)).
Sustainability 17 03512 g002
Figure 3. Geographic location map of Shenzhen.
Sustainability 17 03512 g003
Figure 4. Interannual variation and trend analysis of extreme rainfall in Shenzhen: (a) interannual variation curve of extreme rainfall in Shenzhen and (b) Mann–Kendall mutation test of extreme rainfall in Shenzhen.
Sustainability 17 03512 g004
Figure 5. Interannual variation and trend analysis of the frequency of extreme rainfall in Shenzhen: (a) interannual variation curve of frequency of extreme rainfall in Shenzhen and (b) Mann–Kendall mutation test of frequency of extreme rainfall in Shenzhen.
Sustainability 17 03512 g005
Figure 6. Real part of wavelet coefficients for rainfall time series in Shenzhen City: (a) three-dimensional representation and (b) wavelet power spectrum.
Sustainability 17 03512 g006
Figure 7. (a) Wavelet coefficient variance of rainfall time series in Shenzhen and (b) corresponding wavelet coefficients for cycle 31 years.
Sustainability 17 03512 g007
Figure 8. Real part of wavelet coefficients for extreme rainfall time series in Shenzhen City: (a) three-dimensional representation and (b) wavelet power spectrum.
Sustainability 17 03512 g008
Figure 9. (a) Wavelet coefficient variance of extreme rainfall time series in Shenzhen and (b) corresponding wavelet coefficients for cycle 63 years.
Sustainability 17 03512 g009
Figure 10. The real part of wavelet coefficients for extreme rainfall frequency time series in Shenzhen City: (a) three-dimensional representation and (b) wavelet power spectrum.
Sustainability 17 03512 g010
Figure 11. (a) Wavelet coefficient variance of the time series of extreme rainfall frequency in Shenzhen and (b) corresponding wavelet coefficients for cycle 63 years.
Sustainability 17 03512 g011
Figure 12. Time-scale variance characteristics of daily rainfall data in Shenzhen in typical years.
Sustainability 17 03512 g012
Figure 13. Wavelet coefficients corresponding to the first main cycle of each year.
Sustainability 17 03512 g013
Figure 14. Temporal variation in the first main cycle (a) and alternating wet–dry cycles (b) in Shenzhen’s daily rainfall.
Sustainability 17 03512 g014
Figure 15. The prediction of changing trends in extreme precipitation amounts (a) and extreme precipitation frequency (b).
Sustainability 17 03512 g015
Disclaimer/Publisher’s Note: The statements, opinions and data contained in all publications are solely those of the individual author(s) and contributor(s) and not of MDPI and/or the editor(s). MDPI and/or the editor(s) disclaim responsibility for any injury to people or property resulting from any ideas, methods, instructions or products referred to in the content.

