Abstract
Modular green wall, or living wall (LW) system, has evolved worldwide over the past decades as a popular green building feature and a nature-based solution. Differential climatic conditions across the globe make the standardisation of practices inapplicable to local scenarios. LW projects with differing goals and preferences like aesthetic (such as plant healthiness), water-saving, and minimal plant growth require optimal combinations of plant species to achieve single or multiple goals. This exploratory study aimed to deploy empirical field LW data to optimise analytical models to support plant species selection and LW design. Plant growth performance and water demand data of 29 commonly used plant species in outdoor modular LW systems without irrigation were collected in subtropical Hong Kong for 3 weeks. The 29 species tested were grouped into five plant forms: herbaceous perennials (16 spp), succulents (2 spp), ferns (2 spp), shrubs (7 spp), and trees (2 spp). Plant species-specific plant height, LAI, plant health rating, and water absorption amount were recorded every 6 days, together with photo records. Total water demand varied widely among plant species, ranging from 52.5 to 342.5 mL in 3 weeks (equivalent to 2.5 to 16.3 mL per day). The random forest algorithm proved that the water demand of the species was a dominant predictor of plant health tendency, among other parameters. Hierarchical clustering grouped plant species with similar water demand and health rating tendencies into four groups. The health rating threshold approach identified the top-performing species that displayed a healthy appearance as a basic prerequisite, coupled with one or two optional objectives: (1) water-saving and (2) slow-growing. The comparison among the plant selection scenarios based on projected LW performance (water demand, plant health, and growth) provided sound evidence for the optimisation of LW design for sustainability. LW projects with multiple objectives inherited a multitude of multi-scalar properties; thus, the simulation of LW performance in this study demonstrated a novel data-driven approach to optimise plant species selection and planting design with minimal resource input.
1. Introduction
Green wall (GW) refers to any vertical surface of a building or ‘wall’ that is covered in vegetation. Attempts to grow vegetation at elevated levels have been known for a long time [1]. Creeping or climbing plants have been adopted worldwide to adorn vertical surfaces such as walls, frames, roofs, or columns and form three-dimensional managed landscapes [2] in both indoor and outdoor built environments as vertical greenery systems (VGS) [1,3].
In recent decades, VGS has become a ubiquitous solution in new and retrofitted buildings as a popular green building element [4,5], necessitating the provision of sufficient green infrastructure to enhance liveability in cities as a nature-based solution. VGS is considered an attempt to mitigate urban heat islands [6]. Researchers found that VGS could help lower the temperature of a VGS-covered façade wall and the building itself [7,8,9,10,11] and subsequently reduce the energy consumption for air conditioning [12,13]. In several studies in Hong Kong, simulation runs have found that an equal area of VGS on multiple-storey buildings could provide a better cooling effect than green roofs [14,15].
Other benefits include noise attenuation of VGS installed close to expressways as a sound barrier [16] and deposition of fine and ultra-fine dust or particulate matter (PM10 and PM2.5), improving the air quality of cities [17,18]. VGSs were found to reduce the concentration of volatile organic carbons (VOC) in indoor environments [17,19]. Studies have found that VGSs provide important habitat, nesting, food, and shelter to birds, pollinators, and other beneficial insects, especially enhancing urban biodiversity [20,21,22,23].
VGS can be broadly categorised into two major groups: (i) green façades (GF) and (ii) living walls (LW) [24]. GF is characterised by the use of climbing plants, which grow or ‘climb’ on the surface or façade of a building vertically. Plants may be rooted on walls, in containers, or from the ground, and some plant species are more suitable to grow on strong frames, wire, mesh, or trellis systems installed on the building façade for easy maintenance. On LWs, plants typically grow in small pots of soil or soilless growing media in modular cells, forming panels, or alternatively, in a dense porous mat- or felt-like substrate. Irrigation systems with water pumps are often needed in LWs.
In addition to the benefits offered by VGS, researchers have also investigated the challenges associated with VGS. Chew and Conejos [25] found that withering of plants and excessive foliage growth were common problems encountered by providers of VGS. It is crucial to pre-establish and acclimatise the plants prior to planting them in the VGS, as they will be subject to potentially stressful climate conditions in the VGS [26,27,28]. Wong et al. [29] studied barriers to more widespread adoption of VGS by building owners and developers and opined that a lack of technical information on VGS maintenance and proper selection of plants to fit local settings are common issues.
In particular, LWs face emerging challenges to find the ‘right’ plant species or even varieties/cultivars optimised for respective climate regimes, minimisation of irrigation need for choosing suitable drought tolerant plants [30], and innovative growing medium to deal with the challenge of hardening and weathering of growing substrate [31]. Confined pots with limited substrate volume for individual plants constrain water availability. Soil compaction, entangled or girdling roots, water stress, depletion of soil nutrients, and soil loss (for LWs deploying loose soil or planting media) may further exacerbate plant health and subsequently lead to wilting and death. Studies have suggested that growth medium properties influence plant water uptake [32,33]. Law et al. [31] surveyed over 100 VGSs in Hong Kong and revealed that plants on indoor soilless LWs performed equally well on indoor LWs using conventional soil, while plants on outdoor soilless LWs performed significantly better than those grown on soil LWs. This clearly shows that the growing medium of LW significantly affects plant performance in subtropical Hong Kong outdoor conditions, given that the variance of adopted plant species diversity is rather small.
The success and long-term sustainability of an LW system will therefore hinge on a multitude of socio-economic and environmental challenges [34,35], e.g., life cycle cost (initial and disposal cost), maintenance cost, biotic complexity involving plant species pairing up with LW hardware (irrigation systems, drainage and waterproofing, structural stability, and material durability) with growing substrate usable for and ideally beyond justifiable payback time [29]. Due to the variability of climatic conditions worldwide, it is challenging to establish a common formula for plant selection on VGS that is applicable globally. Some researchers have pointed out that the lack of a goal in VGS design is a common pitfall, leading to an undetermined strategy [36]. With differing goals and strategies, project proponents with preferences and expectations regarding the cooling effect, visual impact, water demand, and maintenance input should communicate thoroughly with green wall companies. It is recommended that plant experts and soil scientists be involved in the VGS project design phase to fill the knowledge gap [36]. However, individual consultations in every project will substantially increase project costs. The adoption of VGS plant species in Hong Kong is homogeneous and skewed towards a certain cohort of plant species with low diversity and evenness indices [31]. A systematic experiment to test the matching of these widely adopted cohorts of plant species on specific popularly adopted LW systems will help reduce the design and consultation costs.
The concept of a plant community assists in the planting design of self-sustaining managed green spaces or landscapes with multiple objectives [36]. When all selected plant species fulfil a certain specific set of design and environmental requirements (e.g., water demand, nutrient requirements, etc.), the benefits of preset targets can be maximised. Human brains are not well versed in a multitude of reiterative analyses; thus, we have to deploy suitable approaches to perform advanced computation. Mathematical techniques (e.g., classification and clustering of plant species with similar environmental requirements and traits) will optimise the plant selection process.
Currently, a variety of machine learning algorithms and AI tools are available for data analysis, such as the K-nearest neighbour algorithm, Naïve Bayes algorithm, support vector machines (SVM), and neutral networks [37,38]. These tools are widely used in both supervised and unsupervised learning models, data classification, and regression tasks. The random forest algorithm stands out from the pool as it not only performs data classification and regression but also excels in extracting important factors and facilitating hierarchical clustering operations. This unique capability allows the identification of crucial factors from large eco-environmental datasets. The application of random forest and hierarchical clustering algorithms in eco-environmental data analysis is common in current scientific research, particularly when complicated experimental data are being handled and are capable of exploring important factors from multidimensional datasets [38].
No previous research has addressed the interface for deploying empirical plant growth data and the formulation of a plant selection tool to support multiple project objectives for LW. This study demonstrated how selected complex, multidimensional LW project targets could be efficiently evaluated based on scenario simulations to bridge the disparities between academia and industry pragmatically.
This study aimed to do the following:
- Understand plant performance, plant growth, and water demand of commonly used LW plant species under intermittent water supply;
- Explore useful groups of plant species for fulfilling single or multiple LW project objective(s);
- Compare species recommendations based on the health rating threshold approach and hierarchical clustering approach;
- Demonstrate how a data-driven approach can optimise plant species selection and planting design.
2. Materials and Methods
2.1. Research Framework
This study compared two data-driven approaches: (1) health rating threshold approach and (2) random forest and hierarchical clustering approach for LW plant selection groupings with two or three objectives (plant health and aesthetics, water-saving, and slow-growing) under several LW project constraints (e.g., number of species deployed, average/total water consumption). The study consisted of three main stages: data collection and processing, species grouping optimisation, and comparison of scenarios (Figure 1). Data collection consisted of plant species-specific data collected from 29 species grown on soilless media on modular LWs (refer to Section 2.4.1 and Section 2.4.2) and meteorological data (refer to Section 2.4.3). Data processing involved data checking and computation of averages based on data collected from replicates. The optimisation of plant selection (refer to Section 2.5) was performed using a series of data-driven selection approaches and simulations. Plant selection groups were formulated using hierarchical clustering and threshold approaches based on multi-objectives. Simulated figures computed by LW performance functions were used to compare and inform the choice bundles available to support LW design and decision-making.
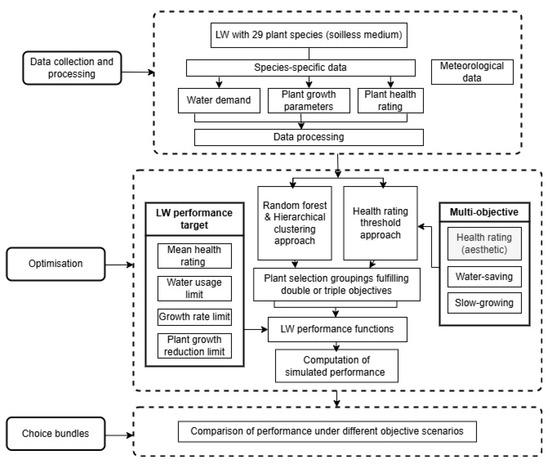
Figure 1.
Data-driven approach deployed in this study for optimising plant species selection and planting design on LW.
2.2. Study Site
Two standalone living walls (LW) with identical panel design were installed in the Technological and Higher Education Institute of Hong Kong (THEi) Chai Wan campus in Hong Kong Special Administrative Region of the People’s Republic of China (Hong Kong, lying between latitude 22°08′ N and 22°35′ N, longitude 113°49′ E and 114°31′ E, with a total land area of 1114.35 m2) [35]. Hong Kong has a subtropical climate with hot and wet summers and mild and dry winters. The monthly mean temperatures in January and February recorded at the Hong Kong Observatory between 1991 and 2020 are 16.5 and 17.1 °C, respectively. Monthly means of rainfall recorded during the same 30-year period are 33.2 and 38.9 mm in January and February, respectively [39]. All monitoring and measurements were carried out in the three-week study period from 24 January to 14 February 2022. While this study did not account for the seasonal hot summer regime in a subtropical climate, this temperature range is relevant to indoor living walls in temperate regions, thus increasing the research’s significance.
2.3. Experimental Setup
2.3.1. Living Wall (LW) Panels
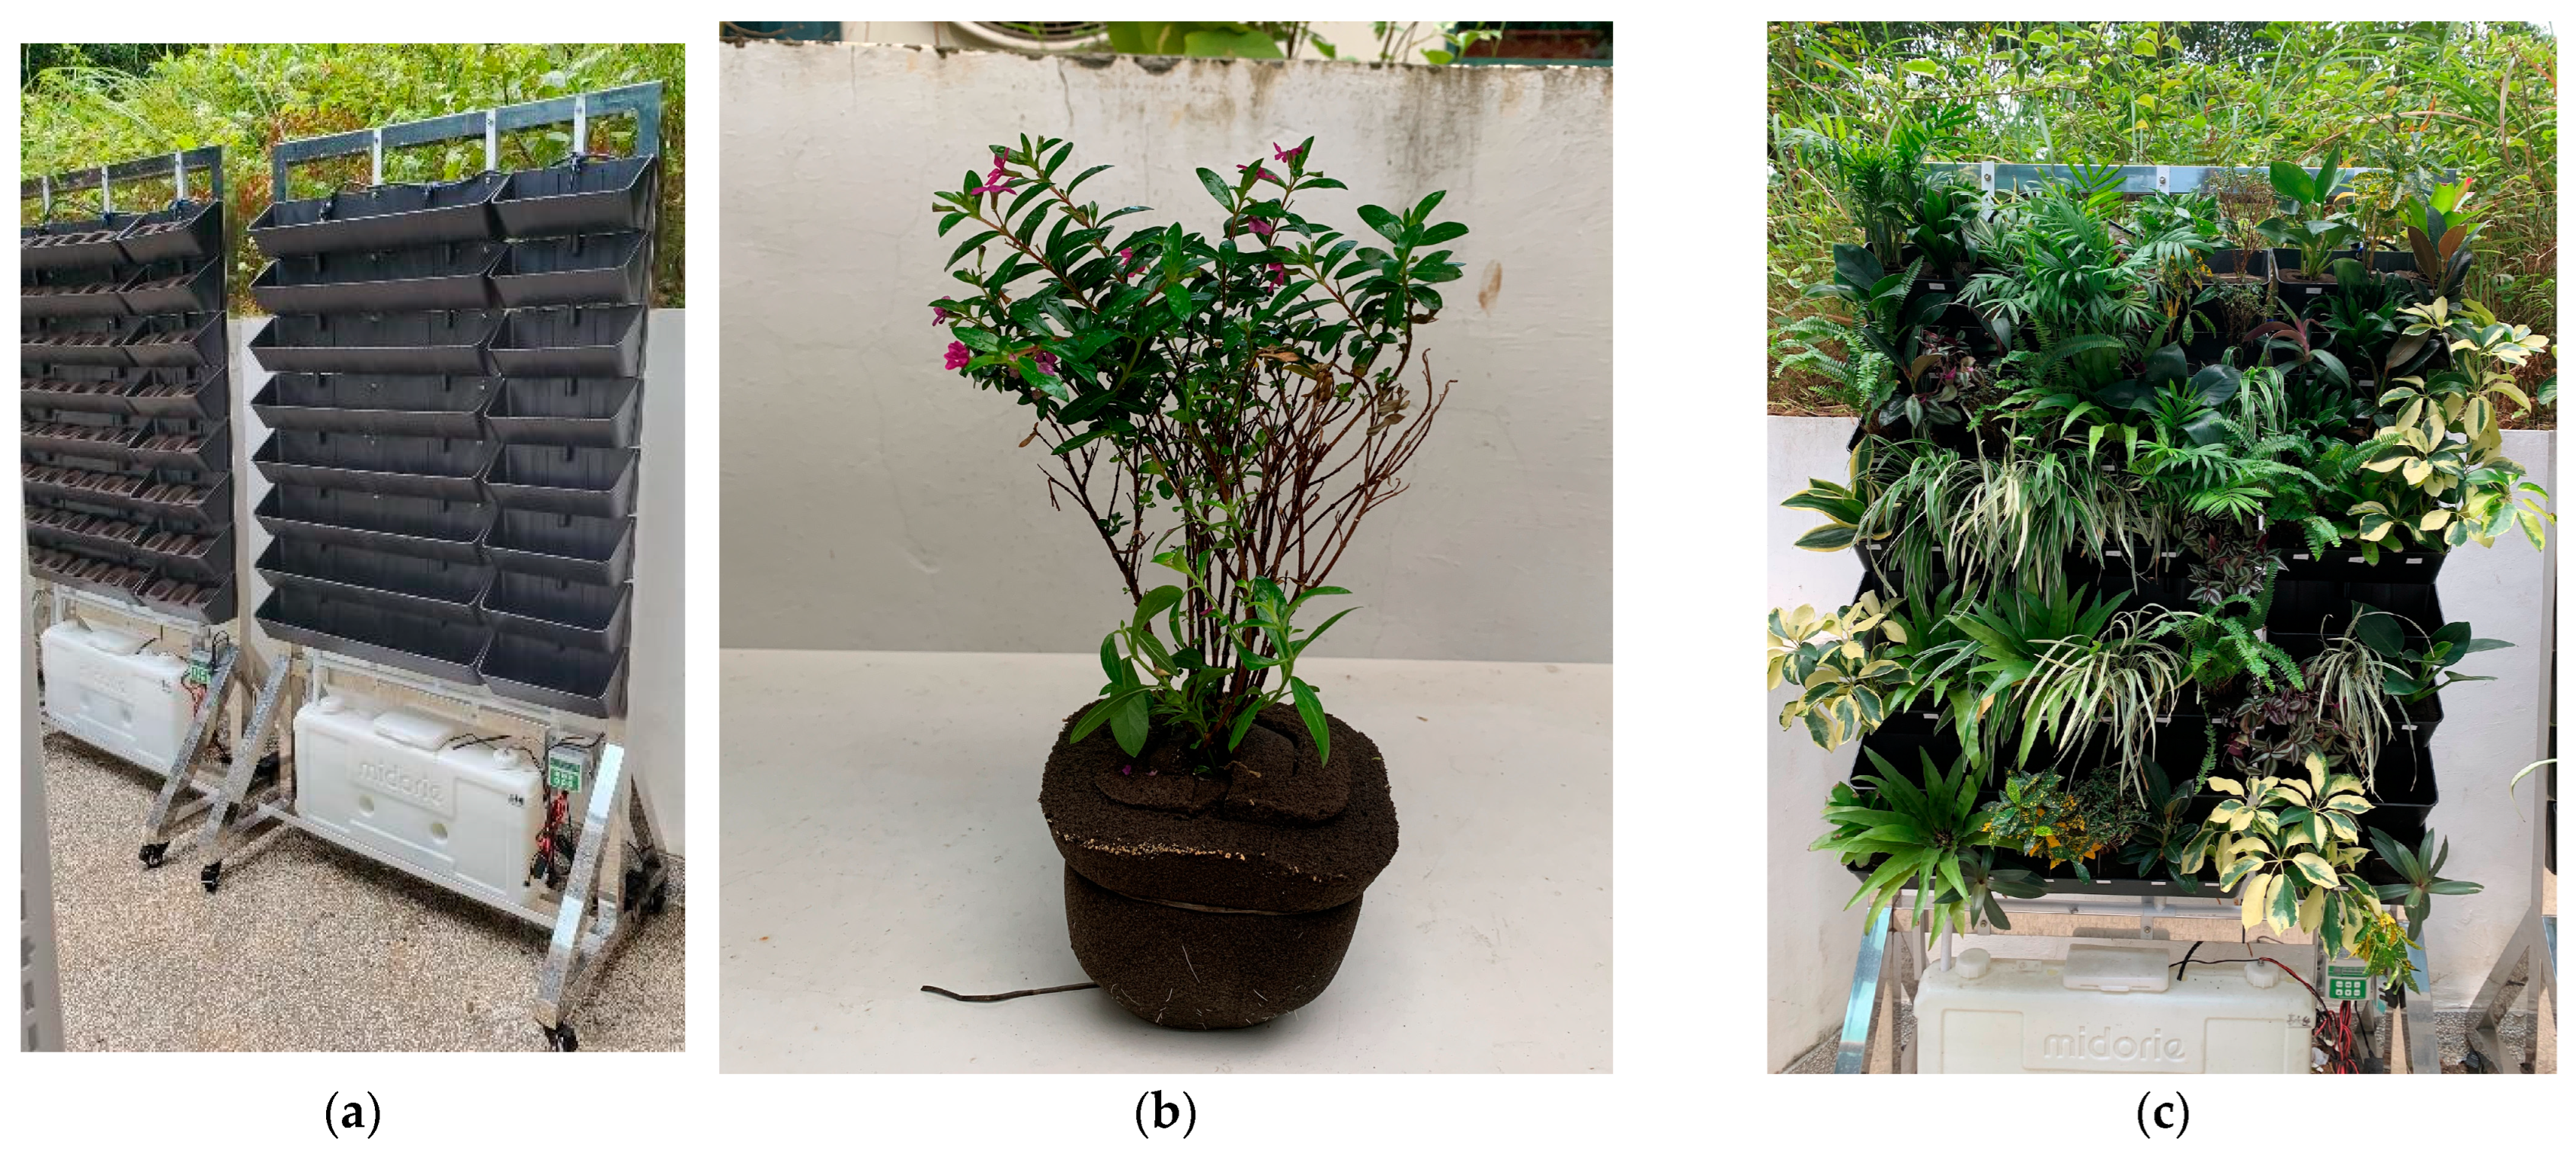
The LW setup, growing media, and plants were supplied by an LW company (Plant Plant Holding Company Limited, Hong Kong SAR, China). The two LW panels were free-standing and constructed from stainless steel frames and polypropylene modular cells. They were placed side by side in an open area on the second floor of the campus facing southeast. Each LW had a width of 1 m and height of 2 m and accommodated 60 pots (120 pots in total) of plants in moulded soilless planting media (proprietary growing media ‘Pafcal’ by Toyota Suntory Midorie). ‘Pafcal’ is a polyurethane sponge mixed with organic plant materials. They were moulded to form core and add-on layers for easy transplant of plants. Each unit of soilless planting media measured approximately 9 × 9 × 7.5 cm (width × depth × height). According to the product description on the company website, absorbed moisture can be evenly distributed throughout the substrate unit. Figure 2a shows the two LW panels without plants, Figure 2b shows the individual soilless planting media with plants transplanted during acclimatisation, and Figure 2c shows plants installed on one LW panel.
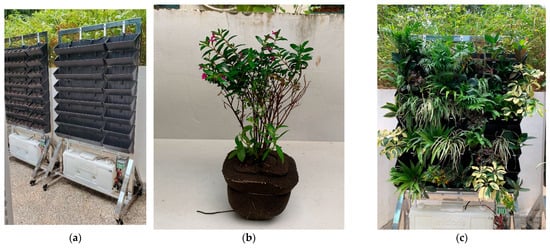
Figure 2.
(a) Experimental living wall panels without plants installed; (b) individual plant transplanted into moulded soilless planting media; (c) plants installed on living wall panels.
2.3.2. Plant Species
Plant species tested in this study were commonly adopted species in LW projects by local LW companies. These 29 plant species (including cultivars) shared the following characteristics: (a) colourful blossoms or foliage with ornamental value and (b) adapt to local climate (with or without irrigation) (Table 1). They can be categorised into five plant forms: (a) herbaceous perennials (16 species/cultivars), (b) succulents (2 cultivars), (c) ferns (2 species), (d) shrubs (7 species/cultivars), and (e) trees (2 species/cultivars). One plant was applied in each soilless planting media for a total of 120 individuals. Four replicates were used for each plant species/cultivar, with the exception of Neoregelia carolinae (NCR), for which eight replicates were used. Plants individuals in each species were similar in size to minimise discrepancy.

Table 1.
Plant species list including plant code, botanical and common names, plant form, origin, and family.
2.3.3. Preparation of Plants and Setup
Plants supplied by the LW company were first removed from their containers and washed in running water to remove any remains of soil particles. Their root balls were then carefully separated to untangle individual main roots. Afterward, the plants were carefully planted into each soilless planting media, and the units were then soaked in water for as long as would be required to completely saturate the planting media. The plants set in their soilless planting media were then pre-established for a period of about 30 days in a greenhouse at THEi Chai Wan campus. After this acclimatisation period, 120 individuals were installed onto the LW according to a randomly generated matrix. The orientation of all plant individuals was kept unchanged after they were taken out and returned to the LW for measurement and watering.
2.4. Measurements and Data Collection
2.4.1. Plant Height, LAI, and Health Rating
The height of the plant, LAI, and health rating were measured and recorded every 6 days during the experiment. The vertical height of the plant from the top of the soilless planting media upward was recorded using a straight edge. LAI was measured using the mobile phone application named ‘Easy Leaf Area’ in cm2 as a unit of measurement [40]. This app uses per-pixel colour ratios to distinguish the green colour of the foliage and the background white colour. Plants were photographed from either side view or bird’s-eye view depending on the shape and orientation of the foliage. The whole plant, including foliage, stem, and root, was inspected, and systematic recording of plant health was conducted using a 0–5 visual appearance Likert scale modified from Rowe [41] and Dvorak et al. [27]. The plant health ratings were defined with the following descriptions:
- 5 = Excellent. Less than 5% yellowing/wilting of foliage; excellent foliage and root development;
- 4 = Good. A total of 5–10% yellowing/wilting of foliage; good foliage and root development;
- 3 = Fair. A total of 11–20% yellowing/wilting of foliage; fair foliage and root development;
- 2 = Poor. A total of 21–30% yellowing/wilting of foliage; poor foliage and root development;
- 1 = Very poor. Over 30% yellowing/wilting of foliage; very poor foliage and root development.
- 0 = Dead plant.
2.4.2. Water Absorption Measurement
All units with the plant were initially saturated by immersing them in water before installation onto LW. The moisture level of planting media was then monitored in 2- or 3-day intervals with a moisture metre (5TM soil moisture metre with Procheck data logger, Meter Group, USA). The probe was placed consistently between the inner and middle layers of Pafcal. If the measurement fell below 0.30 m3 m−3, the soilless planting media would be re-saturated by immersing it in a water bath. Assuming the evaporation among all soilless substrates was uniform, the volume of water absorbed by the planting media was recorded as water demand, previously consumed and transpired by the plant.
2.4.3. Local Weather
Local weather information (air temperature, relative humidity, wind speed, dew point, heat index, and atmospheric pressure) in the immediate vicinity of the LWs was recorded every other day using a Kestrel wind and weather metre. The solar radiation index was also measured at about 12:00 noon using a lux metre. The solar radiation index was recorded at 6 measurement points evenly distributed on the upper, middle, and lower parts of the LW, and the average index was computed accordingly.
2.5. Data Analysis
2.5.1. Multiple Objectives for Plant Selection on LW Projects
Unlike previous research that often focused on a single aspect of living wall performance, this study addresses multiple objectives relevant to real-life living wall projects.
The living wall project objectives investigated in this study are outlined below:
- Aesthetic Objectives: The study focuses on achieving healthy plant growth with adequate leaf area coverage and foliage density, which are essential prerequisites for all living wall projects. Although this study does not account for aesthetic requirements such as naturalistic, tidy, wild, colourful patterns and contrasting foliage textures, it collects data on plant health ratings to track development trends;
- Minimal Maintenance Objective: This objective considers factors like pruning, plant replacement, pest and disease control, nutrient balance, water management, and waste generation. Slow-growing and stable plant traits are preferred for modular living walls to minimise maintenance. Root development was not included in this study due to the short monitoring period. The study tracked plant height differences to measure plant growth;
- Water-Saving Objective: The study focuses on selecting plant species that match minimal water requirements and optimising irrigation setups for precise water management. Data on water absorption amounts is collected under this objective;
- Balancing Multiple Objectives: While choosing plant species to fulfil a single objective is straightforward, living wall projects with multiple objectives may require optimisation when plant species exhibit conflicting traits. Trade-offs among objectives necessitate making concessions to achieve improvement in one area while compromising on another.
By addressing these living wall project objectives, this study aims to provide valuable insights for optimising plant selection and design on living walls to enhance their overall performance and sustainability.
2.5.2. Principle of Random Forest and Hierarchical Clustering Algorithm
Random forest classification is a machine learning method for developing prediction models. The random forest algorithm is a supervised learning algorithm that creates an ensemble of multiple decision trees to reach a singular result or prediction [42,43]. Health rating was selected as a predictor variable, and the random forest algorithm was used to identify the deterministic variables from other variables. Identification of predictor variable and deterministic variable(s) could hint at which should be included in a reduced, parsimonious model [44].
The random forest model was implemented by using the random forest library in the R library (randomforest). The random forest algorithm enhances the decision trees by adding randomness and using alternative bootstrap samples for each tree’s construction [44]. Each tree classifies features by making optimal splits from randomly chosen subsets of predictors, utilising out-of-bag (OOB) sampling. Predictions are made by aggregating the outputs of all trees. The OOB error, generated during training, helps assess variable importance using metrics like mean decrease accuracy (MDA) and mean decrease Gini (MDG), indicating significant predictors when their OOB error increases [45,46,47,48,49].
A hierarchical clustering algorithm can provide effective and simple clustering operations for identifying a range of plant species by plant order according to the important factors involved. The algorithm calculates the distances between data points and groups the nearest ones together. This process is repeated until all data points are grouped into two categories. The result is then represented as a binary tree-like diagram, allowing for the visualisation of groupings at different levels [50,51]. Through the clustering process, the plants would be grouped with similar characteristics. These plant species groupings could indicate species fulfilling LW objectives in varying degrees.
2.5.3. LW Project Scenarios to Estimate LW Performance
To ensure VGS projects are implemented successfully, site factors (e.g., aspect, intensity of insolation, shadowing, wind, etc.) should be thoroughly considered in the pre-design stage. Project objective(s) or goals of the VGS project should be laid down clearly as a product of discussion by project opponents and VGS companies after reviewing limitations posed by site factors.
Prioritising living wall project objectives is necessary to guide what to be sacrificed when available (natural, socio-economic) resources are limited. Based on the threshold approach, top-performing species of individual objectives (health or water-saving or slow-growing) and top performers for dual and triple objectives could be identified. Plant groups that performed best based on hierarchical clustering of health performance and water-saving data were then compared with top-performer plant species with simulation runs on Excel software 2019. LW performance was estimated based on 4 plant grouping scenarios (i.e., Health + water-saver, Health + slow-growing, Health + water-saver + slow-growing, Hierarchical clustering (Health + water-saver)), and simulated LW performance figures were calculated.
3. Results
3.1. Local Weather Condition
Ambient temperature, relative humidity (RH), solar radiation index (SRI), and wind speed measured on site are shown in Table 2. The mean ambient temperature during the study period dropped from 25.3 °C to 16 °C in the first 9 days and was maintained at around 16 °C for the remaining 12 days. RH showed moderate variations within the measured range of 70.2% to 85.4%. Most of the days were overcast, cloudy days, and the SRI measured at the LW was generally around or under 2000. Wind speed at the LW was generally very gentle, ranging from 0.1 to 0.6 m s−1, throughout the study period. The LWs were located adjacent to campus buildings that might act as shelters. When the above weather data were compared with the water demand, plant health rating, and growth development, there was no obvious trend or correlation observed.
Table 2.
Measured ambient temperature, relative humidity, solar radiation index, and wind speed at the living wall systems under study.
3.2. Plant Health Rating
All plant species were successfully established in the LW system. Only one plant species, Cuphea hyssopifolia, showed a low initial health rating of 2 at the beginning of the experiment due to transplant shock; their vitality improved gradually. No plant had died during the course of the experiment. About half (51.7%) of all plant species achieved a final health rating of 4 or higher at the end of the experiment (Figure 3). Eight species, which maintained the highest mean health rating of 5.0, included four herbaceous perennials (ET, FH, PO, and PLL), one succulent (STL), one shrub (DM), and two tree (FE and FEM) species.
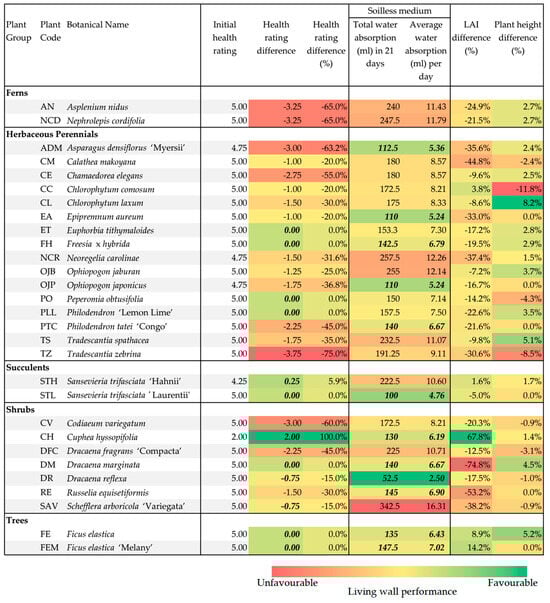
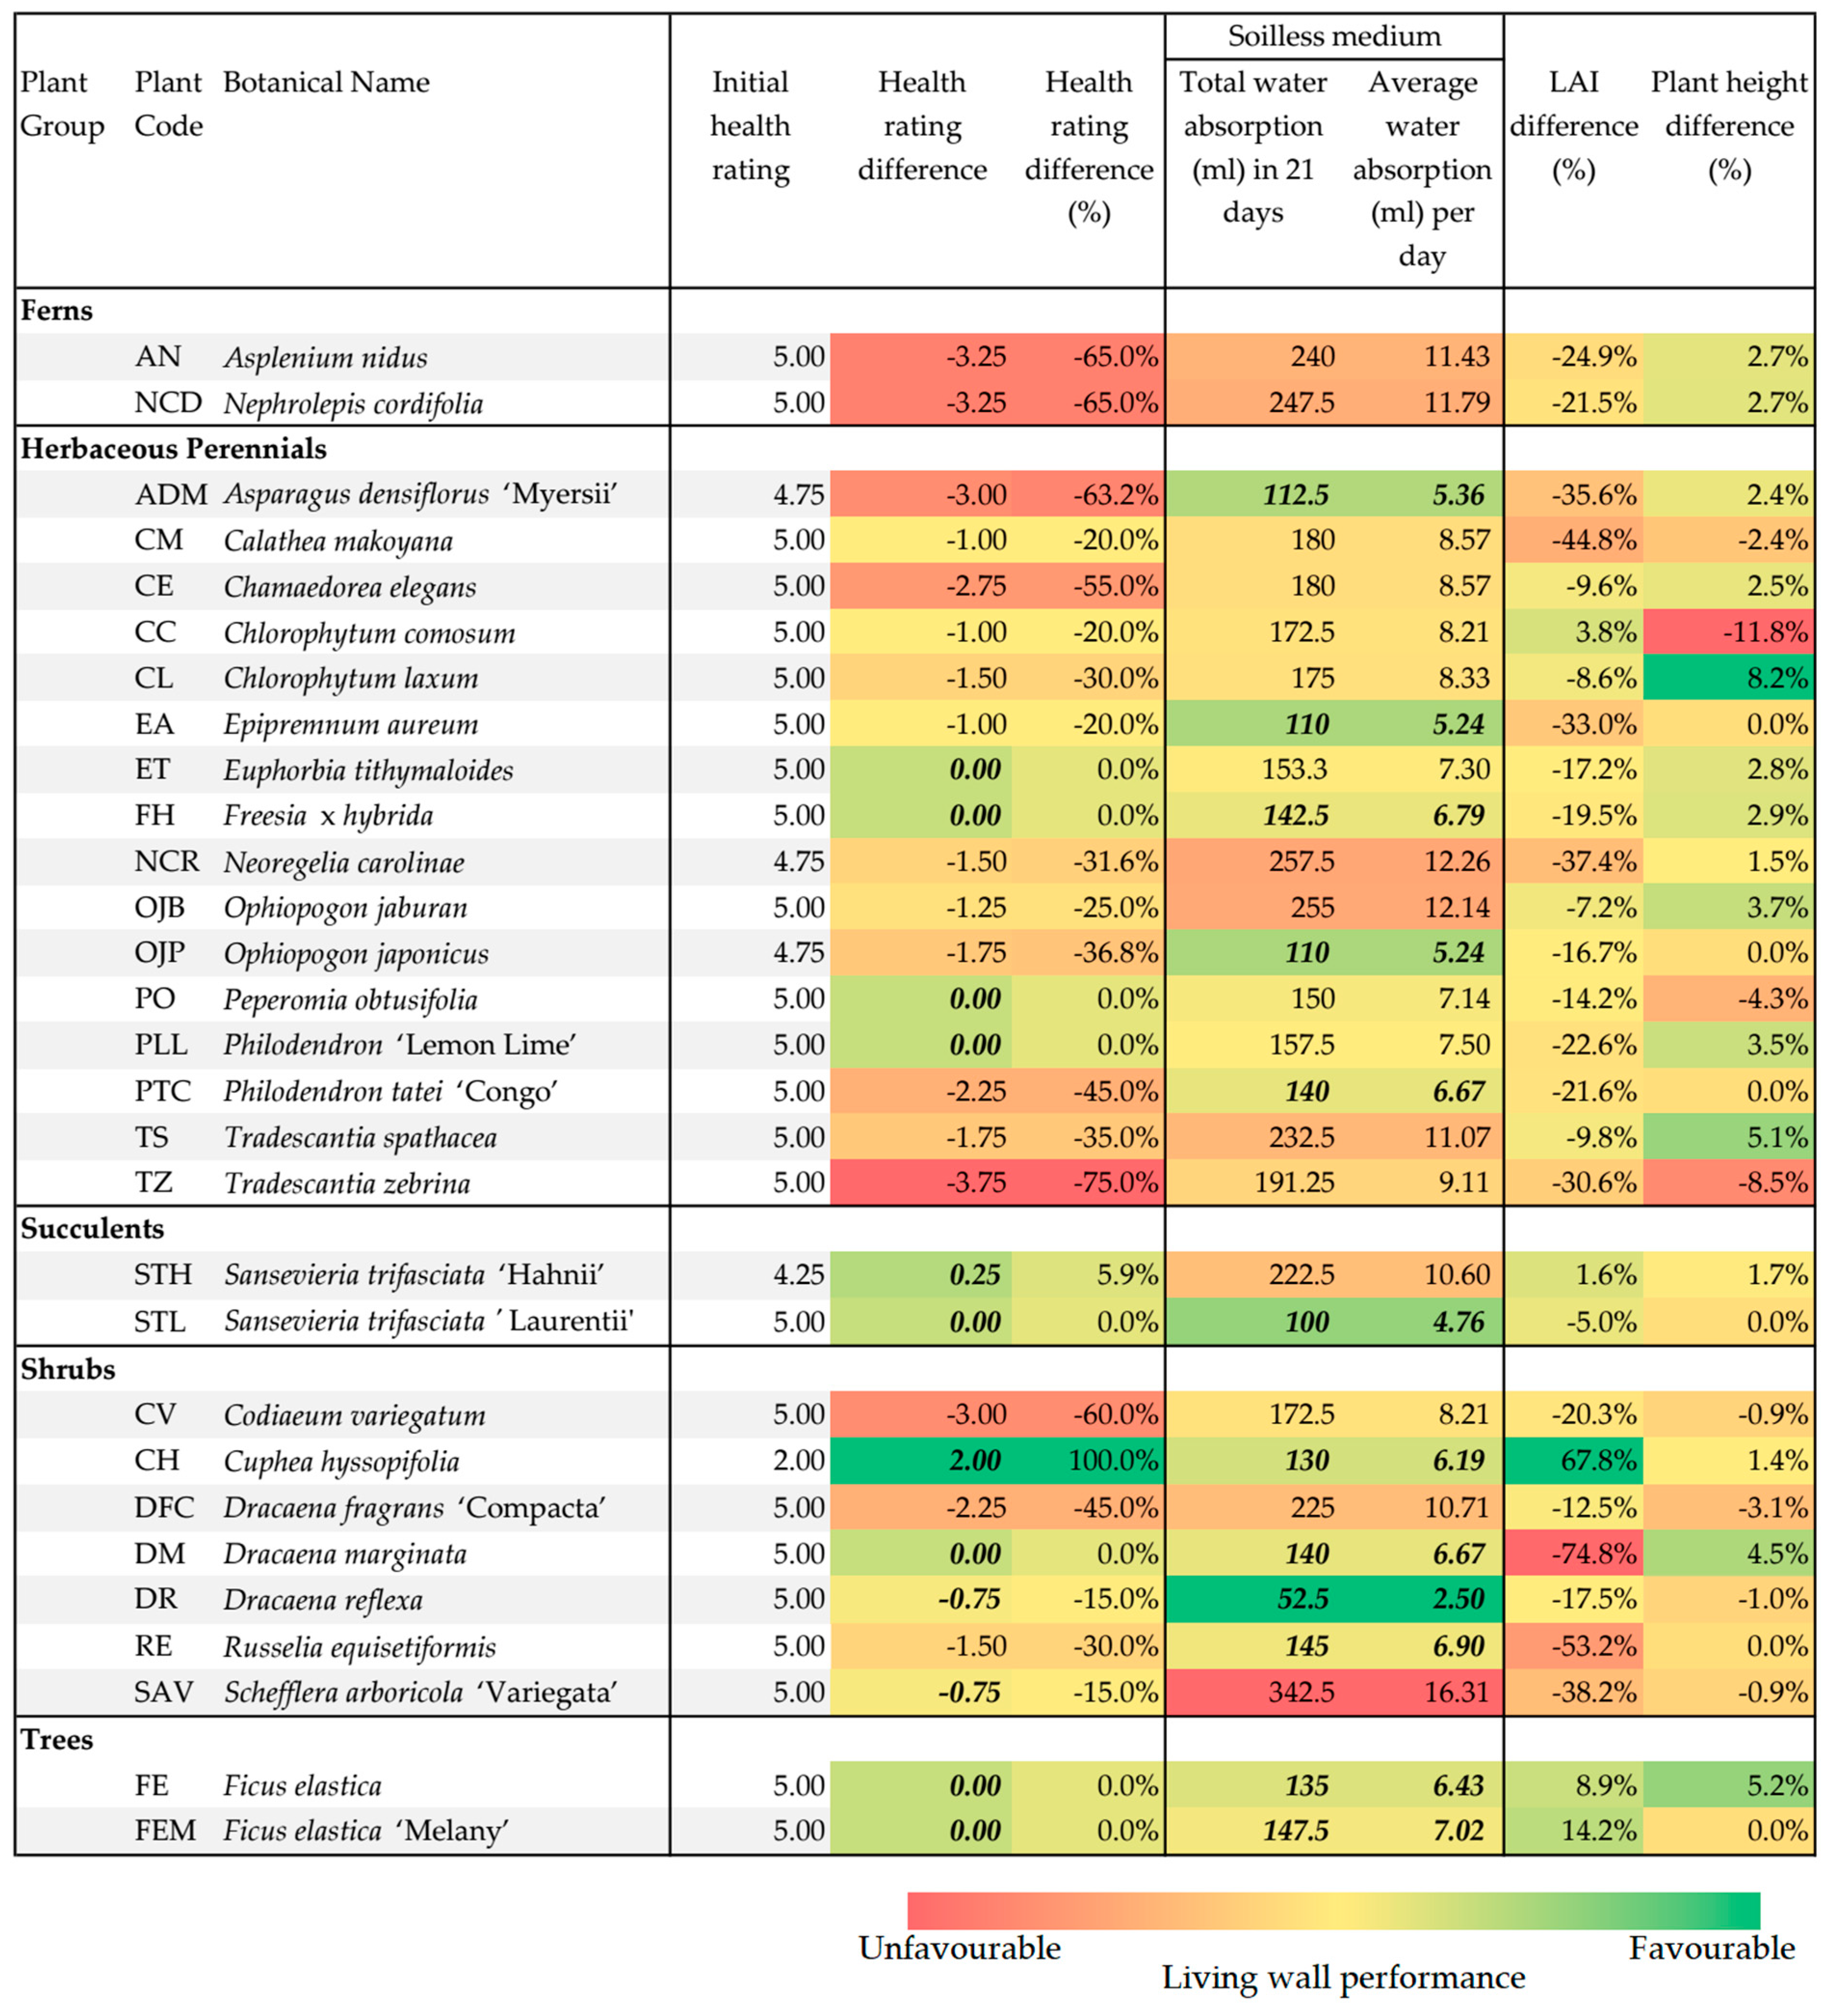
Figure 3.
Heatmap illustrating plant growth performance in terms of health rating, water absorption, LAI, and plant height change percentage, denoting top performers in bold in respective criteria. (Values are coloured in continuum of green to red, indicating parameters leading to favourable and unfavourable LW performance, respectively).
Out of 16 herbaceous perennial species/cultivars tested, 12 of them (75%) experienced a decrease in plant health rating, with differences between final and initial ratings ranging from −20% to −75%. Among seven shrub species/cultivars, five of them (71.4%) had their health rating decreased (from −15% to −60%). The two succulent cultivars Sansevieria trifasciata ‘Hahnii’ and ‘Laurentii’ (STH, STL) performed well, maintaining 4.25 and 5.0, respectively. Two tree species were studied (FE, FEM), all showed no change in health rating, maintaining a high health rating of 5.0 throughout the experimental period.
3.3. Plant Height
Figure 3 summarises the differences in the percentage of measured heights of plant species/cultivars, taking into account the initial plant height. Most species/cultivars showed modest increases in height of less than 5%, except for CL, TS, and FE, which exhibited increases in height of 8.2%, 5.1%, and 5.2%, respectively. As plants demonstrating vigorous or excessive growth in height might be prone to frequent maintenance, this should be taken into consideration when selecting suitable plant species for LW systems. Some species/cultivars studied showed a decrease in plant height, e.g., CM, CC, PO, TZ, CV, DFC, DR, and SAV, suggesting they are relatively more sensitive to water availability (e.g., temporary water restriction, exposed LW with high evapotranspiration) and their herbaceous physiology. These species are well adapted to environments with high soil moisture. Many of their original habitats are forest undergrowth (e.g., Calathea makoyana, Chlorophytum comosum, Tradescantia zebrina). Their use should therefore be carefully scrutinised on LWs aiming for water-saving goals; otherwise, timely and adequate irrigation will be needed to ensure drooping is avoided and their appearance can be maintained.
3.4. Leaf Area Index
When the plant wilts, leaves shrink and turn yellowish, and leaf area indices (LAI) will decrease. Most species (24 out of 29) recorded negative LAI change in the 3-week monitoring period, and nearly half of these 24 species (i.e., 11 species) had mild decreases ranging from −5% to −19.5%. The following species/cultivars showed significant decreases in LAI with a very wide range of values (Figure 3). Those showing substantial reduction in LAI (more than 20%) include the following: ferns: AN (−24.9%) and NCD (−21.5%); herbaceous perennials: ADM (−35.6%), CM (−44.8%), EA (−33.0%), NCR (−37.4%), PLL (−22.6%), PTC (−21.6%), and TZ (−30.6%); and shrubs: CV (−20.3%), DM (−74.8%), RE (−53.2%), and SAV (−38.2%). It is important to point out that this LAI should be interpreted with caution when the species measured have variegated foliage in different colours. The measured data reflected inconsistency with high variance among measured values of replicates of the same species and made them unreliable for plant performance assessments.
3.5. Water Absorption
Table 3 presents data on watering days, water absorption volumes, total volume, and daily mean of water absorption over the study period, showcasing the water absorption pattern in soilless substrate media. The results indicate that most species absorbed between 100 and 150 mL per watering session, while six species initially absorbed around 50 to 75 mL per session but showed a significant increase in water absorption (100 mL) in subsequent sessions.
Table 3.
Pattern of water absorption by soilless substrate media during the experiment.
There were no apparent climatic conditions causing intense evaporation throughout the experiment. The varying water absorption patterns observed could be attributed to differences in root development among the species. Species with shorter and less extensive root systems initially absorbed water mainly near the core zone, leaving the outer layer of the Pafcal substrate relatively moist. As irrigation water was not consistently available, these species likely extended their roots outward in search of water, resulting in higher water absorption levels in later measurements. While this hypothesis provides a plausible explanation, further research is needed to confirm it. Future experiments could optimise the design by including additional moisture measurements on the outer layer to validate this proposition.
There were also eight species that had high total water absorption (200–300 mL), i.e., ferns: AN and NCD; herbaceous perennials: NCR, OJB, and TS; succulents: STH; and shrubs: DFC and SAV. Eight species/cultivars required watering twice, i.e., ferns: NCD; herbaceous perennials: NCR, OJB, TS, and TZ; and shrubs: CV, DFC, and SAV. The above two lists have many species in common. One species required watering three times during the experimental period, i.e., succulents: STH, although its total water absorption is not the highest among all species. The species that absorbed the most water is Schefflera arboricola ‘Variegata’, totalling 342.5 mL over 3 weeks. The remaining 20 species/cultivars required re-watering only once, i.e., ferns: AN; herbaceous perennials: ADM, CM, CE, CC, CL, EA, ET, FH, OJP, PO, PLL, and PTC; succulents: STL; shrubs: CH, DM, DR, and RE; and trees: FE and FEM.
Comparing the mean daily irrigation demands of the 29 species/cultivars studied, the following species showed the highest values exceeding 10.00 mL day−1: ferns: AN (11.43) and NCD (11.70); herbaceous perennials: NCR (12.26), OJB (12.14) and TS (11.07); succulents: STH (10.60); shrubs: DFC (10.71) and SAV (16.31). Plants with significantly lower mean daily water demands below 6.00 mL day−1 include the following: herbaceous perennials: ADM (5.36), EA (5.24), and OJP (5.24); succulents: STL (4.76); and shrubs: DR (2.50).
Whether the plant species tend to retain moisture within plant tissue or to have moisture lost through transpiration could not be accounted and quantified in this study. Factors affecting the above were complex and possibly related to the amount of plant biomass, morphological features like waxy leaves, fleshy leaves and stems, root tubers or nodules, and type of carbon fixation pathway.
3.6. Random Forest Model for Determining Significant Parameters
After optimal value finding [49], the tree split (mtry) is set to 8, and the number of tree (ntree) sets to 1000 [46,47]. Given the critical condition of plant health in the selection procedure, the health rating difference was selected as the predictor (label) for comparative analysis alongside other variables (features), which were plant code, water demand, plant height difference, and the leaf area index difference. The assessment of important variables was conducted using the library(vip) [36]. The vip function extracted data from the random forest model and calculated the variable importance score.
Figure 4 shows that in the current experiment setting, water demand is the most useful predictor of the health rating of the species as compared with others. Height difference and plant form type are substantially less significant with health rating, while leaf area index difference has a negative value. It is crucial to note that this conclusion is applicable to the 29 species in this experiment, and how well it can be applied to other species needs further investigation. We noted that it was unable to explain observation in all species tested; for example, Schefflera arboricola ‘Variegata’ performed well (health rating difference: −0.75) yet had the highest water demand.
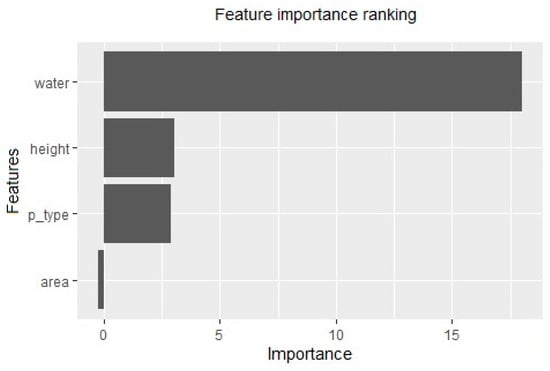
Figure 4.
The feature importance ranking from the output of the random forest algorithm for the experimental dataset. Four features: water demand (water), plant height change (height), plant code (p type), and leaf area change (area) with health rating change (h index) as label.
3.7. Hierarchical Clustering
After the important variable was determined, the hierarchical clustering algorithm was used to cluster the plant species based on the critical variables (health rating difference and water demand) involved. The clustering result further assisted us in grouping species under these two important factors.
The hierarchical clustering was implemented using the clustering function (hclust) in R with the Euclidean distance setting. It performed the binary clustering at different levels. The result was shown in the heatmap format using the heatmap function in R (pheatmap) [52] and displayed four levels for species separation in suitable, moderate, and unsuitable conditions.
The heatmap (Figure 5) illustrates the outcome of the clustering analysis, with species having similar water demand and health rating tendency clustered as groups (4 groups separated by white lines). The algorithm generated four resultant groups: Group 1 with only one plant (SAV); Group 2 with 12 species (CH, FE, FH, DM, PO, FEM, ET, PLL, DR, STL, EA, and OJP) exhibited lower water demand and low health index difference, suggesting their advantages in the green wall. This group of plants was robust, with stable plant performance and low water demand, among others. Group 3 is the six species with a slightly higher magnitude of health deterioration; their water demand is comparable to or slightly higher than Group 2. Groups 3 and 4 both exhibited deteriorating tendencies of plant health in varying degrees and were more sensitive to intermittent water supply. Group 4 consists of the 10 species having the highest magnitude of health deterioration and with the highest water demand. With planting design grouping species in respective groups, water availability could be adjusted to fulfil the need at a marginal rate to maximise the water-saving goal. In LW projects, water-saving is not defined as a project goal; plant species in Groups 3 and 4 could be used based on their aesthetic traits, provided that reliable automatic irrigation systems are in place.
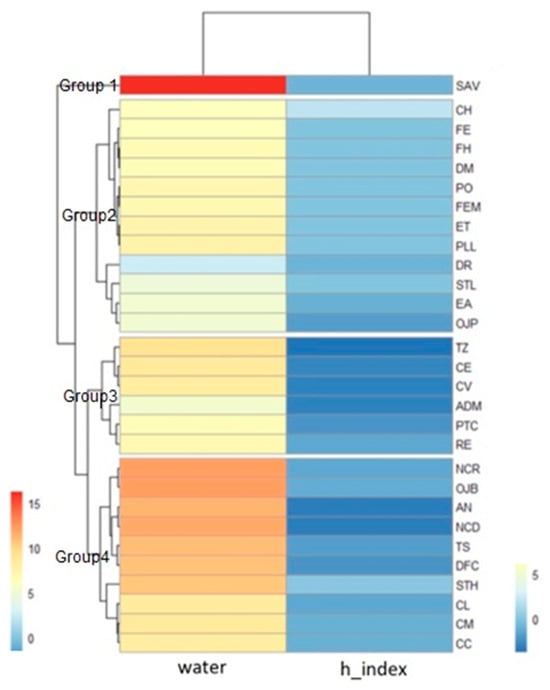
Figure 5.
Heatmap for clustering the plant species into plant groups according to water demand and health rating difference (legend: [water: mean daily water absorption in mL, only positive figure. Red as high, pale blue as low] [h_index: health rating difference, positive as pale blue; negative as deep blue]).
3.8. Plant Selection Scenarios Under Different LW Objectives
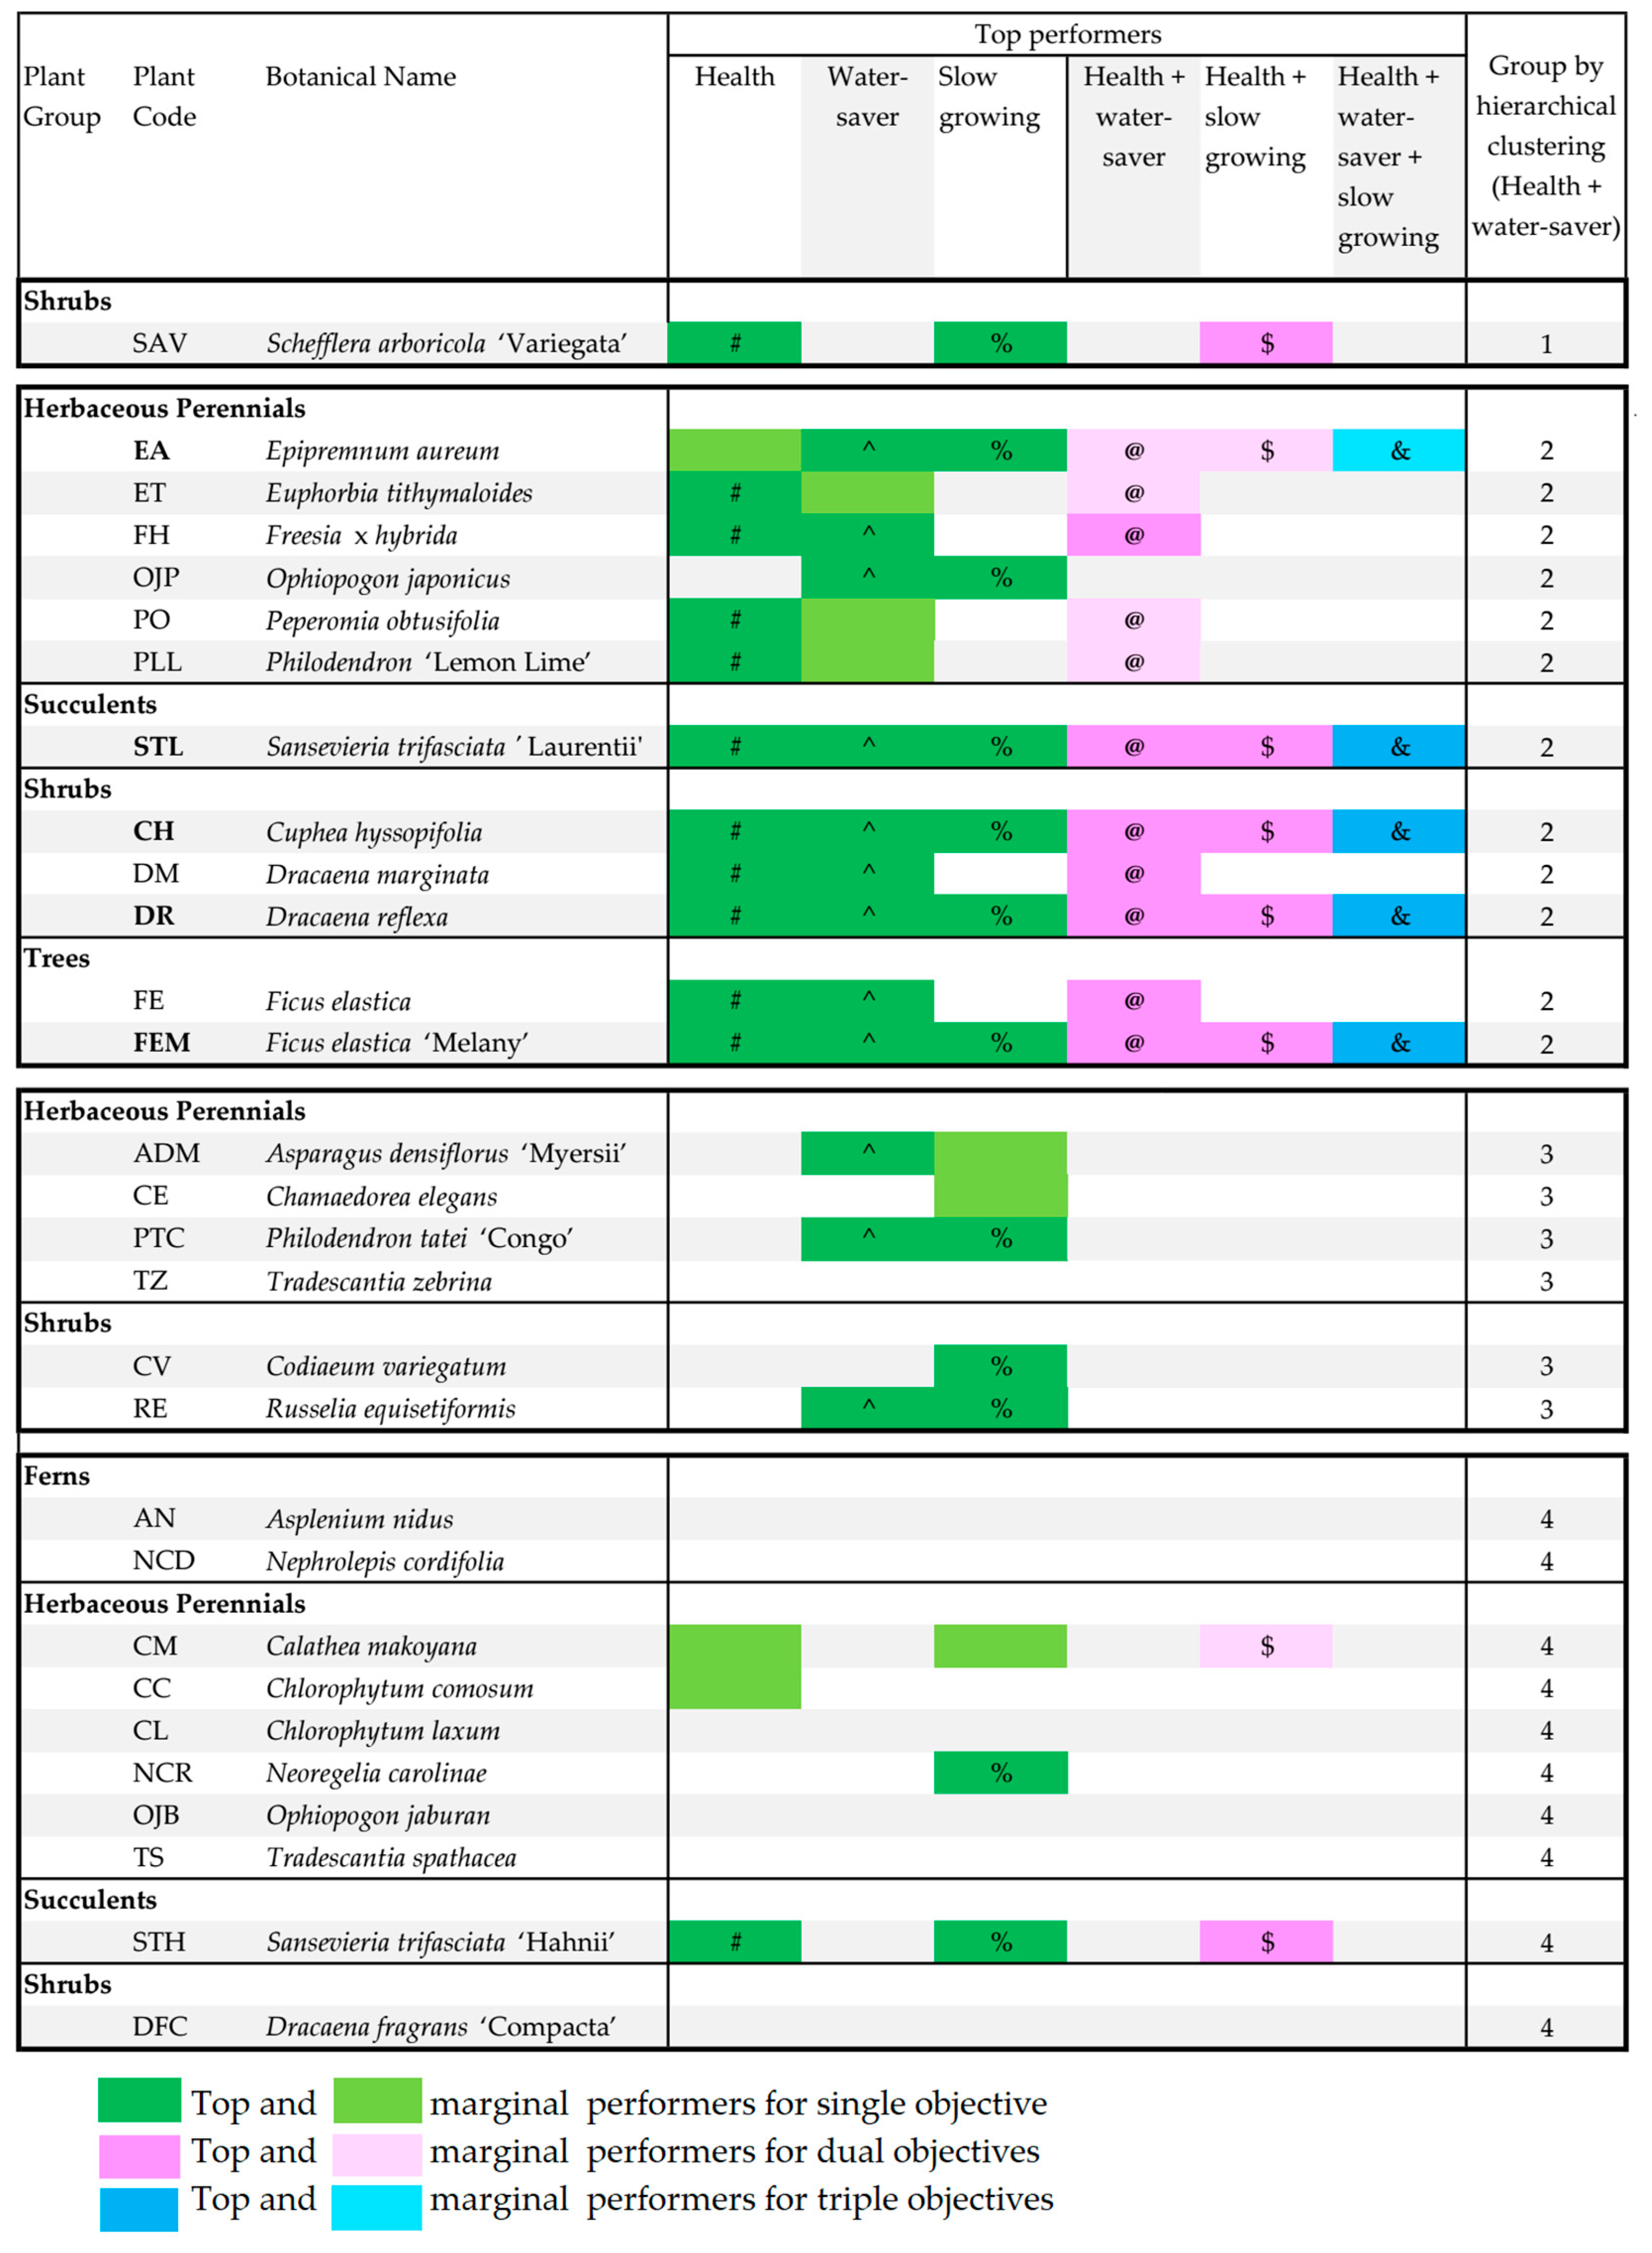
LW objectives laid down for a project could be single or multiple. They are all interacting with one another. Top-performing species under different objectives were manually selected to compare with species grouping derived by hierarchical clustering. Figure 6 indicates top performers for health, water-saving, and slow-growing objectives individually (green) and top performers for dual (pink) and triple (blue) objectives based on the threshold approach. Note that all deeper colours indicated top performers, and all lighter colours indicated marginal performers. Groups based on hierarchical clustering of health performance and water-saving data are denoted in the right column for easy comparison. It is obvious that species recommendation based on threshold approach and hierarchical clustering deviates. Four species in Group 2 are missing if only top performers are considered. Including marginal performers tended to synchronise both lists. Hierarchical clustering enabled data-mining in multiple dimensions and the identification of marginal performers, which will make plant species selection more flexible (not only confined to a limited number of species). When triple objectives are simultaneously important to an LW project, the traditional approach only suggested five plant species (highlighted in blue).

Figure 6.
Tested species grouped in hierarchical clustering based on dual objectives: health rating and water-saving; top-performing species based on single (green: top performer; light green: marginal performer) and multiple objectives in traditional approach. # Top 12 performers based on health rating. ^ Top 12 performers based on water-saving trait. % Top 12 performers based on slow-growing trait. @ Top 11 performers based on health rating and water-saving traits. $ Top 8 performers based on health rating and slow-growing traits. & Top 5 performers based on health rating, water-saving, and slow-growing traits. Bold plant code denotes plant species fulfilled all 3 above objectives.
3.9. Data-Driven Optimisation with Projected LW Performance Under Different Scenarios
In order to enhance the predictability of the performance and efficiency of LW projects during the design phase, various scenarios based on specific objectives and corresponding plant selections were simulated. The projected outcomes are detailed in Table 4. Assuming the LW project involves 1000 plant pots (with an equal distribution of selected species), the total water consumption varies significantly across different scenarios.
Table 4.
Projected figures of plant growth performance and water consumption in 21 days under different plant selection scenarios.
The scenario focusing on the triple objectives of ‘Health + water-saver + slow-growing’ is projected to have the lowest water consumption per plant (108 mL) compared to the ‘Health + water-saver’ scenario (125 mL per plant) and the ‘Health + slow-growing’ scenario (163 mL per plant). Interestingly, while the triple-objective scenario does not achieve the highest projected health rating (4.50) compared to the ‘Health + water-saver’ scenario (4.75), it suggests that more stringent scenarios may lead to higher average health ratings.
The triple-objective scenario excelled in water consumption and promoting slow plant growth despite having a lower plant species diversity with only 4–5 species. It was observed that in LW projects with a greater variety of plant species, plants tend to grow more rapidly, especially with the inclusion of vibrant species. The double-objective scenario of ‘Health + water-saver’ contributed to the LW with the highest health rating (4.75) while offering moderate water savings.
These simulation results underscore the complexity and multi-faceted nature of the issue, highlighting that linear thinking may not suffice for accurate predictions. A data-driven approach provides solid numerical evidence for informed decision-making in LW project design.
4. Discussion
4.1. Recommendations on LW Design
Hierarchical clustering based on these three variables will help us to identify similar cluster groups, and these groups will indicate a combination of species (top performers) suitable to install on important, eye-catching LW zones. Groups with marginal performers can be installed in peripheral zones; similarly, marginal performers of slow-growing species (i.e., moderate growing rate) can be grouped in the same zone in an LW for easy trimming and replacement. Species groups with similar irrigation needs should be installed in the same irrigation zones with accurate and standardised amounts of water; this could tremendously improve water efficiency and reduce the number of moisture sensors to be installed for a smart irrigation system.
An irrigation system forms a crucial and indispensable part of any LW system. The complexity (sensors and IoT for smart irrigation hardware and software program setup), scale, flexibility of setting up irrigation zones (or down to precision irrigation), and flexibility of adjusting water amount and timing are in a trade-off relationship with the available project budget. Thus, the adoption of such a data-driven approach could help vertical green wall companies provide options for less tech-savvy irrigation systems to save on upfront installation costs and help reduce water bills.
In some regions of the world, the technological know-how of frontline technicians, gardeners, and property managers who manage the LW could not keep up with the available technology of water-saving measures deployed by advanced LW systems. Maintenance of these irrigation systems in the long term becomes a burden to them; thus, socio-economic factors should not be neglected.
4.2. Data-Driven Design and Monitoring Process for LW
The proposed model in this study provided two options for the LW performance simulation run: (1) health rating threshold approach and (2) advanced machine learning techniques. The health rating threshold approach employs rule-based filtering to identify suitable plant candidates based on predefined health metrics. In contrast, the random forest algorithm and hierarchical clustering techniques are utilised to analyse plant data, predict health and aesthetic outcomes, and group plants with similar characteristics. Model users would be able to choose their preferred approach and then compare and contrast the simulated LW performance.
To realise this data-driven approach to industrial implementation requires expertise in frontend and backend development of application architecture. They should feature an intuitive user interface and API for processing user requests and managing data alongside a database for storing plant information. The process of application development is out of the scope of this paper.
The application should include simulation capabilities for users to evaluate living wall performance by adjusting parameters and weighting objectives. Rigorous testing is essential for ensuring model accuracy and user satisfaction. Finally, deploying the application on appropriate hosting platforms and maintaining an updated database will enhance usability, facilitating the development of a comprehensive tool for optimising vertical green wall designs.
It is well discussed that the approaches to optimise LW involves analysing and designing factors in an integrated manner, as factors are intertwined [35]. Experts in the industry are good at making decisions based on experience while dealing with non-quantifiable aspects; nevertheless, bias, guesswork, and errors can creep in under work pressure. VGS companies can enhance organisational performance by leveraging quantifiable empirical data to inform strategies and create product packages that serve LW objectives for optimising LW project resource allocation. Data-driven decision-making promotes objectivity, reduces biases, and fosters a culture of accountability. It enables predictive analytics, improving forecasting accuracy (e.g., water consumption, maintenance cost) [53]. Monitoring data could further validate the model and provide evidence for fine-tuning.
4.3. Plant Form Determining Morphophysiological Traits of Plant
In terms of morphological traits, most species exhibited only modest increases in height over the experiment, with only three species exhibiting noticeable growth. Excessive growth could compromise the stability of plants in LWs. Some plants also reduced slightly in stature, raising concerns about their long-term viability. Overall, moderate growth forms are preferable for LWs. The water requirements of the plant taxa differed significantly as well. Ferns and some perennials and shrubs required the most irrigation, with mean daily application rates surpassing 10 mL per day. A few perennials, succulents, and shrubs utilised far less water, under 6 mL daily. This suggests that certain types have inherently higher water needs in LWs.
The number of species under different plant forms tested in this study varies, with the majority of them being herbaceous perennials, seconded by shrubs, with only a few species of succulents, ferns, and trees. Based on this experiment, it is certain to conclude that a lower percentage of herbaceous perennial species fulfilled single and multiple objectives, while a higher percentage of shrubs, succulents, and tree species fulfilled them. Herbaceous perennial species under Group 2 are mostly marginal performers in single and multiple objectives or simply non-performers. Almost all succulents, shrubs, and tree species are top performers. A possible explanation could be as follows.
FE, FEM, and SAV have waxy foliage with higher drought tolerance. The waxy cuticle layer of their foliage tends to protect the plants better from excessive water loss from evapotranspiration. It is also an advantage when growing in an LW system.
Succulent plants (STH, STL) have thick, fleshly foliage and a waxy cuticle. They tend to store water in their foliage and have a low rate of water loss, which is an advantageous adaptation to counteract arid or water-stress conditions. These plants have stronger adaptations to flourish in water-stress conditions.
Ferns performed the worst, with both species attaining low final health ratings and experiencing significant declines from their initial ratings. Among the herbaceous perennials, about three-quarters showed reduced health over time, with nine attaining final ratings below 4. While herbaceous perennials tested had contrasting performance, succulents, and trees, on the other hand, maintained optimal health throughout, demonstrating high tolerance to water deficits. Shrubs generally performed better than perennial herbaceous and ferns, with four achieving final ratings of 4 or above.
The above observations aligned with the conclusion drawn by Lausen et al. [54] that the succulence of leaves, stems, or roots has the greatest impact on a plant’s ability to survive drought, irrespective of the species’ drought strategy. Thus, it would be meaningful to invest in horticultural research to cultivate and commercialise succulents, ferns, and tree species with effective succulence and other suitable traits for LWs. Their adoption and usage of LW should be based on empirical plant test data on the species level rather than the generalisation solely depending on their plant form type.
4.4. Suggested Data-Driven Analysis for Optimising Plant Selection
As constrained by resources, this study only focused on the water-saving and plant growth traits in relation to plant health performance; thus, three relevant objectives were discussed to demonstrate how a data-driven approach can optimise plant species grouping and selection. Other additional variables in relation to plant morphological performance could be considered to enhance comprehensive analysis:
- Optimal growing media (optimal combination of indicators like porosity, water holding capacity, air-filled porosity, cation exchange capacity, and particle size distribution);
- Drought resistance (maximum days without irrigation until signs of drought appear)
If empirical data (measurable and contributed by specific plant species) of other environmental objectives are collected and available, the same data analysis procedure could facilitate plant species selection.
Below are suggested variables specific to plant species for assessing contribution to environmental objectives:
- Pollutant removal capability (VOC, fine dust deposition);
- Plant cooling effect in relation to water stress and optimal irrigation;
- Carbon sequestration;
- Contribution to biodiversity (larval and nectar plant, flowering and fruiting timing and duration, plant architecture as shelter, rainwater and dew harvesting for wildlife, wildlife species survey utilising and breeding on specific plant).
Some data like surface temperature reduction, indoor thermal comfort, and noise reduction are usually collected at the VGS level (not at the plant species level); thus, analysis will be valid for comparing different VGS types or for comparing species functions on specific VGS types.
4.5. Limitations of the Study
A longer monitoring period ensures data reliability, and the optimal monitoring period will be up to 8 weeks; year-round monitoring will provide a holistic view of seasonal climatic variations during intensive insolation and high temperature. Although this study originally had planned for an 8-week monitoring period, the experiment was terminated due to the mandatory closure of campus with the onset of the fifth wave of the COVID-19 pandemic in Hong Kong.
It is acknowledged that a three-week data collection period may not be ideal; however, it is sufficient to meet the objectives of the proposed data-driven approach aimed at optimising plant species selection and planting design. This adequacy is supported by the immediate morphological changes that can be observed—such as variations in plant health performance and height—under conditions of water limitation, which can be assessed and recorded within weeks. For the above-selected parameters, this monitoring duration is appropriate; nevertheless, it is recommended that the monitoring period for other environmental parameters be reevaluated and adjusted as necessary in future studies.
The primary objective of this paper is not to examine seasonal variations in plant responses. We anticipate that future research will incorporate additional empirical data to cover the whole year to enhance the model’s comprehensiveness, thereby increasing its robustness and applicability across a range of environmental conditions.
5. Conclusions
This study investigated plant performance, plant growth, and water demand of 29 plant species/cultivars commonly used in outdoor LW under intermittent water supply in a subtropical climate. This study aimed to showcase how a data-driven approach with empirical plant growth data could assist decision-making on plant species selection and planting design under different goals and strategy-driven preferences in a modular LW panel system in a subtropical climate.
Results from this exploratory study provide valuable guidance on matching plant taxa to the variable and sometimes stressful microclimate within LWs. Further research expanding the range of species evaluated, monitoring longer-term performance over seasons, and assessing additional factors are recommended. Investigating water-efficient irrigation strategies based on each plant type’s inherent demand could help maximise water conservation in LWs. There is also scope to evaluate the influence of modular media properties on water retention and water availability to roots. Optimising plant selection and irrigation management hold promise for enhancing the viability and possibilities of reducing project cost, maintenance input, and water consumption.
In conclusion, this study contributes new knowledge on how empirical data can support plant species selection and planting design, as well as minimise costs under single or multiple LW objectives. The findings help inform species selection to support the long-term, low-input functioning of LWs. Other plant species-specific variables could be collected and input to create a data-driven optimisation to facilitate other LW goals like carbon sequestration, improved air quality, and biodiversity enhancement. Robust plant choices are key to maximising the sustainability benefits and future applications of LWs worldwide.
Author Contributions
Conceptualisation, C.M.Y.L.; methodology, C.M.Y.L.; validation, C.M.Y.L.; formal analysis, C.M.Y.L. and C.W.L.; investigation, C.M.Y.L., H.Y.L. and C.H.L.; resources, C.M.Y.L.; data curation, C.M.Y.L., C.W.L., M.P., H.Y.L. and C.H.L.; writing—original draft preparation, C.M.Y.L., C.W.L. and M.P.; writing—review and editing, C.M.Y.L., M.P., S.C., K.C.K.H. and Y.T.S.; visualisation, Y.T.S. and K.C.K.H.; supervision, C.M.Y.L.; project administration, C.M.Y.L.; funding acquisition, C.M.Y.L., M.P. and S.C. All authors have read and agreed to the published version of the manuscript.
Funding
This research was supported by the Research Matching Grant Scheme (Research Grants Council, University Grants Committee, Hong Kong SAR) and the Departmental Staff Development Fund of the Hong Kong Polytechnic University.
Institutional Review Board Statement
Not applicable.
Informed Consent Statement
Not applicable.
Data Availability Statement
The data presented in this study are available on request from the corresponding author.
Acknowledgments
We are grateful to Plant Plant Holding Company Limited for their generous donation of plants, materials, and living wall setup. This study would not be possible without their support.
Conflicts of Interest
C.M.Y.L. owns the company Nature in situ Limited as founder. C.M.Y.L. has no financial ties or current affiliations with the sponsor or any business relationship with the donor through her company. All remaining authors declare no conflicts of interest in the absence of any commercial or financial relationships that could be construed as a potential conflict of interest. The donor of setup and material had no role in the design of the study; in the collection, analyses, or interpretation of data; in the writing of the manuscript; or in the decision to publish the results.
References
- Wang, C.; Er, S.-S.; Abdul-Rahman, H. Indoor Vertical Greenery System in Urban Tropics. Indoor Built Environ. 2016, 25, 340–356. [Google Scholar] [CrossRef]
- Li, Z. Application of Plants in Chinese Garden Landscape. Can. Soc. Sci. 2014, 10, 143. [Google Scholar]
- Fonseca, F.; Paschoalino, M.; Silva, L. Health and Well-Being Benefits of Outdoor and Indoor Vertical Greening Systems: A Review. Sustainability 2023, 15, 4107. [Google Scholar] [CrossRef]
- Bodo, T. Rapid Urbanisation: Theories, Causes, Consequences and Coping Strategies. Geogr. Res. 2019, 2, 32–35. [Google Scholar] [CrossRef]
- Zhang, X.Q. The Trends, Promises and Challenges of Urbanisation in the World. Habitat Int. 2016, 54, 241–252. [Google Scholar] [CrossRef]
- Sultana, S.; Satyanarayana, A.N. Impact of Urbanisation on Urban Heat Island Intensity during Summer and Winter over Indian Metropolitan Cities. Environ. Monit. Assess. 2019, 191, 789. [Google Scholar] [CrossRef]
- Köhler, M. Green Facades—A View Back and Some Visions. Urban Ecosyst. 2008, 11, 423–436. [Google Scholar] [CrossRef]
- Blanco, I.; Schettini, E.; Mugnozza, G.S.; Vox, G. Thermal behaviour of green façades in summer. J. Agric. Eng. 2018, 49, 183–190. [Google Scholar] [CrossRef]
- Cameron, R.W.F.; Taylor, J.E.; Emmett, M.R. What’s ‘Cool’ in the World of Green Façades? How Plant Choice Influences the Cooling Properties of Green Walls. Build. Environ. 2014, 73, 198–207. [Google Scholar] [CrossRef]
- Carlucci, S.; Charalambous, M.; Tzortzi, J.N. Monitoring and performance evaluation of a green wall in a semi-arid Mediterranean climate. J. Build. Eng. 2023, 77, 107421. [Google Scholar] [CrossRef]
- Cosola, V.O.-D.; Olivieri, F.; Ruiz-García, L. A systematic review of the impact of green walls on urban comfort: Temperature reduction and noise attenuation. Renew. Sustain. Energy Rev. 2022, 162, 112463. [Google Scholar] [CrossRef]
- Perini, K.; Bazzocchi, F.; Croci, L.; Magliocco, A.; Cattaneo, E. The Use of Vertical Greening Systems to Reduce the Energy Demand for Air Conditioning. Field Monit. Mediterr. Clim. Energy Build. 2017, 143, 35–42. [Google Scholar] [CrossRef]
- Cheng, C.Y.; Cheung, K.K.S.; Chu, L.M. Thermal Performance of a Vegetated Cladding System on Facade Walls. Build. Environ. 2010, 45, 1779–1787. [Google Scholar] [CrossRef]
- Dahanayake, K.C.; Chow, C.L. Comparing reduction of building cooling load through green roofs and green walls by EnergyPlus simulations. Build. Simul. 2017, 11, 421–434. [Google Scholar] [CrossRef]
- Alexandri, E.; Jones, P. Temperature Decreases in an Urban Canyon Due to Green Walls and Green Roofs in Diverse Climates. Build. Environ. 2008, 43, 480–493. [Google Scholar] [CrossRef]
- Wong, N.H.; Kwang Tan, A.Y.; Tan, P.Y.; Chiang, K.; Wong, N.C. Acoustics Evaluation of Vertical Greenery Systems for Building Walls. Build. Environ. 2010, 45, 411–420. [Google Scholar] [CrossRef]
- Perini, K.; Ottelé, M.; Giulini, S.; Magliocco, A.; Roccotiello, E. Quantification of Fine Dust Deposition on Different Plant Species in a Vertical Greening System. Ecol. Eng. 2017, 100, 268–276. [Google Scholar] [CrossRef]
- Weerakkody, U.; Dover, J.W.; Mitchell, P.; Reiling, K. Particulate Matter Pollution Capture by Leaves of Seventeen Living Wall Species with Special Reference to Rail-Traffic at a Metropolitan Station. Urban For. Urban Green. 2017, 27, 173–186. [Google Scholar] [CrossRef]
- Pettit, T.; Irga, P.J.; Torpy, F.R. The In Situ Pilot-Scale Phytoremediation of Airborne VOCs and Particulate Matter with an Active Green Wall. Air Qual. Atmos. Health 2019, 12, 33–44. [Google Scholar] [CrossRef]
- Chiquet, C.; Dover, J.W.; Mitchell, P. Birds and the Urban Environment: The Value of Green Walls. Urban Ecosyst. 2013, 16, 453–462. [Google Scholar] [CrossRef]
- Madre, F.; Clergeau, P.; Machon, N.; Vergnes, A. Building Biodiversity: Vegetated Façades as Habitats for Spider and Beetle Assemblages. Glob. Ecol. Conserv. 2015, 3, 222–233. [Google Scholar] [CrossRef]
- Treder, M.; Joedecke, V.; Schweikert, K.; Rosenkranz, P.; Ruttensperger, U.; Traynor, K. Vertical greening systems serve as effective means to promote pollinators: Experimental comparison of vertical and horizontal plantings. Landsc. Urban Plan. 2024, 234, 104951. [Google Scholar] [CrossRef]
- Salisbury, A.; Blanusa, T.; Bostock, H.; Perry, J.N. Careful plant choice can deliver more biodiverse vertical greening (green façades). Urban For. Urban Green. 2023, 89, 128118. [Google Scholar] [CrossRef]
- Riley, B. The State of the Art of Living Walls: Lessons Learned. Build. Environ. 2017, 114, 219–232. [Google Scholar] [CrossRef]
- Chew, M.Y.L.; Conejos, S. Developing a Green Maintainability Framework for Green Walls in Singapore. Struct. Surv. 2016, 34, 379–406. [Google Scholar] [CrossRef]
- Dvorak, B.; Laminack, K.; Volder, A.; Conlee, D. Plant Survival for Living Walls in a Subtropical Climate. In Proceedings of the CitiesAlive 12th Annual Green Roof and Wall Conference, Nashville, TN, USA, 12 November 2014. [Google Scholar]
- Dvorak, B.; Yang, S.; Menotti, T.; Pace, Z.; Mehta, S.; Ali, A.K. Native Plant Establishment on a Custom Modular Living Wall System in a Humid Subtropical Climate. Urban For. Urban Green. 2021, 63, 127234. [Google Scholar] [CrossRef]
- Dvorak, B.D.; Volder, A. Plant Establishment on Unirrigated Green Roof Modules in a Subtropical Climate. AoB PLANTS 2013, 5, pls049. [Google Scholar] [CrossRef]
- Wong, N.H.; Tan, A.Y.K.; Tan, P.Y.; Sia, A.; Wong, N.C. Perception Studies of Vertical Greenery Systems in Singapore. J. Urban Plan. Dev. 2010, 136, 330–338. [Google Scholar] [CrossRef]
- Segovia-Cardozo, D.A.; Rodríguez-Sinobas, L.; Zubelzu, S. Living green walls: Estimation of water requirements and assessment of irrigation management. Urban For. Urban Green 2019, 46, 26458. [Google Scholar] [CrossRef]
- Law, C.; Li, S.; Lam, C. Plant Diversity and Plant Performance of Indoor and Outdoor Vertical Greening Systems in Hong Kong. Environ.-Behav. Proc. J. 2020, 5, 171–177. [Google Scholar] [CrossRef]
- Pérez-Urrestarazu, L.; Urrestarazu, M. Chapter 2.2—Vertical Greening Systems: Irrigation and Maintenance. In Nature Based Strategies for Urban and Building Sustainability; Pérez, G., Perini, K., Eds.; Butterworth-Heinemann: Oxford, UK, 2018; pp. 55–63. [Google Scholar] [CrossRef]
- Jørgensen, L.; Thorup-Kristensen, K.; Dresbøll, D.B. Against the wall—Root growth and competition in four perennial winter hardy plant species grown in living walls. Urban For. Urban Green. 2018, 29, 293–302. [Google Scholar] [CrossRef]
- Farrokhirad, E.; Rigillo, M.; Köhler, M.; Perini, K. Optimising vertical greening systems for sustainability: An integrated design approach. Int. J. Sustain. Energy 2024, 43, 2411831. [Google Scholar] [CrossRef]
- Lands Department. Hong Kong Special Administrative Region Government Lands Department—Hong Kong Geographic Data. Available online: https://www.landsd.gov.hk/en/resources/mapping-information/hk-geographic-data.html (accessed on 14 June 2023).
- Yu, M.; Song, S.; Jiang, C.; Ding, K.; Tan, L.; Ma, J.; Li, Y. Multi-objective optimization of plant community characteristics in urban green spaces. Urban For. Urban Green. 2024, 8, 128397. [Google Scholar] [CrossRef]
- Pichler, M.; Florian, H. Machine Learning and Deep Learning—A Review for Ecologists. Methods Ecol. Evol. 2023, 14, 994–1016. [Google Scholar] [CrossRef]
- Tyagi, A.K. Data Science and Data Analytics: Opportunities and Challenges, 1st ed.; CRC Press: Boca Raton, FL, USA, 2021. [Google Scholar]
- Hong Kong Observatory Monthly Meteorological Normals for Hong Kong (1991–2020). Available online: https://www.hko.gov.hk/en/cis/normal/1991_2020/normals.htm (accessed on 14 June 2023).
- Easlon, H.M.; Bloom, A.J. Easy Leaf Area: Automated Digital Image Analysis for Rapid and Accurate Measurement of Leaf Area. Appl. Plant Sci. 2014, 2, 1400033. [Google Scholar] [CrossRef]
- Rowe, D.B.; Monterusso, M.A.; Rugh, C.L. Assessment of Heat-Expanded Slate and Fertility Requirements in Green Roof Substrates. HortTechnology 2006, 16, 471–477. [Google Scholar] [CrossRef]
- Bénard, C.; Veiga, S.; Scornet, E. Mean Decrease Accuracy for Random Forests: Inconsistency, and a Practical Solution via the Sobol-MDA. Biometrika 2022, 109, 881–900. [Google Scholar] [CrossRef]
- Speiser, J.L.; Michael; Miller, E.; Tooze, J.; Ip, E. A comparison of random forest variable selection methods for classification prediction modeling. Expert Syst. Appl. 2019, 134, 93–101. [Google Scholar] [CrossRef]
- Liaw, A.; Wiener, M. Classification and Regression by RandomForest. Forest 2002, 2, 18–22. [Google Scholar]
- TpointTech. Random Forest Algorithm. Available online: https://www.tpointtech.com/machine-learning-random-forest-algorithm (accessed on 26 March 2025).
- Edureka. A Comprehensive Guide to Random Forest in R. Available online: https://www.edureka.co/blog/random-forest-classifier/ (accessed on 15 February 2024).
- Greenwell, B.M.; Boehmke, B.C. Variable Importance Plots—An Introduction to the vip Package. R J. 2020, 12, 343–366. [Google Scholar] [CrossRef]
- Random Forest in R: A Step-by-Step Guide. Available online: https://www.listendata.com/2014/11/random-forest-with-r.html (accessed on 13 February 2024).
- Random Forest Approach in R Programming. Available online: https://www.geeksforgeeks.org/random-forest-approach-in-r-programming/ (accessed on 5 June 2020).
- Hierarchical Clustering in R. Available online: https://www.datacamp.com/tutorial/hierarchical-clustering-R?utm_source=google&utm_medium=paid_search&utm_campaignid=19589720821&utm_%E2%80%A6 (accessed on 10 July 2024).
- Bowers, A.J.; Zhao, Y.; Ho, E. Towards Hierarchical Cluster Analysis Heatmaps as Visual Data Analysis of Entire Student Cohort Longitudinal Trajectories and Outcomes from Grade 9 through College. High Sch. J. 2022, 106, 5–36. [Google Scholar] [CrossRef]
- Draw Heatmap with Clusters Using Pheatmap in R. Available online: https://www.geeksforgeeks.org/draw-heatmap-with-clusters-using-pheatmap-in-r/ (accessed on 5 June 2023).
- Davenport, T.H. Analytics at Work: Smarter Decisions, Better Results; Harvard Business Review Press: Boston, MA, USA, 2013. [Google Scholar]
- Lausen, E.D.; Emilsson, T.; Jensen, M.B. Water use and drought responses of eight native herbaceous perennials for living wall systems. Urban For. Urban Green. 2020, 54, 126772. [Google Scholar] [CrossRef]


Disclaimer/Publisher’s Note: The statements, opinions and data contained in all publications are solely those of the individual author(s) and contributor(s) and not of MDPI and/or the editor(s). MDPI and/or the editor(s) disclaim responsibility for any injury to people or property resulting from any ideas, methods, instructions or products referred to in the content. |
© 2025 by the authors. Licensee MDPI, Basel, Switzerland. This article is an open access article distributed under the terms and conditions of the Creative Commons Attribution (CC BY) license (https://creativecommons.org/licenses/by/4.0/).