
Optimizing Urban Environments for Sustainable Development: Strategies and Practices to Enhance Mobility Among Older Adults


Abstract
1. Introduction
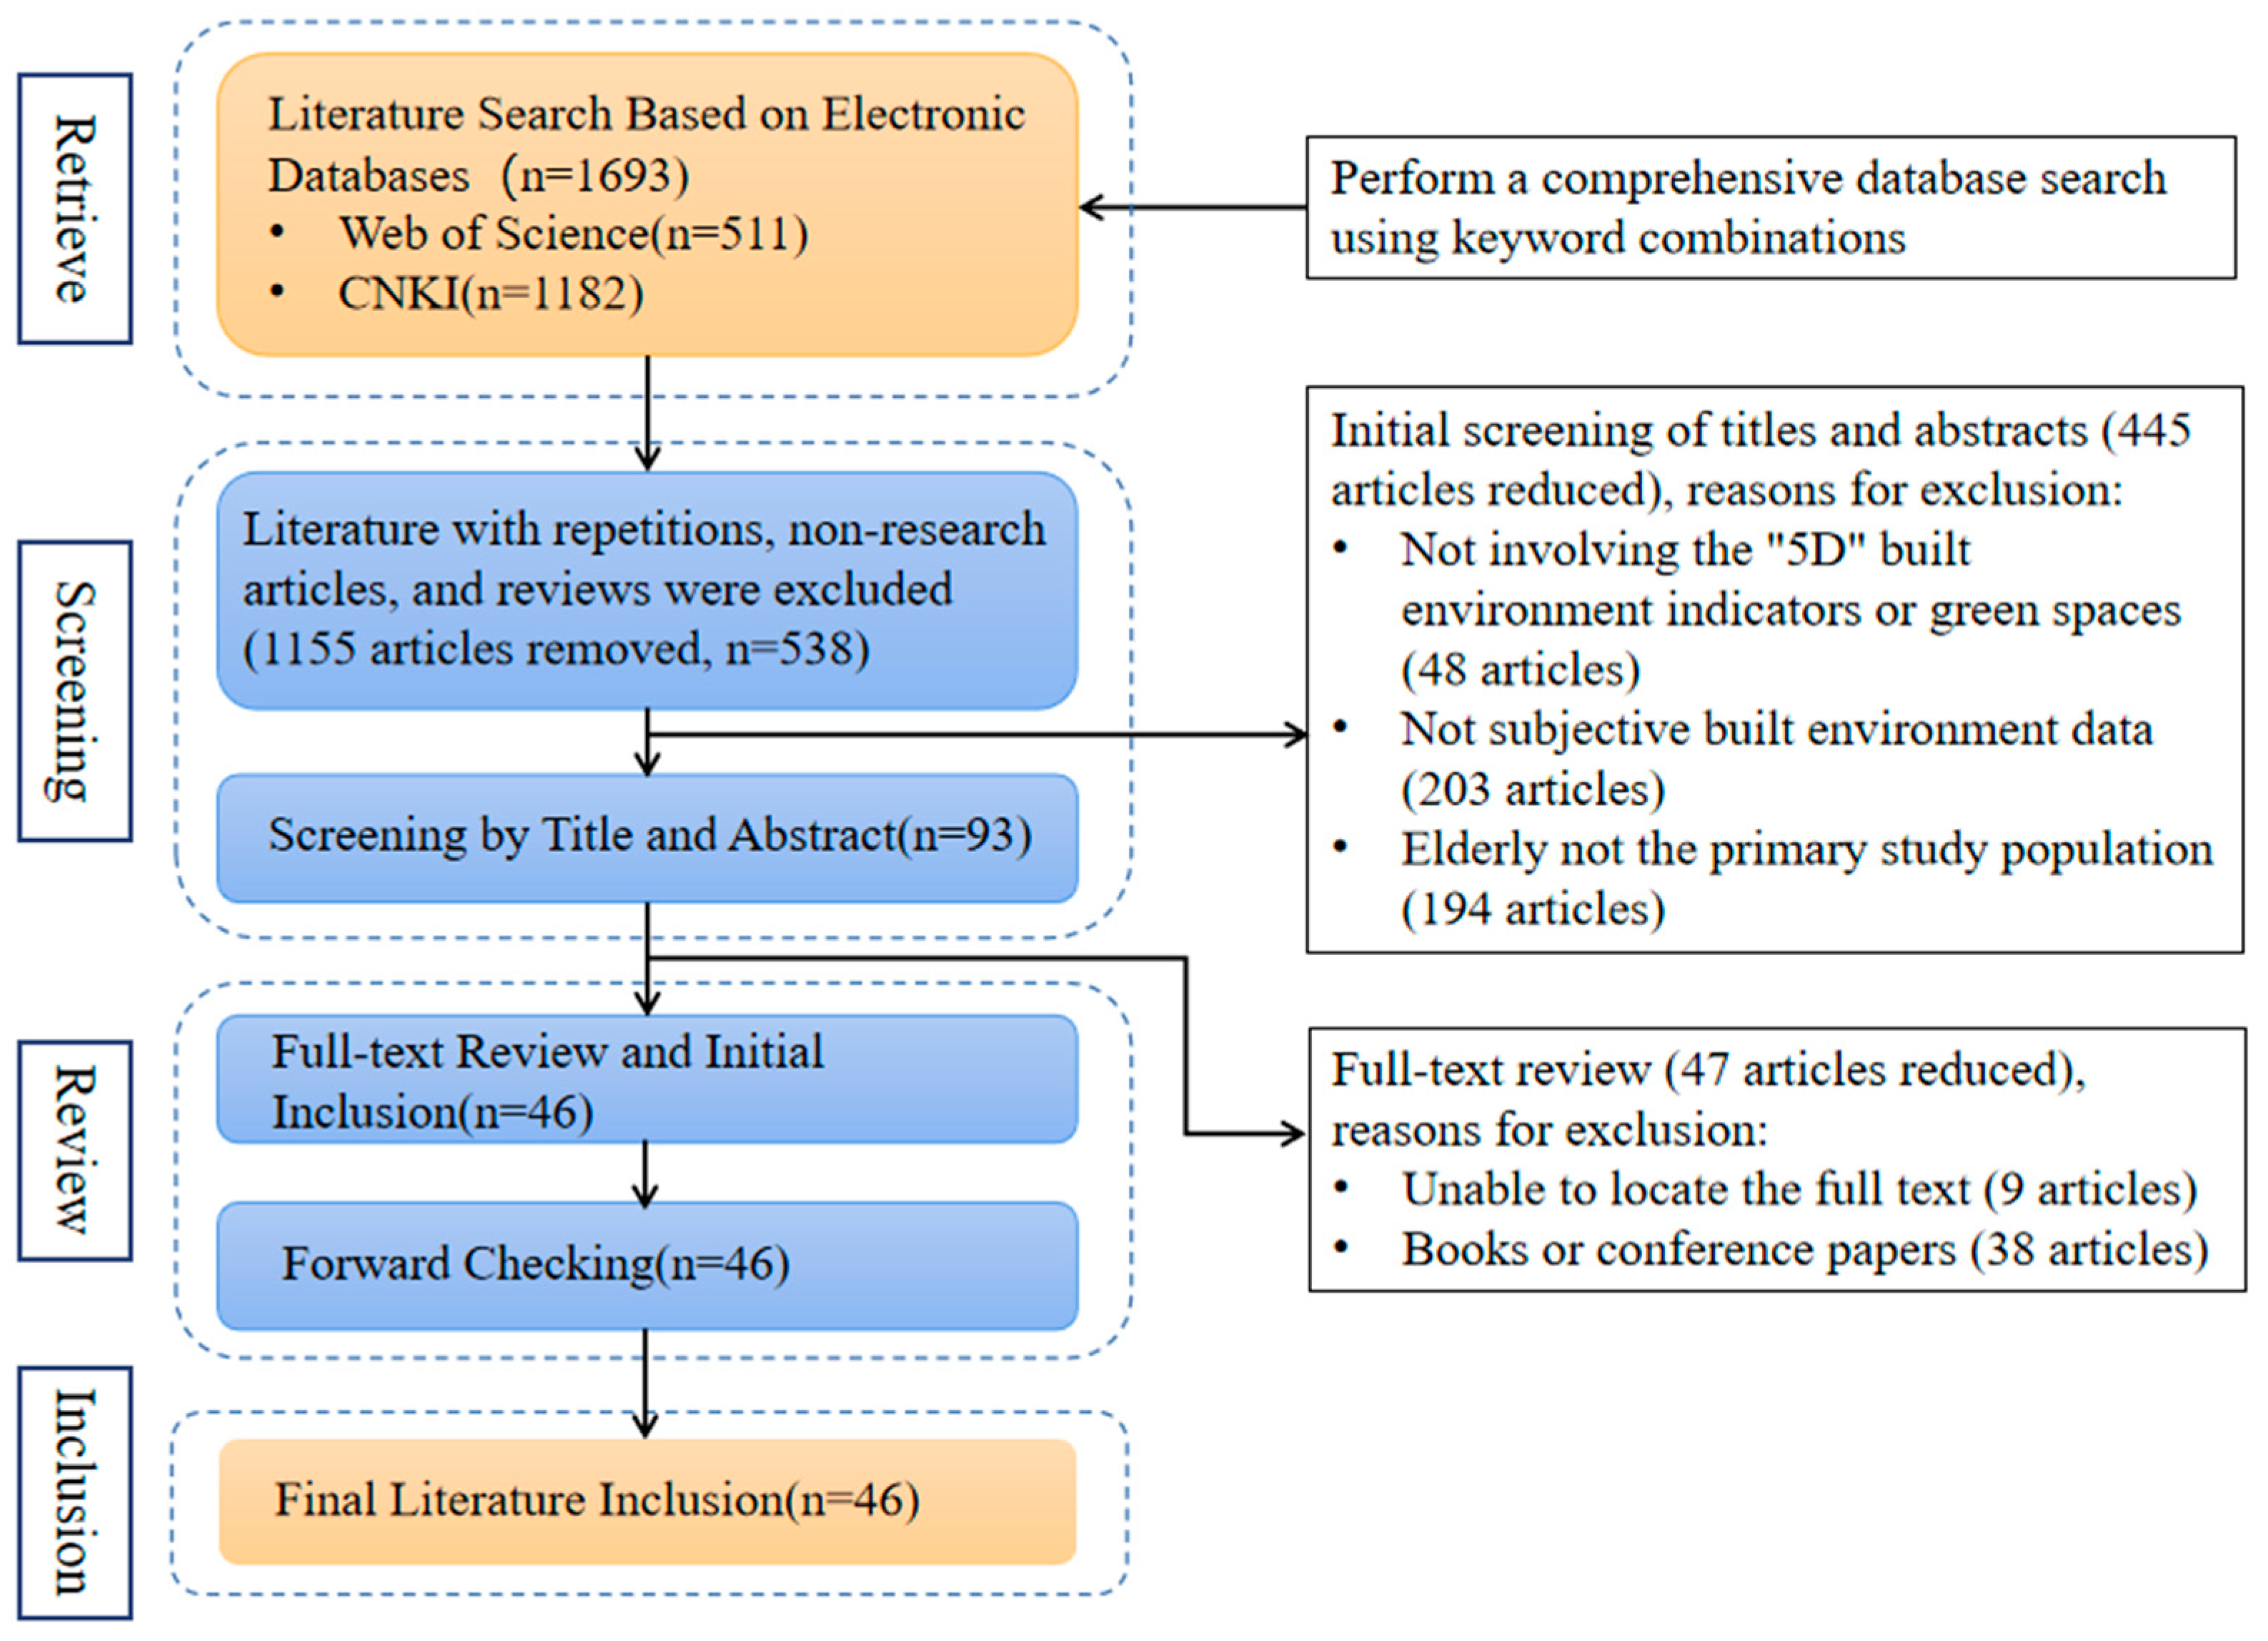
2. Methods
- The article type was primary research article;
- The language of publication was English or Chinese;
- the study population focused on elder adults;
- the BE exposure variables included “5D” elements or green spaces;
- TB characteristics examined walking, cycling, or public transportation use.
- The article type was a review article;
- The language of publication was neither English nor Chinese;
- The study population did not align with the definition of older adults used in this study;
- The BE exposure was assessed only through subjective measures.
3. Results
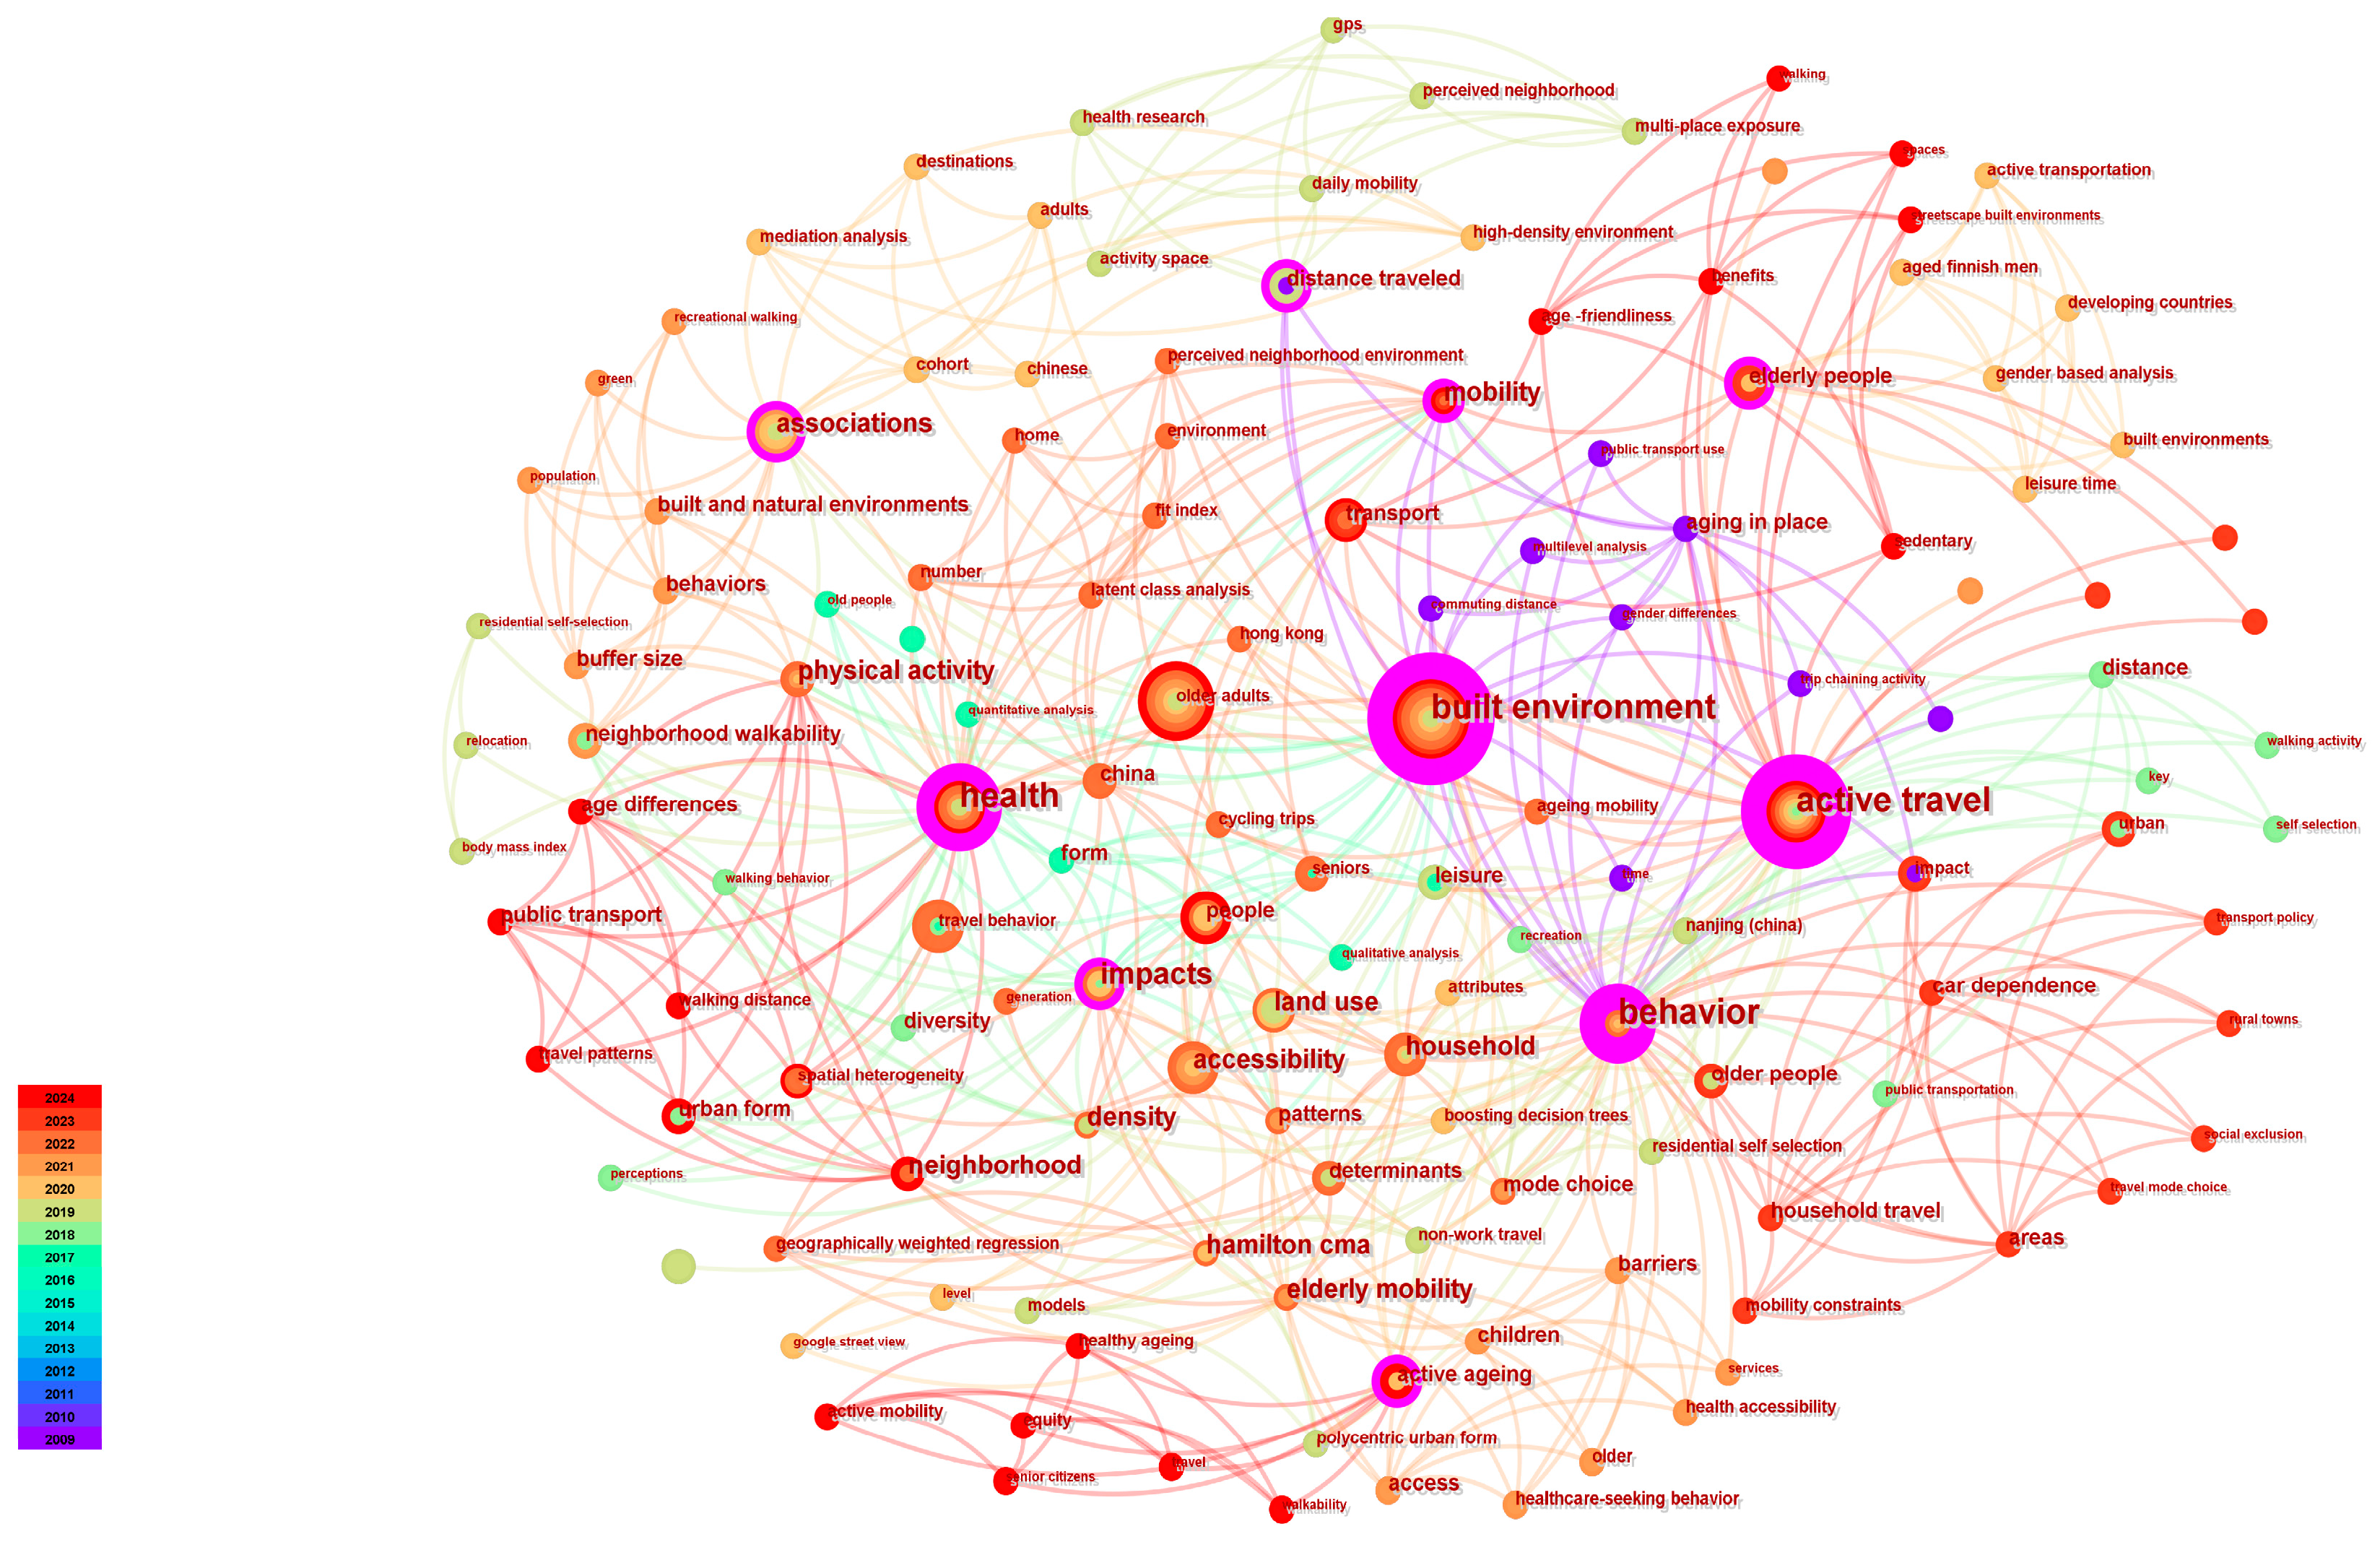
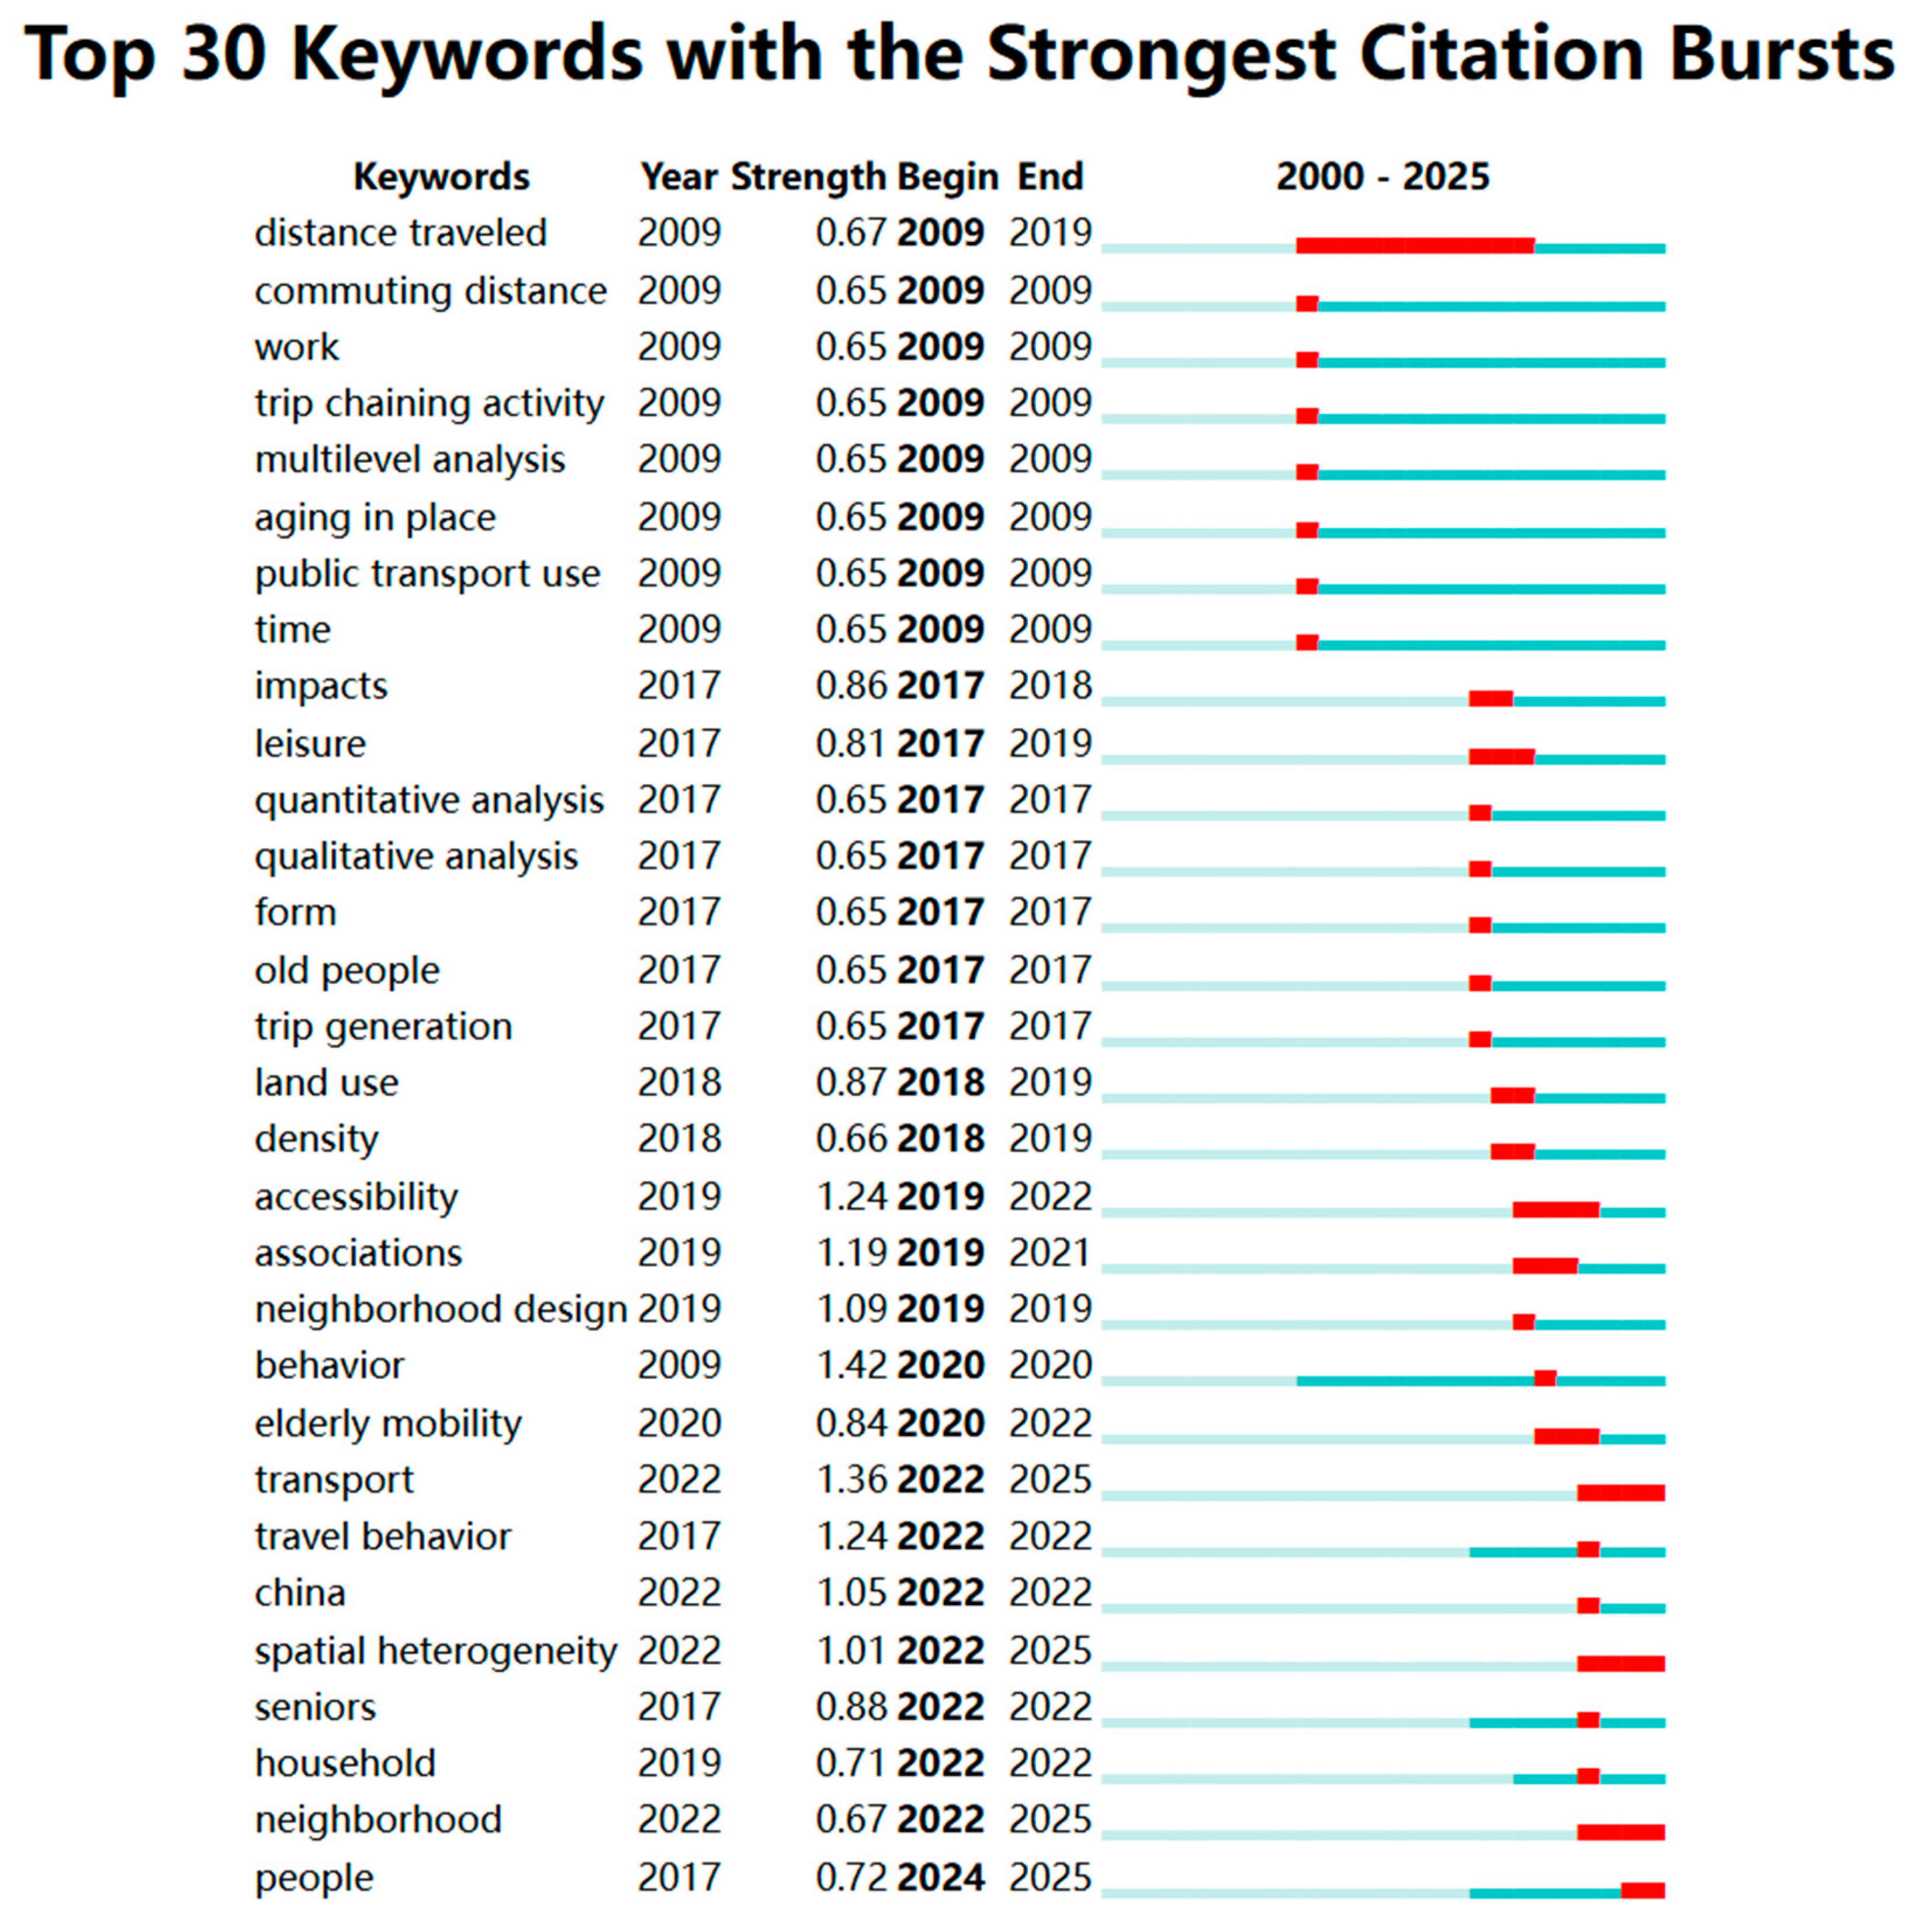
3.1. Visual Analysis of Literature
3.2. Theoretical Frameworks for Examining BE-TB Associations
3.2.1. Theoretical Basis
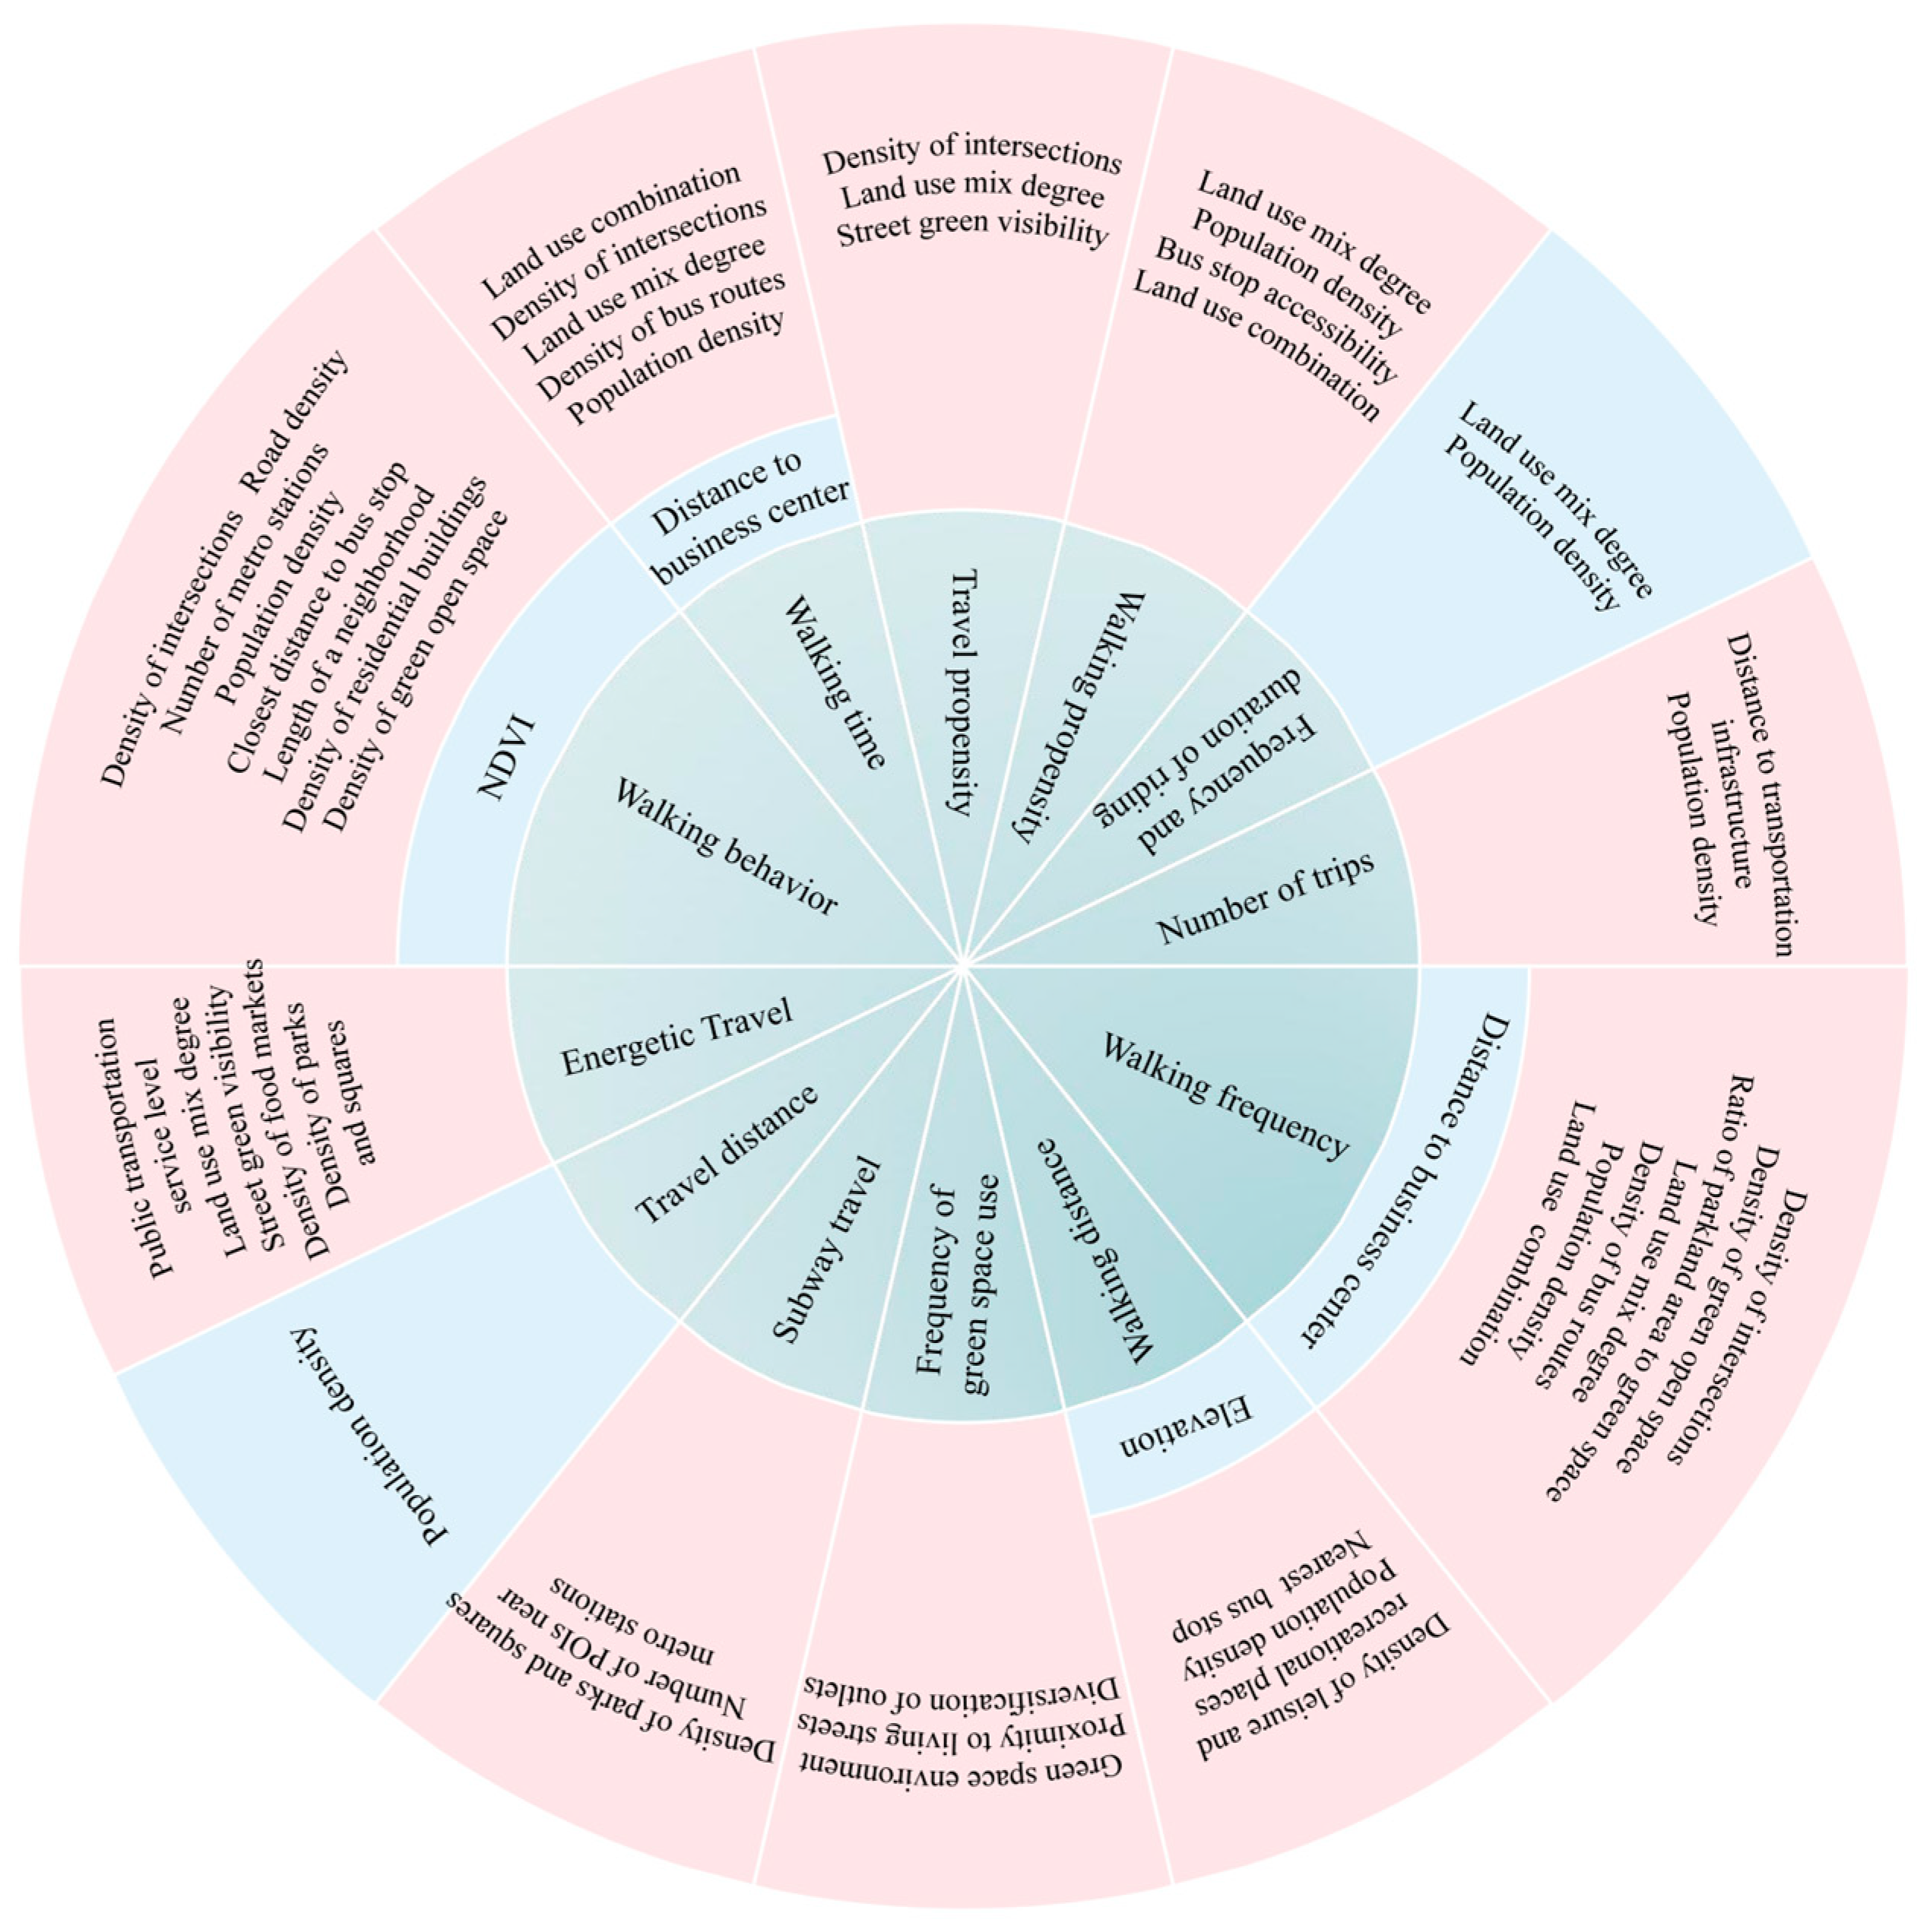
3.2.2. Approaches for Quantifying the TB and BE
3.2.3. Statistical Strategies for Examining BE-TB Associations
3.3. Empirical Evidence on Environmental and Individual Determinants for TB
3.3.1. BE Determinants for Elderly Travel
3.3.2. Main Individual Determinants for Elderly Travel
3.3.3. Regional Differences
4. Discussion
5. Conclusions
5.1. Strategies to Promote Mobility for the Elderly
- (1)
- Aging-friendly Community
- (2)
- Planning and Improvement of Public Transportation
- (3)
- Preferential Policies for the Elderly
- (4)
- Optimizing Built Environment Using Big Data and Machine Learning Models
5.2. Future Perspective
- (1)
- Expanding research to diverse urban contexts. Current research predominantly focuses on major cities such as Beijing, Shanghai, and Nanjing, with limited attention to border cities and other regions. Future studies should conduct comparative analyses across a wider range of urban settings, incorporating diverse regional development levels and lifestyles. Such efforts will enhance the understanding of overall travel patterns and health outcomes among older adults in different contexts.
- (2)
- Promoting interdisciplinary integration. The study of elderly TB has gathered interest from disciplines including urban planning, sociology, psychology, geography, and transportation. Future research should further integrate these disciplines, combining insights with public policy frameworks to provide a more holistic understanding of elderly TB.
- (3)
- Enhancing BE adaptations. Municipal departments should prioritize BE factors that significantly influence elderly TB. Strengthening barrier-free facilities, optimizing public transportation, implementing aging-friendly modifications, and addressing specific needs can enhance the safety, convenience, and comfort of travel, thereby improving the quality of life and social participation of older adults.
- (4)
- Understanding health-related attitudes and perceptions. Health-related attitudes, such as health awareness and preferences for active travel, likely influence TB. Future research should investigate how perceptions and experiences with transportation options affect travel choices among the elderly. Key questions include: What role do transportation-related attitudes play in shaping TB? How does health awareness influence mode choice? How do perceptions and attitudes towards travel evolve over time, and to what extent do they affect TB?
- (5)
- Currently, research predominantly focuses on eastern coastal cities or high-density urban areas, while studies on western cities or low-density regions remain relatively scarce. However, as China’s urbanization process accelerates and the population ages, the travel issues faced by the elderly in western cities and low-density areas have become increasingly apparent. Therefore, in future research endeavors in this field, there should be an appropriate increase in the proportion of studies dedicated to western cities or low-density regions. This not only contributes to promoting sustainable and balanced development across the country but also facilitates a more comprehensive understanding of the characteristics and patterns of elderly travel behavior in diverse geographical locations and population densities. Furthermore, it provides a scientific basis for formulating more targeted and effective policies to address elderly travel needs, thereby better satisfying their travel demands and enhancing their quality of life.
Author Contributions
Funding
Conflicts of Interest
Abbreviations
| WOS | Web of Science |
| CNKI | China National Knowledge Infrastructure |
| BE | Built environment |
| TB | Travel behavior |
Appendix A

| No. | Reference | City | Sample Size | Data Source | Study Population (Years) | Research Methods | Research Design Type |
|---|---|---|---|---|---|---|---|
| 1 | Chen et al., 2023 [69] | Chong qing | 391 | Data on pedestrian-vehicle collision accidents involving elderly pedestrians in Chongqing’s Yuzhong District from 2010 to 2021 | Seniors (>60) | Extreme Gradient Boosting Model (XGBoost) | Cross sectional |
| 2 | Xu et al., 2023 [62] | Chong qing | 2698 | Large-scale resident travel survey conducted in Chongqing in 2016 | Seniors (>65) | Multiscale Geographically Weighted Regression Model | Cross sectional |
| 3 | Yang et al., 2023 [65] | Wuhan | 1,098,390 | Data from subway card swiping in Wuhan City for a continuous week in March 2019 | Seniors (>65) | Gradient Boosting Decision Tree Model | Cross sectional |
| 4 | Li et al., 2023 [58] | Dalian | 597 | Questionnaire survey | Seniors (>60) | Multilevel Linear Model | Cross sectional |
| 5 | Shi et al., 2022 [66] | Guiyang | 6185 | Survey data on the travel patterns of Guiyang residents in 2021 | Seniors (>60) | Gradient Boosting Decision Tree Model | Cross sectional |
| 6 | Yang et al., 2023 [53] | Hong Kong | 12,620 | Data from the household interview survey conducted in the large-scale travel habit survey by the Transport Department of Hong Kong from 2011 to 2012 | Seniors (>65) | Multilevel Binary Logistic Regression Model, Geographically Weighted Binary Logistic Regression Model | Cross sectional |
| 7 | Wu et al., 2022 [73] | Nanjing | 590 | Survey data on resident travel patterns in Nanjing in 2013 | Seniors (>60) | Random Forest Model | Cross sectional |
| 8 | Yang et al., 2022 [42] | Xiamen | 93,861 | Survey on Residents’ TBs in Xiamen in 2015 | Seniors (>60) | Multilevel Binary Logit Model, Multilevel Negative Binomial Regression Model | Cross sectional |
| 9 | Liu et al., 2021 [70] | Xiamen | 93,812 | Survey on Residents’ TBs in Xiamen in 2015 | Seniors (>60) | Extreme Gradient Boosting Decision Tree Model | Cross sectional |
| 10 | Wang et al., 2020 [46] | Dalian | 204 | Questionnaire survey | Seniors (>60) | Multiple Regression Model | Cross sectional |
| 11 | Liu et al., 2018 [43] | Shang hai | 606 | Questionnaire survey | Seniors (>60) | Linear Regression Analysis Model | Cross sectional |
| 12 | Feng et al., 2016 [3] | Nanjing | 969 | Survey Data on Residents’ TBs in Nanjing in 2012 | Seniors (>60) | Ordered Logit Model (OLM), Ordi-nary Least Square (OLS) | Cross sectional |
| 13 | Wang et al., 2022 [55] | Chong qing | 325 | Questionnaire survey | Seniors (>60) | Multinomial Logistic Regression Model | Cross sectional |
| 14 | Li et al., 2021 [59] | Dalian | 597 | Questionnaire Survey on Walking Efficiency of Elderly People in Dalian in 2019 | seniors | Multilevel Linear Model | Cross sectional |
| 15 | Feng et al., 2016 [44] | Nanjing | 969 | Survey on Travel Patterns of Nanjing Residents | Seniors (>50) and Retirees | Ordered Logit Model, Ordered Probit Model, Linear Regression Model | Cross sectional |
| 16 | Zang et al., 2019 [50] | Hong Kong | 3961 | Survey on Travel Characteristics of Hong Kong in 2011 | Seniors (>65) | logistic regression model | Cross sectional |
| 17 | Cheng et al., 2019 [14] | Nanjing | 4474 | Survey data on residents’ travel patterns from household interviews in Nanjing in 2013 | Youth (>6) and seniors (>60) | Zero-Inflated Ordered Probit Model, Cox Proportional Hazards Model | Cross sectional |
| 18 | Wang et al., 2019 [74] | Beijing | 229 | Activity-travel diary data of 229 households in Beijing before and after relocation | all age groups | Dual-Wave Structural Equation Model | Longitudinal |
| 19 | Yang et al., 2022 [61] | Wuhan | - | March 2018 Wuhan Subway Smart Card Data | Seniors (>60) | geographically weighted regression (GWR) | Cross sectional |
| 20 | Xiong et al., 2024 [40] | Guiyang | 436 | Questionnaire survey | Seniors (>65) | Mixed Geographically Weighted Regression Model | Cross sectional |
| 21 | Guo et al., 2023 [60] | Xiamen | 93,861 | Survey on Residents’ Travel Patterns in Xiamen in 2015 | Seniors (>60) | BO-LightGBM | Cross sectional |
| 22 | Du et al., 2021 [37] | Beijing | 915 | Conducted face-to-face interviews at nine top-tier hospitals in Beijing in 2019 | Seniors | Multinomial Logit Model | Cross sectional |
| 23 | Yang et al., 2022 [33] | Hong Kong | 10,700 | Extracted data on elderly (outdoor) walking behavior from the Survey on Travel Characteristics of Hong Kong in 2011 | Seniors (>65) | Logistic Regression Model, Geographically Weighted Logistic Regression Model | Cross sectional |
| 24 | Mercado et al., 2009 [47] | Hamilton | 16,190 | Data from the Hamilton CMA in Canada | All age groups | Multilevel models | Cross sectional |
| 25 | Cheng et al., 2020 [15] | Nanjing | 702 | 2013 Nanjing Household Travel Survey | Seniors (>60) | Random Forest Model | Cross sectional |
| 26 | Shi et al., 2022 [68] | Nanjing | 20 w | Smart Card Data of Nanjing in 2019 | Seniors (>60) | Gradient Boosting Regression Tree Model (GBRT) | Cross sectional |
| 27 | Liu et al., 2020 [75] | Denver | 9248 | Survey records of RTD subway users in Denver, Colorado | Youth (19–64) and Seniors (>65) | Multinomial probit model | Cross sectional |
| 28 | Cerin et al., 2020 [76] | Hong Kong | 909 | Project on Active Lifestyles and Environments for Chinese Elders | Seniors (>65) | Generalized Additive Mixed Model (GAMM) | Cross sectional |
| 29 | Hou 2019 [38] | Singapore | 25,922 | 2012 Household Travel Survey through Interviews in Singapore | Youth (20–54) and Seniors (>55) | Individual TB Model, Zero-Inflated Ordered Choice Model | Cross sectional |
| 30 | Ning et al., 2021 [41] | Qingdao | 331.4 w | Qingdao Subway Smart Card Data | All age groups | Negative Binomial Regression Model | Cross sectional |
| 31 | Hatamzadeh et al., 2020 [51] | Rasht | 600 | Rasht Household Travel Survey | Seniors (>60) | Binary Logit Model | Cross sectional |
| 32 | Yang et al., 2022 [34] | Xiamen | 11,732 | Survey data on residents’ travel patterns in Xiamen in 2015 | Seniors (>65) | Simultaneous equations model | Cross sectional |
| 33 | Yang et al., 2022 [52] | Chiba City | 2003 | The 6th Tokyo Metropolitan Area Person Trip Survey | Seniors (>65) | Ordered logistic model, Duration models | Cross sectional |
| 34 | Zhao et al., 2023 [56] | China | 12,439 | National survey data from 119 townships in China | All age groups | Multinomial Logit Model (MNL) | Cross sectional |
| 35 | Yang et al., 2021 [16] | Hong Kong | 101,385 | Survey on Travel Characteristics of Hong Kong in 2011 | Seniors (>65) | Random Forest Model | Cross sectional |
| 36 | Büttner et al., 2024 [48] | Munich | 11430 | Data from the Munich National Mobility Survey | Youth (18–64) and Seniors(>65) | Regression Model | Cross sectional |
| 37 | Yang et al., 2020 [54] | Hong Kong | 19,703 | Survey data on travel characteristics of Hong Kong in 2011 | Seniors (>60) | Logistic regression model, Multilevel logistic regression model, Geographically weighted logistic regression model | Cross sectional |
| 38 | Perchoux et al., 2019 [49] | Luxembourg | 471 | LuxCohort questionnaire and VERITAS questionnaire | Seniors (>65) | multilevel logistic regressions | Cross sectional |
| 39 | Lu et al., 2018 [79] | Hong Kong | 720 | Questionnaire survey | Seniors (>65) | Multilevel mixed models | Cross sectional |
| 40 | Wang et al., 2020 [45] | Netherlands | 66,880 | Dutch National Travel Survey (2015–2017) | All age groups | Tobit Regression Model | Cross sectional |
| 41 | Ma et al., 2022 [78] | Dalian | 533 | Questionnaire survey | Seniors (>60) | Zero-Inflated Poisson Regression Model (ZIP) | Cross sectional |
| 42 | Yang et al., 2018 [17] | America | 104,613 | 2009 National (US) Household Travel Survey | Adults (45–64) | linear regression models and logistic regression models | Cross sectional |
| 43 | Hong et al., 2024 [57] | Shang hai | 4429 | 2021 Shanghai Jiading District Resident Travel Survey | Seniors (>60) | Mixed Logit Model | Cross sectional |
| 44 | Zhu et al., 2025 [71] | Shantou | 1109 | Data from the 2021 Shantou Resident Travel Survey | Seniors (>60) | eXtreme Gradient Boosting (XGBoost) | Cross sectional |
| 45 | He et al., 2025 [72] | Guiyang | 463 | Questionnaire survey | Seniors (>60) | eXtreme Gradient Boosting (XGBoost) | Cross sectional |
| 46 | Liu et al., 2024 [63] | Guang zhou | 21,897 | Survey data from the Guangzhou Transportation Bureau in 2017 | Seniors (>60) | Generalized Additive Mixed Model (GAMM) | Cross sectional |
| No. | Built Environment Elements | Research Variable | Dependent Variable | |||||
|---|---|---|---|---|---|---|---|---|
| Density | Diversity | Design | Distance | Destination | Green Area | |||
| 1 | √ | √ | √ | √ | √ | Number of Public Transport Stops, Pedestrian Overpasses, Zebra Crossings and Underpasses, Population Density, Recreational and Entertainment Venue Density, Daily Life Service Facilities Density, Medical Facilities Density, Land Use Entropy Index, Distance to CBD, Road Network Length | Accident frequency of elderly pedestrians | |
| 2 | √ | √ | √ | √ | √ | √ | Population Density, Vegetable Market Density, Supermarket Density, Park and Plaza Density, Land Use Mix, Road Network Density and Intersection Density, Street Greenery Rate, Bus Stop Density, Distance to City Center | Walking time of the elderly |
| 3 | √ | √ | √ | √ | √ | Number of Parks and Plazas, General Hospitals, Shopping Centers, Catering Facilities, Primary Schools and Kindergartens, Farmers’ Markets and Senior Activity Centers, Permanent Resident Elderly Population, Building Floor Area Ratio, Land Use Mix, Road Network Density, Intersection Density, Distance to City Center, Distance to Suburban Center, Bus Stop Density | Travel distance, frequency, time, duration, and direction of the elderly | |
| 4 | √ | √ | √ | √ | NDVI, Intersection Density, Road Network Density, Residential Area Openness, Time to Bus Stops, Public Service Facilities, Landscape Facilities, Bus Stop Density | Convenience of public transportation for the elderly | ||
| 5 | √ | √ | √ | √ | Number of Intersections, Vegetable Markets, Supermarkets, Pharmacies, Parks, Chess and Card Rooms, Distance to Bus Stop, Distance to City Center | Decision-making on travel modes for the elderly | ||
| 6 | √ | √ | √ | √ | √ | Population Density, Land Use Mix, Intersection Density, Metro Accessibility, Bus Accessibility, Recreational and Sports Facility Accessibility, Park Accessibility, Green View Ratio | Travel tendency (whether they traveled in the past 24 h) | |
| 7 | √ | √ | √ | √ | √ | Proximity to Metro Stations, Proximity to Public Service Facilities, Number of Intersections, Number of Public Bicycle Stations, Greenery Proportion, Residential Density, Non-Motorized Traffic Network Density, Land Use Mix | Slow travel time of the elderly group | |
| 8 | √ | √ | √ | √ | √ | Population Density, Land Use Mix, Intersection Density, Bus Route Density, Distance to Commercial Facilities | Travel tendency and frequency of the elderly | |
| 9 | √ | √ | √ | √ | √ | Population Density, Floor Area Ratio, Land Use Mix, Road Intersection Density, School Density, Park Density, Shop Density, Restaurant Density, Distance to City Center, Bus Stop Density | Whether the elderly engaged in vital travel within 24 h | |
| 10 | √ | √ | √ | √ | √ | Number of Comprehensive Parks, Community Parks, Leisure Facilities, Service Facilities, Streets Adjacent to Green Spaces and Road Intersections, Quantity of Scenic Recreation Green Spaces, Adjacent Street Nature to Green Spaces, Type of Green Space, Minimum Proximity Distance, Spatial Distribution Density, Quality of Green Spaces, Scale of Green Spaces | Green space utilization rate of the elderly | |
| 11 | √ | √ | √ | √ | Number of Public Service Facilities such as Commercial, Medical, Cultural, Recreational, and Public Restrooms, Land Use Mix, Road Network Density, Intersection Density, Bus Route and Stop Density | Travel purpose, frequency, time consumption, and mode | ||
| 12 | √ | √ | √ | √ | Number of Bus Stops, Sports Stadiums, Movie Theaters, Museums, Cultural Centers, Chess Card Rooms, Parks and Plazas, Population Density, Diversity of Land Use, Distance to the Nearest Subway Station, Distance to the Nearest Large Shopping Mall | Travel time, frequency, and distance | ||
| 13 | √ | √ | √ | √ | √ | Road Network Density, Block Edge Length, Intersection Density, Road Segment Node Ratio, Land Use Mix, Commercial Facility Density, Cultural and Entertainment Facility Density, Educational Facility Density, Medical Facility Density, Public Transport Terminal Density, Park and Green Space Area Ratio, Green Open Space Density | Frequency of walking trips | |
| 14 | √ | √ | √ | √ | Nighttime Light Radiation Brightness Value, Building Floor Area Ratio, Public Service Facility Density, Intersection Density, Road Network Density, NDVI | Walking efficiency | ||
| 15 | √ | √ | √ | √ | √ | Population Density, Land Use Mix, Car Traffic Accessibility, Public Transit Service Accessibility, Distance to the Nearest Subway Station, Number of Road Intersections, Average Road Width, Distance to the Nearest Supermarket/Convenience Store or Farmers’ Market | Activity participation and daily travel distance of the elderly | |
| 16 | √ | √ | √ | √ | √ | Urban green exposure level, Population density, street connectivity, Land use mix, Distance to the nearest subway station, Number of retail stores | Travel willingness, travel frequency, total travel distance, total travel time, total walking time, and number of motorized trips | |
| 17 | √ | √ | √ | √ | Number of bus stops, bike-sharing stations, parking lots, Population density, Land use mixture, Distance to the nearest shopping mall, Distance to the nearest convenience store, Distance to the nearest market, Distance to the nearest park/square, Distance to the nearest chess/card room, Distance to the nearest gym/sports center, Arterial density, Distance to the nearest metro station | Frequency and duration of active travel | ||
| 18 | √ | √ | √ | Distance to the city center, Population density, Commuting distance, Metro accessibility | Travel preferences, total travel time, number of private car trips, number of public transport trips, and number of non-motorized trips | |||
| 19 | √ | √ | √ | √ | √ | Number of intersections, general hospitals, parks, commercial facilities, and bus stops, Elderly population density, Building Floor area ratio, Degree of land use mixture, Distance from the city center, Distance from the sub city center, Station area road length | Subway passenger flow and travel distance of the elderly | |
| 20 | √ | √ | √ | √ | √ | Population density, residential density, Road network density, Slope, land use mix, Destination accessibility, Distance to the nearest park and bus stop, Density of leisure and entertainment venues, Density of shopping malls, Density of bus stops | Walking distance of the elderly | |
| 21 | √ | √ | √ | √ | √ | Population density, Land use mix, Intersection density, Public transit line density, Distance to the nearest commercial, school, and recreational facilities, Density of commercial facilities, Density of recreational facilities, Density of school facilities | Tendency for active travel (whether to go out by biking or walking) | |
| 22 | √ | √ | √ | Main road length, Land use entropy, Development density, Parking easiness | Choice of travel mode | |||
| 23 | √ | √ | √ | √ | Population density, Land use mix, Intersection density, Number of bus stops, Green view ratio | Tendency for walking among the elderly | ||
| 24 | √ | √ | Low commercial and low residential, Low commercial and high residential, High commercial and low residential, High commercial and high residential | Travel distance | ||||
| 25 | √ | √ | √ | √ | √ | Population density, Land use mix, street connectivity, Number of bus stops and shared bike stations, Distance to the nearest square and park, Distance to the nearest chess and card room | Daily walking time | |
| 26 | √ | √ | √ | Employment density, Distance to the nearest bike station, Distance to the nearest bus stop, Distance to the nearest chess/card room, Distance to the nearest convenience store, Distance to the nearest park/open square, Distance to the nearest restaurant, Number of Sport/gym, Number of tourist attractions | Travel time of the elderly | |||
| 27 | √ | √ | √ | Bus connectivity, interchange density, Land use mix degree, Parking capacity, Population density, Urban station | Entry and exit methods, travel purposes, station choices, and travel times of the elderly using rail transit | |||
| 28 | √ | √ | Residential density, Civic and institutional destination density, Recreation density, Public transport density | Walking frequency and duration | ||||
| 29 | √ | √ | √ | Regional accessibility to commercial/activity centers, Neighborhood land use characteristics (LUDIV, etc.), Number of community service facilities, cultural facilities, sport, recreational facilities, food courts/restaurants, religious establishments, Proportion of the elderly population | Frequency of non-work-related travel using different modes of transportation | |||
| 30 | √ | √ | √ | Number of bus stops, road intersections, metro station entrances or exits, elementary and middle schools, tertiary hospitals, supermarkets, squares, parks, and scenic spots in 800m buffe, Whether the station is in the main urban area | Subway passenger flow for different groups of people | |||
| 31 | √ | √ | √ | Land use mix, connectivity, Population density, Whether the trip destination is to the CBD, Whether the trip destination is to a main area of business | Whether to choose walking | |||
| 32 | √ | √ | √ | √ | Population density, Land-use mix, Intersection density, Distance to commercial center, Bus route density | Walking frequency and walking duration | ||
| 33 | √ | √ | √ | √ | √ | Population density, Road density, Number of bus stops, Distance to the nearest rail transport station, Number of medical centers, Number of parks, Distances to the nearest gym/sports center, Land use mix | Frequency and duration of walking and cycling | |
| 34 | √ | √ | √ | √ | √ | Distance to urban center, Distance to highways, Access bus stop, Bus frequency, Settlement size, Design compact, Land use mix entropy, Population density, Provision of local, Services Intersection density, Availability of parking | Choice of travel mode | |
| 35 | √ | √ | √ | √ | √ | √ | Land use mix, Intersection density, Bus accessibility, Recreational facility accessibility, Street greening | Walking preference of the elderly towards streetscape greening |
| 36 | √ | √ | √ | √ | Population density, Points of Interest density, Cycling infrastructure, Street intersection density, Number of green area infrastructure, benches and toilets, The population served at 300 m walking distance from public transport stops | Whether bicycles are used and the frequency of use | ||
| 37 | √ | √ | √ | √ | √ | Population density, Land use mix, Intersection density, Number of bus stops, Number of recreational and sports facilities in the neighborhood, Street greenery, Number of parks, NDVI | travel propensity | |
| 38 | √ | √ | √ | √ | Number of amenities, Number of public transport stops, Street connectivity, Greenness index | Travel purpose | ||
| 39 | √ | √ | √ | √ | Population density, Land-use mix, Street intersection density, Presence of MTR station, Number of bus stops, retail shops, and recreational facilities | Physical Activity | ||
| 40 | √ | √ | √ | √ | NDVI, Crossing density, Land use mix, Residential building density | Walking type | ||
| 41 | √ | √ | √ | √ | √ | Number of bus stops, Distance to the nearest bus stop Distance to the nearest recreational facility, Population density, Land use mix entropy, Road density | Walking frequency | |
| 42 | √ | √ | √ | Population density, Intersection density, Distance to the nearest park, and walkscore | the total number of daily trips, travel purpose diversity, total travel distance, maximum distance traveled, whether a person has at least one active travel (by walking or by bicycle), and total distance traveled by active modes | |||
| 43 | √ | √ | √ | √ | √ | Land use mix degree, road network density, population density, density of public service facilities POI, road network distance to the city center, distance to the nearest subway station, and bus stop density | Mode of transportation | |
| 44 | √ | √ | √ | √ | √ | Land use mix, population density, residential density, NDVI, number of bus stops, number of intersections, and number of parks | Travel time | |
| 45 | √ | √ | √ | √ | √ | Slope, population density, bus stop density, Shopping store density, road network density, residential density, distance to the nearest park, distance to the nearest bus stop, land use mix degree, leisure and entertainment density | Walking distance | |
| 46 | √ | √ | √ | √ | Road surface ratio, street obstacles, Street safety, Street greenery, Street design, Street vitality, Density of community centers, Density of various POI (Points of Interest), Intersection density, building density, Population density | Active travel time | ||
References
- Gao, C.; Li, J.; Zhang, Q.; Xin, T. China Aging Development Report (2024); Social Sciences Academic Press: Beijing, China, 2024; Available online: https://www.pishu.com.cn/skwx_ps/bookdetail?ID=15740411&SiteID=14&utm_source=chatgpt.com (accessed on 25 February 2025).
- CPC News Network. Implementing the National Strategy of Actively Responding to Population Aging. 2020. Available online: http://theory.people.com.cn/n1/2020/1217/c40531-31969360.html (accessed on 25 February 2025).
- Feng, J.; Yang, Z. Influencing Factors of Travel Behavior of Urban Elderly in Nanjing. Prog. Geogr. 2015, 34, 1598–1608. [Google Scholar] [CrossRef]
- Paez, A.; Scott, D.; Potoglou, D.; Kanaroglou, P.; Newbold, K.B. Elderly Mobility: Demographic and Spatial Analysis of Trip Making in the Hamilton CMA, Canada. Urban Stud. 2016, 44, 123–146. [Google Scholar] [CrossRef]
- Mahmoudi, J.; Zhang, L. Impact of the Built Environment Measured at Multiple Levels on Nonmotorized Travel Behavior: An Ecological Approach to a Florida Case Study. Sustainability 2020, 12, 8837. [Google Scholar] [CrossRef]
- Ewing, R.; Cervero, R. Travel and the Built Environment: A Meta-Analysis. J. Am. Plan. Assoc. 2010, 76, 265–294. [Google Scholar] [CrossRef]
- Mirzaei, E.; Kheyroddin, R.; Mignot, D. Exploring the effect of the built environment, weather condition and departure time of travel on mode choice decision for different travel purposes: Evidence from Isfahan, Iran. Case Stud. Transp. Policy 2021, 9, 1419–1430. [Google Scholar] [CrossRef]
- Cerin, E.; Nathan, A.; Van Cauwenberg, J.; Barnett, D.; Barnett, A. The Neighbourhood Physical Environment and Active Travel in Older Adults: A Systematic Review and Meta-Analysis. J. Transp. Health 2017, 5, S11. [Google Scholar] [CrossRef]
- Li, M.; Hu, G.; Huang, J. Research on the Demand Characteristics of Community Service Facilities for the Elderly in Shanghai: Based on the Perspective of Walking Abilities Difference. Shanghai Urban Plan. 2017, 1, 25–31. [Google Scholar] [CrossRef]
- Cervero, R.; Kockelman, K. Travel demand and the 3Ds: Density, diversity, and design. Transp. Res. Part D Transp. Environ. 1997, 2, 199–219. [Google Scholar] [CrossRef]
- Ewing, R.; Cervero, R. Travel and the Built Environment: A Synthesis. Transp. Res. Rec. J. Transp. Res. Board 2001, 1780, 87–114. [Google Scholar] [CrossRef]
- Wang, L.; Xu, Y.; Zhang, S.; Hu, Z. Construction of Healthy Urban District Evaluation System under the Strategy of “Healthy China”. Planners 2023, 39, 55–61. [Google Scholar]
- Zhang, J.; Yu, Z.; Cheng, Y.; Chen, C.; Wan, Y.; Zhao, B.; Vejre, H. Evaluating the disparities in urban green space provision in communities with diverse built environments: The case of a rapidly urbanizing Chinese city. Build. Environ. 2020, 183, 107170. [Google Scholar] [CrossRef]
- Cheng, L.; Chen, X.; Yang, S.; Cao, Z.; De Vos, J.; Witlox, F. Active travel for active ageing in China: The role of built environment. J. Transp. Geogr. 2019, 76, 142–152. [Google Scholar] [CrossRef]
- Cheng, L.; De Vos, J.; Zhao, P.; Yang, M.; Witlox, F. Examining non-linear built environment effects on elderly’s walking: A random forest approach. Transp. Res. Part D Transp. Environ. 2020, 88, 102552. [Google Scholar] [CrossRef]
- Yang, L.; Ao, Y.; Ke, J.; Lu, Y.; Liang, Y. To walk or not to walk? Examining non-linear effects of streetscape greenery on walking propensity of older adults. J. Transp. Geogr. 2021, 94, 103099. [Google Scholar] [CrossRef]
- Yang, Y.; Xu, Y.; Rodriguez, D.A.; Michael, Y.; Zhang, H. Active travel, public transportation use, and daily transport among older adults: The association of built environment. J. Transp. Health 2018, 9, 288–298. [Google Scholar] [CrossRef]
- Banister, D.; Bowling, A. Quality of life for the elderly: The transport dimension. Transp. Policy 2004, 11, 105–115. [Google Scholar] [CrossRef]
- Chen, W.; Cheng, L.; Chen, X.; Chen, J.; Cao, M. Measuring accessibility to health care services for older bus passengers: A finer spatial resolution. J. Transp. Geogr. 2021, 93, 103068. [Google Scholar] [CrossRef]
- Kroesen, M.; De Vos, J. Does active travel make people healthier, or are healthy people more inclined to travel actively? J. Transp. Health 2020, 16, 100844. [Google Scholar] [CrossRef]
- Pucher, J.; Buehler, R.; Bassett, D.R.; Dannenberg, A.L. Walking and Cycling to Health: A Comparative Analysis of City, State, and International Data. Am. J. Public Health 2010, 100, 1986–1992. [Google Scholar] [CrossRef]
- De Souto Barreto, P.; Cesari, M.; Andrieu, S.; Vellas, B.; Rolland, Y. Physical Activity and Incident Chronic Diseases: A Longitudinal Observational Study in 16 European Countries. Am. J. Prev. Med. 2017, 52, 373–378. [Google Scholar] [CrossRef]
- Schipperijn, J.; Cerin, E.; Adams, M.A.; Reis, R.; Smith, G.; Cain, K.; Christiansen, L.B.; Dyck, D.v.; Gidlow, C.; Frank, L.D.; et al. Access to parks and physical activity: An eight country comparison. Urban For. Urban Green. 2017, 27, 253–263. [Google Scholar] [CrossRef] [PubMed]
- Hou, Y.; Yap, W.; Chua, R.; Song, S.; Yuen, B. The associations between older adults’ daily travel pattern and objective and perceived built environment: A study of three neighbourhoods in Singapore. Transp. Policy 2020, 99, 314–328. [Google Scholar] [CrossRef]
- Yang, Y.; Sasaki, K.; Cheng, L.; Liu, X. Gender differences in active travel among older adults: Non-linear built environment insights. Transp. Res. Part D Transp. Environ. 2022, 110, 103405. [Google Scholar] [CrossRef]
- Terian, S.K. Creating Architectural Theory: The Role of the Behavioral Sciences in Environmental Design. J. Archit. Educ. 1988, 41, 60–61. [Google Scholar] [CrossRef]
- Moore, G. Environment and behavior research in North America: History, development and unresolved issues. In Handbook of Environmental Psychology; John Wiley, & Sons: New York, NY, USA, 1987; Volume 2, pp. 1359–1410. [Google Scholar]
- Ward, B.E.; Barth, F.J. Models of Social Organization; Royal Anthropological Institute of Great Britain & Ireland: London, UK, 1966; Volume 2, p. 316. [Google Scholar]
- Stokols, D. Translating Social Ecological Theory into Guidelines for Community Health Promotion. Am. J. Health Promot. 1996, 10, 282–298. [Google Scholar] [CrossRef] [PubMed]
- Saelens, B.E.; Sallis, J.F.; Black, J.B.; Chen, D. Neighborhood-based differences in physical activity: An environment scale evaluation. Am. J. Public Health 2003, 93, 1552–1558. [Google Scholar] [CrossRef]
- Elder, J.P.; Ayala, G.X.; Harris, S. Theories and Intervention Approaches to Health-Behavior Change in Primary Care. Am. J. Prev. Med. 1999, 17, 275–284. [Google Scholar] [CrossRef] [PubMed]
- Ajzen, I. The theory of planned behavior. Organ. Behav. Hum. Decis. Process. 1991, 50, 179–211. [Google Scholar] [CrossRef]
- Yang, C.; Tang, X.; Yang, L. Spatially varying associations between the built environment and older adults’ propensity to walk. Front. Public Health 2022, 10, 1003791. [Google Scholar] [CrossRef]
- Yang, L.; Tang, X.; Yang, H.; Meng, F.; Liu, J. Using a system of equations to assess the determinants of the walking behavior of older adults. Trans. GIS 2022, 26, 1339–1354. [Google Scholar] [CrossRef]
- Li, H.; Li, M.; Peng, P.; Long, Y.; Ao, Y.; Bahmani, H. Exploring non-linear effects of walking accessibility on well-being in rural older adults of Jintang County: A random forest analysis. Front. Public Health 2024, 12, 1333510. [Google Scholar] [CrossRef] [PubMed]
- Wang, X. Study on the Influence of Built Environment on the Space-Time Differentiation of Walking of the Elderly. Urban. Archit. 2023, 20, 134–140. [Google Scholar] [CrossRef]
- Du, F.; Mao, L.; Wang, J. Determinants of travel mode choice for seeking healthcare: A comparison between elderly and non-elderly patients. J. Transp. Geogr. 2021, 92, 103023. [Google Scholar] [CrossRef]
- Hou, Y. Polycentric urban form and non-work travel in Singapore: A focus on seniors. Transp. Res. Part D Transp. Environ. 2019, 73, 245–275. [Google Scholar] [CrossRef]
- Zhang, T.; Wang, Q.; Cheng, L.; He, G. Research on the intention of leisure-time walking in older adults that considers the built environment and social-psychological factors. J. Transp. Eng. Inf. 2024, 22, 152–165. [Google Scholar] [CrossRef]
- Xiong, R.; Zhao, H.; Huang, Y. Spatial heterogeneity in the effects of built environments on walking distance for the elderly living in a mountainous city. Travel Behav. Soc. 2024, 34, 100693. [Google Scholar] [CrossRef]
- Ning, J.; Lyu, T.; Wang, Y.; Yang, H. Exploring the Built Environment Factors in the Metro That Influence the Ridership and the Market Share of the Elderly and Students. J. Adv. Transp. 2021, 2021, 9966794. [Google Scholar] [CrossRef]
- Yang, L.; Tang, X.; Liu, J. Examining the Built Environment Suitable for the Elderly’s Travel under the Background of the National Strategy “Actively Addressing Population Aging”. Shanghai Urban Plan. Rev. 2022, 156–162. [Google Scholar] [CrossRef]
- Liu, J.; Hu, G.; Huang, J. Research on the Characteristics and Influencing Factors of Elderly People’s Travel in Rural Areas of Megacities: A Case Study of Shanghai. Urban Dev. Stud. 2018, 25, 135–139. [Google Scholar]
- Feng, J. The influence of built environment on travel behavior of the elderly in urban China. Transp. Res. Part D Transp. Environ. 2016, 52, 619–633. [Google Scholar] [CrossRef]
- Wang, Z.; Ettema, D.; Helbich, M. Objective environmental exposures correlate differently with recreational and transportation walking: A cross-sectional national study in the Netherlands. Environ. Res. 2021, 194, 110591. [Google Scholar] [CrossRef] [PubMed]
- Wang, X.; Yang, D. How the Built Environment Affect the Frequency of Green Space Used by the Elderly—Based on the Dual Perspective of Accessibility and Attractiveness. Chin. Landsc. Archit. 2020, 36, 62–66. [Google Scholar] [CrossRef]
- Mercado, R.; Páez, A. Determinants of distance traveled with a focus on the elderly: A multilevel analysis in the Hamilton CMA, Canada. J. Transp. Geogr. 2009, 17, 65–76. [Google Scholar] [CrossRef]
- Baquero Larriva, M.T.; Büttner, B.; Durán-Rodas, D. Active and healthy ageing: Factors associated with bicycle use and frequency among older adults—A case study in Munich. J. Transp. Health 2024, 35, 101772. [Google Scholar] [CrossRef]
- Perchoux, C.; Brondeel, R.; Wasfi, R.; Klein, O.; Caruso, G.; Vallée, J.; Klein, S.; Thierry, B.; Dijst, M.; Chaix, B.; et al. Walking, trip purpose, and exposure to multiple environments: A case study of older adults in Luxembourg. J. Transp. Health 2019, 13, 170–184. [Google Scholar] [CrossRef]
- Zang, P.; Lu, Y.; Ma, J.; Xie, B.; Wang, R.; Liu, Y. Disentangling residential self-selection from impacts of built environment characteristics on travel behaviors for older adults. Soc. Sci. Med. 2019, 238, 112515. [Google Scholar] [CrossRef]
- Hatamzadeh, Y.; Hosseinzadeh, A. Toward a deeper understanding of elderly walking for transport: An analysis across genders in a case study of Iran. J. Transp. Health 2020, 19, 100949. [Google Scholar] [CrossRef]
- Yang, Y.; Kuniaki, S.; Cheng, L.; Tao, S. Does the built environment matter for active travel among older adults: Insights from Chiba City, Japan. J. Transp. Geogr. 2022, 101, 103338. [Google Scholar] [CrossRef]
- Yang, L.; Zhu, Q. Spatial Heterogeneity of the Impact of Built Environment on Elderly Travel Behavior. J. Southwest Jiaotong Univ. 2023, 58, 696–703. [Google Scholar] [CrossRef]
- Yang, L.; Liu, J.; Lu, Y.; Ao, Y.; Guo, Y.; Huang, W.; Zhao, R.; Wang, R. Global and local associations between urban greenery and travel propensity of older adults in Hong Kong. Sustain. Cities Soc. 2020, 63, 102442. [Google Scholar] [CrossRef]
- Wang, Y.; Xiao, J.; Li, Q.; Ni, J.; Tan, S.; Peng, H. Analysis of Urban Built Environment Influence on Walking in the Elderly: An Empirical Research Based on 12 Residential Areas in Jiangbei District, Chongqing. Shanghai Urban Plan. 2022, 3, 122–128. [Google Scholar] [CrossRef]
- Yu, Z.; Li, P.; Schwanen, T.; Zhao, P.; Zhao, Z. Role of rural built environment in travel mode choice: Evidence from China. Transp. Res. Part D Transp. Environ. 2023, 117, 103649. [Google Scholar] [CrossRef]
- Hong, S.; Su, W.; Shi, Z.; Wang, Q. The Impact of Built Environment on the Travel Mode Choice of Elderly People in Suburban Areas Based on Mixed Logit Model. Integr. Transp. 2024. [Google Scholar] [CrossRef]
- Li, K.; Yang, D. Factors Influencing the Convenience of Bus Travel for the Elderly: Individual and Built Environment Elements. J. Transp. Syst. Eng. Inf. Technol. 2023, 23, 161–167. [Google Scholar] [CrossRef]
- Li, K.; Yang, D. Identification of Key Built Environment Elements Affecting the Walking Efficiency of Elderly People. J. Transp. Syst. Eng. Inf. Technol. 2021, 21, 245–250. [Google Scholar] [CrossRef]
- Guo, C.; Jiang, Y.; Qiao, R.; Zhao, J.; Weng, J.; Chen, Y. The nonlinear relationship between the active travel behavior of older adults and built environments: A comparison between an inner-city area and a suburban area. Sustain. Cities Soc. 2023, 99, 104961. [Google Scholar] [CrossRef]
- Yang, H.; Ruan, Z.; Li, W.; Zhu, H.; Zhao, J.; Peng, J. The Impact of Built Environment Factors on Elderly People’s Mobility Characteristics by Metro System Considering Spatial Heterogeneity. ISPRS Int. J. Geo-Inf. 2022, 11, 315. [Google Scholar] [CrossRef]
- Xu, J.; Chen, X.; Liu, K.; Chen, J. Spatial Heterogeneous Effects of Community Built Environment on Elderly Active Travel. J. Beijing Jiaotong Univ. 2023, 47, 103–111. [Google Scholar] [CrossRef]
- Liu, Y.; Wang, X.; Liu, Y.; Li, Y.; Ma, X.; Jin, A.; Song, C.; Yao, Y. Using the hierarchy of active travel needs to examine associations between streetscape environments and older adults’ active travel in China. J. Transp. Health 2024, 38, 101834. [Google Scholar] [CrossRef]
- Wali, B.; Frank, L.D.; Chapman, J.E.; Fox, E.H. Developing policy thresholds for objectively measured environmental features to support active travel. Transp. Res. Part D Transp. Environ. 2021, 90, 102678. [Google Scholar] [CrossRef]
- Yang, H.; Shen, L.; Hu, Y.; Zhang, Y.; Peng, J. Spatiotemporal Characteristics of Elderly Subway Travel and Its Nonlinear Relationship with the Built Environment: A Case Study of Wuhan City. Prog. Geogr. 2023, 42, 491–504. [Google Scholar] [CrossRef]
- Shi, Z.; Yan, C.; He, M.; Liu, Y.; He, M. Nonlinear Influence of Built Environment on Elderly Travel Mode Choice. J. Transp. Eng. Inf. 2023, 21, 49–63. [Google Scholar] [CrossRef]
- Friedman, J.H. Greedy Function Approximation: A Gradient Boosting Machine. Ann. Statist. 2001, 29, 1189–1232. [Google Scholar] [CrossRef]
- Shi, Z.; Liu, Y.; He, M.; Liu, Q.; Lee, J. How Does Built Environment Affect Metro Trip Time of Elderly? Evidence from Smart Card Data in Nanjing. J. Adv. Transp. 2022, 2022, 2080552. [Google Scholar] [CrossRef]
- Chen, C.; Tang, Y. Nonlinear Impact of Built Environment on the Travel Safety of Elderly Pedestrians: A Case Study of Yuzhong District, Chongqing. Sci. Technol. Eng. 2023, 23, 7112–7119. [Google Scholar]
- Liu, J.; Xiao, L.; Wang, B. The Impact of Built Environment on the Active Travel of Elderly People: A Study Based on Extreme Gradient Boosting Decision Trees. Sci. Technol. Rev. 2021, 39, 102–111. [Google Scholar] [CrossRef]
- Zhu, Z.; Han, J.; Tang, C.; Guo, X.; Jiao, Z.; Zhang, R. Nonlinear Impact of Built Environment on Elderly Pedestrian Travel Time Considering Differences in Travel Purposes. J. Chongqing Jiaotong Univ. Nat. Sci. 2025, 44, 91–98. [Google Scholar] [CrossRef]
- He, S.; Zhao, H.; Huang, Y.; Xiong, R. Nonlinear Impact of Built Environment on Walking Distance of Elderly People in Mountainous Cities: A Case Study of Guiyang. J. Guizhou Norm. Univ. Nat. Sci. 2025, 1–10. Available online: https://kns.cnki.net/kcms2/article/abstract?v=_dzes7vZToPZchfw5McYl9URYpC5jByotLTaIVyO8uoAopNLdPTeIM_tywEQZYdoNfDSh0OcFt0QadWXfTj5UJny3EiU7DOmt6kBpbSfOAbw1Aiva6L-GKeHjLzKsgGyi0ODUgdzEWljJVuwZSG-P0nGdWmRGkrxsTpA4f0KYHEMvDXkh6VtjZUZrL9suHgy&uniplatform=NZKPT&language=CHS (accessed on 30 March 2025).
- Wu, J.; Qian, Y.; Han, Y. Research on the Relationship Between Built Environment and Elderly Pedestrian and Cycling Trips Considering Group Heterogeneity. J. Transp. Syst. Eng. Inf. Technol. 2022, 22, 194–201. [Google Scholar]
- Wang, D.; Lin, T. Built environment, travel behavior, and residential self-selection: A study based on panel data from Beijing, China. Transportation 2019, 46, 51–74. [Google Scholar] [CrossRef]
- Liu, C.; Bardaka, E.; Palakurthy, R.; Tung, L. Analysis of travel characteristics and access mode choice of elderly urban rail riders in Denver, Colorado. Travel Behav. Soc. 2020, 19, 194–206. [Google Scholar] [CrossRef]
- Cerin, E.; Barnett, A.; Zhang, C.J.; Lai, P.C.; Sit, C.H.; Lee, R.S. How urban densification shapes walking behaviours in older community dwellers: A cross-sectional analysis of potential pathways of influence. Int. J. Health Geogr. 2020, 19, 14. [Google Scholar] [CrossRef]
- Wood, S.N. Generalised Additive Models: An introduction with R, 2nd ed.; Chapman & Hall/CRC: Boca Raton, FL, USA, 2017. [Google Scholar]
- Ma, J.; Zhao, S.; Li, W.; Liu, M.; Luo, H. Heterogeneity in seniors’ unmet walking needs: A latent class analysis. J. Transp. Geogr. 2022, 104, 103434. [Google Scholar] [CrossRef]
- Lu, Y.; Chen, L.; Yang, Y.; Gou, Z. The Association of Built Environment and Physical Activity in Older Adults: Using a Citywide Public Housing Scheme to Reduce Residential Self-Selection Bias. Int. J. Environ. Res. Public Health 2018, 15, 1973. [Google Scholar] [CrossRef]
- Ding, C.; Cao, X.; Nass, P. Applying gradient boosting de-cisiontrees to examine non-linear effects of the built en-vironment on driving distance in Oslo. Transp. Part A Policy Pract. 2018, 110, 107–117. [Google Scholar] [CrossRef]
- Xiao, G.; Juan, Z.; Zhang, C. A Discrete-Continuous Model of Commuting Mode and Travel Time Choice. J. Syst. Manag. 2017, 26, 1131–1135+1142. [Google Scholar]
- Ingvardson, B.J.; Nielsen, A.O. The relationship between norms, satisfaction and public transport use: A comparison across six European cities using structural equation modelling. J. Transp. Res. Part A 2019, 126, 37–57. [Google Scholar] [CrossRef]
- Martín, B.; Páez, A. Individual and geographic variations in the propensity to travel by active modes in Vitoria-Gasteiz, Spain. J. Transp. Geogr. 2019, 76, 103–113. [Google Scholar] [CrossRef]
- He, S.; Cheung, Y.H.Y.; Tao, S. Travel mobility and social participation among older people in a transit metropolis: A socio-spatial-temporal perspective. Transp. Res. Part A Policy Pract. 2018, 118, 608–626. [Google Scholar] [CrossRef]
- Szeto, W.Y.; Yang, L.; Wong, R.C.P.; Li, Y.C.; Wong, S.C. Spatio-temporal travel characteristics of the elderly in an ageing society. Travel Behav. Soc. 2017, 9, 10–20. [Google Scholar] [CrossRef]
- Fu, X.; Juan, Z. Empirical analysis and comparisons about time-allocation patterns across segments based on mode-specific preferences. Transportation 2014, 43, 37–51. [Google Scholar] [CrossRef]
- Ao, Y.; Zhang, Y.; Wang, Y.; Chen, Y.; Yang, L. Influences of rural built environment on travel mode choice of rural residents: The case of rural Sichuan. J. Transp. Geogr. 2020, 85, 102708. [Google Scholar] [CrossRef]
- Bobáľová, H.; Falťan, V.; Benová, A.; Kožuch, M.; Kotianová, M.; Petrovič, F. Measuring the quality and accessibility of urban greenery using free data sources: A case study in Bratislava, Slovakia. Urban For. Urban Green. 2024, 93, 128217. [Google Scholar] [CrossRef]
- Cohen, D.A.; McKenzie, T.L.; Sehgal, A.; Williamson, S.; Golinelli, D.; Lurie, N. Contribution of Public Parks to Physical Activity. Am. J. Public Health 2007, 97, 509–514. [Google Scholar] [CrossRef]
- Cai, H.; Zhang, Y.; Wei, J.; Lawrence, W.R.; Chen, S. Potential causal associations of long-term exposure to PM2.5 constituents and all-cause mortality: Evidence from the Pearl River Cohort study. Ecotoxicol. Environ. Saf. 2025, 291, 117897. [Google Scholar] [CrossRef] [PubMed]

Disclaimer/Publisher’s Note: The statements, opinions and data contained in all publications are solely those of the individual author(s) and contributor(s) and not of MDPI and/or the editor(s). MDPI and/or the editor(s) disclaim responsibility for any injury to people or property resulting from any ideas, methods, instructions or products referred to in the content. |
© 2025 by the authors. Licensee MDPI, Basel, Switzerland. This article is an open access article distributed under the terms and conditions of the Creative Commons Attribution (CC BY) license (https://creativecommons.org/licenses/by/4.0/).
Share and Cite
Duan, M.; Xu, L.; Chen, Y.; Zhao, Q.; Zhang, Y.; Cui, X.; Tian, S. Optimizing Urban Environments for Sustainable Development: Strategies and Practices to Enhance Mobility Among Older Adults. Sustainability 2025, 17, 3531. https://doi.org/10.3390/su17083531
Duan M, Xu L, Chen Y, Zhao Q, Zhang Y, Cui X, Tian S. Optimizing Urban Environments for Sustainable Development: Strategies and Practices to Enhance Mobility Among Older Adults. Sustainability. 2025; 17(8):3531. https://doi.org/10.3390/su17083531
Chicago/Turabian StyleDuan, Mengshan, Lizhen Xu, Yongkang Chen, Qun Zhao, Youxing Zhang, Xiangfen Cui, and Senlin Tian. 2025. "Optimizing Urban Environments for Sustainable Development: Strategies and Practices to Enhance Mobility Among Older Adults" Sustainability 17, no. 8: 3531. https://doi.org/10.3390/su17083531
APA StyleDuan, M., Xu, L., Chen, Y., Zhao, Q., Zhang, Y., Cui, X., & Tian, S. (2025). Optimizing Urban Environments for Sustainable Development: Strategies and Practices to Enhance Mobility Among Older Adults. Sustainability, 17(8), 3531. https://doi.org/10.3390/su17083531