Abstract
The synergistic dilemma of upstream actors in the agro-ecological product supply chain restricts the transformation of ecological value, and traditional research focuses on the “production-supply” dichotomy, neglecting the driving role of the innovation service system. This study innovatively proposes a theoretical framework of “industry-supply-innovation tri-system synergy”, constructs a dynamic evolutionary game model with “free-riding” behavior, quantifies the effects of synergistic cost sharing coefficients (θ), benefit distribution ratios (γ), and policy regulation variables on the evolution of the main body’s strategy, and reveals the key laws through Matlab simulation. The results show that: (1) the participation of an innovation service system can significantly improve the speed of cooperation convergence; (2) the initial willingness to cooperate and the fairness of benefit distribution dominate the evolution path, and the probability of the system converging to “active cooperation” increases significantly when θ > 0.5; (3) the policy needs to be complemented with the market, and the government optimizes the distribution of the benefits of innovation services to improve the efficiency of the supply chain. The government can optimize the distribution of benefits from innovation services to promote the efficiency of the supply chain. Accordingly, we propose a “market-policy” dual-wheel control strategy to promote the deep integration of multiple supply chain actors with the innovation service system as a link.
1. Introduction
The establishment of a sound mechanism for realizing the value of agro-ecological products is an important initiative to strongly implement Xi Jinping’s thought on ecological civilization [1,2]. With society’s emphasis on environmental protection and sustainable development, the definition of eco-products has undergone continuous expansion. From the initial primary products of ecosystems, it has gradually expanded to products that are environmentally oriented as well as integrated with ecological protection and sustainable development [3]. Meanwhile, with the deepening of research and the advancement of practice, the concept of ecological products has been gradually refined, in which agro-ecological products have begun to stand out as an important branch of ecological products [4].
In this concept, “agriculture”, as the main body of production, represents the fundamental guarantee of human survival. “Ecology” emphasizes the maintenance of ecosystem structure and function in the process of farming through the rational use of inputs, field and distribution management, and by-product treatment, ensuring the sustainable use of agricultural resources. “Products” is reflected in the fruits of production and labor, which can be exchanged in the market to achieve its economic value. It is thus clear that the key to promoting the sustainable development of agriculture lies in rationally developing and giving full play to the dual value of ecological and agricultural products, and continuously realizing economic benefits through the market mechanism. Based on the basic concept of ecological products, this study defines agro-ecological products as agricultural products in material form produced under the eco-friendly agricultural production mode. These products not only meet the basic needs of human life, but also have multi-dimensional values such as ecological, economic, and social values, and their production process reduces the consumption of ecological resources through cleaner production, recycling, and reduction in consumption and emission, thus giving the products more certified labels such as organic and green.
At the same time, realizing the value transformation of agro-ecological products not only relies on the multiple attributes of the products themselves, but also needs to be transformed into real economic, ecological, and social benefits through government purchases and other forms [5,6,7]. This process involves multiple interest subjects, so it is necessary to give full play to the dual roles of the government and the market, and to stimulate the endogenous motivation of market operation and development subjects [8]. Compared with the traditional agricultural supply chain model centered on farmers and producers, there are many deficiencies in industrial cooperation, supply chain structure, benefit distribution, and efficiency, and the supply chain of agro-ecological products is also deeply affected by these problems. Therefore, to realize the overall value of agro-ecological products, whole industry chain collaboration is particularly important [9].
In addition, in 2021, the state proposed a dual-cycle development strategy to build an innovation-driven, high-quality supply–demand match and to promote the integration and collaborative innovation of industry, supply, and innovative service systems, which provides an important opportunity to enhance the modernization of the industry chain and supply chain. In this context, the value co-creation of upstream subjects in the supply chain of agro-ecological products is regarded as a key path to promote the realization of the value and rapid development of agro-ecological products, and plays a crucial role in the production and circulation of products. However, most existing studies focus on the “production–supply” dichotomy [10], while neglecting the pivotal role of innovation service systems in resource integration and technology diffusion. Based on this, this study divides the upstream subjects of the agro-ecological product supply chain into the industrial service system, supply service system, and innovation service system, and takes the innovation service system as the core driving force to make up for the neglect of science and technology and management innovation in traditional research. It explores the interest game of the upstream subjects of the supply chain in the process of the value co-creation of agro-ecological products, and it compares the optimal decision making among the subjects under the scenarios where the innovation service system participates and does not participate in the value co-creation of agro-ecological products. This provides reference for the high-quality development of eco-agriculture industry and the establishment of effective management and development mechanisms of agro-ecological products.
This study aims to address the following issues: (1) Promote the cooperation of multi-party subjects and solve the problem of uncoordinated interests of upstream subjects in the supply chain of agro-ecological products. (2) The innovation service system has a central role in the supply chain of agro-ecological products. However, its potential to promote the synergistic development of the supply and industrial service systems has not yet been fully explored. This study promotes the deep integration of the three by exploring how to strengthen the central role of the innovation service system. (3) Although ecologization is a necessary path for sustainable agricultural development, in practice, there is still a lack of systematic solutions for promoting the high-quality development of agro-ecological products by optimizing the distribution of revenues, cost control, policy regulation, and so on. This study provides specific optimization strategies for the path of high-quality development of agro-ecological products.
The main contributions of this study can be summarized as follows: first, it breaks through the traditional dual structure, divides the industry, supply, and innovation service system, focuses on the coordination of interests and value co-creation among the three, and provides a new theoretical framework for analyzing the multiagency cooperation in the supply chain of agro-ecological products. Secondly, we use evolutionary game theory to construct a dynamic game model of multi-subject value co-creation, consider the synergistic role of benefit distribution and innovation service system, and reveal the evolutionary law of subject cooperation strategies under different scenarios. Third, we propose a synergistic development model that takes the innovation service system as the core driving force and promotes the deep integration of the industrial service system and the supply service system, breaking through the limitations of traditional eco-agriculture research that focuses only on the production and supply links and emphasizes the core role of scientific and technological innovation and the service system in the high-quality development of agro-ecological products.
2. Literature Review
2.1. Relevant Studies on Upstream Stakeholders in the Supply Chain
Stakeholder theory was developed around the 1960s and emphasizes that corporate development depends on the input and participation of all stakeholders. Mitchell pioneered the attribute scoring methodology, which redefines stakeholders as deterministic, anticipatory, and potential based on the perspectives of legitimacy, power, and urgency, and academics have widely recognized this categorization. Based on the definition of stakeholders, scholars have systematically categorized and analyzed their different types, characteristics, and impacts [11]. Waligo developed the “multi-stakeholder engagement management framework”, which suggests that managing stakeholder engagement processes is crucial [12]. Most of the previous studies focused on the supply, demand, and regulation perspectives, and Xie constructed a three-party game model based on evolutionary game theory to analyze the dynamic evolution process and evolutionary stabilization strategies of the major stakeholders in the process of agri-food safety and low-carbon production [13]. However, the complexity of stakeholder subjects among the upstream subjects of agro-ecological product supply chains and the supply and demand relationships are all over the place, and there are many regulatory subjects. Different stakeholders assume different functions and responsibilities in their respective segments [14,15], so it is difficult to comprehensively take into account all aspects of the stakeholder subjects and objects by dimensional segmentation alone.
In recent years, as China’s economy has shifted from high-speed development to high-quality development, “supply chain”, “industrial chain”, “innovation chain”, “value chain”, “multi-chain integration”, “innovation drive”, and other keywords have been mentioned many times in various important government work conferences and work reports. Therefore, combined with the national policy orientation and industrial development trend, this study breaks through the dimensional segmentation perspective of traditional research on the analysis of multiple subjects in the supply chain of agro-ecological products. Introducing the research method of segmenting stakeholders based on attribute scores in stakeholder theory [11], this study innovatively starts from the three dimensions of the industrial service system, supply service system, and innovation service system of agro-ecological products; redefines the relationship among the upstream subjects of the agro-ecological product supply chain; and clarifies the belonging and boundaries of each stakeholder subject.
2.2. A Related Study on the Participation of Upstream Supply Chain Actors in Value Co-Creation
Early ideas of value co-creation sprouted from co-production, with customer experience and service-dominant logic being the main perspectives for studying value co-creation [16]. With the network economy’s development, value creation subjects have become more complex. Different subjects, such as suppliers, business partners, collaborators, and customers, are involved in the co-creation of value [17]. The research on value co-creation has begun to focus extensively on the network relationship of multiple participants in the co-creation of value. This service-dominant logic has been continuously expanded and upgraded, deriving a more macroscopic perspective, such as service science and ecosystems. Taken as a whole, the cutting-edge development of value co-creation theory suggests that value co-creation theory based on service ecosystems focuses on a systemic, network, and dynamic perspective, emphasizing that participants co-create mechanisms by integrating resources, interacting with each other, and following institutional norms in complex and loosely connected spatio-temporal environments [18,19,20]. The research of Wei Jie points out that the construction of a new double-cycle development pattern requires a high-quality supply system as the support and cornerstone [21]. It is necessary to deepen supply side structural reform and innovation to promote the improvement and upgrading of the supply system, with the core of creating a new pattern of integration and development of the three “innovation chain + industrial chain + supply chain”. The research group of the Institute of Industrial Economics of the Chinese Academy of Social Sciences pointed out that the modernization of the industrial supply chain should include the modernization of the main body as well as the modernization of the structure, and innovation is core to improving the modernization of the industrial chain supply chain [22]. Therefore, the modernization of the industrial chain supply chain needs to be supported by the innovation chain. In general, it has become a consensus in the academic community to rely on the integration and development of multiple chains to build a new pattern, industry, and path. However, few scholars have focused on specific industries and conducted in-depth research and discussion on the coordination mechanism of interests in the integration process.
At present, the synergistic mechanism of the industrial service system, supply service system, and innovation service system in the main body upstream of the agro-ecological product supply chain is not sound; the industrial system and supply system mainly rely on the traditional primary industry, with a weak development foundation, the heterogeneity of the relevant interest subjects in each chain is evident, there is a lack of reasonable guidance [23,24], and the zero-sum game leads to the duplication of the allocation of innovation resources, dispersion, closure, inefficiency, etc., resulting in insufficient endogenous motivation for the integration and synergistic development of the three systems and the challenges they are facing. At the same time, due to the agro-ecological products supply chain upstream, subject node organizations are not completely rational economic men and failed to see the long-term optimal return [25,26,27]. Therefore, in the cooperation process, it is easy to see short-term “free-riding”, credit default, other moral risks, and different strategic choices, which will seriously affect the stability of the main cooperative relationship and maximize the benefits of cooperative cooperation. From the supply side, the lack of cooperation among the upstream subjects of the supply chain has led to the failure to reflect the high value-addedness of specialty agricultural products, making it challenging to obtain the optimal benefits of cooperative cooperation [28,29]. From the demand side, the unstable cooperative relationship of the upstream actors in the supply chain makes it difficult to ensure a continuous and stable supply of high-quality agricultural products [30]. With the establishment of the development goal of “insisting on industrial agriculture, quality agriculture, and green agriculture” and the comprehensive and in-depth practice of the “two mountains” theory, determining how to realize the transformation from a closed cycle to an open and integrated development is a must for realizing the high-quality development of agro-ecological products—problems to be solved.
2.3. Review of Research
Existing research results have specific references to the development and research on the participation of the upstream subject of the agro-ecological product supply chain in value co-creation. However, there are still specific problems: in terms of dynamic evolution analysis, it is mainly limited to the local coordination of interests or the simple variable model and lacks the dynamic evolution analysis for the coordination of interests of this subject. At the same time, there is insufficient research on the organizational form of value co-creation of agro-ecological products and a lack of systematic analysis targeting the supply chain. Given the above problems, this study, based on the evolutionary game theory, takes the supply chain of agro-ecological products as the object of study, subdividing the main body of value co-creating, clarifying the functional position and interactive relationship of different central bodies in the upstream of the supply chain, and proposing the cooperative development model of “whether the innovation service system participates in value co-creating”, to promote the in-depth integration of the upstream and downstream of the supply chain.
3. Model Assumptions
This study is predicated on the hypothesis of a distinctive market structure for agro-ecological products. The upstream supply chain is delineated into three interconnected systems: industry, supply, and innovation service systems, each integral to the provisioning of agro-ecological products, technologies, and services.
The supply service system encompasses the entire value-adding process of agro-ecological products, from raw material acquisition to final consumption. It facilitates the transfer of diverse value flows that contribute to the realization of value-addedness [31]. The industrial service system embodies a spatial configuration composed of nodes representing producers of agro-ecological products and their corresponding outputs, interconnected through logistical and informational linkages [32]. The innovation service system is predominantly anchored in scientific and technological advancements, alongside organizational and management innovations. Its boundaries and implications are progressively evolving, transitioning from merely addressing the demands for innovation to encompassing the diffusion of industrial practices [33].
The upstream actors within the agro-ecological product supply chain are characterized as rational economic agents, whose utilities are intricately intertwined with their decision-making processes and those of their counterparts. Consequently, the positive interaction among these stakeholders underpins the realization of value co-creation. This study endeavors to construct dynamic evolutionary game models grounded in the dynamic evolutionary game theory framework. In this study, we construct dynamic evolutionary game models based on the dynamic evolutionary game theory to analyze the cooperation strategies of different subjects and give the corresponding hypotheses according to whether the innovation service system actively cooperates with the supply and value co-creation of the industrial service system.
Assumption 1: In co-creating value for agro-ecological products, the collaborating entities focus primarily on the industrial, supply, and innovation service systems. They continuously enhance the value chain of agro-ecological products through the integration and synergistic development of these systems. The co-creation of value in agro-ecological products relies on the industrial, supply, and innovation service systems as fundamental carriers, facilitating expansion through their integrated and synergistic development. This value co-creation is expressed through a market-oriented transaction mechanism [15].
Assumption 2: Industrial service systems participate in the value co-creation strategy as {active cooperation, passive cooperation}. Active cooperation means active cooperation with supply and innovation service systems to share market dynamics, integrate production resources, and promote efficient resource flow; antagonistic cooperation means passive participation of industrial service systems, which only cooperate to obtain basic information for other business purposes. The strategy of the supply service system is also {active cooperation, antagonistic cooperation}. Active cooperation is to arrange the production according to the industry’s requirements and the innovation service system and strictly control the quality, quantity, and time of supply of agricultural products. Antagonistic cooperation refers to the fact that the supply service system remains relatively independent during the cooperation process, is loosely connected to other subjects, has substantial autonomy in production arrangement, and the degree of cooperation is low. The innovation service system is the key bridge between the industry and the supply service system, and the strategy is {deep participation, shallow participation}. In the integration and synergistic development, the three actors gradually form a stable game equilibrium state by dynamically adjusting their decision-making strategies many times.
Assumption 3: Within the agricultural production process, the value co-creation dynamic involves two primary entities: the industrial service system and the supply service system. These entities can adopt two cooperative strategies: {positive and negative cooperation}. Let x represent the probability of positive cooperation from the industrial service system, with a corresponding probability of negative cooperation represented as 1 − x. Similarly, let y indicate the probability of positive cooperation from the supply service system, and 1 − y reflect the probability of negative cooperation. Lastly, we also represent this dynamic with x, y ∈ (0,1).
Assumption 4: Let Rx and Ry represent the initial revenues generated by the industrial and supply service systems, respectively, when both systems adopt the active cooperation strategy. L(L > 0) signifies the potential revenue growth in the market that can result from the collaboration between the industrial service system and the supply service system. The variable θ(θ ∈ (0,1)) indicates the proportion of this potential market revenue growth allocated to the industrial service system, meaning that the industrial service system benefits from an increase of θL. In contrast, the supply service system receives (1 − θ)L. The fixed cooperation cost associated with implementing the active cooperation strategy is denoted by C. Furthermore, the allocation coefficient is represented by π(π ∈ (0,1)), indicating that the industrial service system incurs a cost of πC, while the supply service system bears a cost of (1 − π)C.
Assumption 5: The strategies stakeholders employ in the service system to promote the value co-creation of agro-ecological products can be categorized into two types: {positive synergy and negative synergy}. Positive synergy refers to the proactive engagement and advancement of value co-creation and collaborative development of agro-ecological products by relevant participants in each service system. In contrast, negative synergy pertains to the detrimental approach towards value co-creation and cooperative development adopted by the stakeholders. Let E represent the synergistic innovation gain achieved by the innovation service system that plays a crucial role in the value co-creation process between the industry and the supply service system. Here, γ denotes the proportion of this synergistic innovation gain attributed to the industry service system out of a total E. Conversely, 1 − γ represents the share of co-innovation gain realized by the supply service system within E, resulting in the industrial service system’s co-innovation gain being γE and that of the supply service system being (1 − γ)E. Furthermore, P signifies the detrimental co-innovation loss impacting the value co-creation process between the industry and supply service systems. At the same time, ω illustrates the proportion of this loss attributed to the industry service system. Consequently, P encompasses the losses incurred due to negative co-innovation during value co-creation. Hence, ω represents the share of dasmaging co-innovation loss borne by the industry service system, while 1 − ω reflects the share attributed to the supply service system. In summary, the harmful co-innovation loss for the industrial service system amounts to ωP, while that for the supply service system totals (1 − ω)P.
Assumption 6: The challenge of unequal resource endowment and the differing objectives pursued in the value co-creation of agro-ecological products have resulted in complicated cooperation among the stakeholders involved. This dynamic has fostered a tendency for mutual “free-riding” behaviour [34,35,36]. Consequently, those who contribute more inputs and outputs experience diminished benefits from value co-creation. In contrast, the party with fewer inputs and outputs sees an unjustified increase in their co-creation benefits. In this context, K is defined as the co-innovation gain or loss for the supply and industrial service systems when “free-riding” behaviour is present.
4. Construction and Stability Analysis of an Evolutionary Game Model for Innovation Service Systems Not Engaging in the Value Co-Creation of Agro-Ecological Products
4.1. Construction of a Dynamic Evolutionary Game Model
In accordance with the underlying assumptions, Table 1 presents the payment matrix for the mixed strategy used to develop the evolutionary game model focused on value co-creation for agro-ecological products. This model specifically addresses the innovative service system that does not engage in the value co-creation process within its own service framework or the supply service system.

Table 1.
Illustrates the dynamic evolutionary game payment matrix pertaining to value co-creation across industries and supply service systems, where the innovative service systems do not participate.
(1) Average return of industrial service system I
The anticipated advantages of an industrial service system implementing a “positive fit” strategy are:
The anticipated advantages of a “passive cooperation” strategy for an industrial service system are:
The average expected return of the industrial service system using a mixed strategy is:
(2) The average benefit of the supply service system S
The anticipated return of the supply service system using the “active cooperation” strategy is as follows:
The anticipated advantage for the supply service system in adopting a “passive cooperation” strategy is:
The average expected return from the supply service system using a mixed strategy is:
(3) Replicating dynamic equation modeling
According to the principle of the Malthusian dynamic equation, as long as the individualized return from adopting a specific strategy exceeds the average return of the group, that strategy will gradually expand. This leads to the formulation of the replicated dynamic equation for the strategy selection within the industrial service system I and the supply service system S, expressed as:
4.2. Analysis of Dynamic Equilibrium in Evolutionary Game Adjustments
The replicated dynamic equations describe the group dynamics of the evolutionary game between the industrial service system I and the supply service system S. The set of replicated dynamic equations—specifically Equations (7) and (8)—for variables and , defined on the plane M = {(x, y)|0 ≤ x ≤1, 0 ≤ y ≤ 1}, leads to five equilibrium points in the dynamic evolutionary game: A(0,0), B(0,1), C(1,0), D(1,1), and E(x0,y0), where 0 ≤ x0, y0 ≤ 1, and where and .
According to the local stability analysis method introduced by Freedman (1991) for assessing the nature of equilibrium points, the stability of an equilibrium point is determined through a local analysis of the system’s Jacobian matrix. The specific criteria for stability are as follows: if the determinant of the Jacobian matrix, Det(J), is more significant than zero and the trace, Tr(J), is less than zero, then the equilibrium point can be classified as asymptotically stable, also known as an ESS point. Conversely, if Det(J) is more significant than zero and Tr(J) is greater than zero, the equilibrium point is deemed unstable. If Det(J) is less than zero and Tr(J) is equal to zero or indeterminate, the equilibrium point is identified as a saddle point. By applying this framework to the dynamical system of equations, we derive the Jacobian matrix of the evolutionary system as follows:
The stability of the equilibrium point for the system of differential equations D1 can be assessed by examining the sign of the determinant DetJ1 and the trace TrJ1 of the matrix J1. When DetJ1 is more significant than zero, and TrJ1 is less than 0, the equilibrium point of the replicated dynamic equations corresponds to the evolutionary stabilization strategy (ESS). Accordingly, the stability results for D1 can be summarized in Table 2.
Table 2.
Stability Analysis of the Dynamic Evolutionary Gaming System Without the Participation of the Innovation Service System.
4.3. Dynamic Evolutionary Game Evolutionary Path Analysis
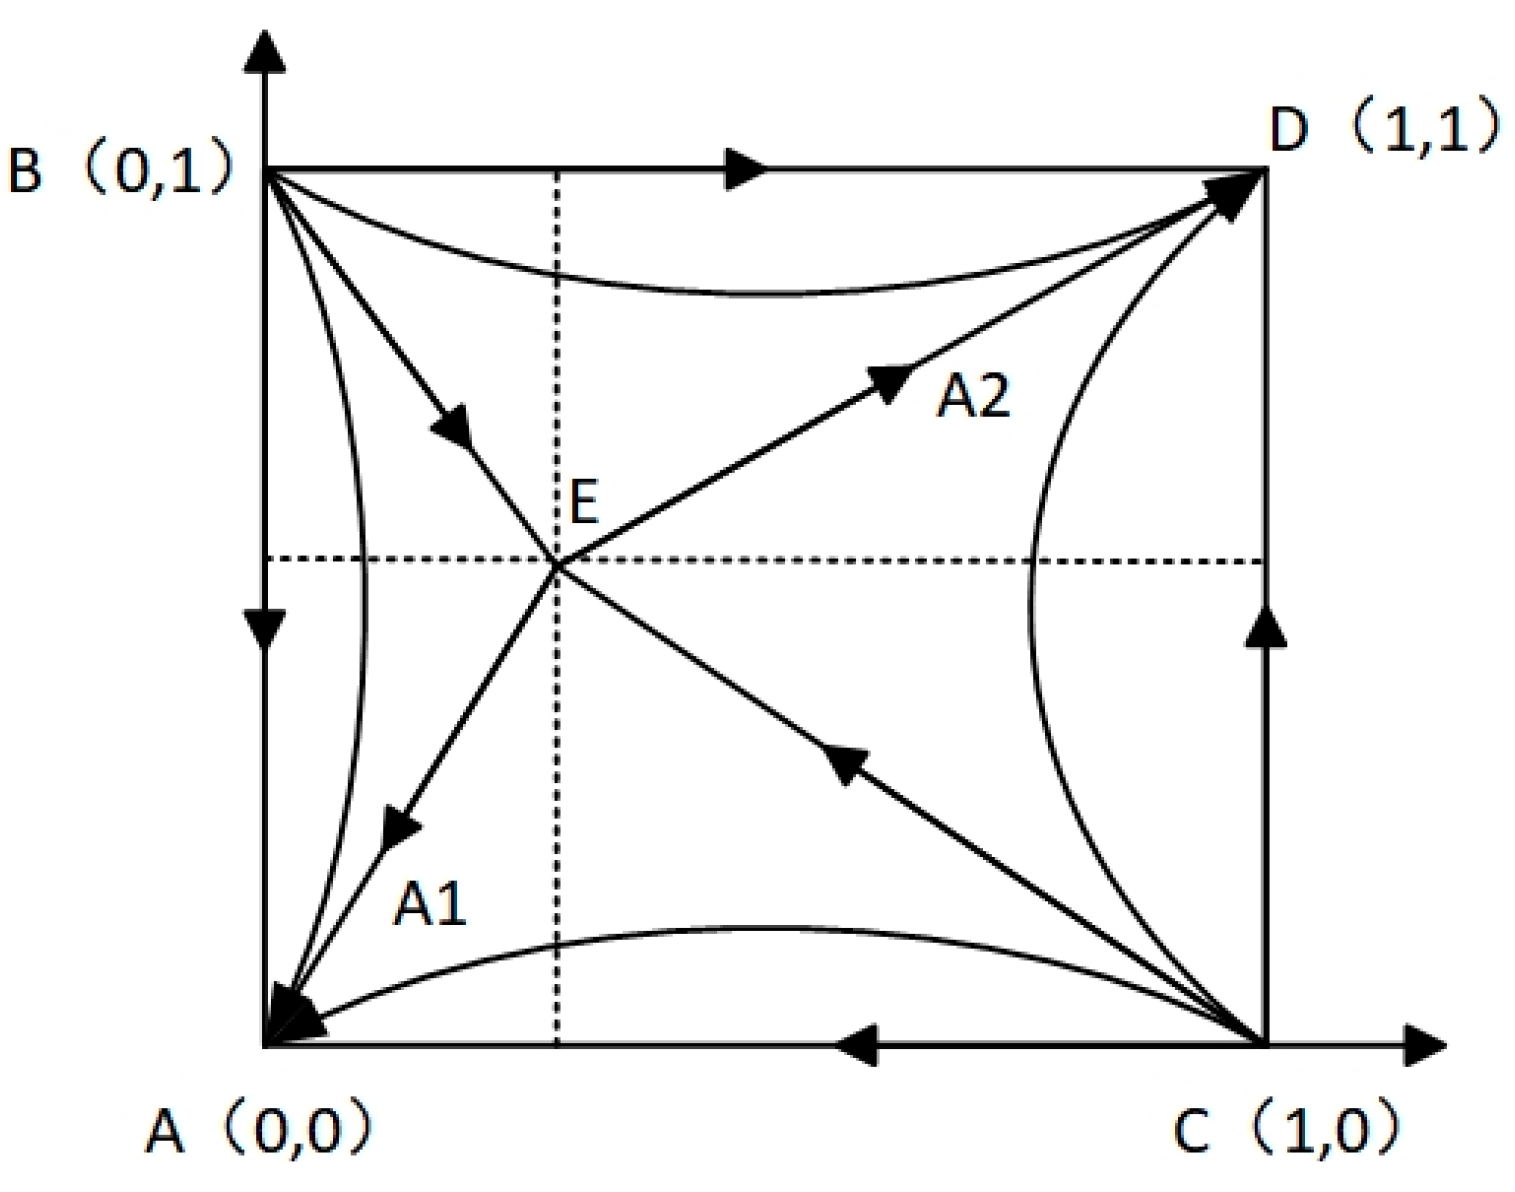
As illustrated in Table 2, points A and D are stable equilibrium points, representing the scenarios of (positive cooperation, positive cooperation) and (negative cooperation, negative cooperation), respectively. In contrast, points B and C are unstable, while point E acts as a saddle point. When the initial state lies in the lower right region bounded by the two unstable equilibrium points and the saddle point (BECD region), the system will converge towards point D (1,1), leading both parties to adopt the cooperative strategy of “positive cooperation”. Conversely, suppose the initial state is located in the upper left (ABEC) region. In that case, the game will ultimately settle at point A (0,0), resulting in both parties embracing the cooperative strategy of “negative cooperation”. This dynamic evolution of cooperation strategies is depicted in the phase diagram shown in Figure 1.
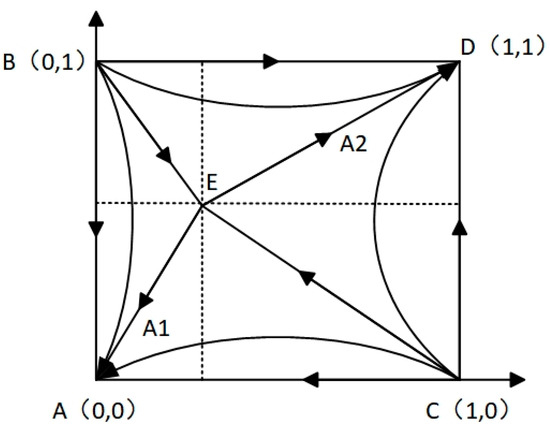
Figure 1.
Evolutionary Phase Diagram When the Innovation Service System Is Not Involved.
As illustrated in Figure 1, the model exhibits two stable states: (positive and positive cooperation) and (negative and negative cooperation). The direction of cooperative evolution in value co-creation hinges on the relative sizes of the ABEC region (A1) and the BECD region (A2). A larger area of A1 increases the probability that both parties will adopt the (Negative Cooperation, Negative Cooperation) strategy. In contrast, a larger area of A2 enhances the likelihood that both parties will pursue the (Positive Cooperation, Positive Cooperation) strategy. The formula for the area of the ABEC region (A1) is as follows:
The main factors influencing changes in the area of the ABEC region (A1) and the corresponding control methods are discussed below.
(1) Fixed cooperation costs C
The formula for the A1 area concerning the fixed cooperation cost C can be expressed through its partial derivatives: , indicating that A1 is a monotonically increasing function of C. This means that as the cooperation cost C between the industrial service system and the supply service system rises, S1 will also increase. Consequently, the likelihood of both parties opting for a “negative cooperation” strategy will grow, leading to an evolution toward a stable state characterized by negative cooperation. Conversely, when the cooperation cost C decreases, the area of A1 declines along with the price of cooperation between the two systems. As a result, the area of A2 expands, increasing the probability that the two parties will choose “positive cooperation”. This shift promotes an evolution towards a stable state characterized by cooperation. Therefore, to encourage the multi-actor cooperation strategy for agro-ecological products to evolve toward a stable state of active cooperation, it is essential to effectively manage the cooperation costs for all parties involved in value co-creation.
(2) Fixed cooperation cost allocation factor π
The partial derivative of the benefit-sharing coefficient π for the A1 area formula can be expressed as , indicating that the effect of π on A1 is monotonically increasing. Specifically, when the benefits received by the industrial service system are less than those of the supply service system, a lower cooperation cost-sharing coefficient π for the industrial service system leads to a smaller area of A1. As the agro-ecological product multi-subjects evolve towards a state of (active cooperation, active cooperation), it becomes evident that the value of co-creation cooperation costs positively correlates with the distribution coefficient associated with positive collaboration in generating excess returns.
(3) Potential market gains L
A partial derivative of the potential market return L for the A1 area can be obtained: , so A1 is a monotonically decreasing function of L. That is, when the potential market revenue L of the industrial service system and the supply service system increases, the area of A1 decreases, and the area of A2 increases, at which time the probability of the two subjects choosing “active cooperation” will increase, and the evolution of cooperation evolves to a stable state (active cooperation, active cooperation); when the potential market revenue L of the industrial service system and the supply service system decreases, the area of A1 increases, and the area of A2 decreases, and the two subjects choosing “active cooperation” will increase. When the potential market revenue L of the industrial service system and the supply service system decreases, the area of A1 increases and the area of A2 decreases, the probability of both subjects choosing “negative cooperation” will be higher and higher, and the evolution of the stable state evolves to (negative cooperation, negative cooperation). Therefore, in the process of value co-creation of agro-ecological products by multiple subjects, the higher the potential market gain, the more effective it is to promote the active participation of each subject in cooperation.
(4) The coefficient of income distribution θ
The partial derivatives of the revenue-sharing coefficient θ for the A1 area formula can be determined: . It can be seen that the effect of θ on A1 is monotonically decreasing. As the gain-sharing coefficient θ increases, the A1 area is decreasing. This indicates that the likelihood of the combination of strategies originally associated with A1 (negative fit, negative fit) is gradually decreasing as the cooperative gain distribution coefficient changes. In the short term, when the gain distribution coefficient θ starts to increase, the probability of the negative cooperation strategy represented by A1 decreases, and the system will gradually deviate from the stable state dominated by “negative cooperation”, and the subjects will start to explore the “positive cooperation” strategy in order to The system will gradually deviate from the stable state dominated by “negative cooperation”, and the subjects will start to explore the “positive cooperation” strategy in order to obtain more income distribution. As the coefficient of revenue allocation θ continues to increase, the system will gradually evolve to the stable state of “positive cooperation”, and the cooperative relationship between the industrial service system and the supply service system will become closer.
(5) “Hitchhiking” gains K
A partial derivation of the gain-sharing coefficient K for the A1 area formula results in: . It can be seen that the effect of K on A1 is monotonically increasing. When the “free-rider” gain K increases, the area of A1 increases, which means that the probability of both subjects implementing (negative cooperation, negative cooperation) strategy is increasing. When the hitchhiking benefit K begins to decrease, the probability of negative cooperation strategy represented by A1 decreases, and the probability of both subjects choosing “positive cooperation” becomes higher and higher. Thus, “free-riding” behavior in the process of value co-creation is not conducive to the evolution of both subjects to a stable state (positive cooperation, positive cooperation). Therefore, reasonable and effective punitive measures should be formulated so as to avoid, as far as possible, any subject participating in the value co-creation of agro-ecological products from choosing “free-riding” behavior instead of actively cooperating.
5. Evolutionary Game Model Construction and Stability Analysis of Innovative Service System Participation in Value Co-Creation of Agro-Ecological Product
5.1. Dynamic Evolutionary Game Model Construction
According to the assumptions, the evolutionary game model introduces the innovation system service system to participate in the value co-creation of the industry service system, and the supply service system is constructed. Its mixed strategy payment matrix is shown in Table 3.
Table 3.
Dynamic Evolutionary Game Payment Matrix for Innovation Service System Participation in Value Co-Creation in Industry and Supply Service Systems.
(1) Average return of industrial service system I
The expected benefits of an industrial service system adopting a “positive fit” strategy are:
The expected benefits of a “passive cooperation” strategy for an industrial service system are:
The average expected return obtained by the industrial service system by adopting a mixed strategy is:
(2) Average return on supply service system S
The expected benefits of a “positive fit” strategy for the supply service system are:
The expected benefit to the supply service system of adopting a “passive cooperation” strategy is:
The average expected return obtained by the supply service system with a mixed strategy is:
(3) Replicating dynamic equation modeling
According to the Malthusian dynamic equation principle, as long as the individual return from adopting a specific strategy exceeds the group’s average return, that strategy will gradually grow. This leads to the formulation of the replicated dynamic equation for the strategy selection in the industrial service system I and the supply service system S as follows:
5.2. Dynamic Evolutionary Game Adjustment Equilibrium Analysis
Let , of the replicated dynamic equation set Equations (18) and (19), the five brand new equilibrium points of the dynamic evolutionary game can be obtained as , , , and on the plane M = {(x, y)|0 ≤ x ≤ 1, 0 ≤ y ≤ 1}. where , and , .
The Jacobi matrix is computed:
5.3. Dynamic Evolutionary Game Evolutionary Path Analysis
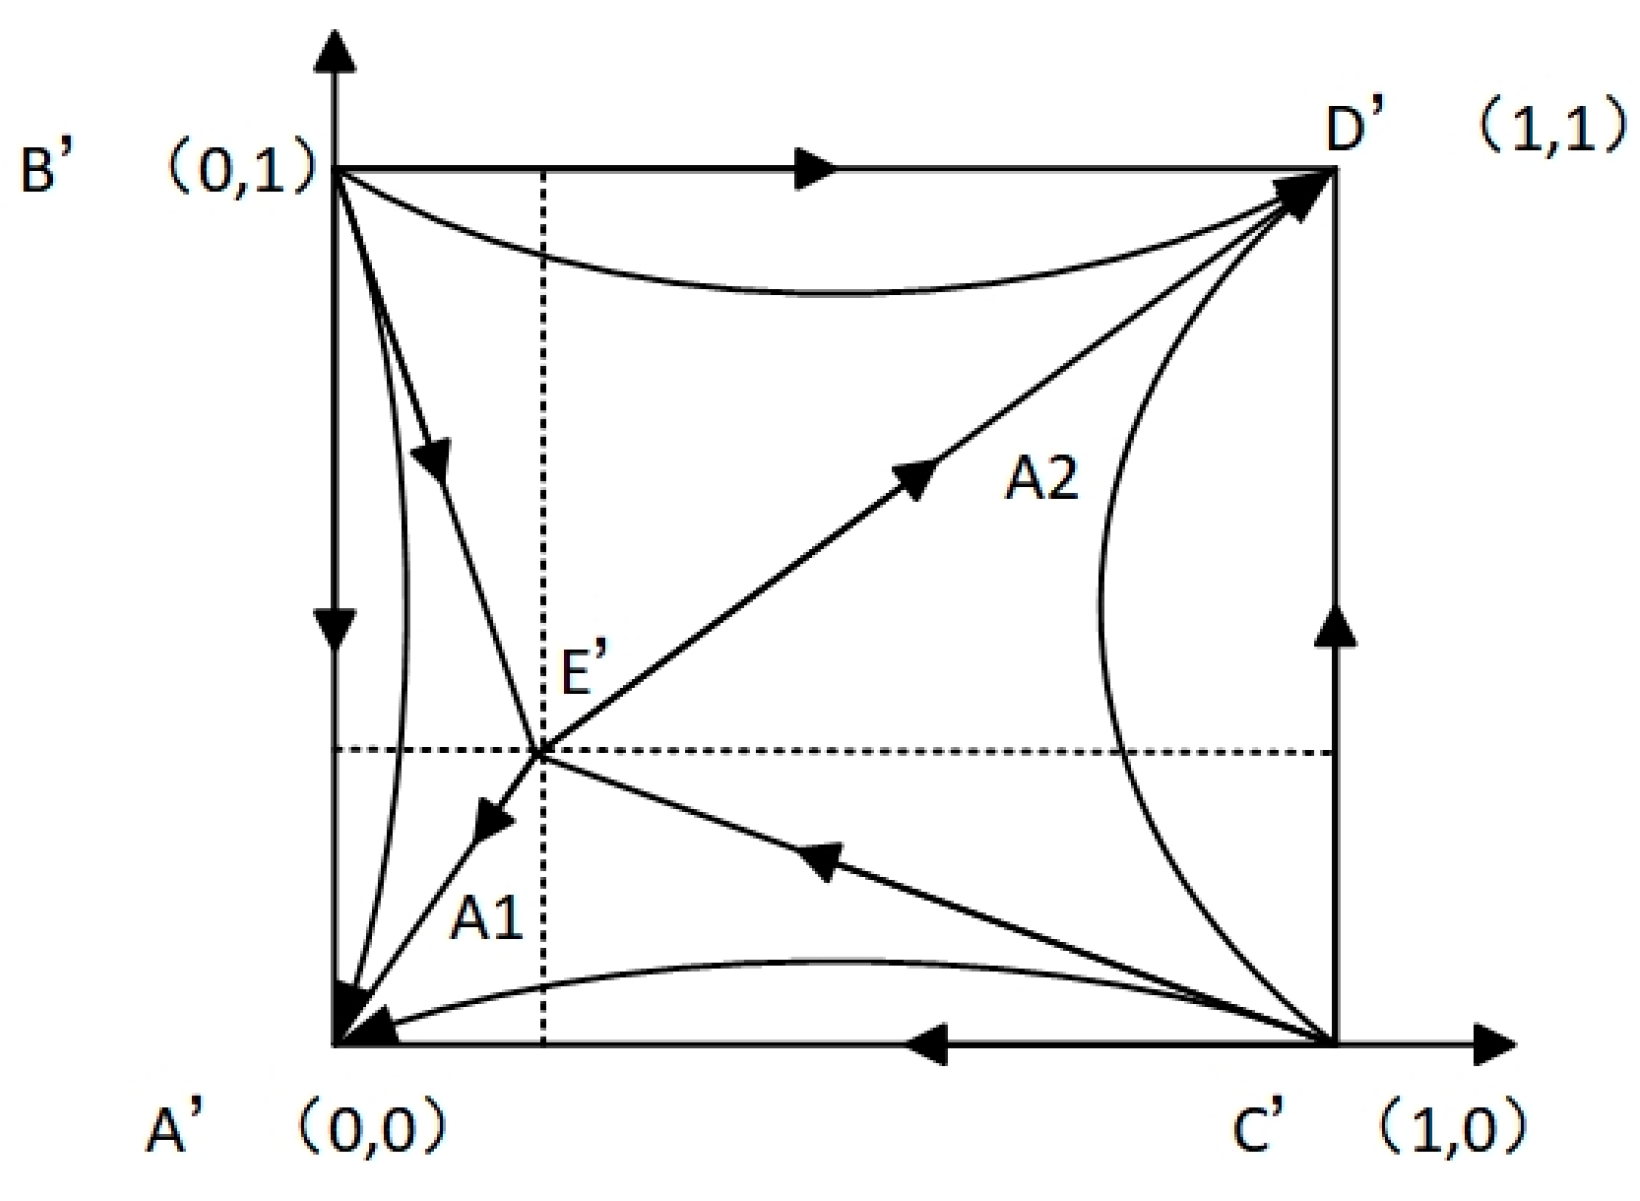
Table 4 reveals that points A’ and D’ are stable points, corresponding to (positive cooperation, positive cooperation) and (negative cooperation, negative cooperation). In contrast, points B’ and C’ are identified as unstable points, while point E’ is classified as a saddle point. Similarly, a phase diagram illustrating the dynamic process of the innovation service system engaging in the game between the industrial and supply service systems can be derived, as depicted in Figure 2.
Table 4.
Stability analysis of dynamic evolutionary gaming system with innovation service system participation.
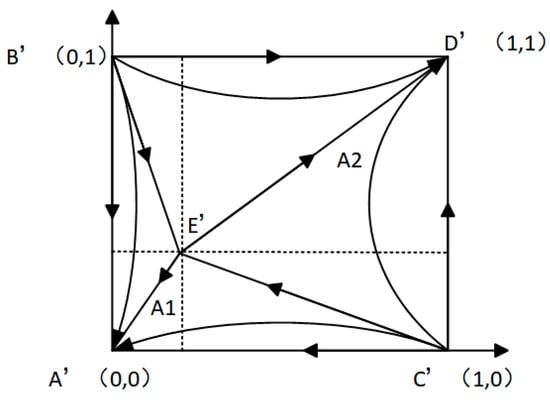
Figure 2.
Evolutionary phase diagram involving innovation service systems.
The difference between E and E′ compared to when the innovation service system does not participate is as follows: , . Therefore, the impact of the innovation service system participation on the value co-creation evolutionary game system of the industry service system and the supply service system can be analyzed based on the impact of the difference term on A1.
(1) When and , , , the area of A1 becomes smaller at this time, indicating that after the introduction of positive co-innovation gain E and negative co-innovation loss P from the participation of the innovation service system, the possibility of the gaming system to converge to increases, and the larger the E and P, the greater the possibility. It indicates that the participation of innovation service system helps value co-creation and promotes the industrial service system and supply service system to more actively choose the cooperation strategy to participate in value co-creation.
(2) When and , , , through the involvement of the innovation service system, if the losses incurred by the industrial service system and the supply service system due to their lack of active participation in value co-creation exceed the costs of collaboration, the innovation service system’s intervention will encourage both systems to adopt a more proactive cooperation strategy. In the ensuing value co-creation process, both the industrial and supply service systems stand to gain economic benefits, which motivates the supply service system to engage more actively in the value co-creation of agro-ecological products.
6. Simulation Analysis
To clarify the interactions between the subjects in the game, this study will employ Matlab R2023b to simulate the dynamic evolution of the game system. The discussion will focus on the simulation results concerning initial willingness to participate, collaborative innovation gains and losses, benefit distribution coefficients, and the gains of free riders among the participating subjects. We will assume that both the industrial service system and the supply service system have an equal probability of 0.5 of selecting each strategy in the initial state, leading to the values of Rx = 10, Ry = 10, L = 12, C = 10, π = 0.5, θ = 0.5, E = 3, P = 2, γ = 0.5, ω = 0.5, and K = −2, which aligns with the initial state presented in Table 4. The simulation results illustrating the strategy evolution of both systems in this initial condition are shown in Figure 3, where we observe convergence toward two equilibrium points: (0,0) and (1,1).
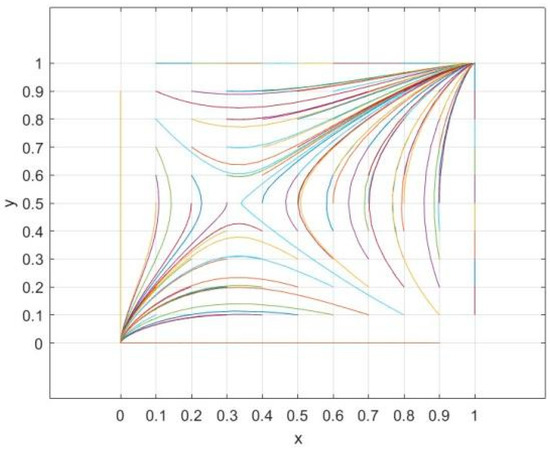
Figure 3.
Evolutionary path of the initial state of the innovation service system not involved in the dynamic evolutionary game.
6.1. Influence of the Initial Willingness of Participating Subjects on the Evolution of the System
(1) Evolutionary Path of the System with Simultaneous Changes in x and y
The likelihood that the supply and industrial service systems of value co-creation in the upstream segment of the agro-ecological product supply chain will adopt a “positive cooperation” strategy reflects their initial willingness to collaborate in value co-creation. The scenario where “x = 0.5, y = 0.5” indicates a neutral willingness to cooperate from both the supply and industrial services systems. When “x > 0.5, y > 0.5”, it signifies a strong willingness from both parties to cooperate, while “x < 0.5, y < 0.5” denotes a weak willingness. According to the reality, the initial willingness to cooperate is analyzed in four types of situations by dynamic evolutionary game simulation.
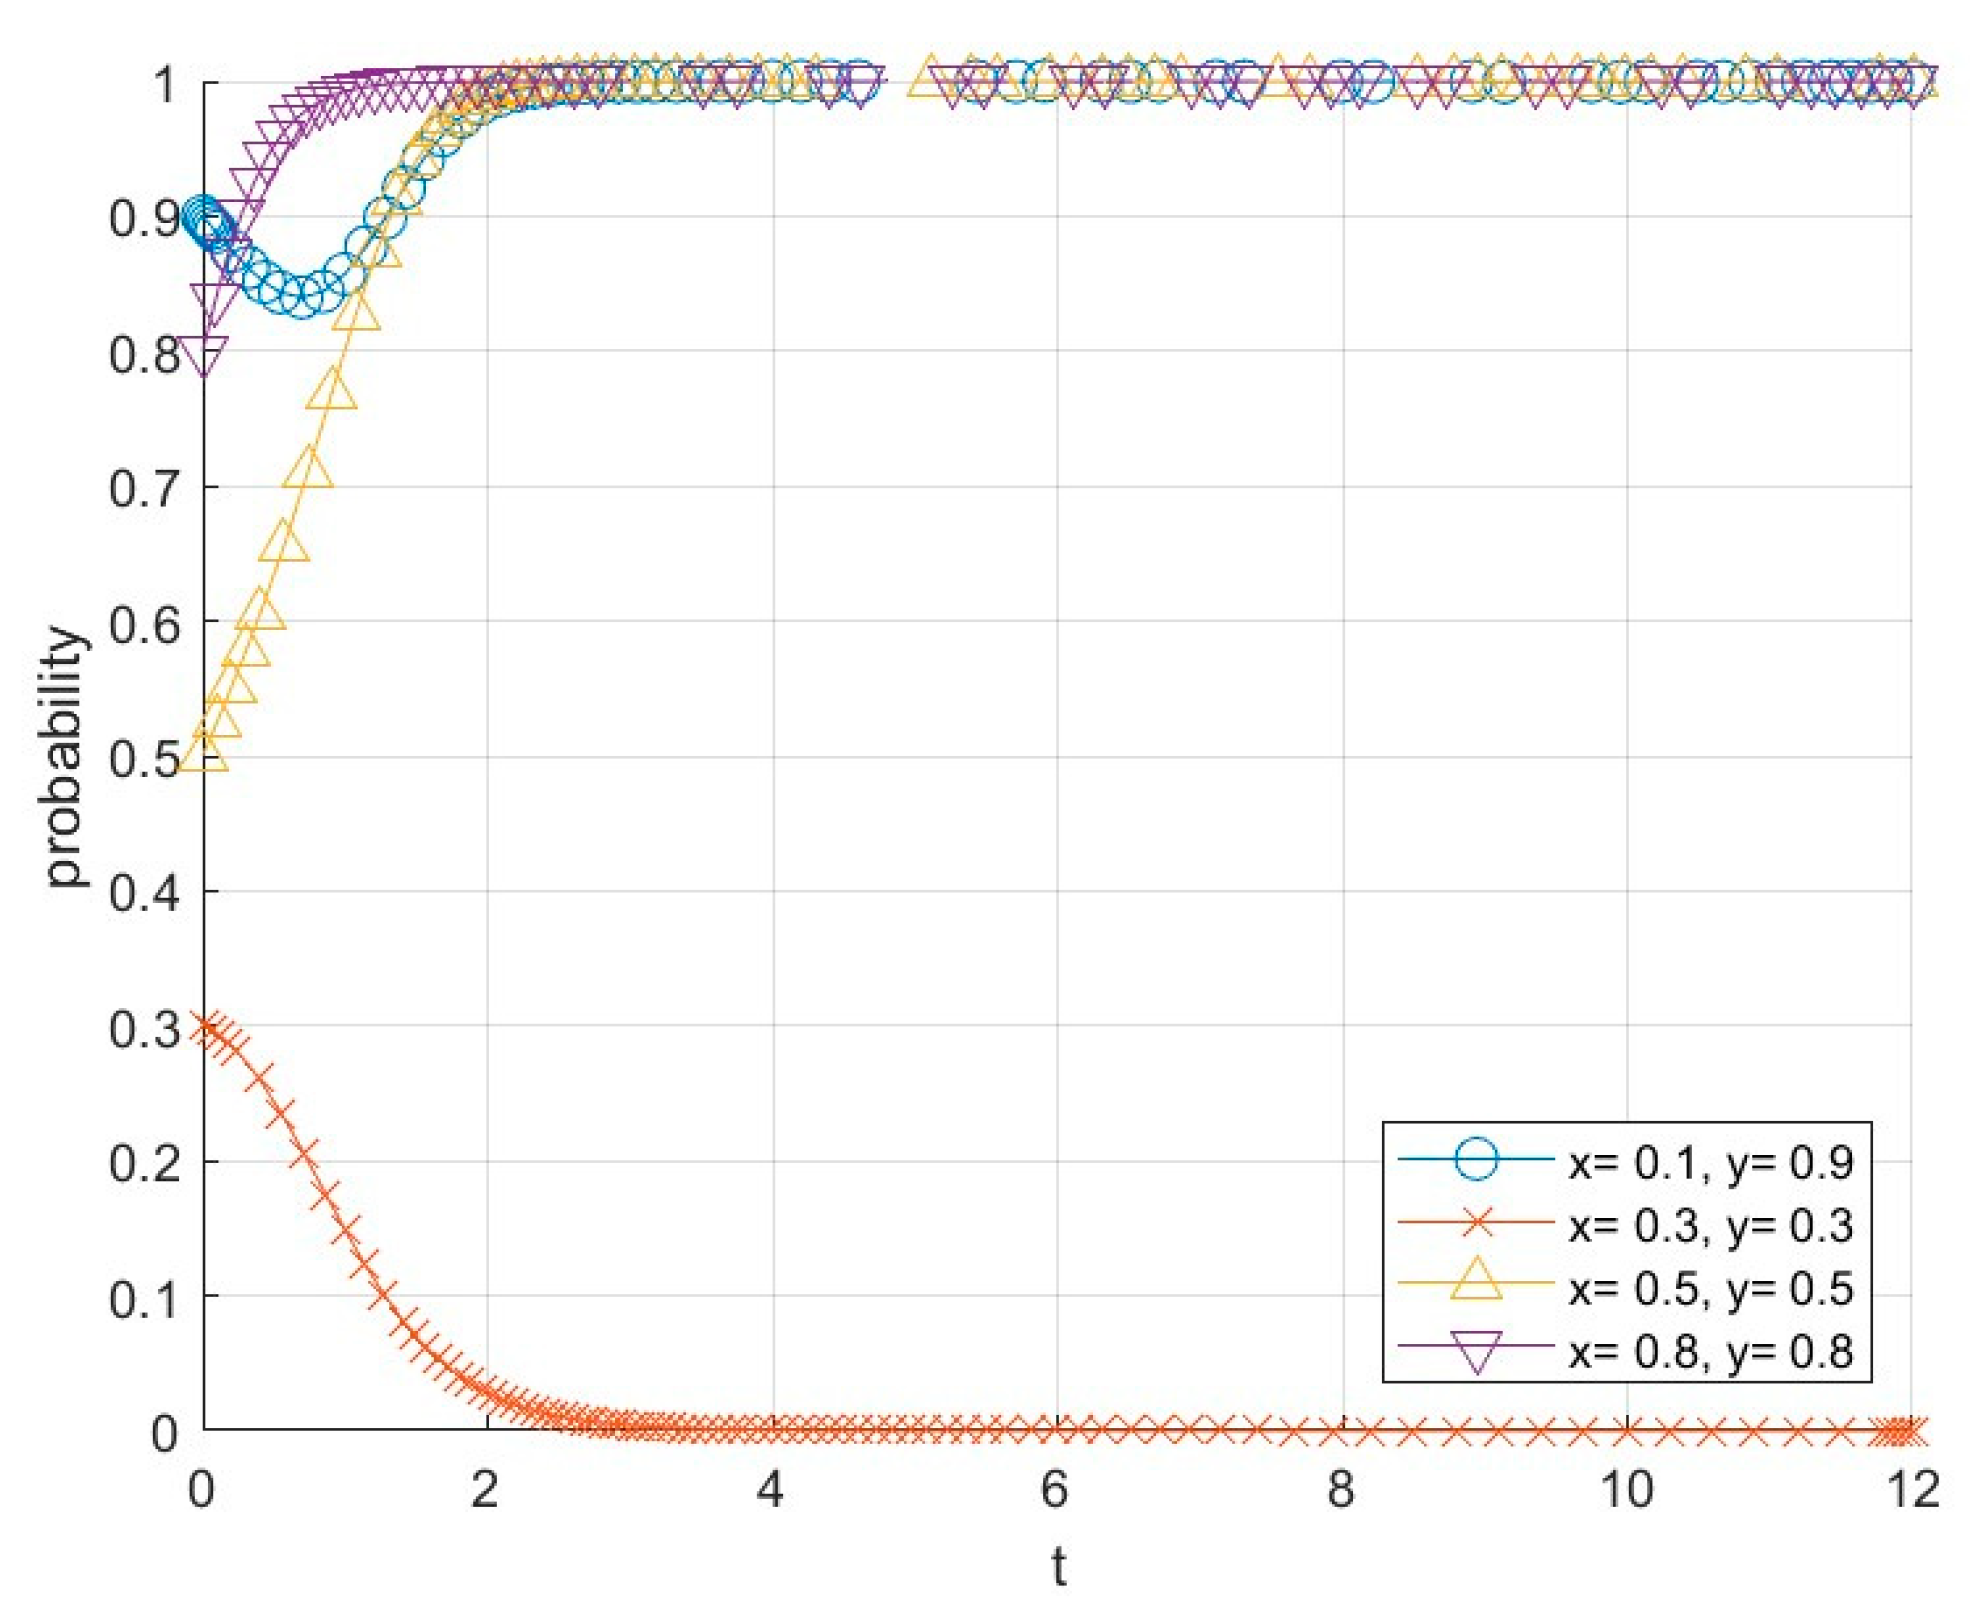
The system evolution path of the simultaneous change of the industrial service system and the supply service system when the innovation service system is not involved is shown in Figure 4. When the initial willingness is less than 0.5, the system evolution tends to (0,0), the market more influences the supply service system, the evolution speed is relatively fast. The curve rapidly decreases to close to 0. When the initial willingness is 0.5, the participation willingness of the industrial service system gradually rises, which leads to the increase in the participation willingness of the supply service system, and the system evolution tends to a stable point (1,1); when the initial willingness is more substantial, the system When the initial willingness is more substantial, the system rapidly evolves to a stable state (1,1), and both parties quickly choose positive cooperation strategies; this indicates that the initial willingness has a significant effect on the system evolution path, the stronger the willingness to cooperate, the faster the system reaches the “positive stability”, and the weaker the willingness to cooperate, the system tends to “negative stability”. The weaker the willingness to cooperate, the system tends to be “negatively stabilized”.
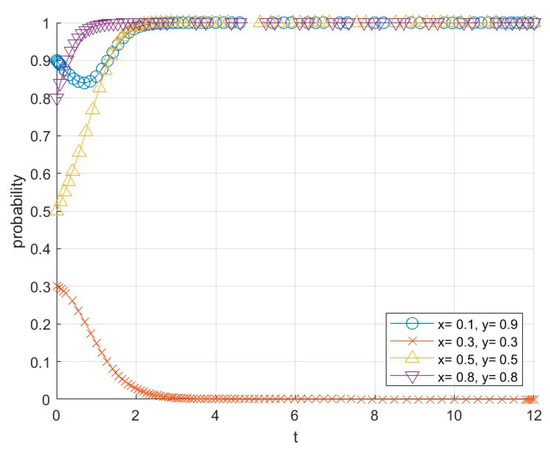
Figure 4.
Evolutionary path of the system with simultaneous changes in x, y when the innovation service system is not involved.
(2) Evolutionary paths of the system with separate changes in x and y
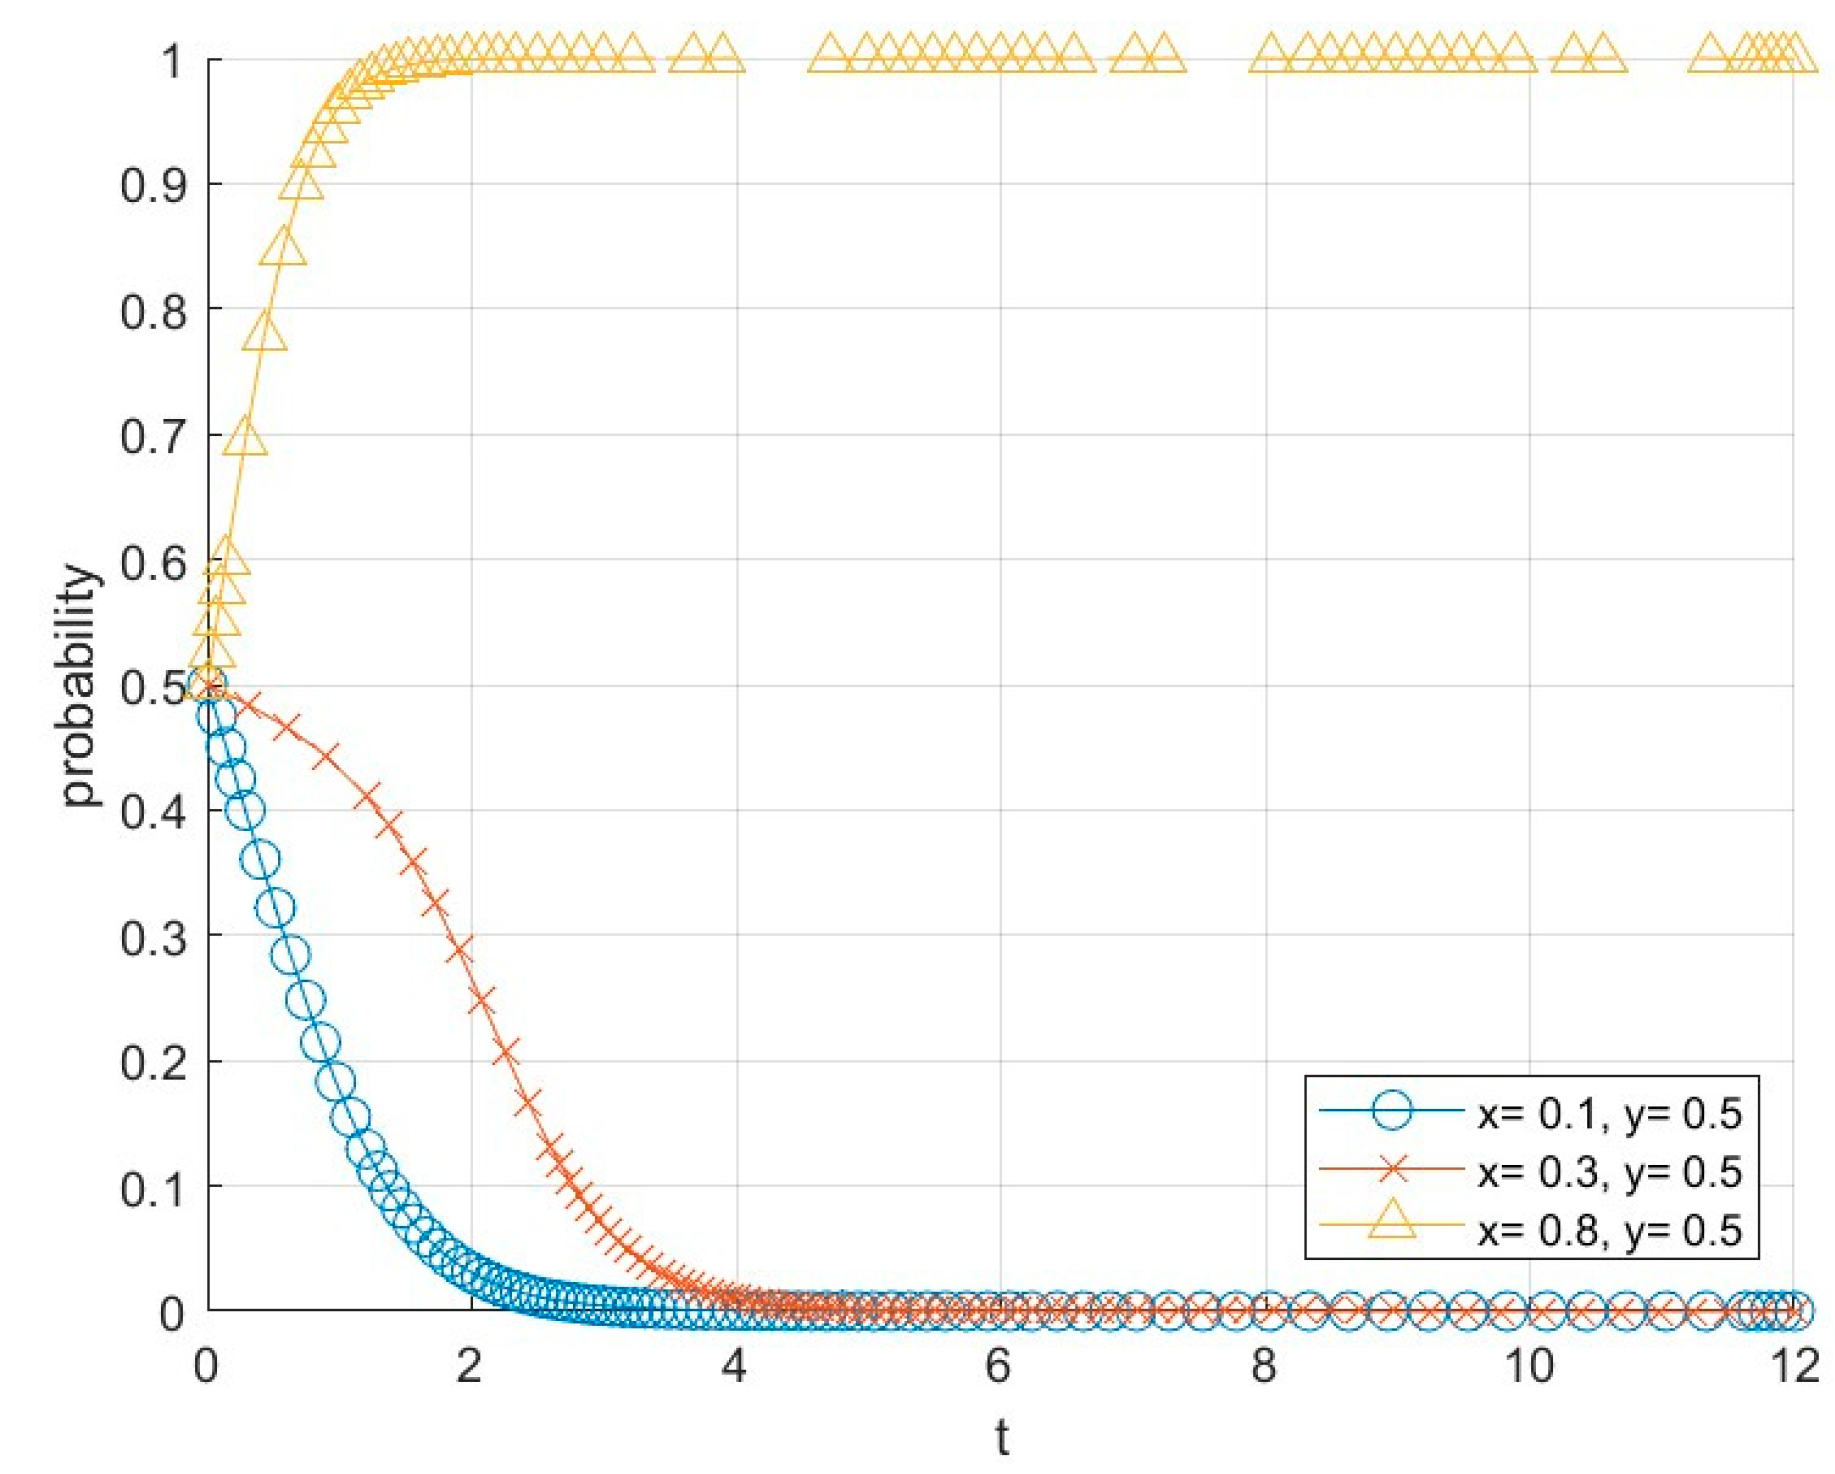
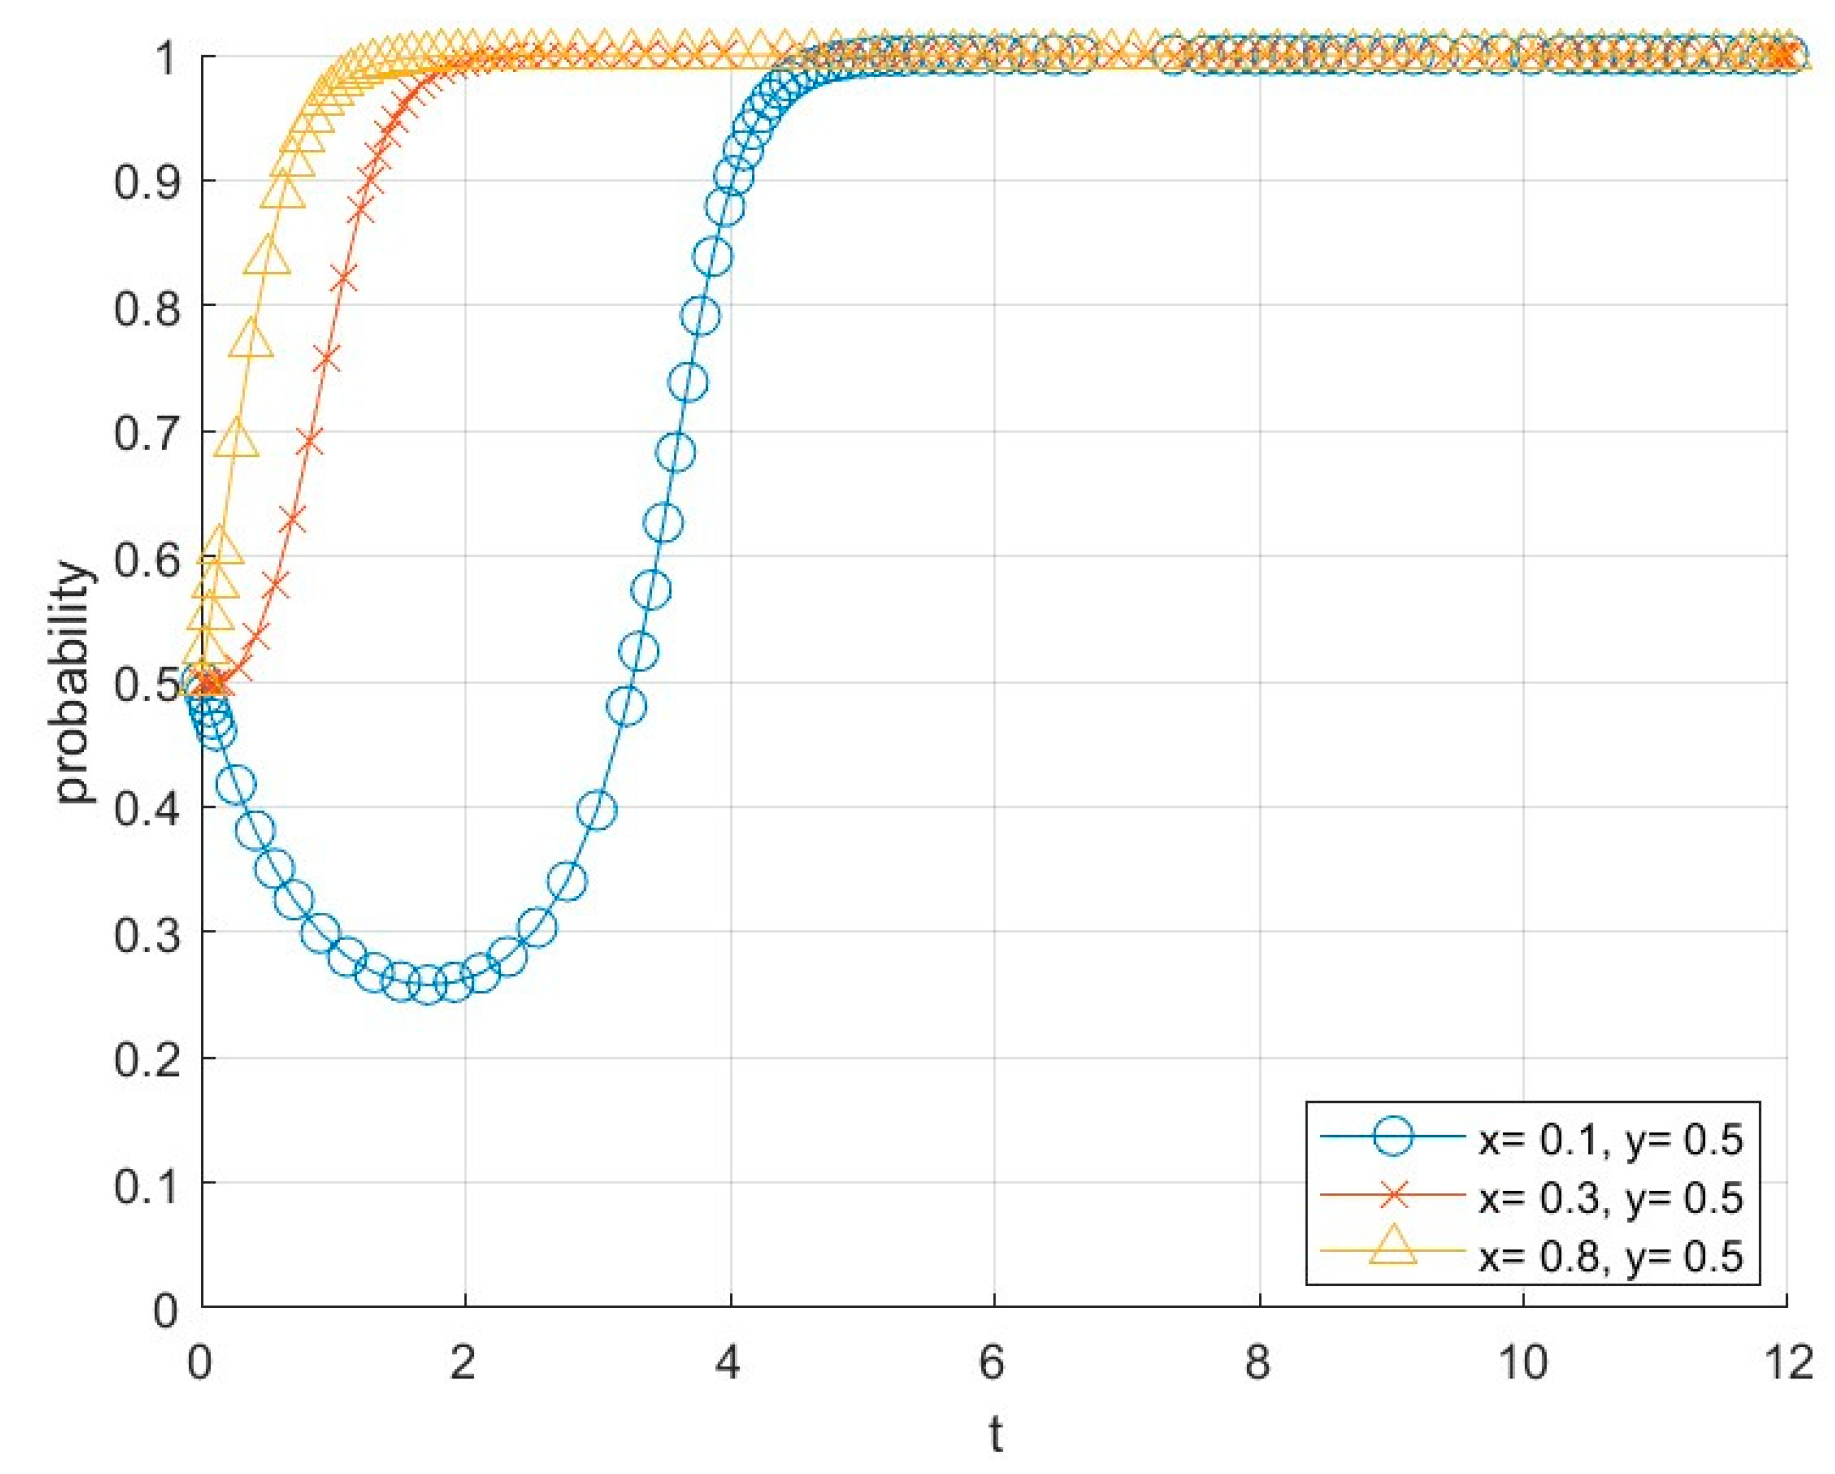
Figure 5 and Figure 6 show the evolution paths of the change of the willingness to participate x of the industrial service system on the strategy choices of both sides of value co-creation when the innovative service system does not participate in value co-creation and when it participates in value co-creation, while the evolution paths of the system when the innovative service system does not participate and when it participates in value co-creation are the same. The comparison shows that when the willingness to participate in the industrial service system is low, and the innovation service system does not participate, the system evolution eventually tends to (0,0), and value co-creation is challenging. In contrast, the curve of the innovation service system’s participation firstly decreases but then rises, which indicates that the coordinating role of the innovation service system can enhance the willingness to participate of both the industrial service system and the supply service system, but only in a slow process. When x increases, the overall probability of the innovation service system not participating still tends to be lower, and the evolution results do not change much; after the innovation service system participates, the curve decreases less and rises faster and can tend to actively participate in value co-creation more quickly. When x is higher than the critical value when the innovation service system is not involved, the industrial service system and the supply service system can also converge to (1,1), but the evolution speed is slightly slower; when the innovation service system is involved, it can quickly promote the two sides to reach the positive value co-creation, which can be seen that the involvement of the innovation service system can improve the evolution speed. It has a more significant influence on the willingness of the industrial service system to participate.
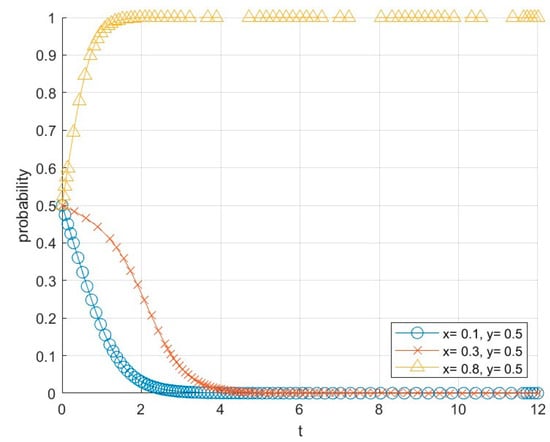
Figure 5.
Diagram of the evolution path for the innovation service system not involving time-x change.
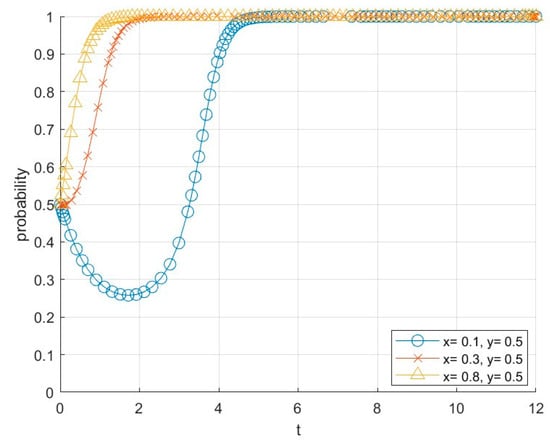
Figure 6.
Diagram illustrating the evolution path of the innovation service system involved in time-x change.
Figure 7 and Figure 8 show the evolution paths of the change of the willingness to participate in the supply service system on the strategy choices of both sides of value co-creation when the innovation service system does not participate in value co-creation and when it participates in value co-creation. At the same time, the curve decreases rapidly and tends to (0,0) when the innovation service system does not participate. When the willingness of the supply service system to participate is low. The innovation service system does not participate, the curve decreases rapidly and tends to (0,0), and it is difficult for both parties to realize the value co-creation. In contrast, the innovation service system participates in the early stage of growth, which is slow. However, it can be driven later, and ultimately, it tends to cooperate actively. When y increases, the curve rises in the early stage and then falls rapidly when the innovation service system is not involved, which still tends to antagonistic cooperation; however, the curve rises obviously and faster when the innovation service system is involved, which can reach the state of positive cooperation more quickly. When y is higher, in the case that the innovation service system is not involved, although it can drive the industrial service system to a certain extent, when the innovation service system is involved, it can promote the cooperation between the industrial service system and the supply service system to enter into the state of positive cooperation and value co-creating very quickly.
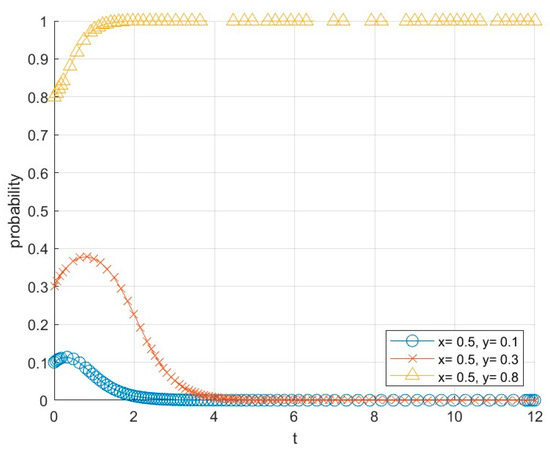
Figure 7.
Diagram of the system evolution path for an innovation service system that does not involve time variation.
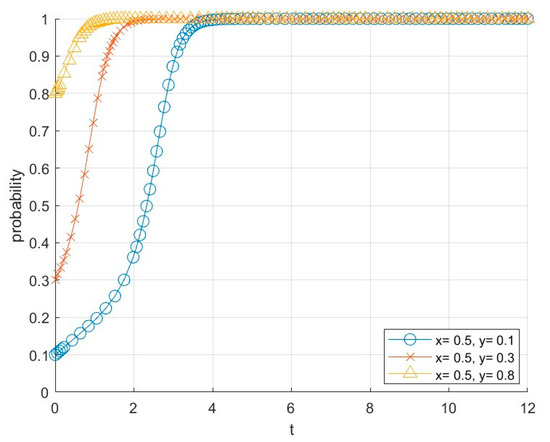
Figure 8.
Diagram of the system evolution path of the innovation service system involved in time-y change.
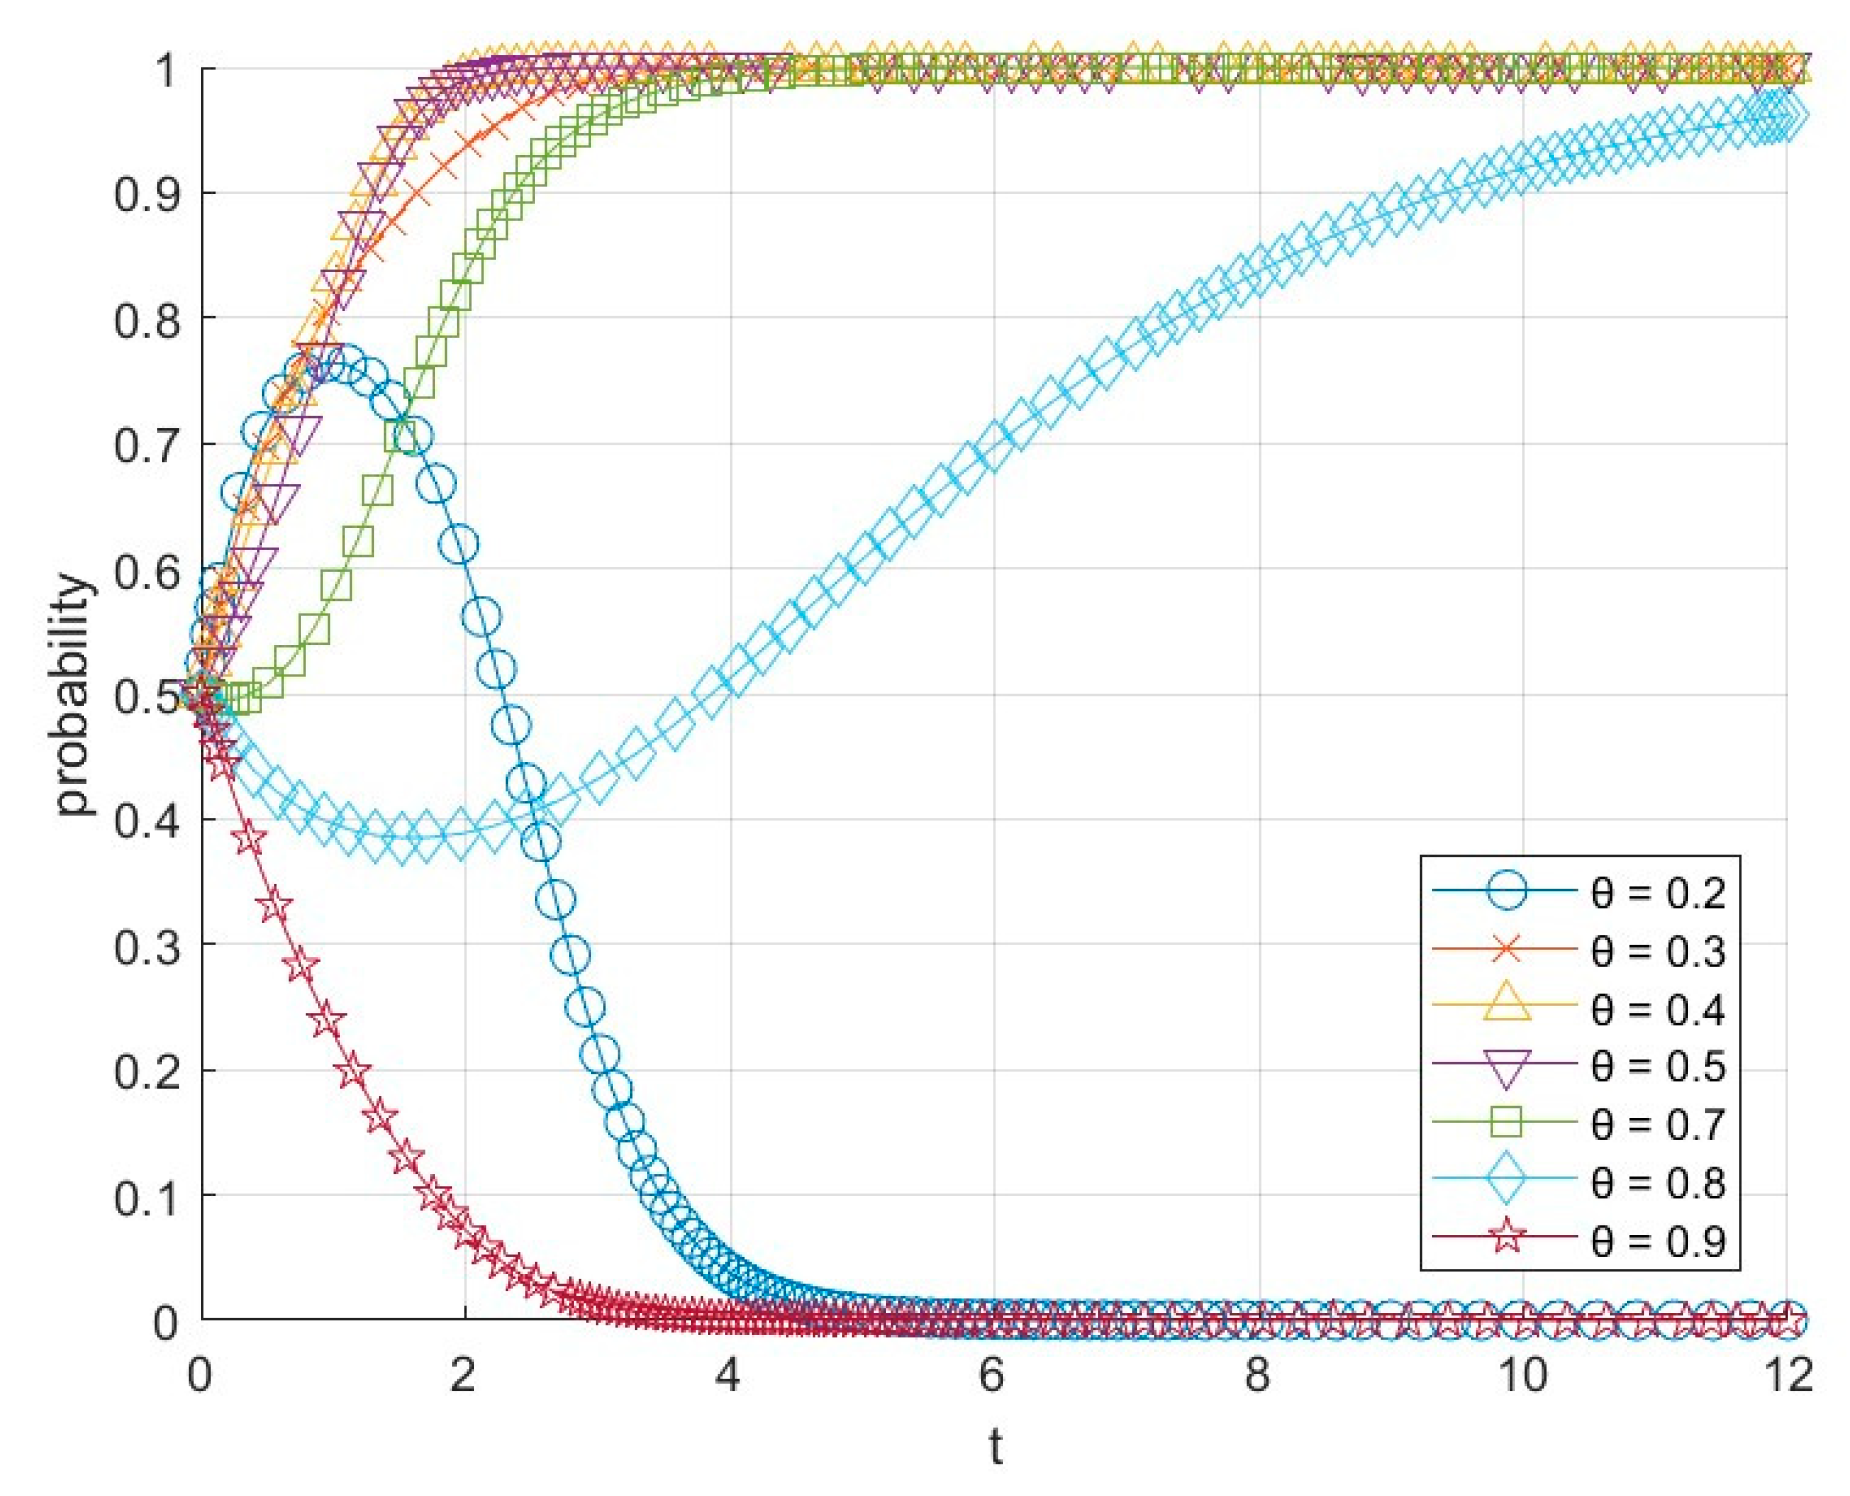
6.2. The Effect of the Distribution Coefficient of Potential Market Income on System Evolution
Under the condition that other parameters remain unchanged, the evolution paths of the strategic choices for the industrial service system and the supply service system regarding the potential market revenue distribution coefficient are detailed in Figure 9 and Figure 10. When the innovation service system does not participate in value co-creation, as shown in Figure 9, when the revenue distribution coefficient θ < 0.2 or θ > 0.9, due to dissatisfaction with the distribution ratio from one side, the willingness of both the industrial service system and the supply service system to cooperate is relatively low. They ultimately tend to choose the passive cooperation strategy. When the coefficient of benefit distribution is 0.4 < θ < 0.7, the willingness of both the industrial service system and supply service system to participate rises significantly because the benefits obtained by the main body of value co-creation are closer. In this case, both parties have a more balanced distribution of benefits, and each other’s satisfaction with the cooperation is higher; thus, they are more willing to actively cooperate and jointly promote the value co-creation of agro-ecological products; when the coefficient of benefit distribution is located at 0.3 < θ < 0.4 or 0.7 < θ < 0.8, one party may obtain a higher benefit, which makes the willingness to cooperate with the other party decrease temporarily. However, since the difference in gains is in a reasonable range, as the participation of the high-gaining party increases, the low-gaining party will also gradually increase the degree of cooperation, and the two parties will still be able to reach synergistic cooperation in the end.
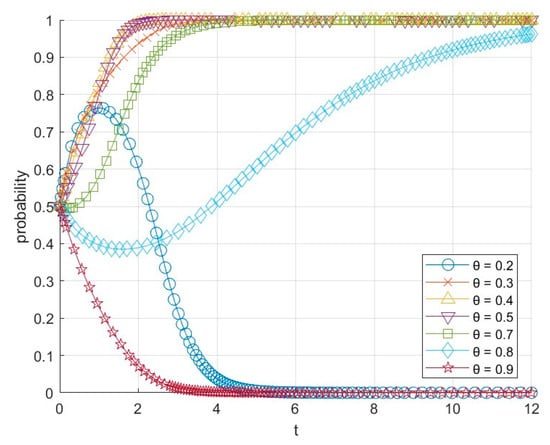
Figure 9.
Diagram of system evolution path for innovation service system not involved in time θ change.
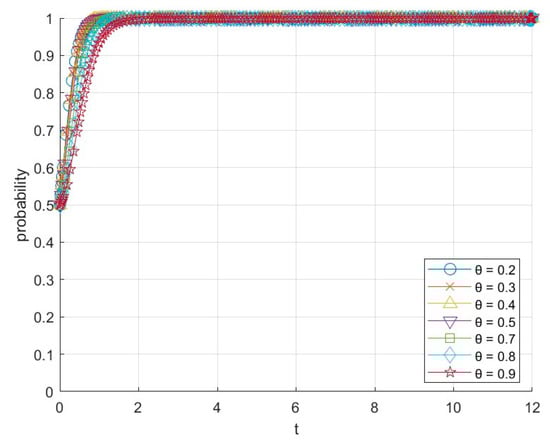
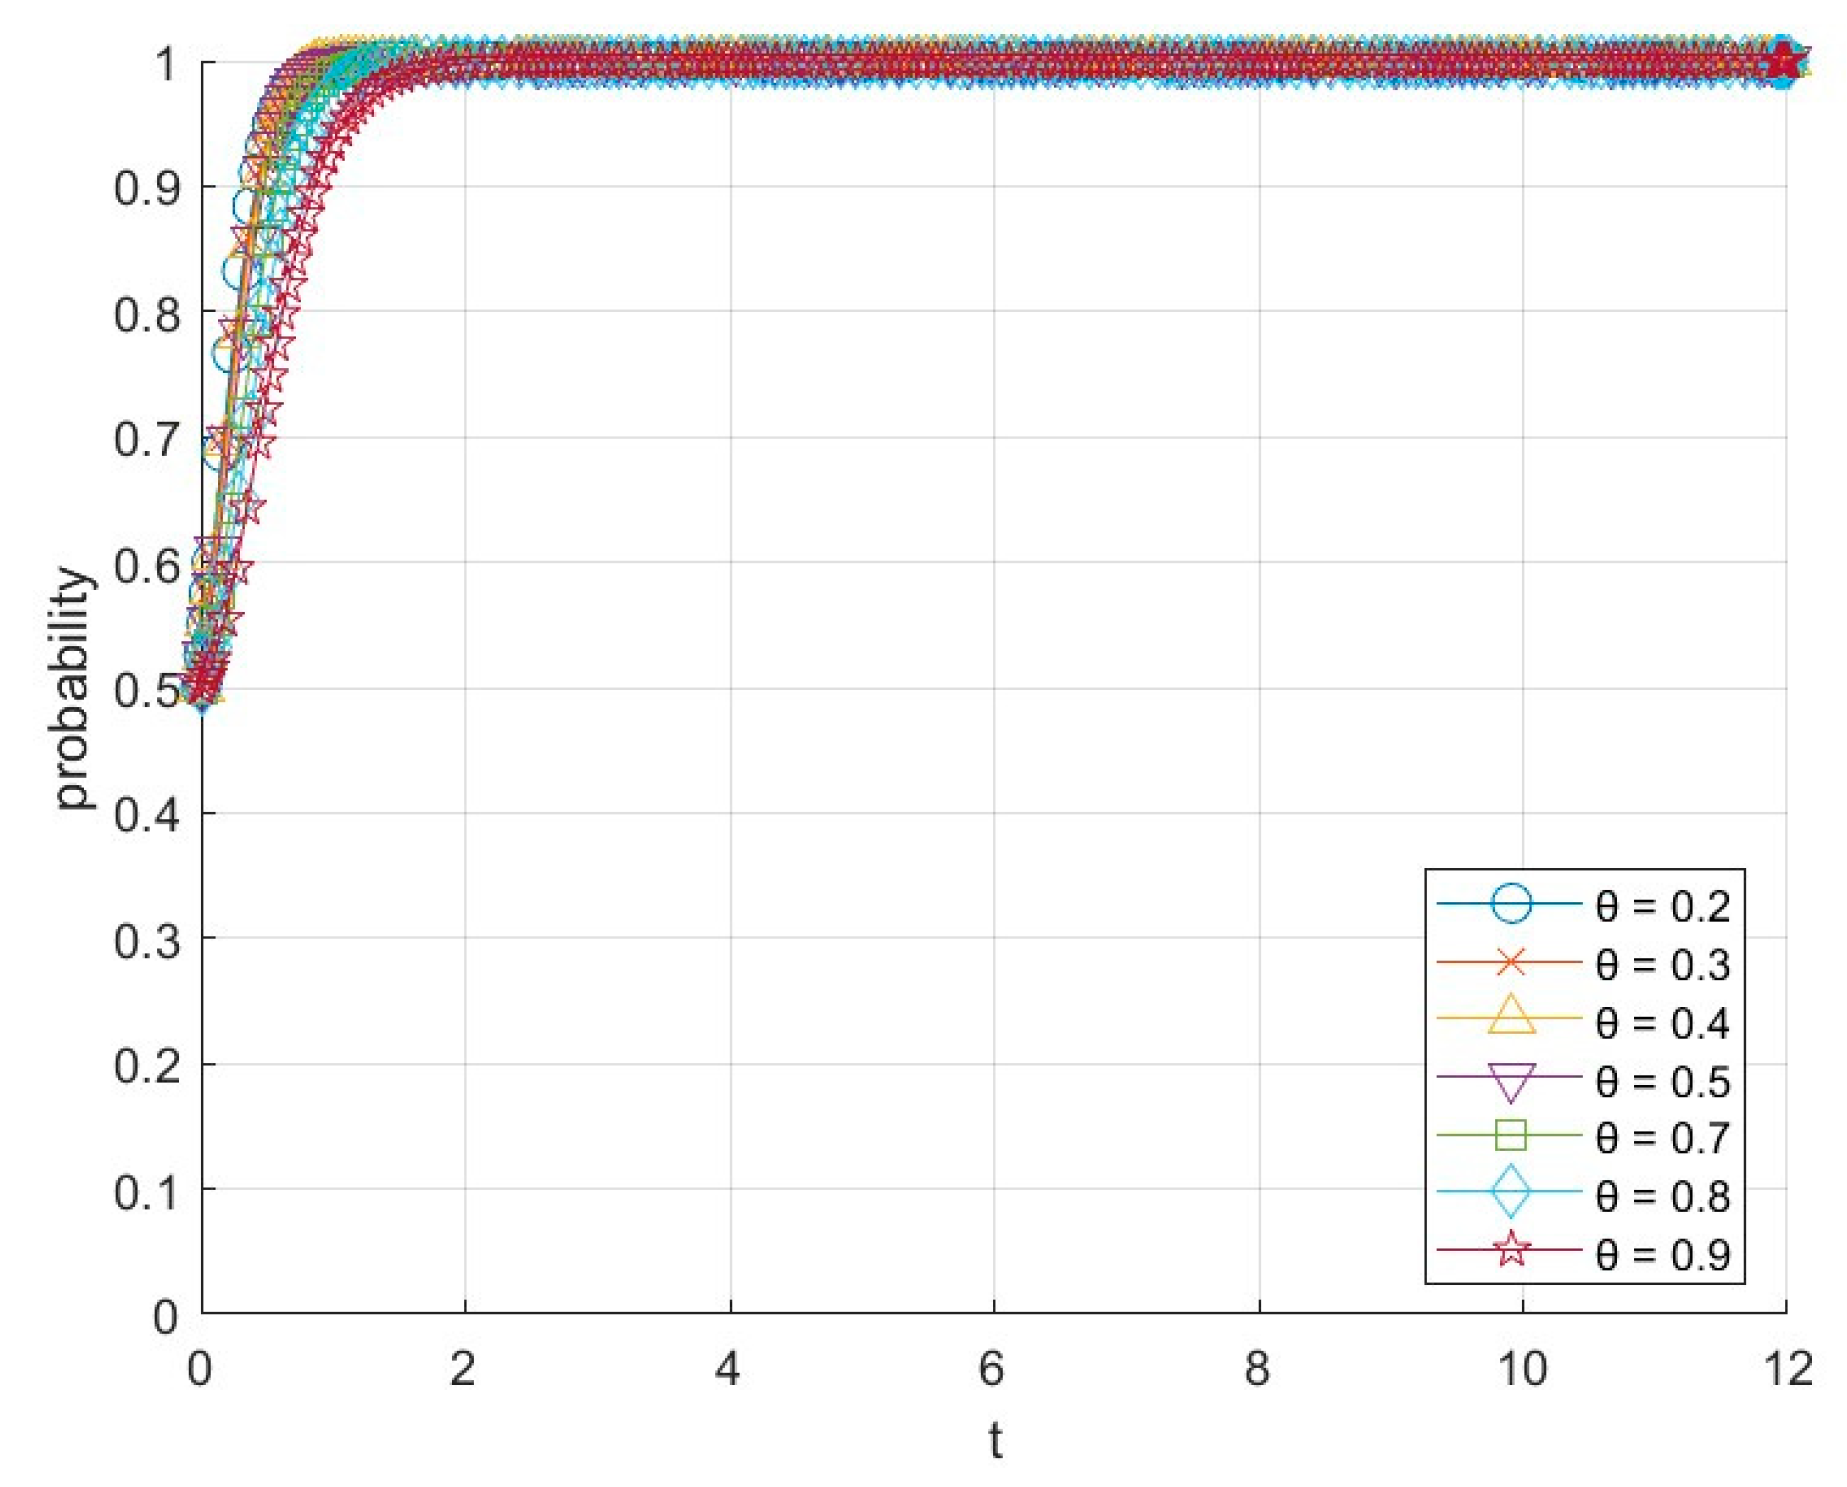
Figure 10.
Diagram of the system evolution path of the innovation service system involved in time θ change.
In Figure 10, all curves eventually stabilize, close to 1. This shows that under the participation of the innovation service system, the system will eventually reach a relatively stable strategy state, and the willingness to participate of the industrial service system and supply service system will tend to be consistent. It can be seen that the participation of the innovation service system significantly improves the system stability. Compared with Figure 9, the curve in Figure 10 is smoother and reaches a stable state faster. This indicates that the innovation service system plays an important role in coordinating the interests of all parties and promoting cooperation. In the early stage of system evolution, the willingness of all parties to participate may fluctuate under the influence of the benefit distribution coefficient θ. However, as the operating time of the system increases, all parties gradually realize that the active cooperation strategy can bring better long-term benefits, so they will eventually choose the active cooperation strategy. This dynamic change suggests that the participation in the innovation service system can not only promote short-term cooperation, but also help the system to develop in a more stable and efficient direction through long-term coordination and optimization.
6.3. Impact of Co-Innovation Distribution Coefficients on System Evolution
The allocation coefficients for positive co-innovation gains and adverse co-innovation losses can be determined by market dynamics or regulated through government policies. These coefficients can be analyzed through two dynamic evolution game simulation scenarios depending on the specific context. In the first scenario, market forces dictate the coefficients for positive co-innovation gains and adverse co-innovation losses, reflecting the proportional relationship between gains and losses related to market risk (with values of γ = 0.3, ω = 0.3; γ = 0.7, ω = 0.7). In the second scenario, government policies are implemented to promote the development of an innovative service system, resulting in more significant gains and reduced losses for optimistic innovations, while conversely, there are lower gains and increased losses for harmful innovations (with values of γ = 0.4, ω = 0.6; γ = 0.4, ω = 0.6).
The simulation results of the dynamic evolution game concerning co-innovation allocation coefficients are illustrated in Figure 11. As depicted in Figure 11, in a freely regulated market environment, the allocation coefficients of positive co-innovation gains and adverse co-innovation losses exhibit a clear trend: more significant allocation coefficients correspond to a faster progression toward a steady state in the overall dynamic evolution. Conversely, smaller allocation coefficients result in a slower approach to the steady state. Moreover, when government regulation is applied through policies that promote collaborative development within the innovation service system, such initiatives can enhance the dynamic evolution process. Regulatory policies encouraging cooperative innovation while increasing gains and reducing losses can expedite the transition to a steady state. However, it is noteworthy that the speed of dynamic evolution in reaching this steady state under policy regulation is slightly slower than that observed in a freely regulated market scenario.
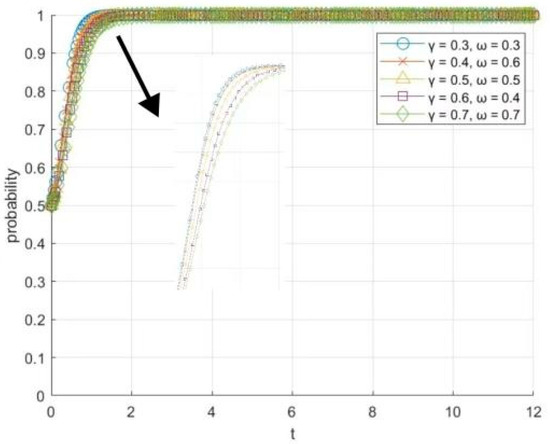
Figure 11.
Diagram of the system evolution path of the impact of the co-innovation distribution coefficient.
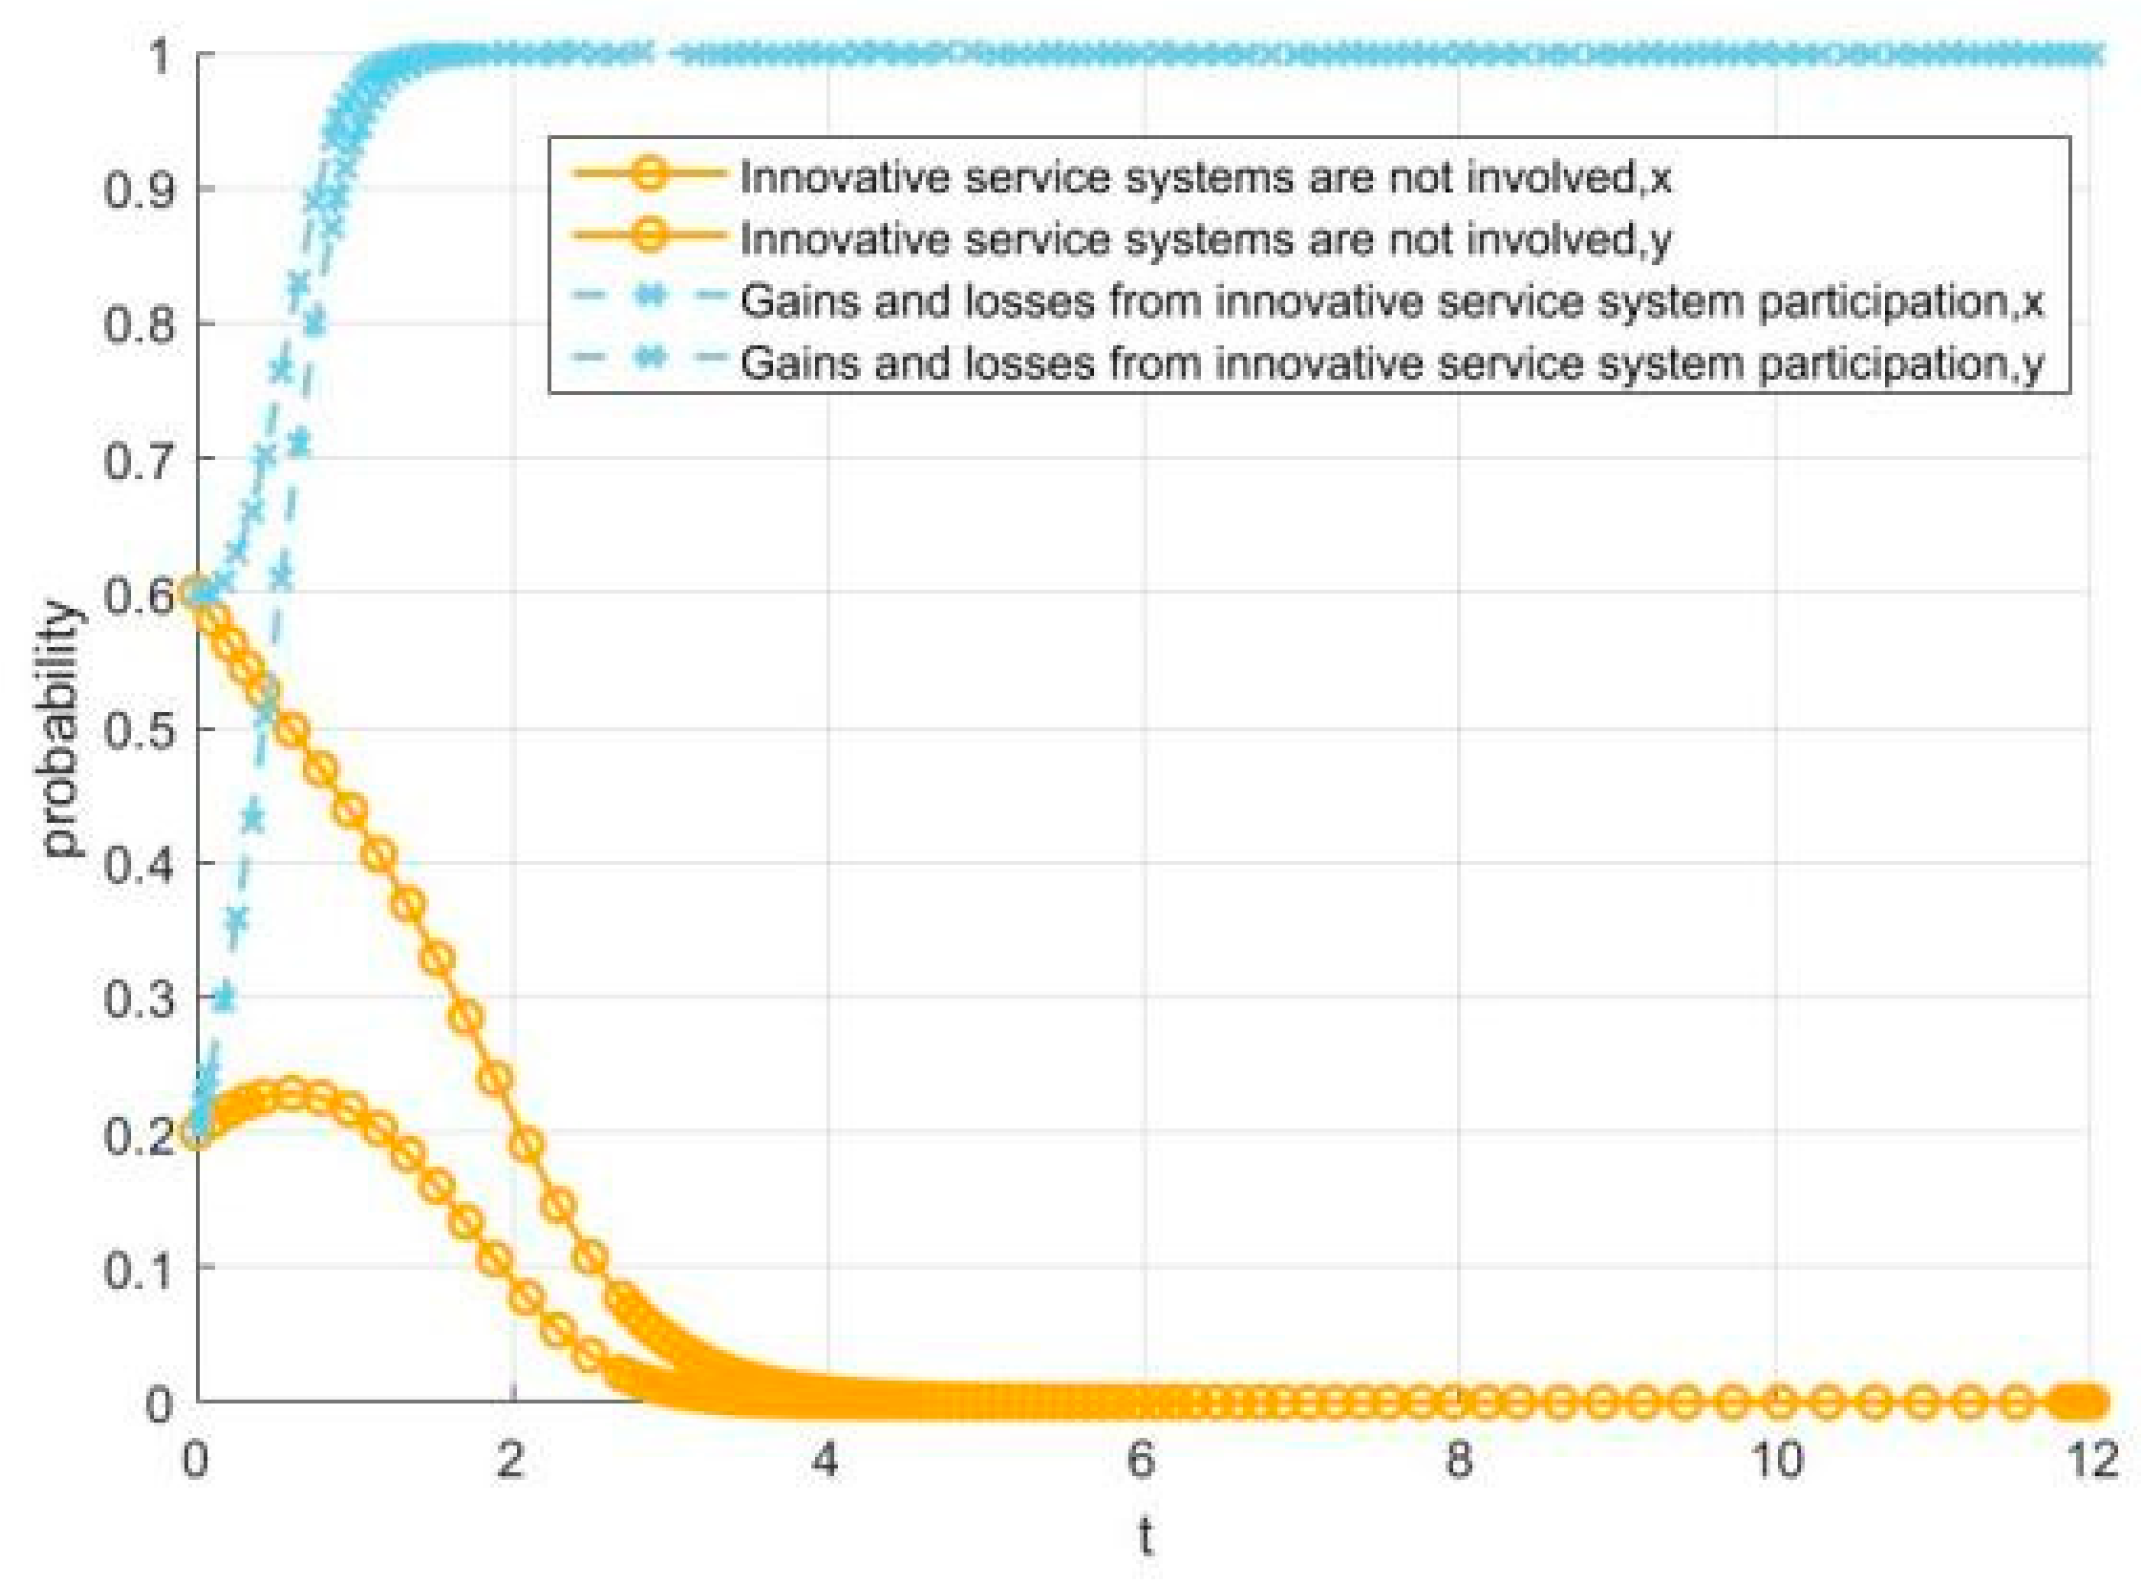
6.4. Impact of Innovation Service System Participation on System Evolution
In the scenario where other parameters remain unchanged, Figure 12 illustrates the simulation results regarding the impact of the innovation service system’s participation in value co-creation on the evolution of the game system. As depicted in Figure 12, in the absence of the innovation service system, the willingness for only one party—either the industrial or supply service system—to actively engage in co-innovation is notably high. This leads to a system that ultimately converges towards antagonistic cooperation. However, when the innovation service system becomes involved in value co-creation, it generates positive co-innovation gains and losses for the party that does not actively participate. Consequently, the willingness of both the industrial and supply service systems to engage in co-innovation tends to reach an ideal state. Moreover, the speed of convergence is significantly enhanced, indicating that the participation of the innovation service system is beneficial for guiding the cooperation strategies of various stakeholders towards an optimal stable state. This, in turn, fosters value co-creation among the upstream participants in the supply chain for agro-ecological products.

Figure 12.
Pathway diagram of the impact of gains and losses from innovation service system participation on system evolution.
7. Conclusions and Discussion
7.1. Conclusions of This Study
Based on limited rationality, this study focuses on coordinating interests in developing the eco-agriculture industry. It breaks through the traditional microscopic vision limitation of focusing on the central bodies of the supply chain of agro-ecological products in the past. Given the multiple subjects in the supply chain of the eco-agriculture industry and the complexity of the spatial and temporal structure and loose coupling between the subjects, we innovatively start from the three dimensions of the industrial service system, the supply service system, and the innovation service system; establish a game model of the upstream subjects of the supply chain of agro-ecological products in terms of the evolution of the cooperation strategy of the co-creation of value; and simulate the dynamics of the participating subjects’ game using Matlab software. We further analyze the influence of the initial willingness to participate, the potential market revenue distribution coefficient, and other factors on the dynamic evolution of the upstream subject’s participation in the value co-creation system and obtain the following conclusions:
(1) In the development of agro-ecological products towards high quality, the deep integration and synergistic development of industrial, supply, and innovation service systems are crucial. By constructing a dynamic evolution model to make up for the shortcomings of the traditional static game theory, we analyze the influence of the interest coordination mechanism on the dynamic evolution game path in the process of integration and synergistic development of the three systems and precisely locate the key nodes that affect the game results. This provides powerful support for the government’s scientific decision making and precise policy making; helps the government promote the formation of smooth circular relationships among the systems; promotes the continuous extension of the value chain; has positive and far-reaching significance for the industrial strengthening initiatives such as the casting chain, strengthening chain, attracting chain, and replenishing chain; and provides practical and feasible suggestions for the value co-creation of eco-agriculture.
(2) Initial conditions play a significant role in shaping the evolutionary pathways of the system, with the initial willingness of the involved parties to collaborate being a determinant of the system’s trajectory toward stability. Given the high volatility and susceptibility of the supply service system to external influences, fluctuations in the industrial service system can substantially impact its stability. It is crucial to foster a culture of collaboration through organized exchange initiatives, cooperation demonstration projects, and similar efforts to enhance mutual understanding and trust between the industrial and supply service systems. Increasing the initial willingness to cooperate will facilitate the system’s movement toward “positive stability”, thus establishing a foundation for long-term and sustainable development for agro-ecological products.
(3) The mechanisms of potential market revenue distribution and cooperation costs significantly influence the willingness of key actors to engage in value co-creation. Government and regulatory bodies are encouraged to formulate equitable and reasonable benefit distribution plans considering stakeholders’ demands, catalyzing their motivation to participate in value co-creation efforts. Concurrently, costs associated with cooperation should be alleviated through technological innovations. When benefit distribution is perceived as inequitable, there is a tendency for the value co-creation system to adopt a negative cooperation strategy, which is counterproductive to the development of agro-ecological products. However, the involvement of an innovation service system can incentivize cooperative engagement. Thus, promoting active participation of the innovation service system in value co-creation for agro-ecological products is essential to its facilitative role.
(4) The involvement of innovation service systems is key to enhancing the efficiency of collaborative innovation. In its absence, even if one of the industrial service systems and supply service systems is actively involved, the system may eventually fall into negative evolution. The active participation of the innovation service system not only brings positive benefits but also increases the willingness of other systems to participate and accelerates system convergence by changing the pattern of profit and loss distribution. This study shows that the co-innovation allocation coefficient has a significant effect on system evolution. When the positive gain distribution coefficient γ > 0.5, the system tends to stabilize faster and the synergy efficiency is higher. Therefore, it is recommended that the government introduce policies to guide the regulation of the coefficient of distribution of collaborative innovation (γ), and reasonably set the range of values of γ in the design of the incentive mechanism, to ensure that the innovation service system receives benefits matching its contribution in collaborative innovation, and at the same time, enhance the enthusiasm of other systems in collaboration. To sum up, we should strengthen the core position of the innovation service system, promote its deep participation in all aspects of agro-ecological product operation, and combine the “market–policy” dual-round control strategy, on the basis of the market mechanism, to guide the allocation efficiency and play the role of policy to correct system imbalance or direction deviation, to realize the efficient synergy of the industrial service system, supply service system, and innovation service system.
(5) In scenarios where the innovation service system is absent from value co-creation efforts, the active participation of only one industrial or supply service system can result in antagonistic cooperation outcomes. Conversely, including an innovation service system facilitates positive innovation benefits and generates losses for those systems that do not engage actively. This participation encourages other stakeholders to join the initiative, hastening convergence toward an ideal operational state. Therefore, it is crucial to reinforce the pivotal role of the innovation service system, promoting its active engagement across all facets of agro-ecological product operations and fostering robust cooperation between the industrial and supply service systems.
7.2. Discussion
This study constructs the theoretical framework of “industry-supply-innovation”. It explores the evolutionary paths of collaborative innovation behaviors of each subject by using the evolutionary game model, which highlights the core role of the innovation service system in promoting collaborative innovation. Since this study mainly focuses on theoretical modeling and simulation analysis, setting some key parameters is primarily based on literature induction and logical deduction. It has not yet been comprehensively calibrated with empirical data or real cases, which proposes a space for further verification of the applicability of the research conclusions. In addition, although the “market-policy” dual-round control strategy has been initially proposed, the specific implementation measures can be further improved in future research. In the future, the model parameters and policy design can be further optimized through field research and case analysis to better guide the practical application of the eco-agriculture industry.
Author Contributions
Q.S.: Data curation, Writing—original draft, Methodology, Formal analysis. R.W.: Conceptualization, Data analysis guidance, Supervision. Y.S.: Writing—review & editing, method selection. All authors have read and agreed to the published version of the manuscript.
Funding
This research was funded by “China Postdoctoral Science Foundation”, [Name of sponsor: Yang Su, grant number: 2023MD734231].
Institutional Review Board Statement
Not applicable.
Informed Consent Statement
Not applicable.
Data Availability Statement
The authors do not have permission to share data.
Acknowledgments
The authors are grateful for their support.
Conflicts of Interest
The authors declare that they have no known competing financial interests or personal relationships that could have appeared to influence the work reported in this paper.
References
- Liu, G.Y.; He, P.; Wang, Y.Y. Agro-ecological product and its value realization pathway. Ying Yong Sheng Tai Xue Bao=J. Appl. Ecol. 2021, 32, 737–749. [Google Scholar] [CrossRef]
- Zhuan, W.; Wei, Z.; Cheng, J.I.A. New-quality productivity empowers the value realization of agro-ecological products: Theoretical logic and realization path. Chin. J. Eco-Agric. 2024, 32, 1756–1765. [Google Scholar] [CrossRef]
- Liu, J.; Su, X.; Liu, Y.; Shui, W. A review of research on progress in the theory and practice of eco-product value realization. Land 2024, 13, 316. [Google Scholar] [CrossRef]
- Lamine, C.; Dawson, J. The agroecology of food systems: Reconnecting agriculture, food, and the environment. Agroecol. Sustain. Food Syst. 2018, 42, 629–636. [Google Scholar] [CrossRef]
- Shi, T.; Han, F.; Chen, L.; Shi, J.; Xiao, H. Study on value co-creation and evolution game of low-carbon technological innovation ecosystem. J. Clean. Prod. 2023, 414, 137720. [Google Scholar] [CrossRef]
- Deng, M.; Xiang, G.; Yao, S. The effectiveness of the multilateral coalition to develop a green agricultural products market in China based on a TU cooperative game analysis. Sustainability 2018, 10, 1476. [Google Scholar] [CrossRef]
- Liu, Y.; Sun, D.; Wang, H.; Wang, X.; Yu, G.; Zhao, X. An evaluation of China’s agricultural green production: 1978–2017. J. Clean. Prod. 2020, 243, 118483. [Google Scholar] [CrossRef]
- Shen, H.; Liu, Z.; Xiong, K.; Li, L. A study revelation on market and value-realization of ecological product to the control of rocky desertification in south China karst. Sustainability 2022, 14, 3060. [Google Scholar] [CrossRef]
- Hamidoğlu, A. A game-theoretical approach on the construction of a novel agri-food supply chain model supported by the government. Expert Syst. Appl. 2024, 237, 121353. [Google Scholar] [CrossRef]
- Perlman, Y.; Ozinci, Y.; Westrich, S. Pricing decisions in a dual supply chain of organic and conventional agricultural products. Ann. Oper. Res. 2022, 314, 601–616. [Google Scholar] [CrossRef]
- Mitchell, R.K.; Agle, B.R.; Wood, D.J. Toward a Theory of Stakeholder Identification and Salience: Defining the Principle of Who and What Really Counts. Acad. Manag. Rev. 1997, 22, 853. [Google Scholar] [CrossRef]
- Waligo, V.M.; Clarke, J.; Hawkins, R. Implementing sustainable tourism: A multi-stakeholder involvement management framework. Tour. Manag. 2013, 36, 342–353. [Google Scholar] [CrossRef]
- Xie, Y.; Su, Y.; Li, F. The Evolutionary Game Analysis of Low Carbon Production Behaviour of Farmers, Government and Consumers in Food Safety Source Governance. Int. J. Environ. Res. Public Health 2022, 19, 12211. [Google Scholar] [CrossRef] [PubMed]
- Deng, L.; Zhang, H.; Wang, C.; Ma, W.; Zhu, A.; Zhang, F.; Jiao, X. Improving the sustainability of the wheat supply chain through multi-stakeholder engagement. J. Clean. Prod. 2021, 321, 128837. [Google Scholar] [CrossRef]
- Cao, W.; Tao, X. A Study on the Evolutionary Game of the Four-Party Agricultural Product Supply Chain Based on Collaborative Governance and Sustainability. Sustainability 2025, 17, 1762. [Google Scholar] [CrossRef]
- Vargo, S.L.; Lusch, R.F. Service-dominant logic: Continuing the evolution. J. Acad. Mark. Sci. 2007, 36, 1–10. [Google Scholar] [CrossRef]
- Pinho, N.; Beirão, G.; Patrício, L.; PFisk, R. Understanding value co-creation in complex services with many actors. J. Serv. Manag. 2014, 25, 470–493. [Google Scholar] [CrossRef]
- Vargo, S.L.; Lusch, R.F. From Repeat Patronage to Value Co-creation in Service Ecosystems: A Transcending Conceptualization of Relationship. J. Bus. Mark. Manag. 2010, 4, 169–179. [Google Scholar] [CrossRef]
- Jayashankar, P.; Johnston, W.J.; Nilakanta, S.; Burres, R. Co-creation of value-in-use through big data technology-a B2B agricultural perspective. J. Bus. Ind. Mark. 2020, 35, 508–523. [Google Scholar] [CrossRef]
- Meynhardt, T.; Chandler, J.D.; Strathoff, P. Systemic principles of value co-creation: Synergetics of value and service ecosystems. J. Bus. Res. 2016, 69, 2981–2989. [Google Scholar] [CrossRef]
- Wei, J. Building a new development pattern for the 14th Five-Year Plan based on a strong domestic market. J. Chang. Univ. (Soc. Sci. Ed.) 2021, 23, 19–23. (In Chinese) [Google Scholar]
- Zhang, Q.; Research Group of Institute of Industrial Economics; Chinese Academy of Social Sciences; Zhang, Q. Research on the path to enhance the modernization level of industrial chain supply chain. China Ind. Econ. 2021, 2, 80–97. [Google Scholar] [CrossRef]
- Borodin, V.; Bourtembourg, J.; Hnaien, F.; Labadie, N. Handling uncertainty in agricultural supply chain management: A state of the art. Eur. J. Oper. Res. 2016, 254, 348–359. (In Chinese) [Google Scholar] [CrossRef]
- Tsolakis, N.K.; Keramydas, C.A.; Toka, A.K.; Aidonis, D.A.; Iakovou, E.T. Agrifood supply chain management: A comprehensive hierarchical decision-making framework and a critical taxonomy. Biosyst. Eng. 2014, 120, 47–64. [Google Scholar] [CrossRef]
- Ostrovsky, M. Stability in supply chain networks. Am. Econ. Rev. 2008, 98, 897–923. [Google Scholar] [CrossRef]
- Bai, Y.; Wu, H.; Huang, M.; Luo, J.; Yang, Z. How to build a cold chain supply chain system for fresh agricultural products through blockchain technology—A study of tripartite evolutionary game theory based on prospect theory. PLoS ONE 2023, 18, e0294520. [Google Scholar] [CrossRef]
- Huo, Y.; Wang, J.; Guo, X.; Xu, Y. The collaboration mechanism of agricultural product supply chain dominated by farmer cooperatives. Sustainability 2022, 14, 5824. [Google Scholar] [CrossRef]
- Heimeriks, K.H.; Schreiner, M. Relational quality, alliance capability, and alliance performance: An integrated framework. In Enhancing Competences for Competitive Advantage; Emerald Group Publishing Limited: Leeds, UK, 2010; pp. 145–171. [Google Scholar] [CrossRef]
- Fischer, C.; Reynolds, N. Collaborative advantage, relational risks and sustainable relationships: A literature review and definition. In Agri-Food Chain Relationships; CABI: Delémont, Zwitserland, 2010; pp. 74–87. [Google Scholar] [CrossRef]
- Sun, Y.; Zhu, Z.; Yang, H. Fairness perception, trust perception, and relationship quality in agricultural supply chains. J. Food Qual. 2021, 2021, 8817003. [Google Scholar] [CrossRef]
- He, Y.; Wang, W. Theoretical Explanation of Data Factor Marketization. Contemp. Econ. Res. 2021, 308, 33–44. (In Chinese) [Google Scholar]
- Wang, S.; Yu, N.; Fu, R. Digital Village Construction: Mechanisms, Challenges and Implementation Strategies. Reform 2021, 4, 45–59. (In Chinese) [Google Scholar]
- Wang, J.; Chen, W.; Gao, C.; Bai, Y. Cloud manufacturing alliance innovation ecosystem formation, model construction and evolution research. Sci. Technol. Prog. Countermeas. 2018, 35, 53–58. (In Chinese) [Google Scholar]
- Xu, S.; Tang, H.; Lin, Z.; Lu, J. Pricing and sales-effort analysis of dual-channel supply chain with channel preference, cross-channel return and free riding behavior based on revenue-sharing contract. Int. J. Prod. Econ. 2022, 249, 108506. [Google Scholar] [CrossRef]
- Rogna, M.; Vogt, C. Coalition Formation with Cooperation-Enhancing Transfers When Players Are Heterogeneous and Inequality-Averse. Climate 2025, 13, 50. [Google Scholar] [CrossRef]
- Tian, B.; Zheng, M.; Liu, W.; Gu, Y.; Xing, Y.; Pan, C. Impacts of carbon border adjustment mechanism on the development of chinese steel enterprises and government management decisions: A tripartite evolutionary game analysis. Sustainability 2024, 16, 3113. [Google Scholar] [CrossRef]


Disclaimer/Publisher’s Note: The statements, opinions and data contained in all publications are solely those of the individual author(s) and contributor(s) and not of MDPI and/or the editor(s). MDPI and/or the editor(s) disclaim responsibility for any injury to people or property resulting from any ideas, methods, instructions or products referred to in the content. |
© 2025 by the authors. Licensee MDPI, Basel, Switzerland. This article is an open access article distributed under the terms and conditions of the Creative Commons Attribution (CC BY) license (https://creativecommons.org/licenses/by/4.0/).