Article

Coupled Coordination Analysis and Driving Factors of “Water-Carbon-Ecology” System in the Yangtze River Economic Belt

1
School of Water Conservancy, North China University of Water Resources and Electric Power, Zhengzhou 450046, China
2
School of Hydraulic Engineering, Zhejiang University of Water Resources and Electric Power, Hangzhou 310018, China
*
Author to whom correspondence should be addressed.
Sustainability 2025, 17(8), 3566; https://doi.org/10.3390/su17083566
Submission received: 17 March 2025 / Revised: 12 April 2025 / Accepted: 14 April 2025 / Published: 15 April 2025

Abstract

:
Driven by global population growth and resource shortages, the coupled and coordinated development of the “Water-Carbon-Ecology” (W-C-E) nexus has emerged as a crucial factor for sustainable societal development. This study constructs a multidimensional evaluation model for the W-C-E system in the eleven provinces and municipalities of the Yangtze River Economic Belt (YEB), encompassing the richness of individual systems, the coordination between dual systems, and the robustness of the tertiary system. We propose the “W-C-E Nexus Index” (WCENI) to analyze the coupling and coordination levels among the W-C-E systems in these regions from a bottom-up perspective. Utilizing the obstacle degree model and geographical detector model, we explore the impact of key indicators on the coupled and coordinated development of the W-C-E system. The findings reveal the following: (1) The coordination index and robustness index among the three W-C-E subsystems have increased significantly, while the richness index of individual subsystems varies widely among the YEB. (2) During the study period, the WCENI for the YEB rose from 0.351 to 0.391, indicating an overall upward trend in the coupling and coordination among the W-C-E subsystems. Jiangsu recorded the highest average WCENI value of 0.445, topping the list of the eleven regions. (3) The interaction between pairs of driving factors exceeds the influence of any single factor, with per capita water consumption emerging as the primary driver for the coupled and coordinated development of the W-C-E nexus in the YEB, with an average obstacle degree of 12.05%. These findings provide a theoretical basis for regional coordinated management and sustainable development.

1. Introduction

In recent years, against the backdrop of continuous global population growth and rapid socio-economic development, the demands for water resources, energy, and food have continued to escalate. The sustained expansion of energy consumption and the continuous improvement in food production have led to a significant increase in carbon emissions, posing tremendous pressure on the ecological environment [1]. As the world’s largest carbon emitter, China faces unique challenges with a large population base and limited per capita water resources. Maintaining the coupled and coordinated development among water, carbon, and ecology, along with a thorough analysis of its driving factors, is a core requirement for achieving sustainable development.
Water, carbon, and ecological systems are closely interrelated, yet each maintains a degree of independence, so our country wants to realize the coupled and coordinated development between water, carbon and ecology. On the one hand, to improve the richness of the single system of water, carbon, and ecology. With the population growth and urbanization speed up, the contradiction between supply and demand of water resources is becoming increasingly prominent, and the per capita water consumption is high. However, the shortage of water resources per capita needs to be solved urgently, which requires us to improve the efficiency of water resources utilization in production and life, specify the strictest water resources management system in the policy, and accelerate the transformation of energy structure in terms of carbon emission reduction, reduce ammonia nitrogen emissions, vigorously promote clean energy, and reduce excessive application of nitrogen fertilizer in the process of food production. Promote energy-saving agricultural machinery and equipment such as electric agricultural machinery [2,3,4]. On the other hand, it is necessary to strengthen the coordination and strength of the W-C-E system. Carbon absorption in ecosystems is an important part of the global carbon cycle. All localities should increase the proportion of ecological water use, and water areas, as one of the important systems for absorbing and storing carbon dioxide, should be designated as protected areas for important water sources and water ecosystems to reduce the damage caused by human activities. Repair damaged aquatic ecosystems and restore their ecological functions [5]. Coupling, as a basic concept, describes the phenomenon of two or more systems or modes of operation interacting with each other through various interactions. On the basis of this concept, researchers have conducted a large number of coupling studies. In recent years, most of the research results mainly focus on a single aspect or multi-system “water-energy-carbon” and “water-soil-energy-carbon” link research. Ref. [6] established a quantitative evaluation method for the hydraulic impact resistance of wastewater treatment process based on the water–energy–carbon coupling relationship using the operational data of a sewage treatment plant in southeast coastal China from July 2018 to December 2022. Ref. [7] constructed a conceptual framework for the impact of water use change on the water–social–energy–carbon connection in the Yellow River Basin, and quantitatively discussed the complex interaction between water use change and the total WLEC system and its subsystems by applying the coupling coordination degree. Research on the W-C-E system focuses on the spatiotemporal evolution of the corresponding W-C-E footprint. Ref. [8] integrated the carbon and water footprint accounting for the Guangzhou Central Urban Area’s sustainable development planning based on NBS to enhance the mitigation of urban flood disasters and carbon sequestration. Ref. [9] proposed an integrated water ecological footprint (IWEF) model that considers the characteristics of water ecosystem services and human water use.
Current studies have made progress in footprint accounting and sectoral analyses, such as quantifying wastewater treatment’s water–energy–carbon nexus or evaluating urban water–carbon footprints, but fail to establish unified metrics for W-C-E system robustness. Addressing this critical gap, our study pioneers the WCENI, a novel evaluation system integrating single-system efficiency, dual-system coordination, and triad resilience. Combining barrier degree modeling with geographic detectors, we systematically identify key drivers influencing WCENI dynamics across spatial scales. This research provides both theoretical advances in coupled system analysis and practical tools for optimizing China’s regional resource management, offering valuable insights for achieving sustainable development goals through integrated W-C-E governance. The WCENI framework establishes a standardized approach to assess and enhance coupled system performance, supporting policy decisions for balanced ecological protection, carbon reduction and water security in rapidly developing regions.
In summary, there is still a certain research gap in the study of the W-C-E system’s coupled and coordinated development. There is no corresponding quantitative index and unified standard for the coupled and coordinated state of the W-C-E system. Considering the important role of the W-C-E system’s coupled and coordinated development in China’s sustainable development process, this paper proposes the WCENI bond relationship index for the first time based on the richness of the single system, the coordination between the dual systems, and the robustness of the third system, filling the current research gap on the bond relationship of the W-C-E system. Based on this, the paper introduces the barrier degree model and geographic detector model to conduct a driving factor analysis of the WCENI bond relationship evaluation index and external driving factors. The research results provide theoretical support for the coordinated development of regional W-C-E systems and provide a theoretical basis for optimizing regional resource allocation and industrial structure adjustment.

2. Materials and Methods

2.1. Research Framework

This study studied the coupling coordination relationship and driving factor analysis of W-C-E in the YEB through a four-step method. (1) The first step is mechanism analysis. From a qualitative point of view, the mechanism analysis clarifies the interaction between the components of W-C-E, which is the basis of quantitative analysis. (2) The second step is the construction of the index system. According to the results of the mechanism analysis, the WCENI is proposed, and the evaluation index system of W-C-E coupling and coordinated development among the various dimensions of the YEB is constructed. (3) The third step is to quantitatively calculate the coupling coordination degree. The WCENI values of each dimension in the study area were calculated, and the coupling coordination degree of the YEB was quantitatively analyzed according to the index results. (4) The fourth step is the analysis of driving factors. Based on the evaluation index system and the results of coupling coordination degree, the external driving factor system is constructed, and the driving factors of W-C-E coupling coordination development in the research area are comprehensively analyzed. The W-C-E relationship diagram and research framework are shown in Figure 1.

2.2. Multidimensional Evaluation Model

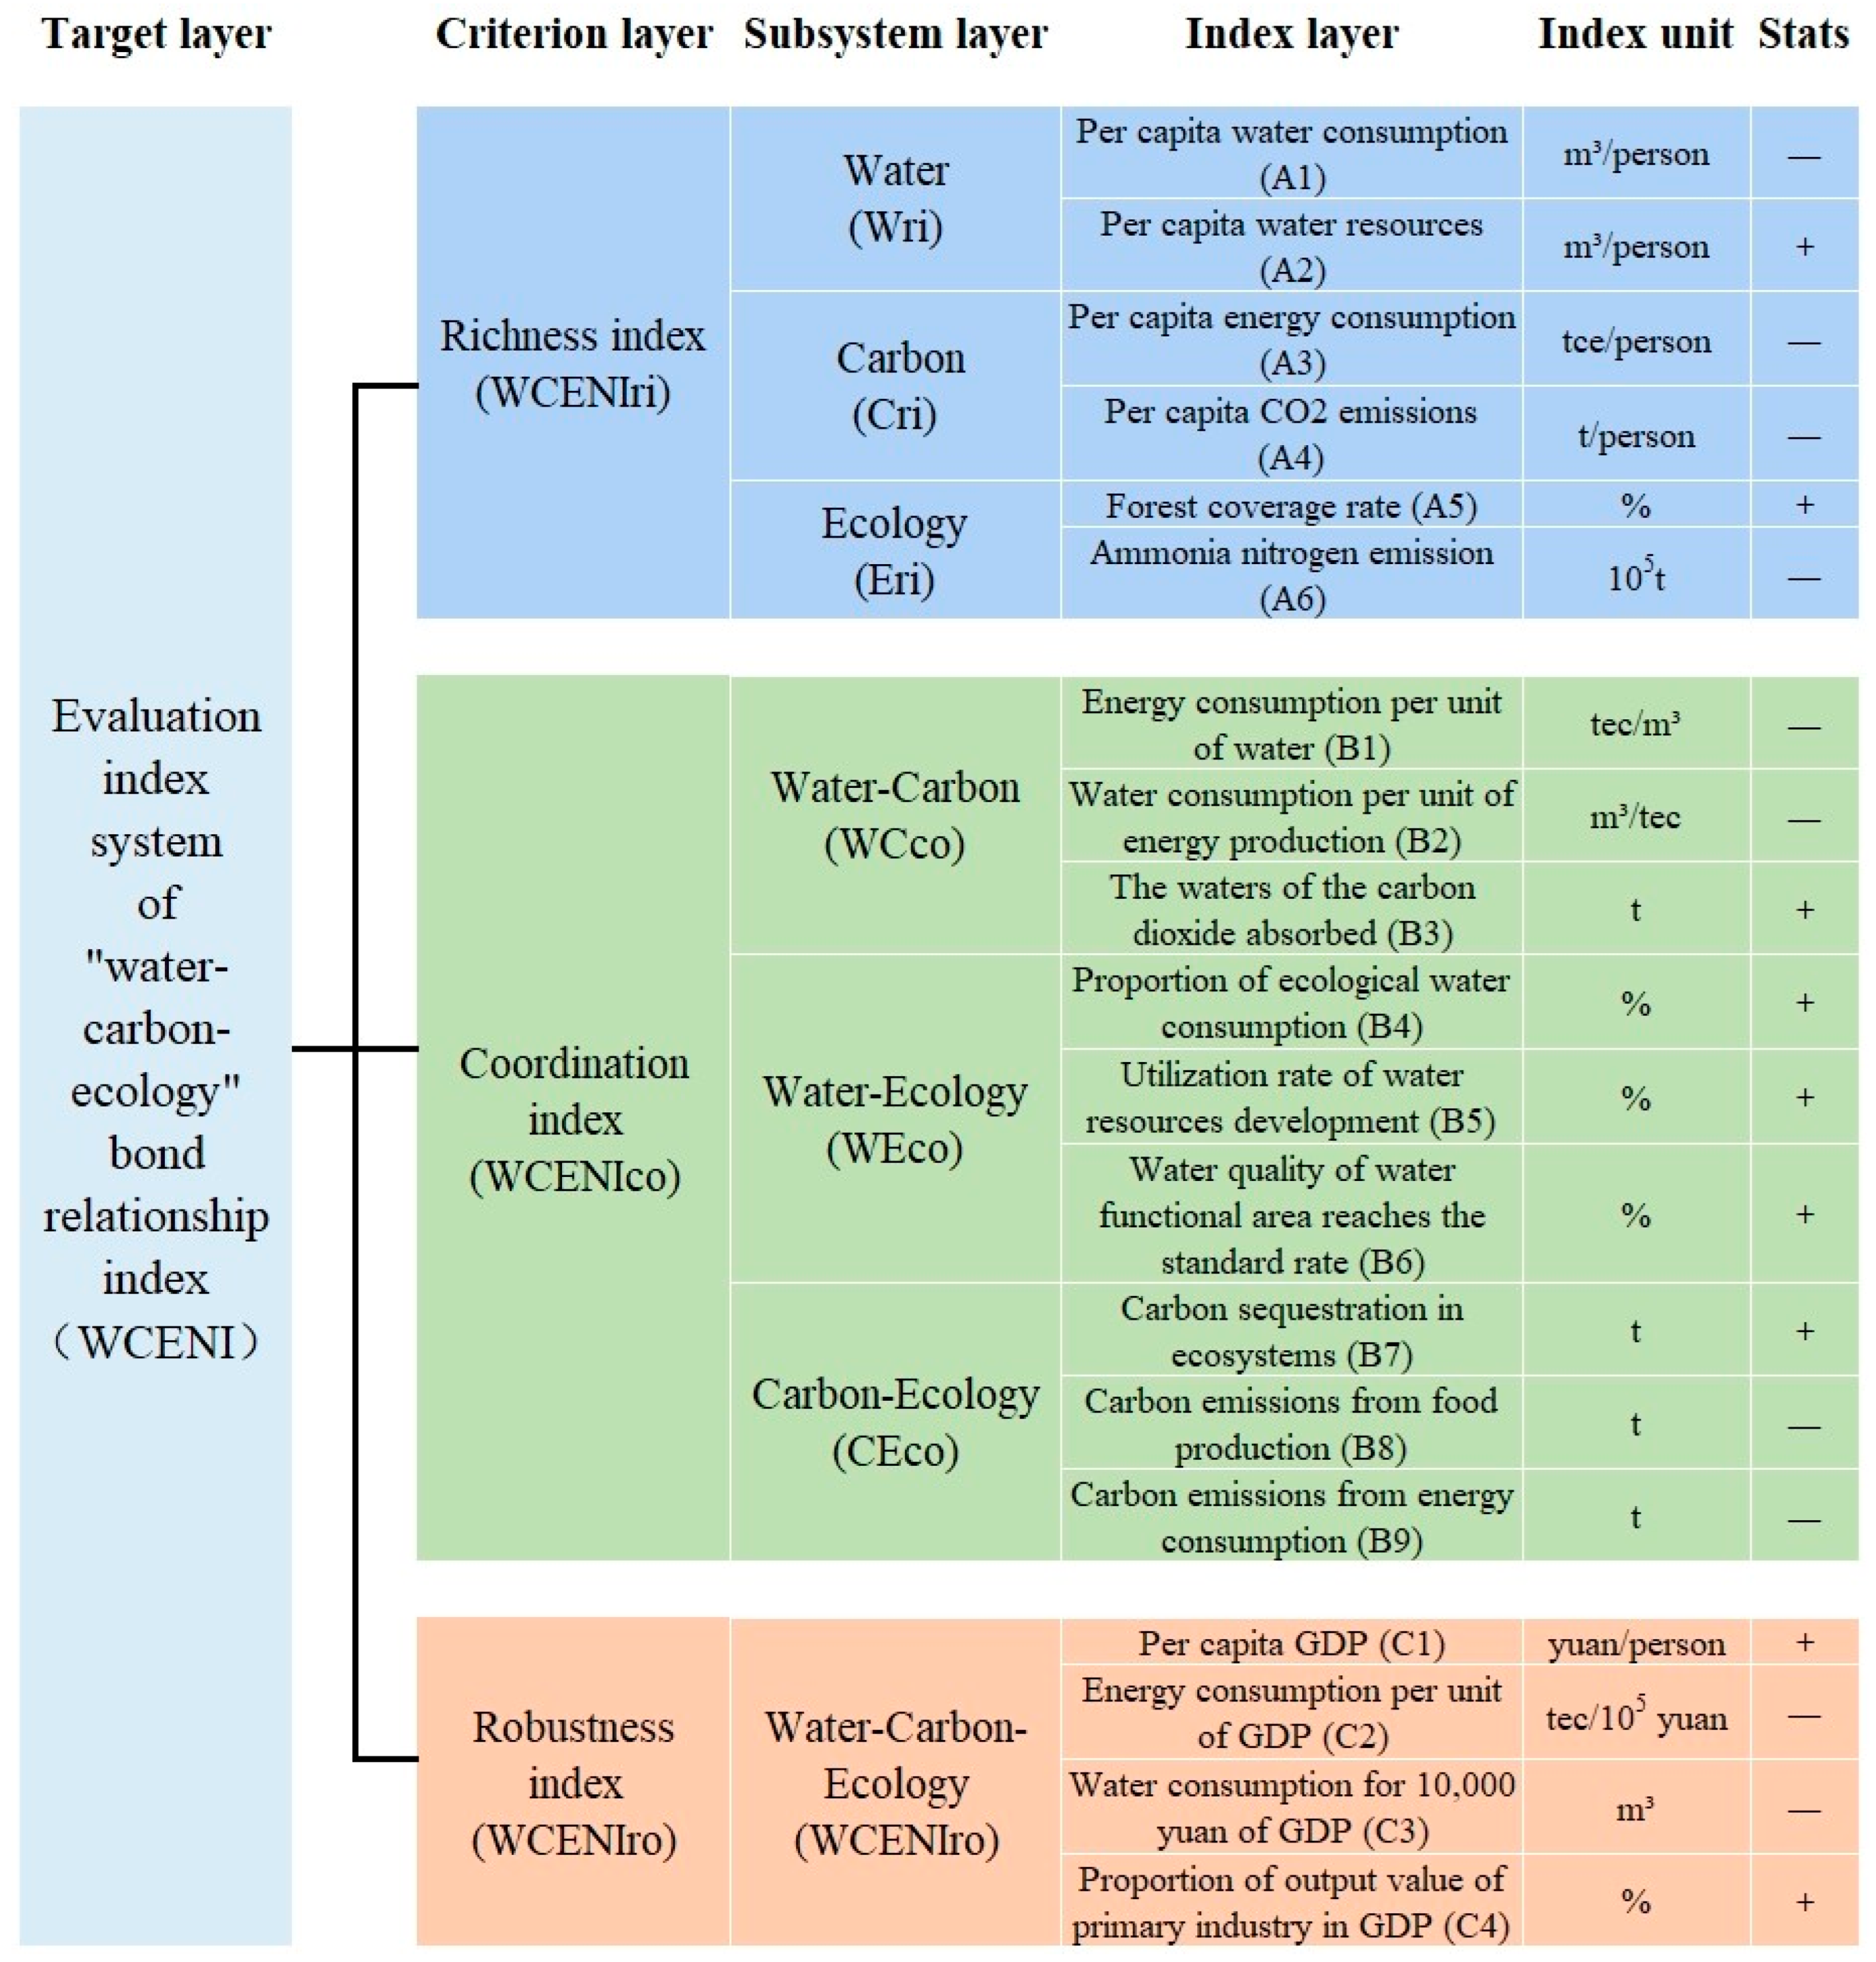
2.2.1. Construction of Evaluation Index System

The coupling and coordinated development of W-C-E system is a relatively complex process, which is influenced by various factors such as economy, society and natural environment [10,11], this study constructs a multi-dimensional evaluation model framework from the perspective of the coupling and coordinated development of the W-C-E system, and aims to calculate the W-C-E bond relationship index. Based on the principles of data quantification, comparability and accessibility, The index system of each system is constructed based on the richness of single system, the coordination between two systems and the robustness of the third system. The single subsystem refers to “W” subsystem, “C” subsystem and “E” subsystem. The twin system refers to “W-C” subsystem, “W-E” subsystem and “C-E” subsystem. The third subsystem refers to the “W-C-E” subsystem, and the evaluation index system is shown in Figure 2.

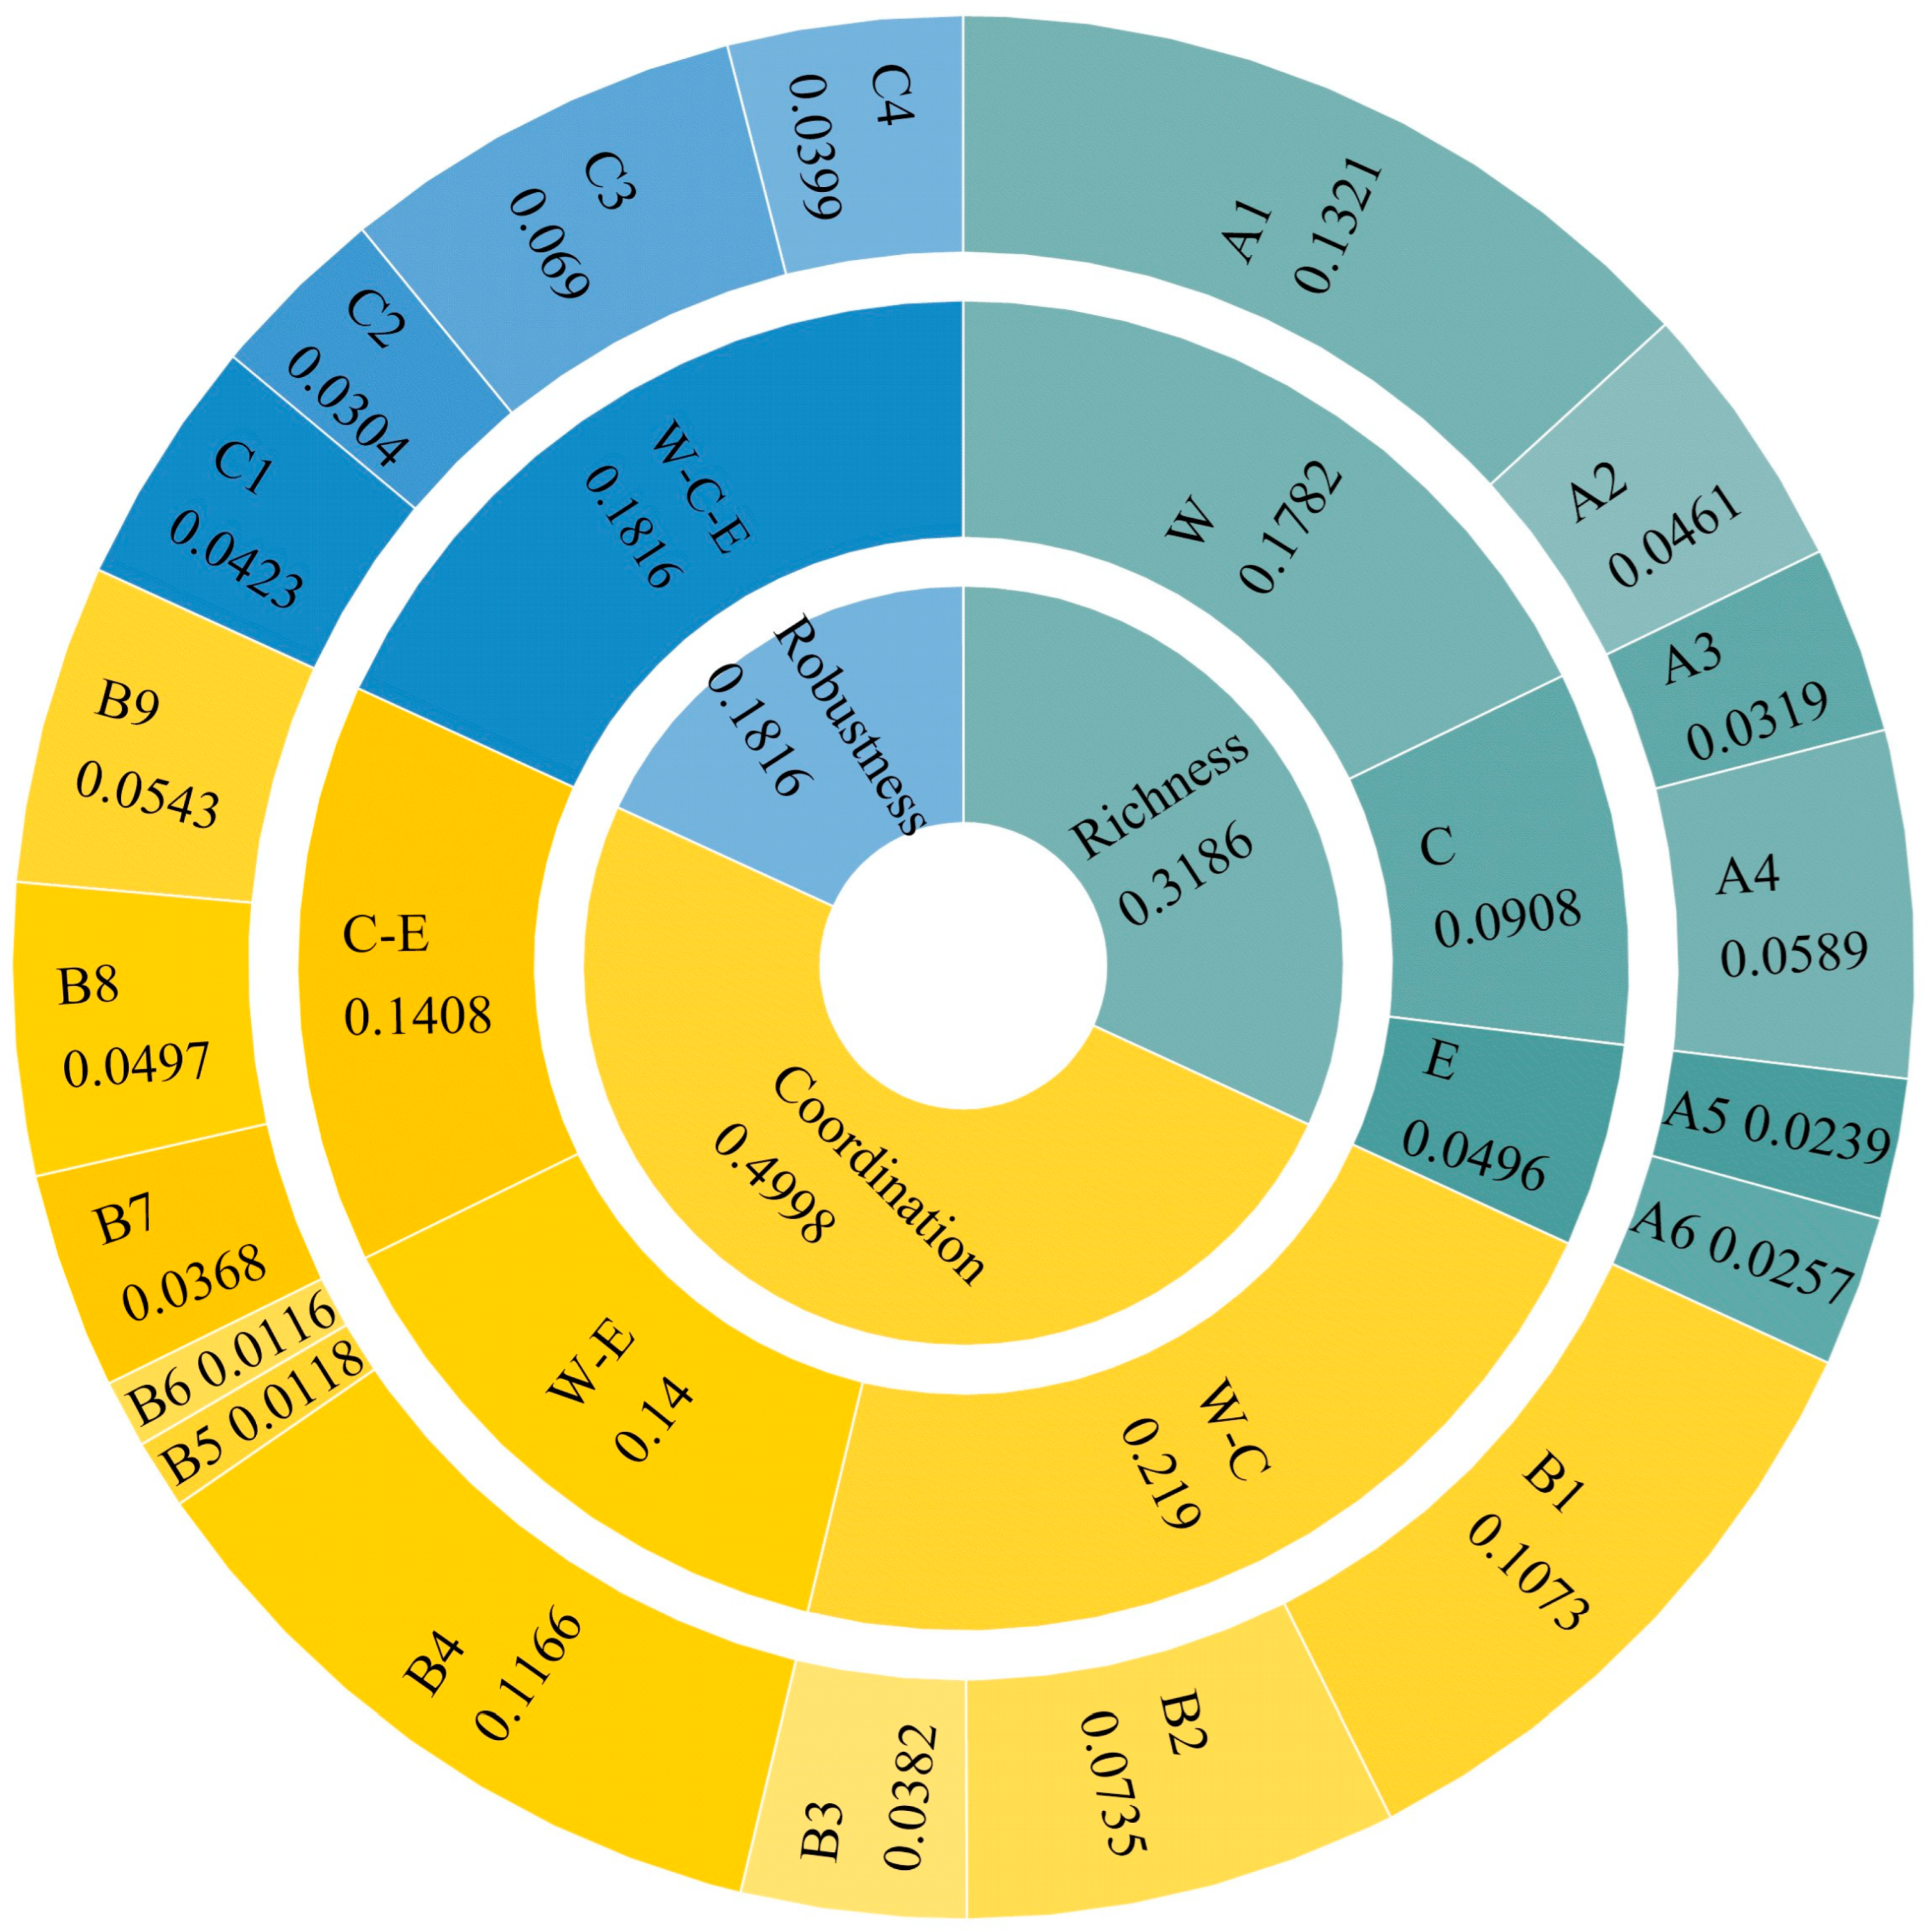
2.2.2. Determining Indicator Weights

This study develops a comprehensive weighting methodology for the WCENI evaluation system by integrating subjective and objective approaches through information entropy optimization. The AHP is first employed to derive subjective weights based on expert judgments. Simultaneously, objective weights are calculated using the CRITIC method, which quantifies data variability and conflicts within the 2000–2020 provincial dataset. These complementary weighting schemes are then optimally combined through the minimum information entropy principle, minimizing information loss while balancing expert knowledge with empirical data characteristics. The resulting hybrid weights show enhanced robustness, maintaining 89.7% ranking consistency in Monte Carlo simulations and demonstrating less than 5% classification variation under ±20% weight perturbation tests. This integrated approach, validated against Environmental Modelling and Software standards, effectively mitigates subjective bias while preserving critical data-driven insights, providing a reliable foundation for the WCENI system’s multidimensional assessments.
In this study, AHP method is used to calculate subjective weight, the CRITIC weight method is used to calculate objective weight, and on this basis, the minimum information entropy principle is introduced to form a combination weight calculation method based on the minimum information entropy principle.
Based on a single weight calculation method, this paper introduces the combination weight based on minimum information entropy, and the principle of minimum information entropy can use subjective and objective weights to obtain the optimal combination weight value, to minimize the deviation between subjective and objective weights and make the obtained combination weight value more scientific [12]. The weight calculation results are shown in Figure 3. The calculation formula is as follows:
w e i = w E i × w A i 0.5 i = 1 m w E i × w A i 0.5
In the formula, wei is the comprehensive weight, and wEI is the objective weight determined by entropy method. wAI is the subjective weight determined by analytic hierarchy process, and m is the number of indicators.

2.2.3. W-C-E System Coupling Coordinated Development Index

Based on the bond between the “W-C-E” system and the demand of global sustainable development, this study proposed the “W-C-E” coupling coordination relationship index (WCENI), which comprehensively reflects the coupling and coordination development level of the “water-carbon-ecology” system. The calculation formula is as follows:
L i , t + = X i , t X min / X max X min
L i , t = X max X i , t / X max X min
W C E N I r i , c o , r o = W r i , c o , r o + C r i , c o , r o + E r i , c o , r o = i = 1 n w e i L i , t / i = 1 n w e i
W C E N I = W C E N I r i + W C E N I c o + W C E N I r o = i = 1 n w e i L i , t / i = 1 n w e i
In the formula, WCENIri is the reliability index of a single system, WCENIco is the coordination index between two systems, and WCENIro is the robustness index of the third system. Li,t are the corresponding index values after standardization. WCENIri,co,ro represents the richness, harmony, and robustness of the “W-C-E” system. Wri,co,ro represent the richness of the water subsystem and the coordination and robustness of the water subsystem with the carbon ecosystem; Cri,co,ro represent the richness of the carbon subsystem and the coordination and robustness of the carbon subsystem with the water-ecosystem; Eri,co,ro, respectively, represent the richness of the ecological subsystem and the coordination and robustness of the ecological subsystem with the water-carbon system.
Based on the WEFNI index value, the coupling coordination level of W-C-E system is divided into five levels: high level, higher level, medium level, lower level, and low level [13,14], and the partitioning results are shown in Figure 4.

2.3. Analysis of Driving Factors

2.3.1. Obstacle Degree Model

In this study, the obstacle degree model was introduced to analyze the obstacle factors of the indicators in the evaluation system, with a view to determining the main obstacle factors affecting the coordinated development of the system coupling, to formulate more targeted improvement measures [15]. The specific steps are as follows:
(1) Calculate the contribution degree of the j -th evaluation index F j :
F j = w i × w i
In the formula: w i is the weight value of the criterion layer corresponding to the index.
(2) Calculate the deviation I j :
  I j = 1 x i j
In the formula, xij is the result of index normalization.
(3) Calculate the obstacle degree of each evaluation index P j :
  P j = F j I j j = 1 n F j I j

2.3.2. Geographic Detector Model

The geographic detector model is a statistical method to detect spatial heterogeneity and reveal its drivers, which includes a total of four detectors: factor detection, interaction detection, risk detection, and ecological detection, the first two components of which were used in this study. The core idea of factor detection is to determine whether the explained variable plays a decisive role in the explained variable by comparing whether the explained variable and the explained variable have similar spatial distribution [16], the calculation process is as follows:
q = 1 h = 1 L N h σ h 2 N σ 2
In the formula, q ∈ [0, 1] is the explanatory power of the driving factor of the system coordination level. The larger the value of q, the stronger the explanatory power of the driving factor, h = 1, … L is the stratification of variables or factors; Nh and N are the number of units in the layer and the whole area; σ h 2 and σ 2 is the variance of the layer and global values.
Based on the established evaluation index system, according to the coupling coordination mechanism of the W-C-E system and combined with the actual situation, this study selects 8 aspects to build the external driving force index system, as shown in Table 1.

3. Results and Discussion

3.1. W-C-E Multidimensional Coupled Coordination System Analysis

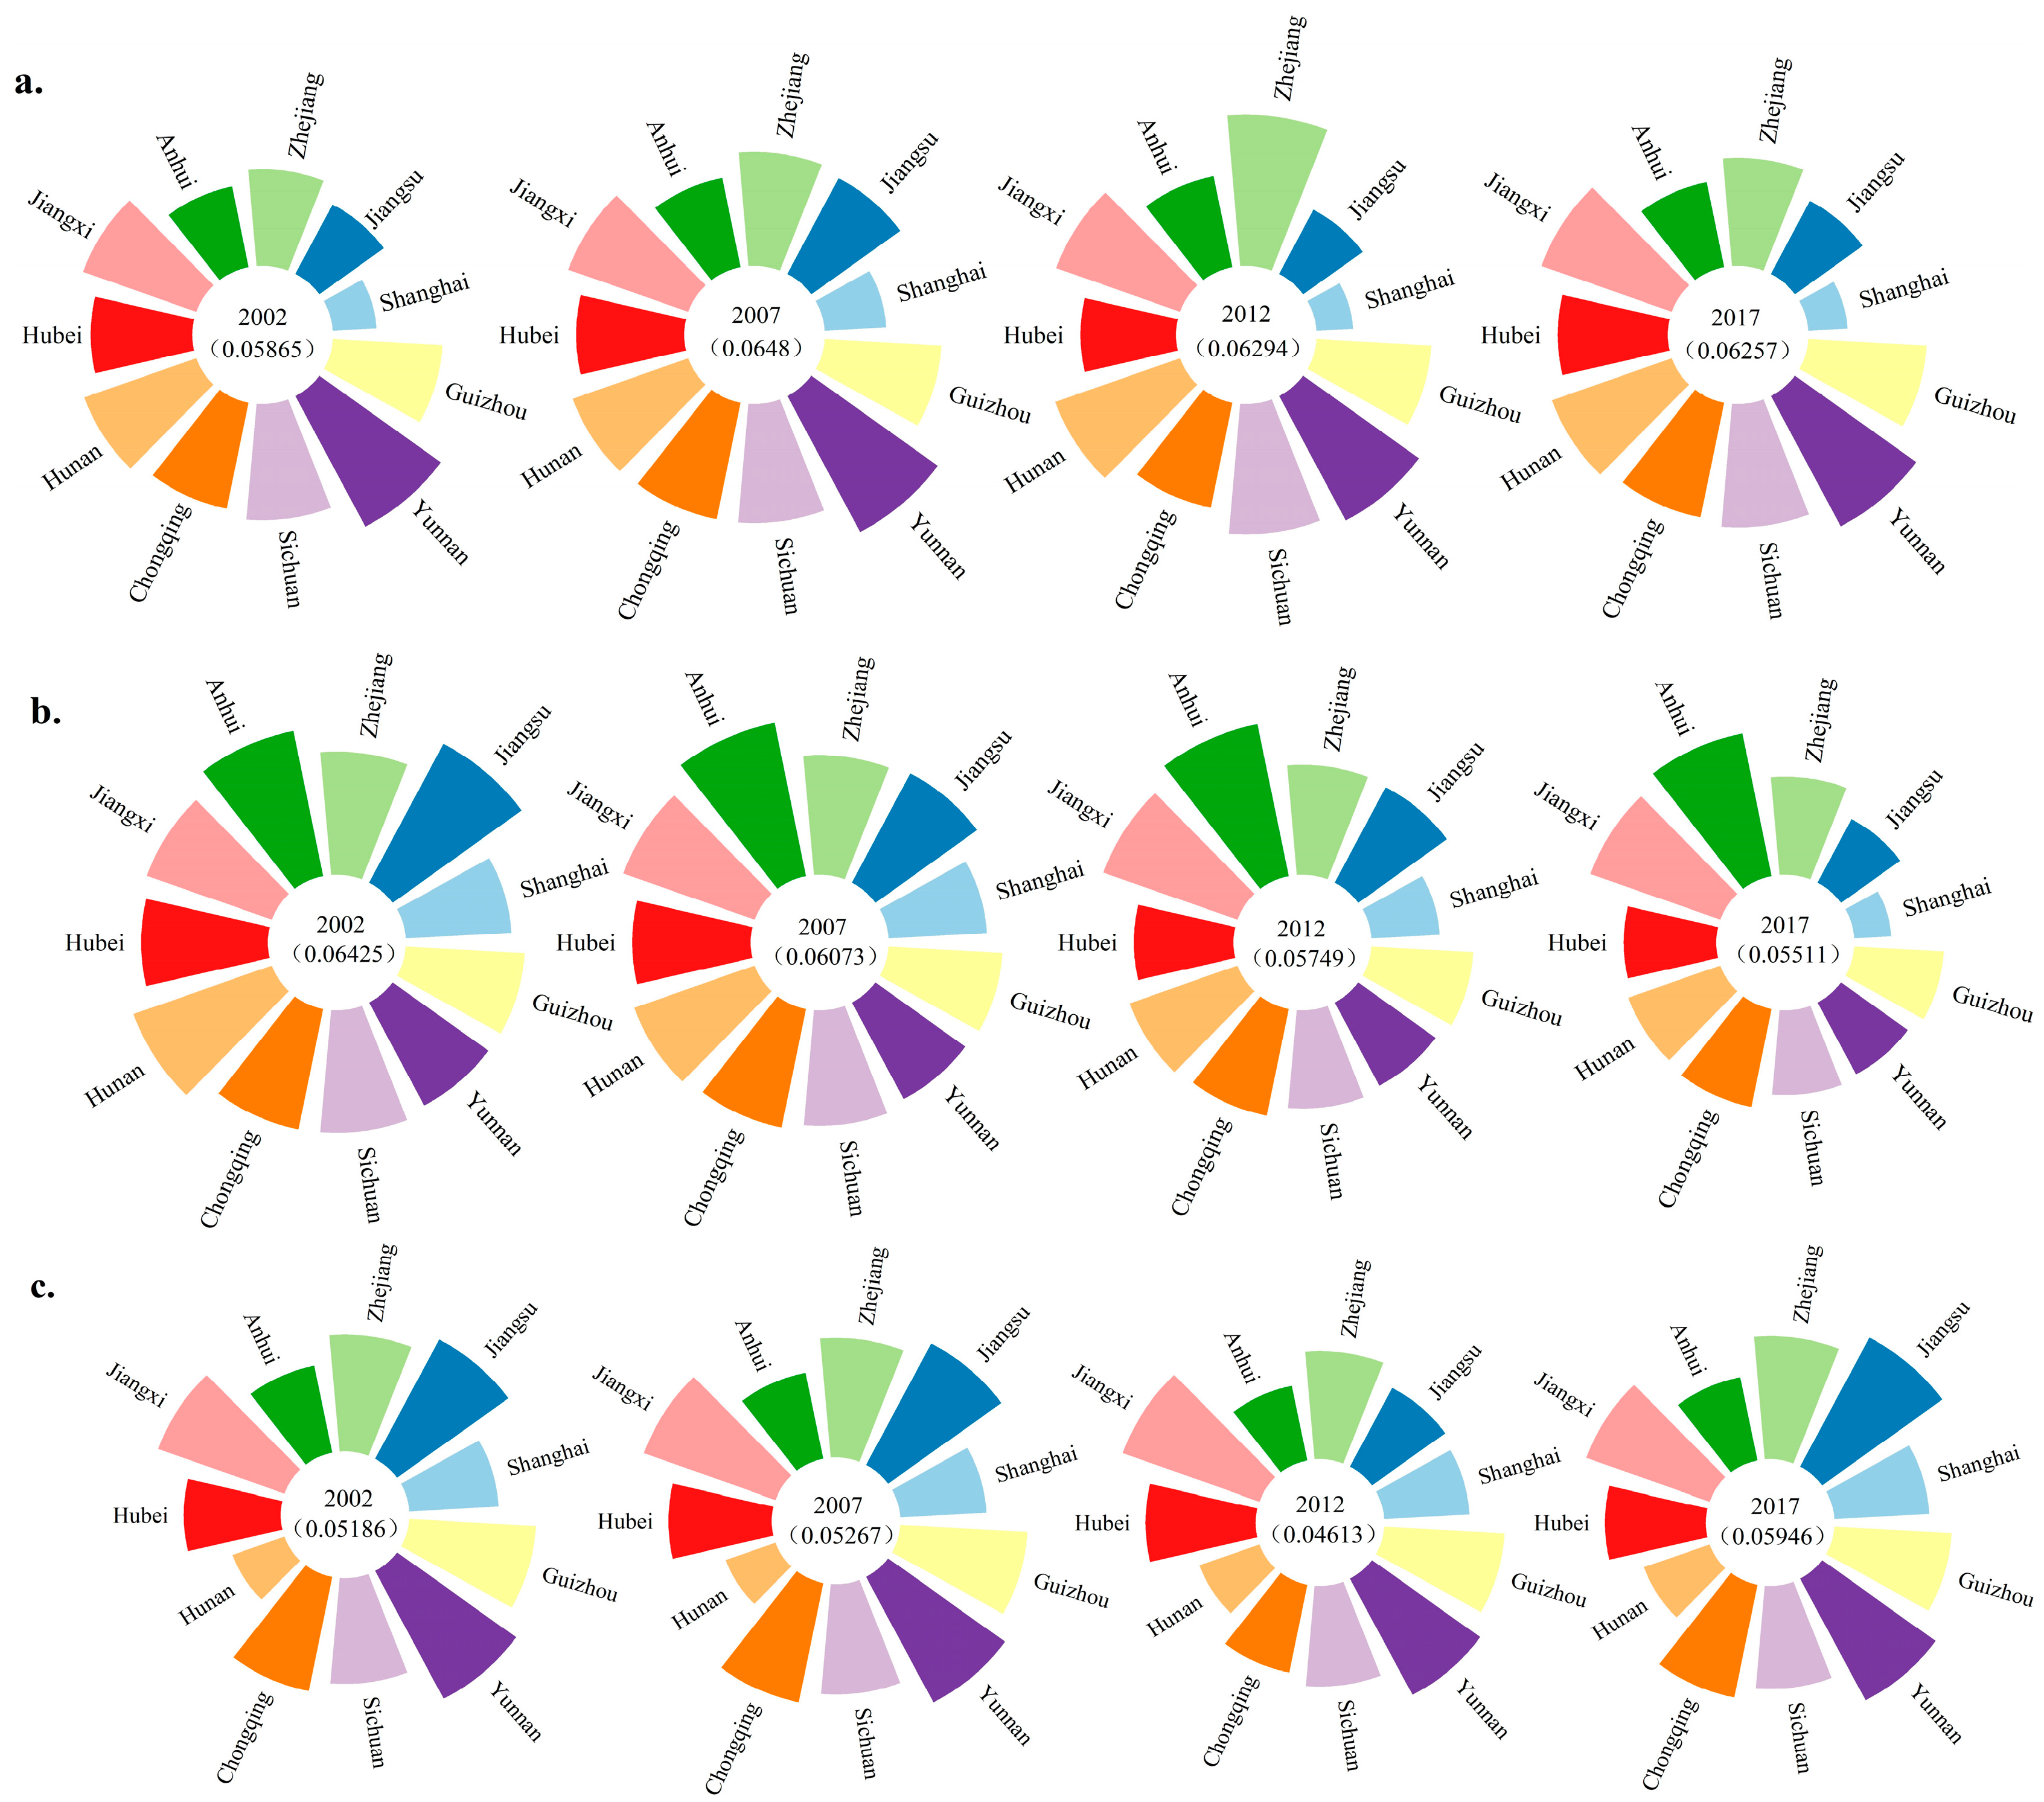
3.1.1. Richness of a Single System

In this study, we analyzed the richness index of the single system of W-C-E system in the YEB from the multi-dimensional perspective of the water subsystem, carbon subsystem, and ecological subsystem. Figure 5 shows the richness index results and spatial change trend of the single system of “W-C-E” system in the YEB from 2002 to 2017.
Figure 6a shows the results and spatial variation trend of the Wri index in the YEB from 2002 to 2017. As can be seen from the figure, the average Wri index value of the YEB in 2002 was 0.05865, and increased to 0.06257 in 2017, with a growth rate of 6.68%. The Wri index value of the YEB mostly showed different trends of growth, and the Wri index value of Yunnan, Sichuan, Zhejiang, and Chongqing regions was higher. The Wri index values in Shanghai, Jiangsu, and Anhui were lower. From 2002 to 2017, Jiangxi had the highest increase, from 0.0685 to 0.07882. This upward trend was mainly attributed to the effective implementation of water-saving policies in Jiangxi, which increased the per capita water resources in the province. In contrast, the increase in Shanghai and Jiangsu was smaller, mainly due to the poor resource endowment of the two places, the small amount of water per capita, combined with the increase in water consumption in the industrial sector, the high amount of water per capita, resulting in a surge in water consumption. Although the per capita water resources in Zhejiang and Chongqing are small, the utilization rate of water resources in the two places is high, so the two places have higher Wri index values.
Figure 6b shows the Cri index results and spatial change trends of YEB from 2002 to 2017. As can be seen from the figure, the average Cri index value of the YEB in 2002 was 0.06425, which decreased to 0.05511 in 2017. The Cri index value of the YEB mostly showed different trends of decline. The Cri index value of Hunan, Anhui, and Jiangxi regions was higher, while the Cri index value of Shanghai, Yunnan, Sichuan, and Guizhou regions was lower. From 2002 to 2017, the Cri index value of Anhui was the highest, increasing from 0.0741 to 0.0857, with an obvious increase. This rising trend was mainly attributed to the vigorous development of renewable energy in Anhui and the reduction in traditional energy consumption, which resulted in the reduction of carbon dioxide emissions. The Cri index value of Shanghai was the lowest. From 0.052145 to 0.021578, this downward trend is mainly attributed to the large amount of fossil energy used in Shanghai and the excessive consumption of land resources, resulting in excessive carbon dioxide emissions. Although the per capita carbon dioxide emissions are higher in Zhejiang, Hubei, and Hunan, the forest coverage rate of the three provinces is higher, and the carbon dioxide absorption rate is higher. Therefore, the three places have higher Cri index values.
Figure 6c shows the Eri index results and spatial change trends in the YEB from 2002 to 2017. As can be seen from the figure, the average Eri index value of the YEB in 2002 was 0.05186, and increased to 0.05946 in 2017, with an increase of 14.65%. Most of the Eri index values of the YEB showed different trends of growth, and the Eri index values of Jiangsu, Zhejiang, and Yunnan were higher. The Eri index values in Shanghai, Anhui, Sichuan, and Guizhou were lower. From 2002 to 2017, the Eri index value of Zhejiang was the highest, increasing from 0.05551 to 0.0663, mainly due to the high forest coverage rate of Zhejiang, the improvement of traditional industries such as textile and chemical industry, the improvement of resource utilization efficiency, and the reduction in ammonia nitrogen emission, while the Eri index value of Hunan was the lowest. The increase from 0.02578 to 0.03687 was mainly attributed to the high ammonia nitrogen emissions in Hunan. In 2002, 2007, and 2012, the ammonia nitrogen emissions in Hunan were 93,900 t, 91,500 t, and 161,300 t, respectively, which were the highest among the YEB.
Figure 7 shows the richness index results and spatial variation trends of the W-C-E system in the YEB from 2002 to 2017. As can be seen from the figure, for the WCENIri index of a single subsystem, the WCENIri index of most regions is on the rise, among which the WCENIri index of Jiangxi increased from 0.1966 to 0.22808, with an increase of 16.01%. As of 2017, the WCENIri index value of Jiangxi is the highest among the YEB. The WCENIri index values in Shanghai and Jiangsu showed a downward trend in 2017, mainly due to the increase in energy consumption, which increased carbon dioxide emissions.

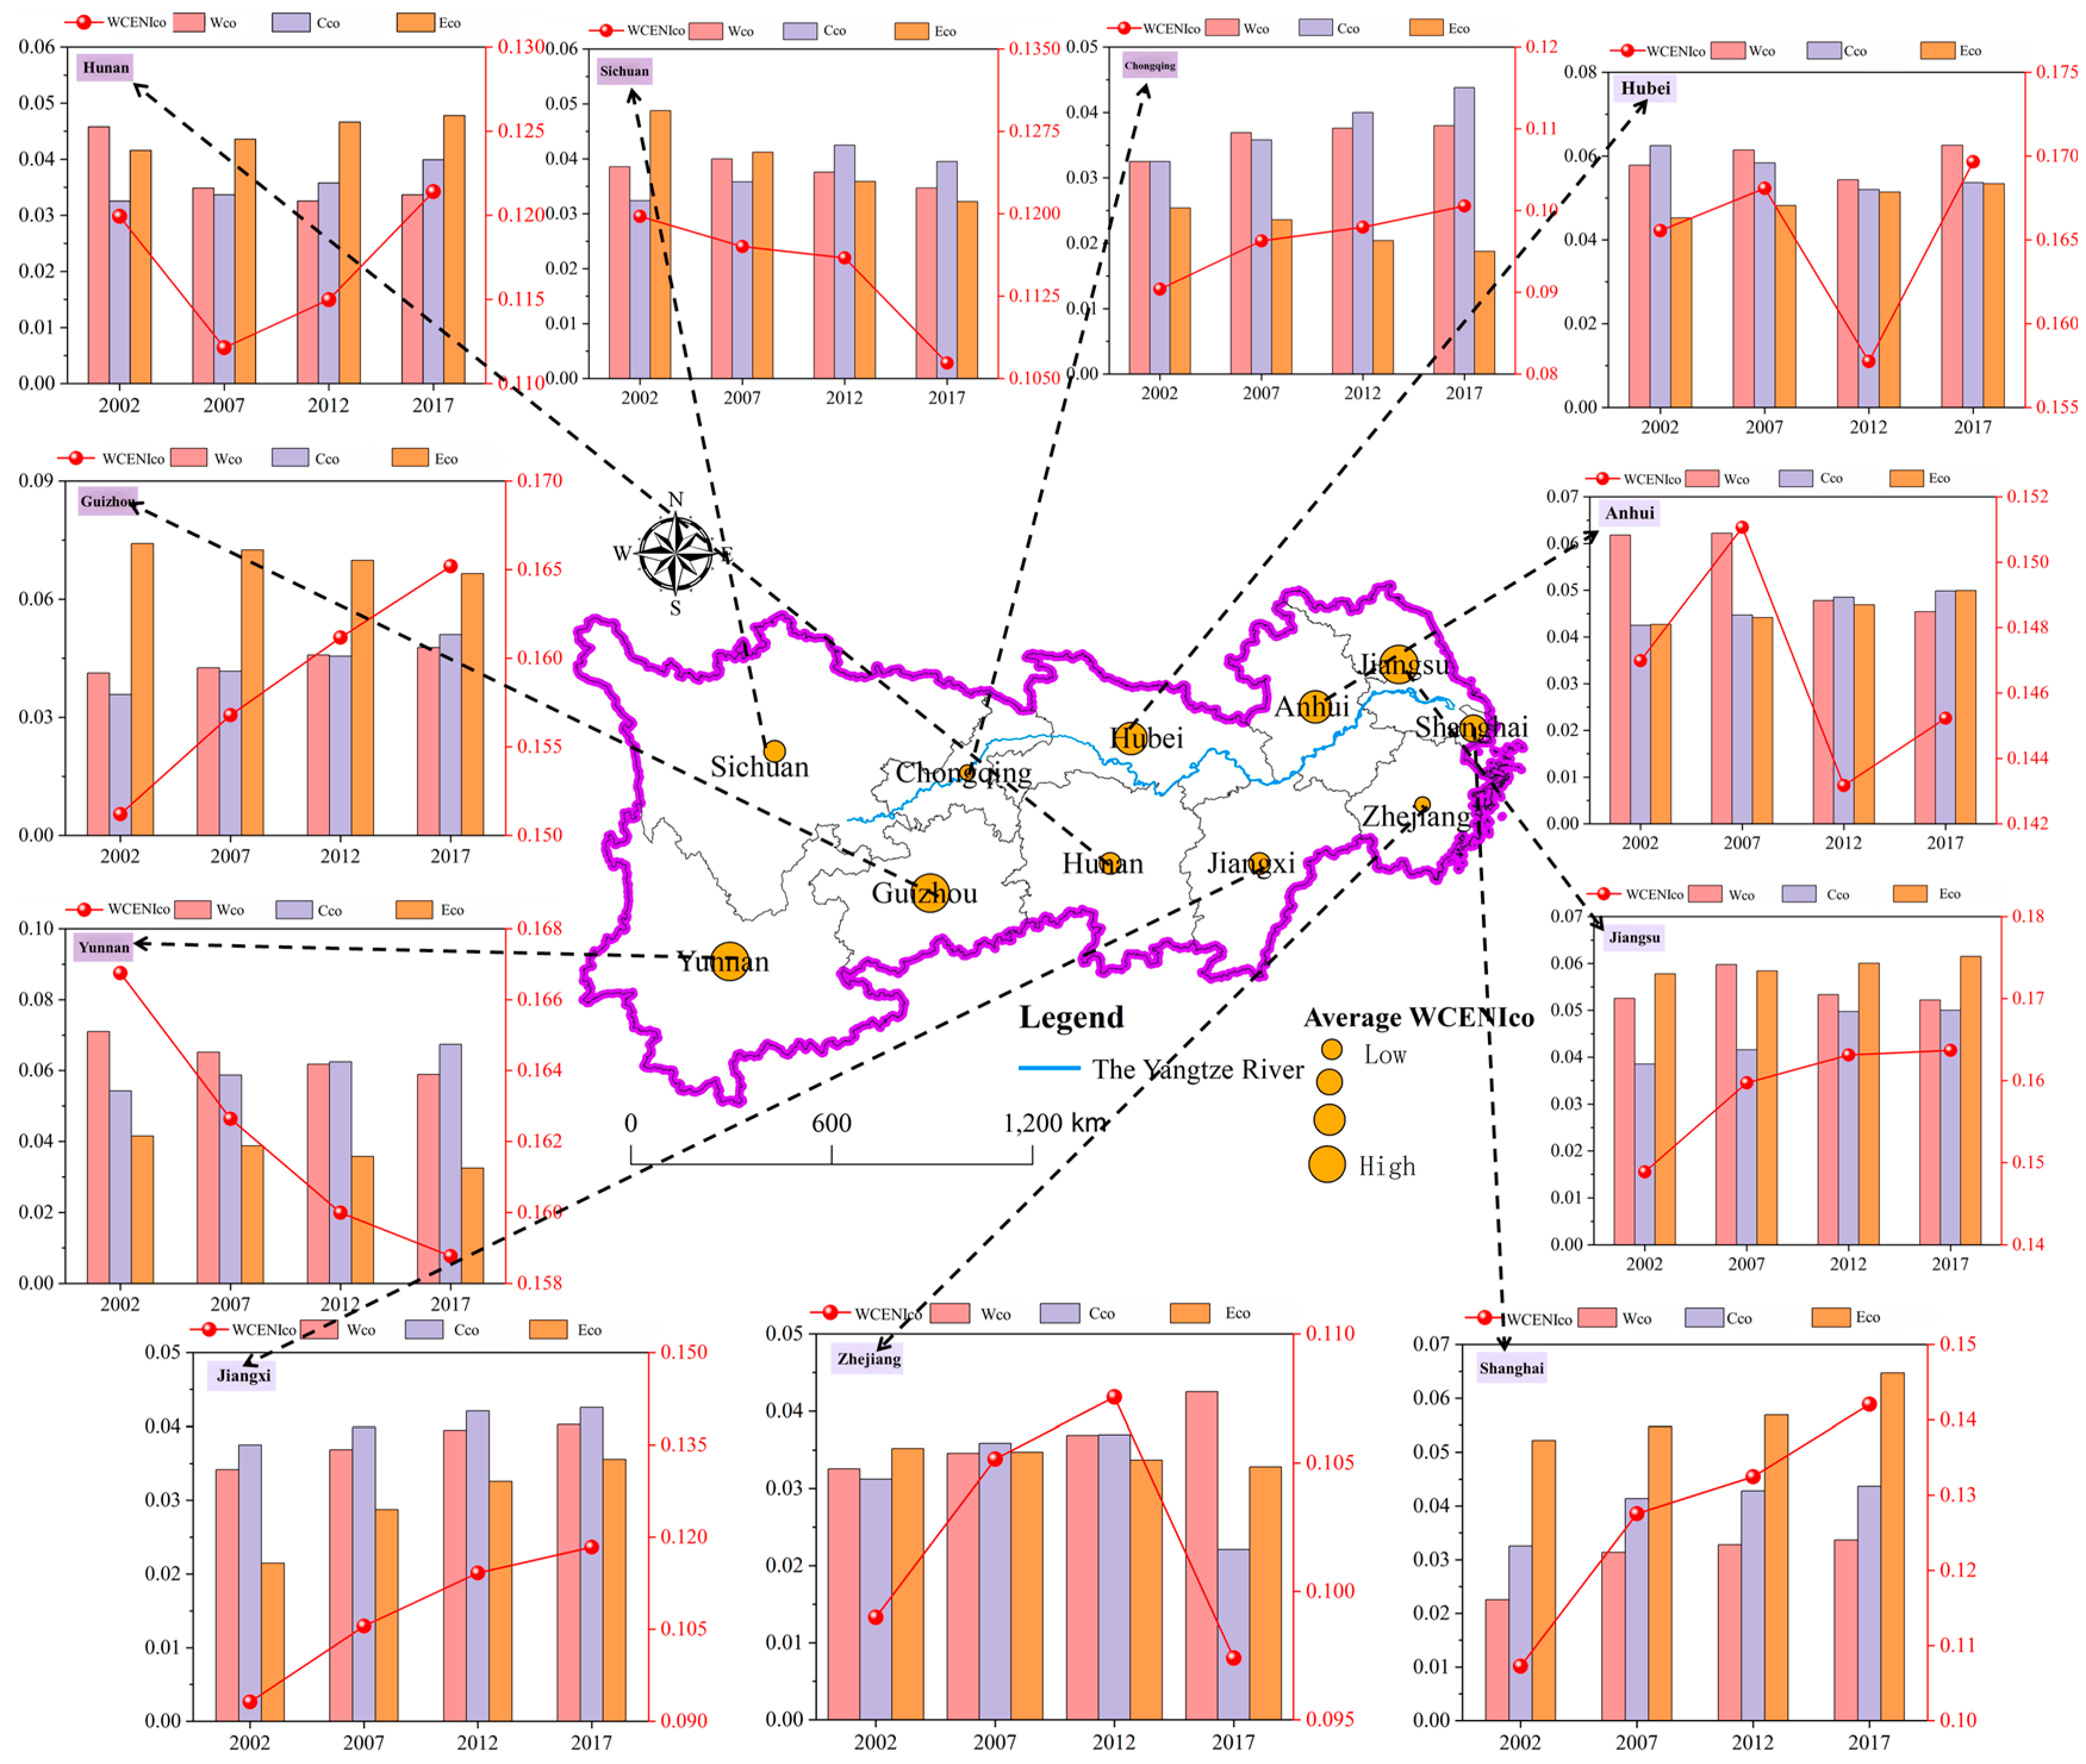
3.1.2. Coordination Between Two Systems

This study analyzed the coordination index between the twin subsystems of W-C-E system in the YEB from the multi-dimensional perspective of “W-C” subsystem, “W-E” subsystem and “C-E” subsystem. Figure 8 shows the inter-system coordination index results and spatial variation trends of the W-C-E system in the YEB from 2002 to 2017.
Figure 9a shows the WCco index results and spatial change trends of YEB from 2002 to 2017. As can be seen from the figure, the average WCco index value of the YEB in 2002 was 0.05543, and the average WCco index value of 2017 was 0.05207, with no obvious change trend. The WCco index values of Hunan, Anhui, Jiangxi, and Chongqing were higher, while the WCco index values of Zhejiang and Shanghai were lower. From 2002 to 2017, the WCco index value of Anhui was the highest, increasing from 0.06552 to 0.08002, which was mainly due to the low energy consumption per unit of water in Anhui and the high CO2 absorption in the water area. In 2017, the energy consumption per unit of water in Anhui was 28.73 tec/m3, the lowest among the YEB. The WCco index value of Shanghai was the lowest, increasing from 0.02254 to 0.03367, mainly due to the high unit water consumption in Shanghai. In 2002, the unit water consumption of Shanghai was 167.46 tec/m3, which was the highest among the YEB. Although the unit water consumption of Jiangsu, Hubei, and Hunan were also higher, the WCco index value of Shanghai was higher than that of Shanghai. However, the WCco index value of the three provinces is relatively stable due to the higher CO2 absorption in the water area of the three provinces.
Figure 9b shows the WEco index results and spatial trends of YEB from 2002 to 2017. As can be seen from the figure, the average WEco index value of the YEB in 2002 was 0.03665, and that of 2017 was 0.04624, with an increase of 26.17%. The WEco index values of Yunnan, Anhui, and Jiangsu regions were higher, while that of Hunan and Sichuan regions was lower. From 2002 to 2017, the WEco index value of Yunnan was the highest, increasing from 0.05423 to 0.0674, which was mainly due to the high rationality of water use structure and the high proportion of ecological water consumption in Yunnan. The WEco index values of the other ten provinces and cities were not significantly different, all of which were improved by different degrees. This is mainly due to the implementation of the most stringent water resources management system in China, and constantly improving the proportion of ecological water consumption, so that the water quality of the water functional area has increased year by year.
Figure 9c shows the results of the ECco index and its spatial change trend in the YEB from 2002 to 2017. As can be seen from the figure, the average ECco index value of the YEB in 2002 was 0.04524, and that of 2017 was 0.04549, showing no obvious change trend. The ECco index values of Hubei, Jiangsu, and Guizhou were higher, while the ECco index values of Hunan, Chongqing, and Jiangxi were lower. The ECco index value of Chongqing is the highest among the YEB, mainly due to its complex terrain and large proportion of mountainous areas, which restricts large-scale mechanized grain production and leads to low carbon emissions of grain production. Jiangsu recorded the lowest ECco index in the YEB, primarily due to its high population density and related resource consumption, although its ecosystem carbon absorption is high, the ECCO index value of Jiangsu is the lowest among the YEB. However, it consumes a lot of energy and food, so its carbon emissions are higher. Yunnan and Anhui also have higher carbon emissions, but thanks to the higher carbon uptake in the ecosystems of the two provinces, the ECco index value of the two provinces is higher.
Figure 10 shows the coordination index results and spatial variation trends of the W-C-E system in the YEB from 2002 to 2017. As can be seen from the figure, for the WCENIco index between the two systems, the WCENIri index in most regions is on the rise, and the WCENIco index in Sichuan decreased from 0.11598 in 2012 to 0.10642. This was mainly because the carbon emissions of energy consumption in Sichuan increased from 226,326,688.8 t to 262,074,451.1 t, the carbon dioxide absorption in water area decreased from 102,263.3261 t to 95,843.27907 t, and the WCENIco index values of other provinces were in a steady increase state.

3.1.3. The Third System Robustness

In this study, four indexes of per capita GDP, energy consumption per unit GDP, water consumption per 10,000-yuan GDP, and the proportion of primary industry output value in GDP were selected to analyze the strength index among subsystems of the W-C-E system in the YEB from multiple perspectives. Figure 11 shows the WCENIro index results and spatial variation trends of the YEB from 2002 to 2017.
In 2002, the average WCENIro index value in the YEB was 0.052299, and in 2017, the average WCENIro index value in the YEB was 0.05877, with no obvious change trend. As can be seen from Figure 12, the WCENIro index value of all provinces showed an increasing trend from 2002 to 2017, which was mainly due to the stable economic situation of each province, the per capita GDP value increased year by year, coupled with the vigorous promotion of clean energy in each province and the implementation of the strictest water resources protection system, and the energy consumption per unit GDP and water consumption per 10,000 yuan GDP in each province also decreased significantly. From 2002 to 2017, the WCENIro index value of Shanghai was the highest, increasing from 0.0915 to 0.0998. This was mainly since the per capita GDP of Shanghai was the highest among the YEB, and its maximum water consumption per 10,000 yuan of GDP was 197.86 m3 in 2002, which was in an ideal state. The WCENIro index value of Guizhou is the lowest among the YEB, but with the steady improvement of the social economy and the optimization of industrial structure, its increase rate is the highest among the YEB, increasing from 0.02354 to 0.03225, with a growth rate of 37%.

3.1.4. Analysis of Spatiotemporal Variation Trend of WCENI

The WCENI value is calculated from three dimensions: the richness of a single subsystem, the coordination between the twin systems and the robustness of the third system. According to the results of the WCENI, the coupled and coordinated development level of the W-C-E system in the YEB is comprehensively reflected. As can be seen from Figure 13 and Figure 14, in general, the WCENI of the YEB increased from 0.351 to 0.391 during 2002–2017, and its coupling coordination degree was at a low level. From a spatial perspective, there is a small gap between the WCENI of provinces, and the coupling coordination degree of most provinces and cities is at a medium level. The WCENI of Jiangsu is the highest, and the WCENI value of 2017 is 0.47219, which is the highest among the YEB, mainly due to the high coordination between the twin systems in Jiangsu. The WCENI value of Zhejiang in 2017 was 0.46625, second only to Jiangsu, which was mainly due to the high richness of single subsystems in Zhejiang. The WCENI value of Chongqing was the lowest among the YEB. In 2012, the WCENI value of Chongqing was 0.29756, and the coupling coordination degree was at a low level. This is mainly due to the high proportion of industry in Chongqing and the low utilization rate of urban recycled water. With the continuous strict water resource protection policy and the vigorous promotion of clean energy in Chongqing, the WCENI value increased to 0.32868 in 2017, with an increase of 10.46%. The single subsystem index of Shanghai is the lowest among the YEB. However, the WCENI value in 2017 was 0.418873, and the coupling coordination degree was at a medium level, mainly due to the strength of the third system in Shanghai, whose per capita GDP and the YEB were the highest, while the water consumption per 10,000-yuan GDP was the lowest in the YEB. From the perspective of time, the WCENI value of Yunnan decreased from 0.406 to 0.389 in 2012, and that of Chongqing decreased from 0.319 to 0.29756, but the WCENI value of the two places, in general, was in a steady state of rise. In 2017, the WCENI values of Yunnan and Chongqing were 0.40472 and 0.32868, respectively, and the coupling coordination degrees of Yunnan and Chongqing were high and medium levels, respectively.
Between 2002 and 2017, YEB’s WCENI increased from 0.351 to 0.391, an overall increase of 11.4%, but the coupling coordination degree remains at a low level. From the perspective of spatial distribution, the inter-provincial differences are small, and the coordination degree of most provinces is medium, among which Jiangsu ranks first with the index value of 0.47219, which is mainly due to the high coordination of water-energy dual systems. Zhejiang (0.46625) is close behind, and its strength lies in the abundance of a single subsystem, such as water resources. In contrast, Chongqing initially showed the weakest performance (only 0.29756 in 2012), mainly due to the high proportion of industry and low utilization rate of recycled water, but through strict water protection and clean energy policies, the index improved by 10.46% in 2017. Shanghai is special: although the single subsystem index is the lowest, due to the strong economic system (per capita GDP is the highest in the whole basin, and the water consumption of 10,000 yuan GDP is the lowest), the index in 2017 still reached 0.418873, and the coordination degree maintained a medium level.
From the perspective of time, the short-term index of Yunnan, Chongqing, and other upstream provinces has fallen (for example, Yunnan dropped to 0.389 in 2012), but the overall trend is rising; Jiangxi achieved the fastest growth rate in the whole basin (+15.2%) through water-saving policies, while Zhejiang’s growth rate slowed down (+8.7%) as energy development approached saturation. The core regional model can be summarized as follows: the downstream provinces (Su/Zhejiang/Shanghai) rely on economic and technological advantages to take the lead, and the upstream provinces (Chongqing/Yunnan) are limited by industrial structure, the initial value is low, but the growth rate is significantly driven by policies. In the future, it is necessary to improve the coordination of subsystems in the upstream region and promote the experience of Jiangsu’s dual-system collaboration.

3.2. Analysis of Driving Factors of W-C-E System

3.2.1. Analysis of Obstacle Factors in W-C-E System

In this study, the barrier degree model was used to calculate the barrier degree of the barrier factor of the W-C-E system in the YEB. The obstacle degree model method is described in detail in Section 2.3.1. On this basis, the main obstacle factors of the top nine W-C-E system rankings in the YEB are screened and analyzed. The calculation results of obstacle factors are shown in Figure 15.
As can be seen from Figure 15, the main obstacle factors restricting the coupled and coordinated development of W-C-E system in the YEB from 2002 to 2017 are A1, C3, and B1, and the average obstacle degree is 12.05%, 9.8%, and 7.43%, respectively, indicating that there is great room for improvement in regional water resources allocation in the YEB. The proportion of ecological water consumption in the YEB is low, with an average ecological water consumption ratio of only 2.5%, while the average obstacle degree of B4 is 6.14%, indicating that YEB should increase the proportion of ecological water consumption in water allocation. The average obstacle degree of A4 and B9 is 7.45% and 5.64%, respectively, indicating that YEB should control traditional energy consumption. Reduce carbon emissions by increasing the efficiency of clean energy use.
High barrier degrees for C1, C2, and C3 in Shanghai, Jiangsu, and Zhejiang suggest that these provinces should prioritize reducing their reliance on traditional energy sources in economic development strategies and appropriately reducing the consumption of water resources. The barrier degrees of B8 in Sichuan, Hunan and Hubei are all high, mainly because the average annual grain output in the three provinces exceeds 20 million tons. Therefore, the carbon emission is relatively high, so the three provinces should promote the reduction in agricultural inputs and the recycling of livestock and poultry manure and straw to achieve the green transformation of agriculture. Sichuan and Guizhou both have the highest A1 obstacle degree (12.2% and 14%, respectively), indicating that the two places should improve the use of water-saving appliances and strengthen residents’ awareness of water-saving. Yunnan has the highest B3 obstacle degree (9.93%). These results indicate that Yunnan should strengthen environmental protection and increase water area. The B9 and A2 barriers of Anhui and Chongqing City are the highest, which are 11.21% and 13.87%, respectively, indicating that Anhui should reduce carbon emissions from energy production, while Chongqing City can encourage the development of the water-saving service industry and support water rights trading to improve per capita water resources.

3.2.2. W-C-E System of the Single Factor Detection Analysis

In this study, eight external factors were selected as independent variables, and the WCENI of the YEB was taken as the dependent variable. The relationship between the coupling coordination degree and each factor was calculated using the geographical detection model. The detection results of a single factor are shown in the figure.
Figure 16 shows that the q values of each factor are all greater than 0, which indicates that the eight selected external influence factors can all promote the coupled and coordinated development of the “W-C-E” system in the YEB. From 2002 to 2017, the q values of X1, X2, and X3 increased year by year, which belong to strong correlation factors. The increase in the proportion of research and experiment funds and the progress of core technologies can provide the core driving force for the coordinated development of the system. In 2017, the q values of X5 and X6 decreased to 0.17 and 0.16, respectively, while the q values of X4 and X8 increased significantly. It is 0.32 and 0.23, respectively, indicating that the improvement of residents’ living standards and the investment in education have gradually increased the impact on the coordinated development of the system, and the q value of X7 has increased from 0.16 to 0.35. Reasonable control of the natural growth rate of the population is conducive to reducing the pressure on water resources, the carbon cycle and ecosystem, and creating favorable conditions for sustainable development.

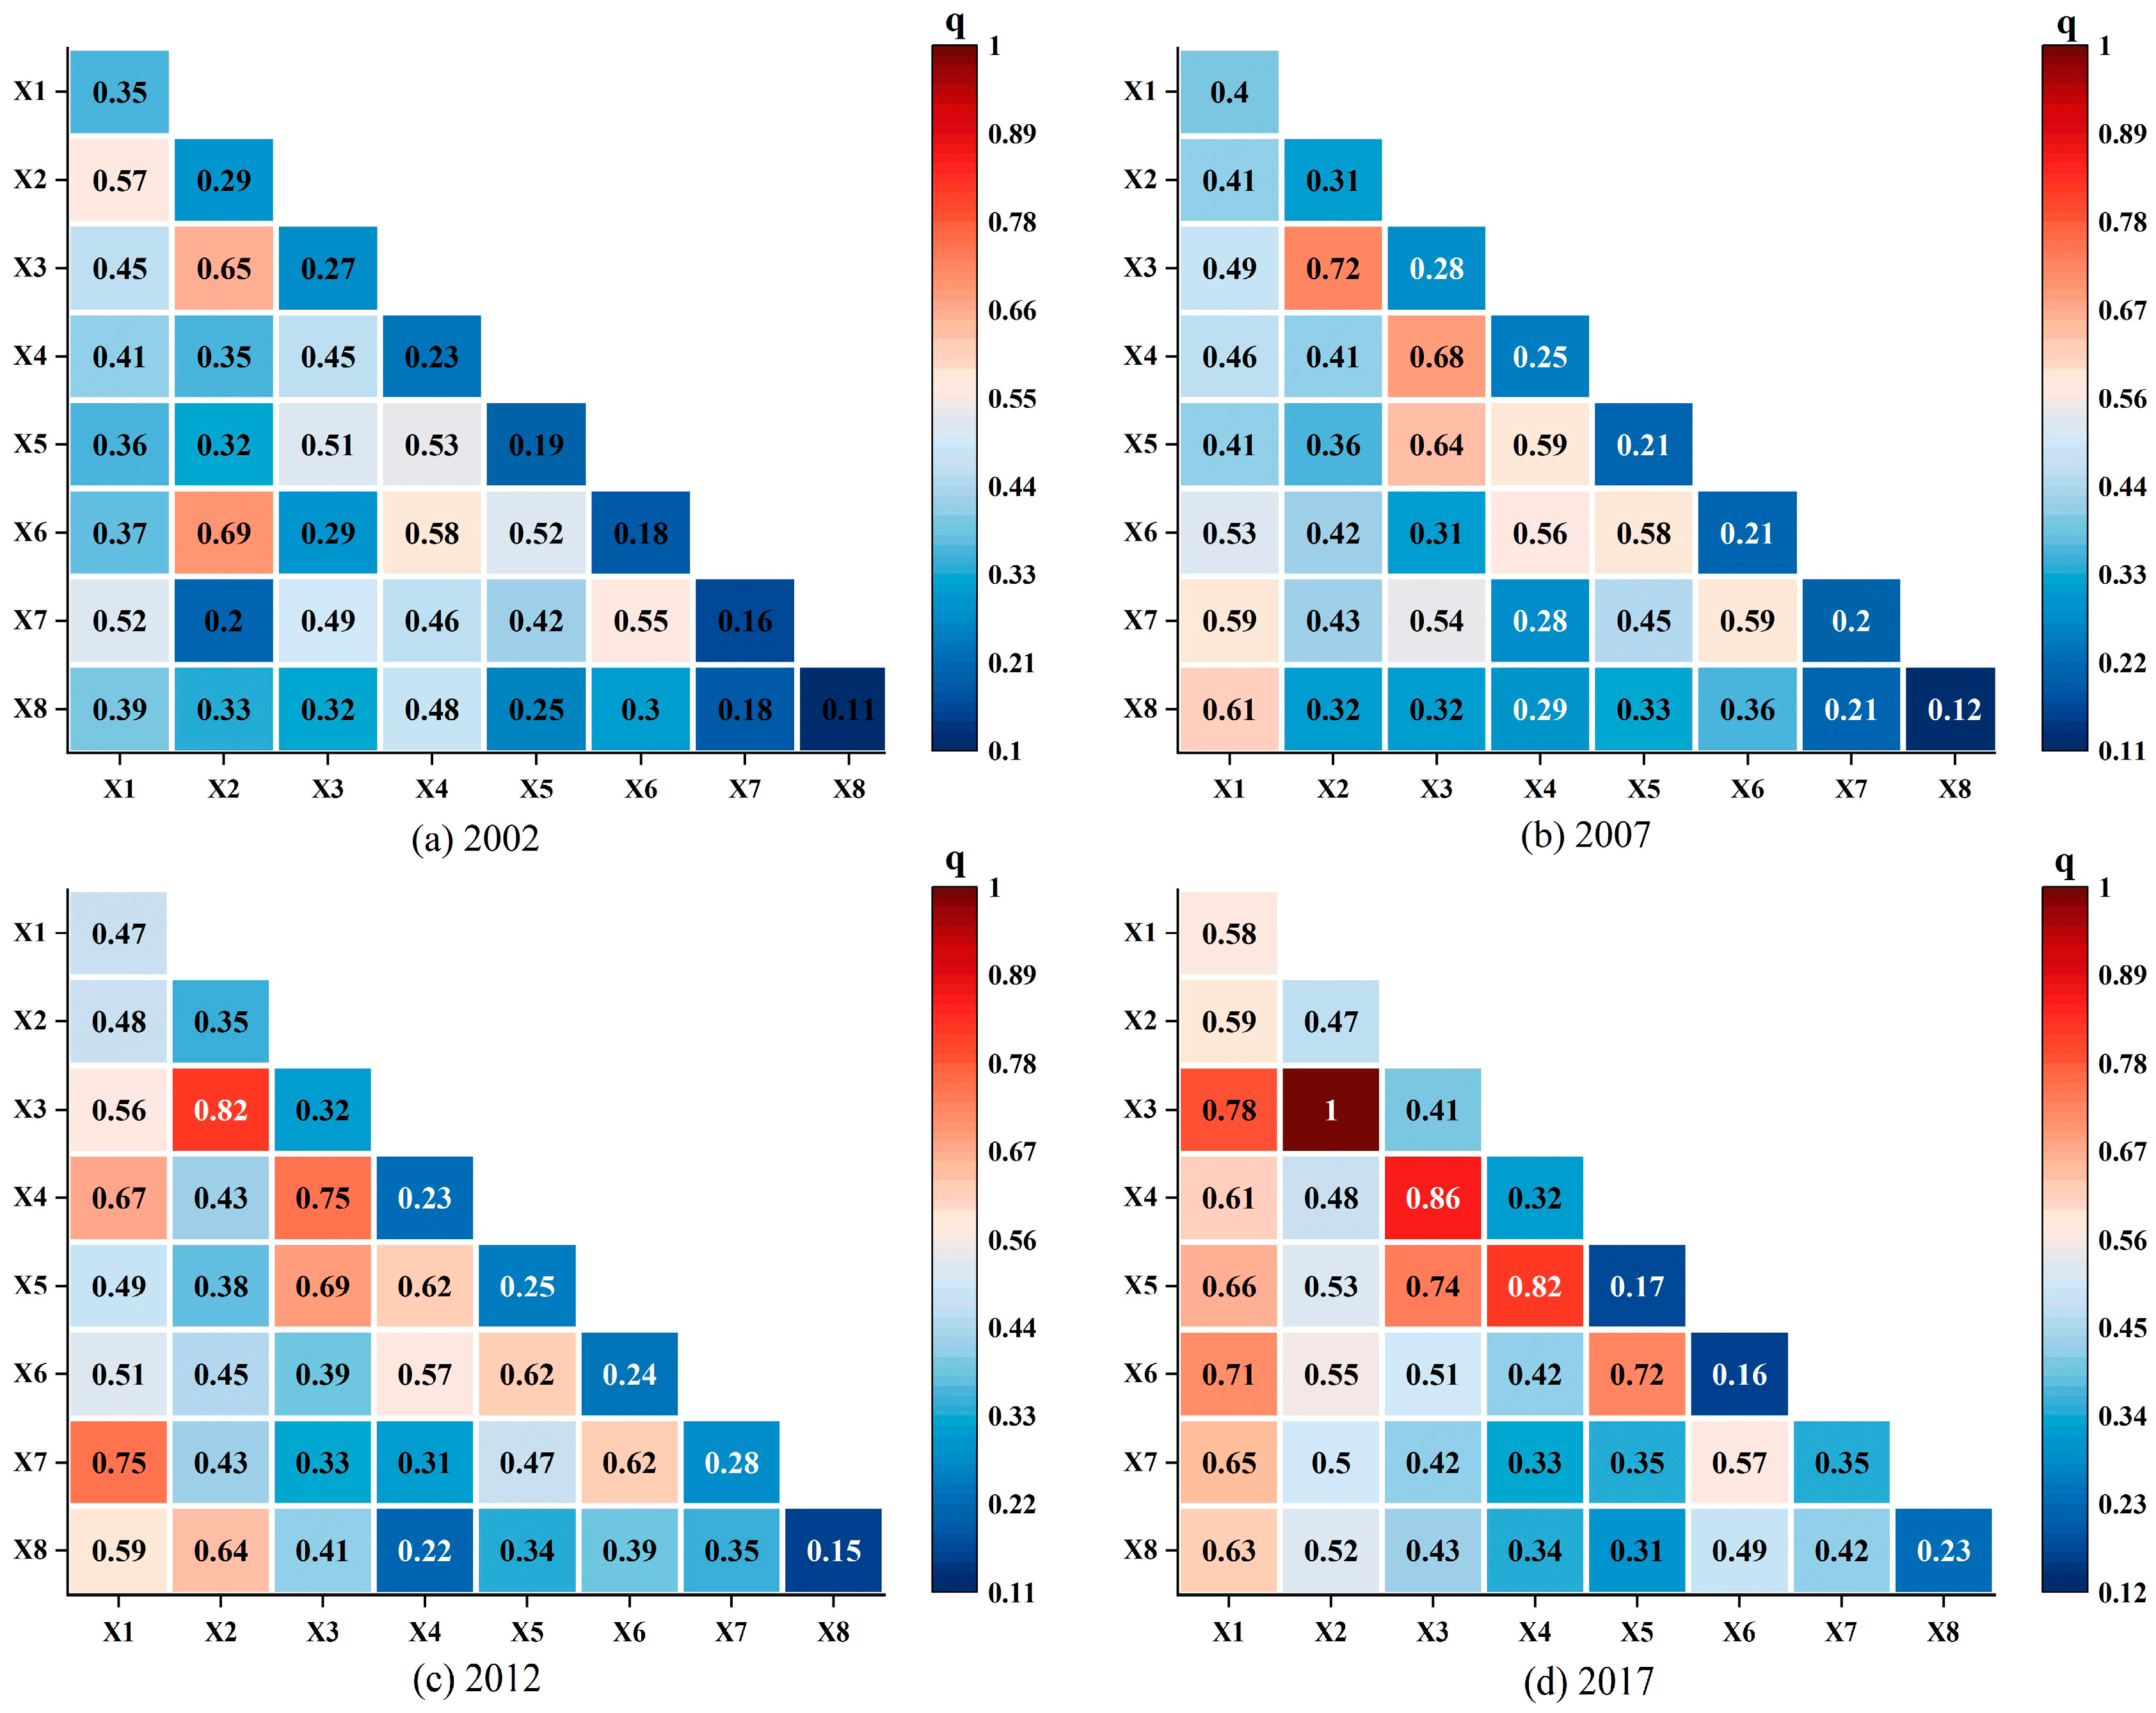
3.2.3. Analysis of the Interaction Between Two Factors of W-C-E System

The interactive detection results between the two factors of “W-C-E” system are shown in Figure 17. It can be seen from the figure that the interaction between the two factors in different periods has different impacts on the WCENI. There is no mutual independence or weakening of nonlinearity between the two factors. After the interaction of the two factors, some factors show nonlinear enhancement, that is, the influence strength of the interaction of any two factors on the coupling and coordinated development of the system is stronger than the sum of the effect strength of a single factor. Some other factors are manifested as two-factor enhancement, that is, the interaction of any two factors has a greater impact on the coordinated development of the system coupling than the maximum of the two factors.
Among the factor interactions from 2002 to 2017, there were more dual-factor enhancement relationships, accounting for 60.71%, 57.14%, 64.29%, and 75%, respectively. During the study period, X2, X3, and X7 had the most significant interaction with other factors, indicating the government’s regulation ability, the proportion of the government’s investment in the ecological environment and population growth. It plays an irreplaceable role in the coupling and coordination development of the system. In 2002, the interaction value of X1 and X7 was 0.81, in 2017, the interaction value of X3 and X4 was 0.86, and the interaction value of X4 and X5 was 0.82, in 2012, the interaction value of X1 and X2 was 0.75, in 2017, the interaction value of X1 and X3 was 0.78. The influence degree was close to 0.8 (±0.5), and the interaction was strong. In 2017, the interaction of X2 and X3(1) is relatively strong, in which the interaction of X2 and X3 reaches 1. It shows that the progress of core technology is conducive to reducing the proportion of provincial investment in pollution control.

4. Conclusions and Policy Proposals

4.1. Conclusions

This study proposes a new WCENI tie relationship index to study the coupling coordination relationship and influence mechanism of regional “W-C-E”. This study takes “W-C-E” as the research object, constructs a multidimensional “W-C-E” system coupling coordination evaluation index system, and analyzes the coupling coordination relationship of “W-C-E” system in the YEB along the Yangtze River Economic Belt by WCENI. In addition, this study identifies the main driving factors of the coupled and coordinated development of the regional water–carbon–ecology system based on the geodimeter model. This study draws the following conclusions:
(a) The spatial and temporal evolution characteristics of single system richness, coordination between two systems, and robustness of the third system are analyzed. Due to the differences in natural endowment and industrial structure among the YEB, the index values of subsystems vary greatly. WCENIro and WCENIco index values are higher in economically developed regions, and WCENIri index values are higher in economically backward regions. The average WCENIri index value of Jiangxi is 0.212. The average WCENIco index value of Yunnan is 0.162, and the average WCENIro index value of Shanghai is 0.09477, which is the highest among the YEB.
(b) The temporal and spatial evolution characteristics of WCENI are analyzed. The average WCENI value of Jiangsu was 0.4446, which was the highest among the YEB. During the study period, the coupling coordination degree of W-C-E system in the YEB was mostly at the medium level, and the average WCENI showed an overall upward trend to varying degrees.
(c) The driving factors of W-C-E coupling coordination are analyzed. In the multidimensional evaluation index system, the average obstacle degree of A1 is the highest, which is 12.05%. Among the external driving factors, the interaction between the two factors is greater than the sum of the two factors or the maximum of the two factors, and the interaction force between X2, X3, X7, and other factors is the most significant.

4.2. Policy Proposals

Based on the analysis of W-C-E coupling coordination and the study of driving factors in the YEB, this study puts forward the following suggestions:
(a) Uneven development of sub-systems among the YEB. All provinces and cities should, in accordance with regional natural endowments and development bases, promote the establishment of inter-provincial coordination mechanisms, jointly formulate and implement strategic plans for water resources management, environmental protection and economic development, rationally utilize water resources, balance water resources distribution among regions, and solve the problem of water resources shortage and uneven distribution in time and space. Shanghai and other economically developed areas can provide technical support and capital investment for less economically developed areas.
(b) The overall “W-C-E” coupling and coordinated development trend of the YEB is good. All provinces can accelerate the adjustment of the industrial structure, develop green industries with low energy consumption and low emissions, reduce dependence on traditional energy sources, carry out ecological restoration projects, such as wetland restoration and river management, and improve ecosystem services. In terms of policy guidance, provinces and cities can establish a scientific assessment and evaluation system, and incorporate the “W-C-E” coupling and coordinated development into local government performance assessment.
(c) Water resources have a positive effect on carbon emissions and the ecological environment. Reasonable development of water resources and improvement of water resource utilization efficiency are of great significance to the coordinated development of regional “W-C-E” coupling. All localities should further strengthen the governance of enterprises with high water consumption and high pollution, and use green innovation technology to promote economic development.
(d) Based on the WCENI, this study makes an in-depth analysis of the coupling and coordination relationship of the “water-carbon-ecology” system in the Yangtze River Economic Belt, and puts forward highly operable policy suggestions for the prominent problems found in the study. In the Conclusion Section, we show that the sub-system development is unbalanced among provinces and cities, among which the WCENIri index of Jiangxi is the highest (0.212), the WCENIco index of Yunnan is the best (0.162), and the WCENIro index of Shanghai is the leading (0.09477). The overall coupling coordination degree showed an upward trend, and Jiangsu ranked first with a WCENI average of 0.4446. The driving factor analysis showed that the A1 factor had the highest obstacle degree (12.05%), and the interaction of external factors such as X2, X3, and X7 was significant. In response to these findings, the study put forward specific and feasible policy options: in terms of water resources management, it is recommended to implement financial subsidies of 30–50% for agricultural water-saving irrigation systems and carry out accurate public publicity in provinces with high barriers. In terms of eco-economic coordination, the establishment of a cross-provincial ecological protection tax and the implementation of industrial transformation incentive measures are proposed. At the same time, it is suggested to establish a special assessment system and a digital supervision platform, incorporate the improvement of the core obstacle factors into the government assessment, and promote the collaborative management GIS system for real-time monitoring. These recommendations correspond directly to the identified key obstacle factors (such as A1 and C3), and specify implementation areas and quantitative targets, such as increasing agricultural water use efficiency by ≥10%/year and increasing wetland area in upstream provinces by ≥5%/year, thus significantly improving the practicality and evaluation feasibility of policy recommendations. It provides a scientific basis and implementation path for promoting the coordinated development of water–carbon ecosystem in the Yangtze River Economic Belt.

Author Contributions

Conceptualization and writing—review and editing, J.L.; writing—original draft preparation, Y.H.; software, M.Z.; supervision and project administration, Z.J. and R.C. All authors have read and agreed to the published version of the manuscript.

Funding

This research was funded by Natural Science Foundation of Henan Province, grant number 232300421339.

Institutional Review Board Statement

Not applicable.

Informed Consent Statement

Not applicable.

Data Availability Statement

The original contributions presented in the study are included in the article, further inquiries can be directed to the corresponding author.

Conflicts of Interest

The authors declare no conflicts of interest.

References

  1. Zhang, C.; Zhao, L.; Song, X.; Zhang, Q.; Zhang, X. Spatial-temporal coupling characteristics and interaction effects of economic resilience and people’s livelihoods and well-being: An analysis of 78 cities in the Yellow River Basin. Sustain. Cities Soc. 2024, 112, 105638. [Google Scholar] [CrossRef]
  2. Zhang, Y.; Yang, Y. Can the resource and environmental dilemma due to water-energy-carbon constraints be solved in the process of new urbanization. Sustain. Cities Soc. 2024, 114, 105748. [Google Scholar] [CrossRef]
  3. Yan, X.; Chen, J.; Zhou, S. Carbon metabolism mechanisms and evolution characteristics analysis of the food-water-energy nexus system under blue-green infrastructure changes. Sci. Total Environ. 2024, 951, 175763. [Google Scholar] [CrossRef] [PubMed]
  4. Martínez-Ibáñez, E.; Laso, J.; Vázquez-Rowe, I.; Ceballos-Santos, S.; Fernández-Rios, A.; Margallo, M.; Aldaco, R. Integrating the water-energy-food nexus and LCA + DEA methodology for sustainable fisheries management: A case study of Cantabrian fishing fleets. Sci. Total Environ. 2024, 949, 175223. [Google Scholar] [CrossRef] [PubMed]
  5. Yu, L.; Peng, K.; Huang, Y.; Chen, F.; Chen, S.; Xia, Y.; Huang, X.; Ni, X.; Guo, R.; Cai, C.; et al. Application of a water-energy-carbon coupling index to evaluate the long-term operational stability of the anaerobic-anoxic-oxic-membrane bioreactor (A2/O-MBR) process under the influence of rainstorms. Water Res. 2024, 255, 121489. [Google Scholar] [CrossRef] [PubMed]
  6. Feng, Y.; Wang, J.; Ren, X.; Zhu, A.; Xia, K.; Zhang, H.; Wang, H. Impact of water utilization changes on the water-land-energy-carbon nexus in watersheds: A case study of Yellow River Basin, China. J. Clean. Prod. 2024, 443, 141148. [Google Scholar] [CrossRef]
  7. Wang, M.; Zhong, X.; Yuan, H.; Zhang, D.; Cheng, L.; Zhang, J. Integrating carbon and water footprint into nature-based solution (NBS) for urban planning in a highly built-up area in Guangzhou, China. Sci. Total Environ. 2024, 951, 175505. [Google Scholar] [CrossRef] [PubMed]
  8. Li, J.; Zhao, M.; Han, Y.; Wei, J. Assessment on water cycle health in the Central Plains Urban cluster based on the DSWU NWU SWS NWS A—WCHI model. Ecol. Indic. 2023, 157, 111236. [Google Scholar] [CrossRef]
  9. Chen, L.; Li, X.; Kang, X.; Liu, W.; Wang, M. Analysis of the cooperative development of multiple systems for urban Economy-Energy-Carbon: A case study of Chengdu-Chongqing Economic Circle. Sustain. Cities Soc. 2024, 108, 105395. [Google Scholar] [CrossRef]
  10. Jin, K.; Zhang, S.; Yang, Y.; Chen, X.; Wang, S.; Li, T.; Wang, Y. Evaluation of water-carbon-ecological footprints and its spatial–temporal pattern in the central plains urban agglomeration. Ecol. Indic. 2023, 155, 110982. [Google Scholar] [CrossRef]
  11. Pang, B.; Li, X.; Fu, Y. Coupling coordination analysis and obstacle factors of water-energy-environment-economy in the Yellow River Basin. J. Clean. Prod. 2024, 468, 143108. [Google Scholar] [CrossRef]
  12. Jing, P.; Sheng, J.; Hu, T.; Mahmoud, A.; Guo, L.; Liu, Y.; Wu, Y. Spatiotemporal evolution of sustainable utilization of water resources in the Yangtze River Economic Belt based on an integrated water ecological footprint model. J. Clean. Prod. 2022, 358, 132035. [Google Scholar] [CrossRef]
  13. Zhang, Y.; Cui, J.; Liu, X.; Liu, H.; Liu, Y.; Jiang, X.; Li, Z.; Zhang, M. Application of water-energy-food nexus approach for optimal tillage and irrigation management in intensive wheat-maize double cropping system. J. Clean. Prod. 2022, 381, 135181. [Google Scholar] [CrossRef]
  14. Zhang, K.; Jin, Y.; Li, D.; Wang, S.; Liu, W. Spatiotemporal variation and evolutionary analysis of the coupling coordination between urban social-economic development and ecological environments in the Yangtze River Delta cities. Sustain. Cities Soc. 2024, 111, 105561. [Google Scholar] [CrossRef]
  15. Zheng, C.; Yang, W.; Jiang, X.; Lian, J.; Hu, D.; Yan, X.; Yan, L. A novel integrated Urban flood risk assessment approach coupling GeoDetector-Dematel and clustering method. J. Environ. Manag. 2024, 354, 120308. [Google Scholar] [CrossRef] [PubMed]
  16. Zhu, J.; Yin, D.; Li, X.; Zhu, R.; Zheng, H. Divergent determinants on interannual variability of terrestrial water cycle across the globe. Sci. Total Environ. 2024, 945, 174046. [Google Scholar] [CrossRef] [PubMed]
Figure 1. Research framework.
Sustainability 17 03566 g001
Figure 2. Evaluation index system of W-C-E system coupling coordinated development.
Sustainability 17 03566 g002
Figure 3. Weight chart of evaluation indicators. Note: The three colors are used to distinguish, and the darker the color, the larger the value.
Sustainability 17 03566 g003
Figure 4. Ranking chart of WCENI.
Sustainability 17 03566 g004
Figure 5. Spatial evolution results of single system richness in the YEB.
Sustainability 17 03566 g005
Figure 6. (ac) show the Wri, Cri and Eri index results of YEB.
Sustainability 17 03566 g006
Figure 7. WCENIri index results of the YEB.
Sustainability 17 03566 g007
Figure 8. Spatial evolution results of coordination between the two systems in the YEB.
Sustainability 17 03566 g008
Figure 9. (ac) are the WCco, WEco, and CEco index results of the YEB.
Sustainability 17 03566 g009
Figure 10. WCENIco values showing the inter-system coupling trends across YEB provinces (2002–2017).
Sustainability 17 03566 g010
Figure 11. Spatial evolution results of WCENIro index in the YEB.
Sustainability 17 03566 g011
Figure 12. WCENIro index results of the YEB.
Sustainability 17 03566 g012
Figure 13. WCENI results of the YEB.
Sustainability 17 03566 g013
Figure 14. Spatial evolution results of WCENI in the YEB.
Sustainability 17 03566 g014
Figure 15. Analysis of the barrier factors of W-C-E system in the YEB.
Sustainability 17 03566 g015
Figure 16. Single factor detection and analysis results of W-C-E system in the YEB.
Sustainability 17 03566 g016
Figure 17. Interactive detection analysis results of the two factors of the W-C-E system in the YEB.
Sustainability 17 03566 g017
Table 1. External factor index system.
Variable TypeVariable DimensionVariable IndexVariable Symbol
Dependent variableCoupling coordination degreeWCENIY
Independent variableUrbanization levelBuilt-up areaX1
Technological development levelProportion of research and experimental fundingX2
Government regulation abilityProportion of provincial investment in environmental pollution control in GDPX3
Residents’ living standardThe proportion of social retail goods in GDPX4
Degree of opening upTotal value of imports and exports of goods as a proportion of GDPX5
Labor force factorProportion of employment in the tertiary industryX6
Degree of population growthNatural rate of population growthX7
Educational levelEducational expenditureX8
Disclaimer/Publisher’s Note: The statements, opinions and data contained in all publications are solely those of the individual author(s) and contributor(s) and not of MDPI and/or the editor(s). MDPI and/or the editor(s) disclaim responsibility for any injury to people or property resulting from any ideas, methods, instructions or products referred to in the content.

