Article

Toward Sustainable Education: A Contextualized Model for Educational Technology Adoption for Developing Countries

by
Micheline Sabiteka
,
Xinguo Yu
and
Chao Sun
*
Faculty of Artificial Intelligence in Education, Central China Normal University, Wuhan 430079, China
*
Author to whom correspondence should be addressed.
Sustainability 2025, 17(8), 3592; https://doi.org/10.3390/su17083592
Submission received: 6 March 2025 / Revised: 29 March 2025 / Accepted: 11 April 2025 / Published: 16 April 2025

Abstract

:
Adopting educational technology remains a critical challenge in developing countries, particularly given limited resources and the urgency of achieving the United Nations’ Sustainable Development Goal 4 by 2030. This paper aims to create and validate a model for educational technology adoption for developing countries (ETADC) that addresses the gaps in existing models by incorporating education-specific factors and local contexts. The ETADC model integrates foundational theories with local and educational elements within the technological pedagogical content knowledge (TPACK) framework, empowering educators to enhance teaching–learning experiences for a tech-driven world. The ETADC framework includes six components—four sourced from established theories and two based on research into the experiences of in-service and pre-service teachers in developing countries regarding educational technology adoption. These components formulate an appropriate model for evaluating, identifying, and implementing educational technologies within developing countries’ educational contexts. Validation through meta-analysis and two-stage structural equation modeling in R Studio version 4.4.0 with data from 30 high-impact studies (sample size N = 8934) confirmed the model’s effectiveness, showcasing a strong fit and significant path coefficient. This model has been used to evaluate certain educational technologies for further adoption. ETADC offers a practical and scalable roadmap for sustainable EdTech adoption, potentially supporting educational transformation and development worldwide, particularly in under-resourced contexts.

1. Introduction

1.1. Background

Educational technology is a rapidly evolving field that continues to attract global attention. The adoption of educational technologies in developing countries faces several challenges, but it also presents opportunities for sustainable education. Its effective adoption is especially critical for advancing progress toward the United Nations’ Sustainable Development Goal 4 (Quality Education) by 2030.
Educational technology, in terms of terminology and structural composition, may carry out two basic components: education and technology. Here, we focus more on the second component, i.e., technology, as a subject concerned with identifying the most suitable and appropriate hardware and software to serve the educational needs and purposes of students, teachers, and societies in developing countries. There are various fundamental characteristics of educational technology, including users, contexts, and settings. Educational technology (EdTech) is a dynamic and evolving field that uses technological processes and resources to facilitate learning, improve performance, and enhance the educational experience. Educational technology has progressed from visual instruction and audiovisual aids to more advanced digital technologies. The field now includes a wide range of tools and approaches, from multimedia learning and online environments to data-driven smart technologies and learning analytics [1]. Educational technology is not solely focused on efficiency but aims to address the needs of the whole person in education. Educational technologies are crucial in enhancing student engagement and learning outcomes in education. However, there are some contradictions in the perception and implementation of educational technology. It is seen as a potential solution for improving education quality, especially in high-poverty populations [2]. The relationship between educational technology and teacher education is conflicted, particularly in contexts where teachers are not adequately trained to incorporate new technologies effectively.
In the current era of digitization, referred to as the fourth industrial revolution, professionals such as teachers, engineers, developers, and clinicians depend on technological resources to collaborate, interact, and achieve their enterprises.
Within the scope of this study, educational technology is considered an ethical practice of facilitating learning and improving performance through the creation, use, and management of appropriate technological processes and resources in the educational settings of developing countries. As the field continues to evolve, it is increasingly recognized as a crucial component of the digital economy, with significant potential to transform traditional education models and improve access to quality learning.
A model for the adoption of educational technology is critical for understanding market dynamics, guiding policy decisions, and shaping business strategies. Accurate forecasting methods are essential, yet they require continuous refinement and validation to address diverse adoption patterns across technologies and contexts. Although predominant models such as the technology acceptance model (TAM), the unified theory of acceptance and use of technology (UTAUT), task–technology fit (TTF), and the diffusion of innovations theory (IDT) have been widely applied, their suitability for developing countries remains limited. These models were predominantly developed in advanced countries and fail to fully capture the unique constraints and opportunities of developing nations [3]. Factors such as limited infrastructure, resource scarcity, and cultural nuances necessitate adaptations to these frameworks [4]. The socioeconomic and technological landscapes of developing countries demand a tailored approach to educational technology adoption. Challenges such as cost-effectiveness, infrastructure limitations, and skill gaps complicate the direct application of existing models. Extensions of the TAM and integration with other theories have been proposed, yet these efforts often overlook the complex interplay of pedagogical goals, teacher competencies, and contextual factors specific to low- and middle-income countries. For example, leveraging augmented and virtual reality in less-developed nations has demonstrated the potential to overcome key educational barriers [4]. However, gaps persist in understanding and effectively using technology resources [5]. A more context-specific framework for educational technology adoption for developing countries is essential. This framework should integrate pedagogical and socioeconomic considerations, focusing on factors such as cost-effectiveness, teacher readiness, and localized challenges. Previous models such as the concerns-based adoption model (CBAM) and later iterations of the TAM (e.g., TAM2 and TAM3) have highlighted the evolution of adoption theories but fall short in addressing education-specific dynamics. Similarly, broader models such as the technology–organization–environment (TOE) framework and the UTAUT have provided valuable insights yet require further customization for developing nations.

1.2. Current Research Status on Educational Technology Adoption Models for Developing Countries

Current research on technology adoption models in education for developing countries focuses on various emerging technologies and their implementation challenges. Several studies have explored factors influencing the adoption of these technologies in higher education institutions (HEIs) in developing nations.
The adoption of the Internet of Things (IoT) for e-learning in HEIs has been examined, with researchers proposing a model categorizing influencing factors into individual, organizational, environmental, and technological groups [6]. The technology acceptance model (TAM) has been widely used to study e-learning adoption, with constructs such as perceived usefulness (PU) and perceived ease of use (PEOU) playing significant roles [7]. Other factors include system quality, service quality, quality of life, and behavioral intention to use. Additionally, factors such as usability, accessibility, technical support, and individual proficiencies have been found to contribute to the rate of ICT adoption in higher education institutions [8]. In addition, Key factors identified include privacy concerns, infrastructure readiness, financial constraints, ease of use, faculty support, and network security. Similarly, research on blockchain technology adoption in education has utilized an expanded technology acceptance model (TAM) integrated with the diffusion of innovation theory [9]. Hence, research has revealed contradictions in technology adoption across different regions. For instance, a comparative study on mobile technology adoption for library services in Hong Kong and Japan showed that cultural factors affect the formation of adoption intentions [10]. While performance expectancy was the main focus in Japan, Hong Kong emphasized facilitating conditions, performance expectancy, and perceived usefulness collectively.
Overall, current research on technology adoption models in education for developing countries encompasses various technologies such as the IoT, blockchain, and mobile learning. These studies often adapt existing models such as the TAM or the unified theory of acceptance and use of technology (UTAUT) to fit the specific context of developing nations. Factors such as cultural dimensions, infrastructure readiness, and financial constraints play crucial roles in shaping technology adoption in these educational settings.

1.3. Critical Review of Existing Technology Adoption Models

Prominent models such as the technology acceptance model (TAM) and the unified theory of acceptance and use of technology (UTAUT), along with their extensions, including UTAUT2, TAM2, and TAM3, have gained significant consideration in the field of educational technology adoption. These models emphasize crucial factors that drive individuals’ decisions to accept and utilize new technologies in educational settings.
Key components of these models include perceived usefulness (referred to as performance expectancy in the UTAUT), which measures how strongly individuals believe that using a particular technology will enhance their academic performance or educational outcomes. Another critical factor is the **perceived ease of use** (effort expectancy in the UTAUT), which assesses the degree to which prospective users feel that the technology is user-friendly and easy to navigate. However, existing models lack education-specific factors and fail to consider local contexts, which limits their applicability in developing countries (DCs). A study in Nepal found no influence of perceived usefulness or attitude on behavioral intention, contrary to theorized relationships and the empirical literature [11]. This suggests that the TAM may not fully translate to understudied populations and is sensitive to local situational differences. Additionally, research in Saudi Arabia identified several external variables affecting perceived ease of use and perceived usefulness, indicating the need for extending the basic TAM model in higher education contexts [12]. A study on digital library adoption in Kenya and Peru found that while the TAM worked well overall, certain constructs demonstrated predictive power in only one setting, highlighting the need to consider local circumstances [13]. Researchers have emphasized the need to extend the TAM by incorporating additional constructs to better suit the local context [7,14]. All these studies have recommended focusing on adapting the TAM to address specific challenges in developing countries, such as a lack of ICT infrastructure, low digital literacy, and cultural factors influencing technology acceptance.
The UTAUT model has been widely applied to study technology adoption in educational settings, including developing countries. However, research suggests that while the UTAUT provides valuable insights, it may not fully capture the complexity of educational technology adoption in these contexts. Studies suggest modifications or extensions to the UTAUT model for better applicability in the educational contexts of developing countries. For example, a study in Oman incorporated additional constructs such as flexibility learning, social learning, and economic learning to predict mobile learning adoption [15]. In addition, research in the Philippines extended the UTAUT model by incorporating enjoyment, interactivity, flexibility, and quality of online learning systems as antecedent variables, providing a more comprehensive view of technology acceptance in developing countries [16]. These extensions indicate that the UTAUT alone may not capture all relevant factors in these settings. Additionally, cross-cultural comparisons have revealed that social influence may operate differently in non-Western contexts [17], further highlighting the need for cultural adaptations to the model.
In conclusion, the UTAUT model is a valuable tool for understanding educational technology adoption in developing countries, but it may need modifications for specific contexts. While it explains a significant portion of technology acceptance, researchers often adapt it to address unique factors relevant to their settings. This highlights the importance of considering contextual factors and cultural nuances.

1.4. Research Problem Statement

Developing countries often seek to adopt educational technologies without adequate knowledge of their features or contextual suitability [18]. In addition, while previous models such as the TAM, the UTAUT, and their extensions provide valuable insights, they may not fully capture the complexity of educational technology adoption in these contexts. These models were largely built in isolated contexts with small sample sizes, primarily focused on advanced economies. For instance, the TAM was introduced in 1989, and the UTAUT in 2003, and their derivatives have aged while technology and its educational applications continue to evolve rapidly. Moreover, these models originated in sectors such as banking and information systems before being adapted to education, leaving critical gaps in their predictive capabilities for educational contexts. Specific adoption models tailored to identify educational technologies in developing countries are needed. The rapid development of advanced technologies, such as artificial intelligence and gamification, underscores the need for a new conceptual framework. The current research should focus on developing context-specific models to better capture the challenges and opportunities in these educational environments [16,19]. This framework must address the distinctive constraints of developing countries and better support sustainable educational progress.

1.5. Research Questions

Three primary research questions guide this study:
RQ1: What are the kinds of practices (models) in educational technology adoption in developing countries?
RQ2: How can an educational technology adoption for developing countries (ETADC) model be developed to identify suitable educational technologies according to each context?
RQ3: Is the developed model valid, superior, and more generalizable than existing models?

1.6. Research Contributions

This study makes the following contributions. Model development—proposes a tailored ETADC model to identify, evaluate, and adopt educational technologies effectively in developing countries. Model validation—uses a meta-analysis and two-stage structural equation modeling to synthesize insights from 30 studies and validate the hypothesized model. Process framework—outlines the requirements and processes for effective educational technology adoption in resource-constrained settings.

1.7. Paper Organization

This paper is organized as follows. Section 1 outlines the background, problem statement, research questions, and contributions; Section 2 embraces the need for a new model tailored to developing countries; the details of the ETADC model’s design, foundations, and hypotheses are elaborated upon in Section 3; Section 4 presents methods and results for testing the model’s validity; and finally, Section 5 summarizes findings and highlights research implications.

2. Need for an Educational Technology Adoption Model for Developing Countries

This section highlights the importance of creating a framework to help developing countries effectively use technology in education. It emphasizes that to improve teaching-learning experiences and outcomes, DCs require a clear plan or model to evaluate, adopt, and integrate educational technology in schools. By doing so, they can enhance teaching–learning methods, make learning more accessible, and prepare students for a better future in a digital world.

2.1. Difference Between Advanced and Developing Countries in the Adoption of Educational Technology

Educational technologies are increasingly being adopted in developing countries to promote sustainable education and create opportunities for improved access and quality of learning [20]. However, technology adoption in developing countries encounters distinct challenges compared to advanced nations, despite the potential benefits.
Key factors influencing this process include government policies, infrastructure, training, and cultural aspects, which often impede technology transfer in developing regions. While stakeholders in both contexts recognize the importance of internal and external factors for successful implementation, managers in advanced countries emphasize these elements more, contributing to higher success rates. This indicates that although the understanding of technology adoption is similar, the execution and supporting environments differ significantly. Advanced nations benefit from established infrastructures and a culture of innovation, making technology adoption more straightforward, whereas developing countries face considerable obstacles, particularly in teacher training and integration. The differences hinge on these two main factors:
  • Investment in Infrastructure and Resources [18]: Advanced countries invest heavily in educational technology, providing modern tools such as computers, projectors, Internet connections, and others, while developing countries often rely on traditional methods due to a lack of infrastructure.
  • Teacher Training and Support [18]: Advanced nations have established programs for integrating technology into education, ensuring teachers are trained in using these tools effectively. In contrast, developing countries face foundational challenges that hinder teacher training and technology adoption.

2.2. Challenges Faced by Developing Countries in the Adoption of Education Technologies

The adoption of education technologies in developing countries faces several challenges, including limited infrastructure, resources, and human resource capacity in many developing countries [21,22].
  • Limited access to resources [18]: The lack of technical support, electricity, Internet, devices, and financial resources significantly hampers technology adoption, especially in rural areas and emerging economies.
  • Lack of training and skills [18]: Teachers in developing countries often receive inadequate training and support, resulting in low technology adoption rates. Many lack the professional readiness to effectively utilize emerging technologies in education.
  • Cultural and social factors [23]: These factors heavily influence technology adoption, particularly in mobile learning within Arab Gulf countries, affecting acceptance among students and instructors.
  • Resistance to technology [24]: Teachers’ attitudes toward technology create challenges in the classroom. Their willingness to integrate technology depends on perceived benefits versus concerns, complicating adoption efforts.
  • Overemphasis on technology and underemphasis on pedagogy: Many programs prioritize acquiring technology over its integration into educational frameworks and pedagogy.
This disparity has led to failed technology adoption projects, particularly in developing countries, highlighting the need for strategies tailored to local contexts.
Several strategies have been proposed to address these challenges and promote sustainable education. These include strengthening educational systems, increasing investment in research and development, implementing staff retention policies, fostering collaboration, and providing adequate infrastructure [21,22]. Furthermore, the development of contextual frameworks, such as the M-learning framework presented in Okai-Ugbaje et al. (2022) [25], considers low-income economies’ sociocultural and socioeconomic contexts, potentially offering a more sustainable approach to integrating educational technologies.

2.3. Difference Between the Current Model to Be Developed and Existing Previous Models

An educational technology adoption model for developing countries can differ from previous models such as the TAM, UTAUT, and UTAUT2 in several ways.
Performance expectancy and effort expectancy have been consistently identified as significant factors influencing behavioral intention to use educational technology in developing countries [26,27]. Interestingly, facilitating conditions emerge as a crucial factor in developing countries, directly impacting the actual usage of educational tools [26,27]. This highlights the importance of infrastructure and support systems in these contexts. Context-specific factors in developing countries play a crucial role in technology. This suggests that cultural factors may play a more nuanced role in technology adoption in developing countries compared to developed nations.
In conclusion, while models such as the UTAUT provide a valuable foundation, an educational technology adoption model for developing countries should consider cultural nuances and emphasize facilitating conditions. It should also account for the specific challenges and contexts of developing nations, such as infrastructure limitations and diverse socioeconomic backgrounds, to provide a more comprehensive understanding of technology adoption in these settings. Models such as the TAM, UTAUT, and UTAUT2 provide a solid foundation; adopting these models in developing countries often requires modifications to account for unique contextual factors. Studies such as Batucan et al. [16] propose extended models (e.g., the UTAUT) that incorporate additional variables to better explain technology adoption in the contexts of developing countries. This underscores the need for more nuanced, context-specific approaches when studying educational technology adoption in developing nations [16].

3. Construction of the ETADC Model

3.1. The Scope of Searching Base Models for Constructing the ETADC Model

In this study, we first conducted a systematic review to explore existing models applied in educational technology adoption (see Appendix A, Table A1).
A systematic search identified studies from January 2019 to June 2024 in nine education technology journals on SCOPUS, including the British Journal of Educational Technology and Computers and Education. Keywords included educational technology, EduTech, Technology adoption, and related factors.
The following studies were incorporated into this analysis: articles involving the use of technologies for educational purposes, articles published in English, research articles (scientific research from peer-reviewed journals), and articles published from January 2019 to June 2024. Research studies that were excluded from this study include systematic review papers (reviews), theses, theoretical papers, conference papers, summaries that do not provide the entire article, and studies that are “locked” and require a subscription or on-site payment for access. At least a hundred publications were downloaded and examined in more detail, and only 70 publications selected from nine SSCI high-indexed journals were found to be sufficiently related to technology adoption in education.
It was found that the TAM model and its extensions were used in 33 studies, or 47.14%, while the UTAUT model and its extensions were used in 27 studies, or 38.57%. Two studies, or 2.85%, used a combination of the TAM and UTAUT, while one study, or 1.42%, used a combination of the TAM and DOI. Moreover, only one study, or 1.42% of the studies, used the DOI theory (Table A1 and Figure 1). Six studies, or 8.57%, studied technology adoption in education without basing it on any theory. The results of this study found that the evaluation of technology adoption in education settings applies the two prominent theories, the TAM and the UTAUT, and their extensions.
The core concepts of the TAM (technology acceptance model) and the UTAUT (unified theory of acceptance and use of technology) are closely related to the factors influencing educational technology adoption. These models provide a framework for understanding how users accept and use new technologies, including those in educational settings.
The TAM and UTAUT incorporate several key factors that influence technology adoption in education. These include perceived usefulness, perceived ease of use, performance expectancy, effort expectancy, social influence, and facilitating conditions [28,29]. These factors have been found to significantly impact students’ and educators’ attitudes towards using educational technologies, such as M-learning and educational metaverse platform conditions [28,29].
Interestingly, while the TAM and UTAUT have been widely used in educational technology research, some studies suggest that these models may need to be extended or modified to better capture the complexities of technology adoption in educational contexts. For instance, Kiwanuka [30] argues that the process of technology adoption should be included in the UTAUT to better predict technology acceptance.
Overall, the TAM and UTAUT provide a solid foundation for understanding educational technology adoption. However, researchers often extend these models by incorporating additional factors to increase their predictive validity in educational settings.
The findings of this study indicate that there is currently no established model specifically tailored for the adoption of educational technologies in developing countries. This insight directly addresses the first research question posed in this study, highlighting a significant gap in the existing literature and practices surrounding educational technology integration in these regions. The absence of a specific model suggests that educational institutions in developing countries may face unique challenges and barriers that are not adequately accounted for in existing frameworks.
As technology continues to evolve, these models may need further refinement to accurately capture the nuances of educational technology adoption in various contexts.

3.2. The Properties of Base Models

According to the literature, previous models were developed by the modification or extension of primary models according to the context of their application.
The technology acceptance model (TAM) was developed by Davis [31] and highlights perceived usefulness (PU) and perceived ease of use (PEU) in adopting new technology, originating from the theory of reasoned action (TRA). However, it does not account for subjective norms or guides on enhancing technology’s usability.
TAM2 and TAM3 were developed by Venkatesh and Davis [32] and expand on the TAM’s core constructs by including components such as subjective norms (SN), image (IM), job relevance (JR), and additional factors in TAM3 such as results demonstrability (RD) and computer self-efficacy (CSE). Both models are complex and focus on technology adoption within organizational settings.
The unified theory of acceptance and use of technology (UTAUT) was developed by Venkatesh [33,34], introducing performance expectancy, effort expectancy, and social influence, along with moderators such as gender and age, enhancing its complexity.
UTAUT2 was developed by Venkatesh [35] and adapts this framework to consumer contexts. However, it similarly suffers from increased complexity due to multiple moderators. Overall, these models reflect a shift from individual perceptions to broader factors influencing technology adoption.
This reflects the shift from basic models centered on individual perceptions to more comprehensive frameworks that include organizational, social, and contextual factors in technology adoption in education, particularly in developing countries. The current study integrates variables related to adoption processes, contexts, and technology features to create a suitable framework for educational settings in these regions.

3.3. Identifying Components for the ETADC Model from the Base Models

This study develops the educational technology adoption model for developing countries (ETADC) based on the existing literature and studies focused on in-service and pre-service teachers’ technology adoption. The ETADC model includes six components and specific cause–effect links, integrating context-specific, technological, organizational, and sociocultural factors to enhance its relevance in developing countries. It omits less impactful variables and moderator factors from previous models, such as gender, age, and experience, to reduce complexity and improve interpretation across different contexts, as they did not significantly influence the relationships within the model.

3.3.1. The Sharing of Cause–Effect Links of Dominant Technology Adoption Models and Hypotheses Development

Five primary technology adoption models have been more popular than others. These models share the following main components and cause–effect links:
  • PE → BIU
Performance expectancy, a synonym for perceived usefulness (PU), is a core component in all five popular technology adoption models (Table 1). PU → BIU or PE→ BIU was shared by all five models (TAM, TAM2, TAM3, UTAUT, and UTAUT2).
  • EE → BIU
Effort expectancy synonym for perceived ease of use (PEOU), is a core construct of all five popular technology adoption models (Table 1), and PEU → BIU or EE → BIU is shared by four popular models (TAM2, TAM3, UTAUT, and UTAUT2).
  • SI → BIU
Social influence or subjective norm is the core component of four popular technology adoption models (Table 1), and SI → BIU or SN → IU is shared by four popular models (TAM2, TAM3, UTAUT, and UTAUT2).

3.3.2. The Shared Components of Many Educational Technology Adoption Models

Many studies have applied previous popular models with modifications to investigate educational technology adoption in many developing countries (Table 2). Common cause–effect links shared by popular technology adoption models were applied to investigate in-service and pre-service teachers’ adoption of educational technologies in education in many developing countries.
According to the literature above, the TAM and UTAUT2 components constitute the core constructs for most extended educational technology adoption models (Table 2). Applying the TAM and UTAUT components and their extensions TAM2, TAM3, and UTAUT to the ETADC assumes that the greater perception of educational technologies’ usefulness (performance expectancy) and ease of use (effort expectancy) by pre-service and in-service teachers have a greater impact on their positive attitudes toward using educational technology in their teaching–learning. In addition, the availability of devices, infrastructures, and training is a core determinant influencing the acceptance and effective adoption of educational technology. The positive social influence from peers or pioneering users (competitive pressure) and the price value of educational technology are more impactful on its acceptance and effective adoption.
a.
Performance expectancy
Performance expectancy, a synonym for perceived usefulness (PU), is a core component in all five popular technology adoption models (Table 1) and was applied by twenty-one studies, or 95.4% of studies, on education technology adoption in developing countries (Table 2). However, PE → BIU or PU → BIU was used in twenty studies, or 90.9% of studies.
Performance expectancy encompasses the technology curriculum’s relevance, trust, and relative advantages. It reflects users’ beliefs about how a technology will enhance their performance or productivity in the classroom. In educational settings, this translates to students’ expectations of improved learning outcomes or efficiency through the use of technology [14,18,48].
Multiple studies across different developing countries highlight the importance of performance expectancy:
  • Cloud-based collaborative learning technology in Malaysian universities [59];
  • In Jordan, performance expectancy was found to affect behavioral intentions to use Moodle, an e-learning system [26];
  • A study comparing Qatar and the USA found performance expectancy to be a significant predictor of behavioral intention in both samples [60];
  • In Nigeria, performance expectancy was determined to be a significant factor influencing the behavioral intention to use Canvas, an educational technology platform [27];
  • Research in Pakistan identified system characteristics, which are closely related to performance expectancy, as strong predictors of perceived usefulness in e-learning systems adoption [61];
Interestingly, while performance expectancy is consistently important, its relative impact may vary across different contexts. For instance, in Hong Kong, performance expectancy was found to be one of several key factors influencing adoption, alongside facilitating conditions and perceived usefulness [10].
In conclusion, performance expectancy plays a crucial role in educational technology adoption models for developing countries. It consistently emerges as a key factor influencing users’ intentions to adopt various e-learning systems and educational technologies. This underscores the importance of emphasizing the potential benefits and improved performance that these technologies can offer to students and educators in developing countries. Accordingly, the current study has postulated the following:
H1: 
Performance expectancy (PE) or perceived usefulness (PU) will significantly impact the identification and adoption of potential educational technologies in developing countries’ education settings.
b.
Effort Expectancy
Effort expectancy, a synonym for perceived ease of use (PEOU), is a core construct of all five popular technology adoption models (Table 1), and was applied by all twenty-two studies on education technology adoption in developing countries (Table 2). However, EE → BIU or PEU → BIU was used in seventeen studies, or 77.27%.
Effort expectancy relates to the perceived ease of use, another critical factor in technology adoption. For students and educators, the ease of learning and using new technology can significantly impact their willingness to adopt it [26]. Overall, the majority of the studies support the hypothesis that effort expectancy impacts the adoption of education technology, such as online learning adoption among university students in Bangladesh, ChatGPT adoption in higher education, educational metaverse platform adoption, Canvas adoption in a Nigerian higher education institution, and augmented reality (AR) in education [27,29,62,63]. The impact of effort expectancy in educational technology adoption models for developing countries is generally positive, but its significance varies across studies.
In the context of e-learning systems, effort expectancy has been found to significantly affect behavioral intentions to use such systems. For instance, a study on Moodle adoption at a public university in Jordan found that effort expectancy positively influenced students’ intentions to use the e-learning platform [26]. This suggests that when users perceive a technology as easy to use, they are more likely to adopt it.
Accordingly, the current study has postulated the following:
H2: 
The effort expectancy (EE) or perceived ease of use (PEOU) will significantly impact the identification and adoption of potential educational technologies in developing countries’ education settings.
c.
Social Influence
Social Influence or subjective norm is the core component of four popular technology adoption models (Table 1). It was applied in only fourteen studies, or 63.63%, on education technology adoption in developing countries (Table 2). SI → BIU was used in only twelve studies, or 54.5%.
Social influence and institutional pressures play a significant role in shaping users’ intentions to adopt technology in educational settings. The opinions and behaviors of peers, instructors, and institutions can influence individual adoption decisions [26,29,64,65]. Additionally, sociocultural factors, such as social networks, hierarchical structures, tribal affiliations, and language, impact the adoption of technology among the Maasai people in rural Tanzania, emphasizing the importance of considering cultural implications for successful technology adoption.
In addition, cultural specificity substantially affects the adoption of open educational resources (OER) across different countries. For instance, in Korea, performance expectancy was the strongest determinant, while in Japan, social influence played a more significant role [57].
In Yemen, tribal culture negatively impacts cloud computing adoption in higher educational institutions and moderates the relationship between various factors and adoption [66].
In conclusion, cultural factors significantly influence educational technology adoption models in developing countries, affecting various aspects such as social influence, performance expectations, and organizational readiness. Understanding these cultural nuances is crucial for policymakers and practitioners to develop effective strategies for implementing educational technologies in diverse cultural contexts [6,27,67].
Furthermore, this research underscores the need to address cultural variables in technology adoption models, as cultural characteristics are key influencers in the acceptance and use of technology in non-Western countries [35].
H3: 
The cultural and societal factors of social influence and competitive pressures will significantly impact the identification and adoption of potential educational technologies in developing countries’ education settings.

3.3.3. Special Links in the ETADC Model for Considering the Context of Developing Countries’ Education Settings

While various technology adoption models exist (Table 1), they often fail to address the complexities of educational technology adoption, especially in developing countries. These models typically overlook the unique challenges and the broader socio-organizational and cultural factors that influence the acceptance of educational technology. To address these shortcomings, we propose the ETADC model, which emphasizes two key aspects. First, it should include cause–effect relationships relevant to the technology selection process, and second, it should focus on the effective implementation of technology in developing countries. This approach considers the specific context of education in these regions.
a.
Facilitating Conditions
Facilitating conditions, referring to the availability of required devices, infrastructures, and training, is a core construct of two popular technology adoption models (the UTAUT and UTAUT2) (Table 1) and was applied by thirteen studies (59%) on education technology adoption in developing countries (Table 2). FC → BIU was used in eleven studies (50%). However, they were not considered when building the current ETADC model because it has been postulated that FC does not directly impact the adoption of education technology, although it impacts it through EE.
First, facilitating conditions (FC), which includes access to necessary devices, infrastructure, and training, is a key element in technology adoption models such as the UTAUT and UTAUT2 (Table 1). While thirteen studies, or 59%, on educational technology adoption in developing countries focus on FC, and all twenty-two studies focused on EE, only two studies, or 9%, examine the direct effects of FC on EE (Table 2). Facilitating conditions significantly influence the actual usage and adoption of educational technologies in developing countries. In a study of e-learning system adoption at a Jordanian university, facilitating conditions had a direct impact on students’ use of the Moodle platform [26]. Similarly, research on Canvas adoption in Nigeria found facilitating conditions to be a salient factor positively influencing actual usage by students [27]. Facilitating conditions are a critical factor in educational technology adoption models for developing countries, directly influencing actual usage and adoption. However, their impact may differ from developed countries, emphasizing the need for context-specific approaches when implementing educational technologies in developing nations. Factors such as infrastructure, technical support, and resource availability should be carefully considered to enhance technology adoption in these settings.
This study proposes that FC influences effort expectancy and ease of use, ultimately affecting the acceptance and adoption of educational technology (FC → EE; EE → BIU).
In this study, we have integrated a new link pivoting on the technological pedagogical content knowledge (TPACK) framework. Teachers’ proficiency in the TPACK framework (Figure 2) is essential for successful technology integration, as it enhances their lesson planning and teaching [68]. Thus, while effort expectancy is vital for educational technology adoption, facilitating conditions provide necessary support for the effective implementation of new technologies [26]. Adequate infrastructure, resources, institutional support, and training are critical for successfully teaching with technology, which encompasses the TPACK framework.
The TPACK framework describes the knowledge that teachers need to effectively teach with technology. It aims to articulate the essential knowledge that educators must possess to effectively integrate technology into their teaching practices. The concept of technological, pedagogical, and content knowledge, commonly known as TPACK, is a comprehensive framework developed by the educators Punya Mishra and Matthew Koehler [68].
TPACK encompasses three primary components that together support teachers in delivering engaging and effective teaching–learning experiences that leverage technology to enhance student understanding and achievement.
  • Content knowledge (CK) refers to the specific subject matter that teachers must be well-versed in. This involves a deep understanding of the concepts, inquiries, and skills related to the discipline being taught, whether it be mathematics, science, literature, or any other field.
  • Pedagogical knowledge (PK) pertains to the instructional methods and strategies that teachers use to facilitate learning. This includes knowledge about how students learn, understanding various teaching approaches, and the ability to adapt their methods to meet diverse student needs.
  • Technological knowledge (TK) involves an understanding of how to use various technologies effectively in educational settings. This includes familiarity with digital tools, applications, and resources that can enhance teaching and learning experiences.
The interplay among these three types of knowledge is crucial. TPACK highlights the importance of not only understanding each domain individually but also recognizing how they intersect. For example, a teacher must know how to use a specific technology (TK) to teach a particular concept (CK) while also applying effective pedagogical strategies (PK) to engage students and maximize their learning outcomes. This holistic approach empowers educators to create enriched and meaningful learning experiences that prepare students for a technology-driven world.
While effort expectancy is often considered an important factor in technology adoption models, its impact can vary depending on the specific technology and context. For educational technology in developing countries, it generally has a positive influence, but its significance may be moderated by other factors such as performance expectancy, facilitating conditions, and cultural or contextual elements. Therefore, while designing educational technology for developing countries, it is crucial to consider effort expectancy alongside other relevant factors to ensure successful adoption and implementation.
Accordingly, the current study has postulated the following:
H4: 
Facilitating conditions (FC) has a positive and significant impact on effort expectancy (EE) by improving teachers’ TPACK and teachers ‘capability, leading to the acceptance and use of educational technologies in developing countries’ education settings.
Second, social influence or subjective norm is the core component of four popular technology adoption models (Table 1) and was applied by fourteen studies (63.6%) on education technology adoption in developing countries (Table 2). EE was applied by all twenty-two studies. However, SI → PEU or SI → EE was used in only one study (4.5%). Many previous studies have postulated that SI → BIU. In this study, we have added this new link (SI → EE), postulating that cultural and societal factors and competitive pressure strongly impact effort expectancy and the perceived ease of use of new educational technology. According to Al-Rahmi and his coworkers, social influence (SI) often interacts with effort expectancy (EE) to influence users’ behavioral intentions in various studies, such as the adoption of social media as educational technology among university students in Malaysia and cloud classroom acceptance [69]. Accordingly, the current study has postulated the following:
H5: 
Cultural and societal factors, social influence, and competitive pressures will impact the expected effort when using educational technologies in developing countries’ education settings.
b.
Price Value
Third, price value is a recent core concept in the UTAUT2 technology adoption model that has been previously overlooked in older models (Table 1). It has been applied in only 27.3% of studies on education technology adoption in developing countries (Table 2). This study highlights the importance of price value in the ETADC model, as cost-effectiveness heavily influences technology acceptance in these regions. Understanding price value is essential for assessing whether the benefits of technology justify its costs, impacting adoption intentions. For educational institutions and policymakers, addressing price value can improve technology adoption through subsidies or clear value propositions [35]. High equipment costs and additional expenses, such as Internet subscriptions, are significant barriers to e-learning in South African public schools, emphasizing the critical role of affordability in technology adoption [70,71,72]. Hence, the current study has postulated the following:
H6: 
Price value impacts technology acceptance and adoption in developing countries’ education settings.

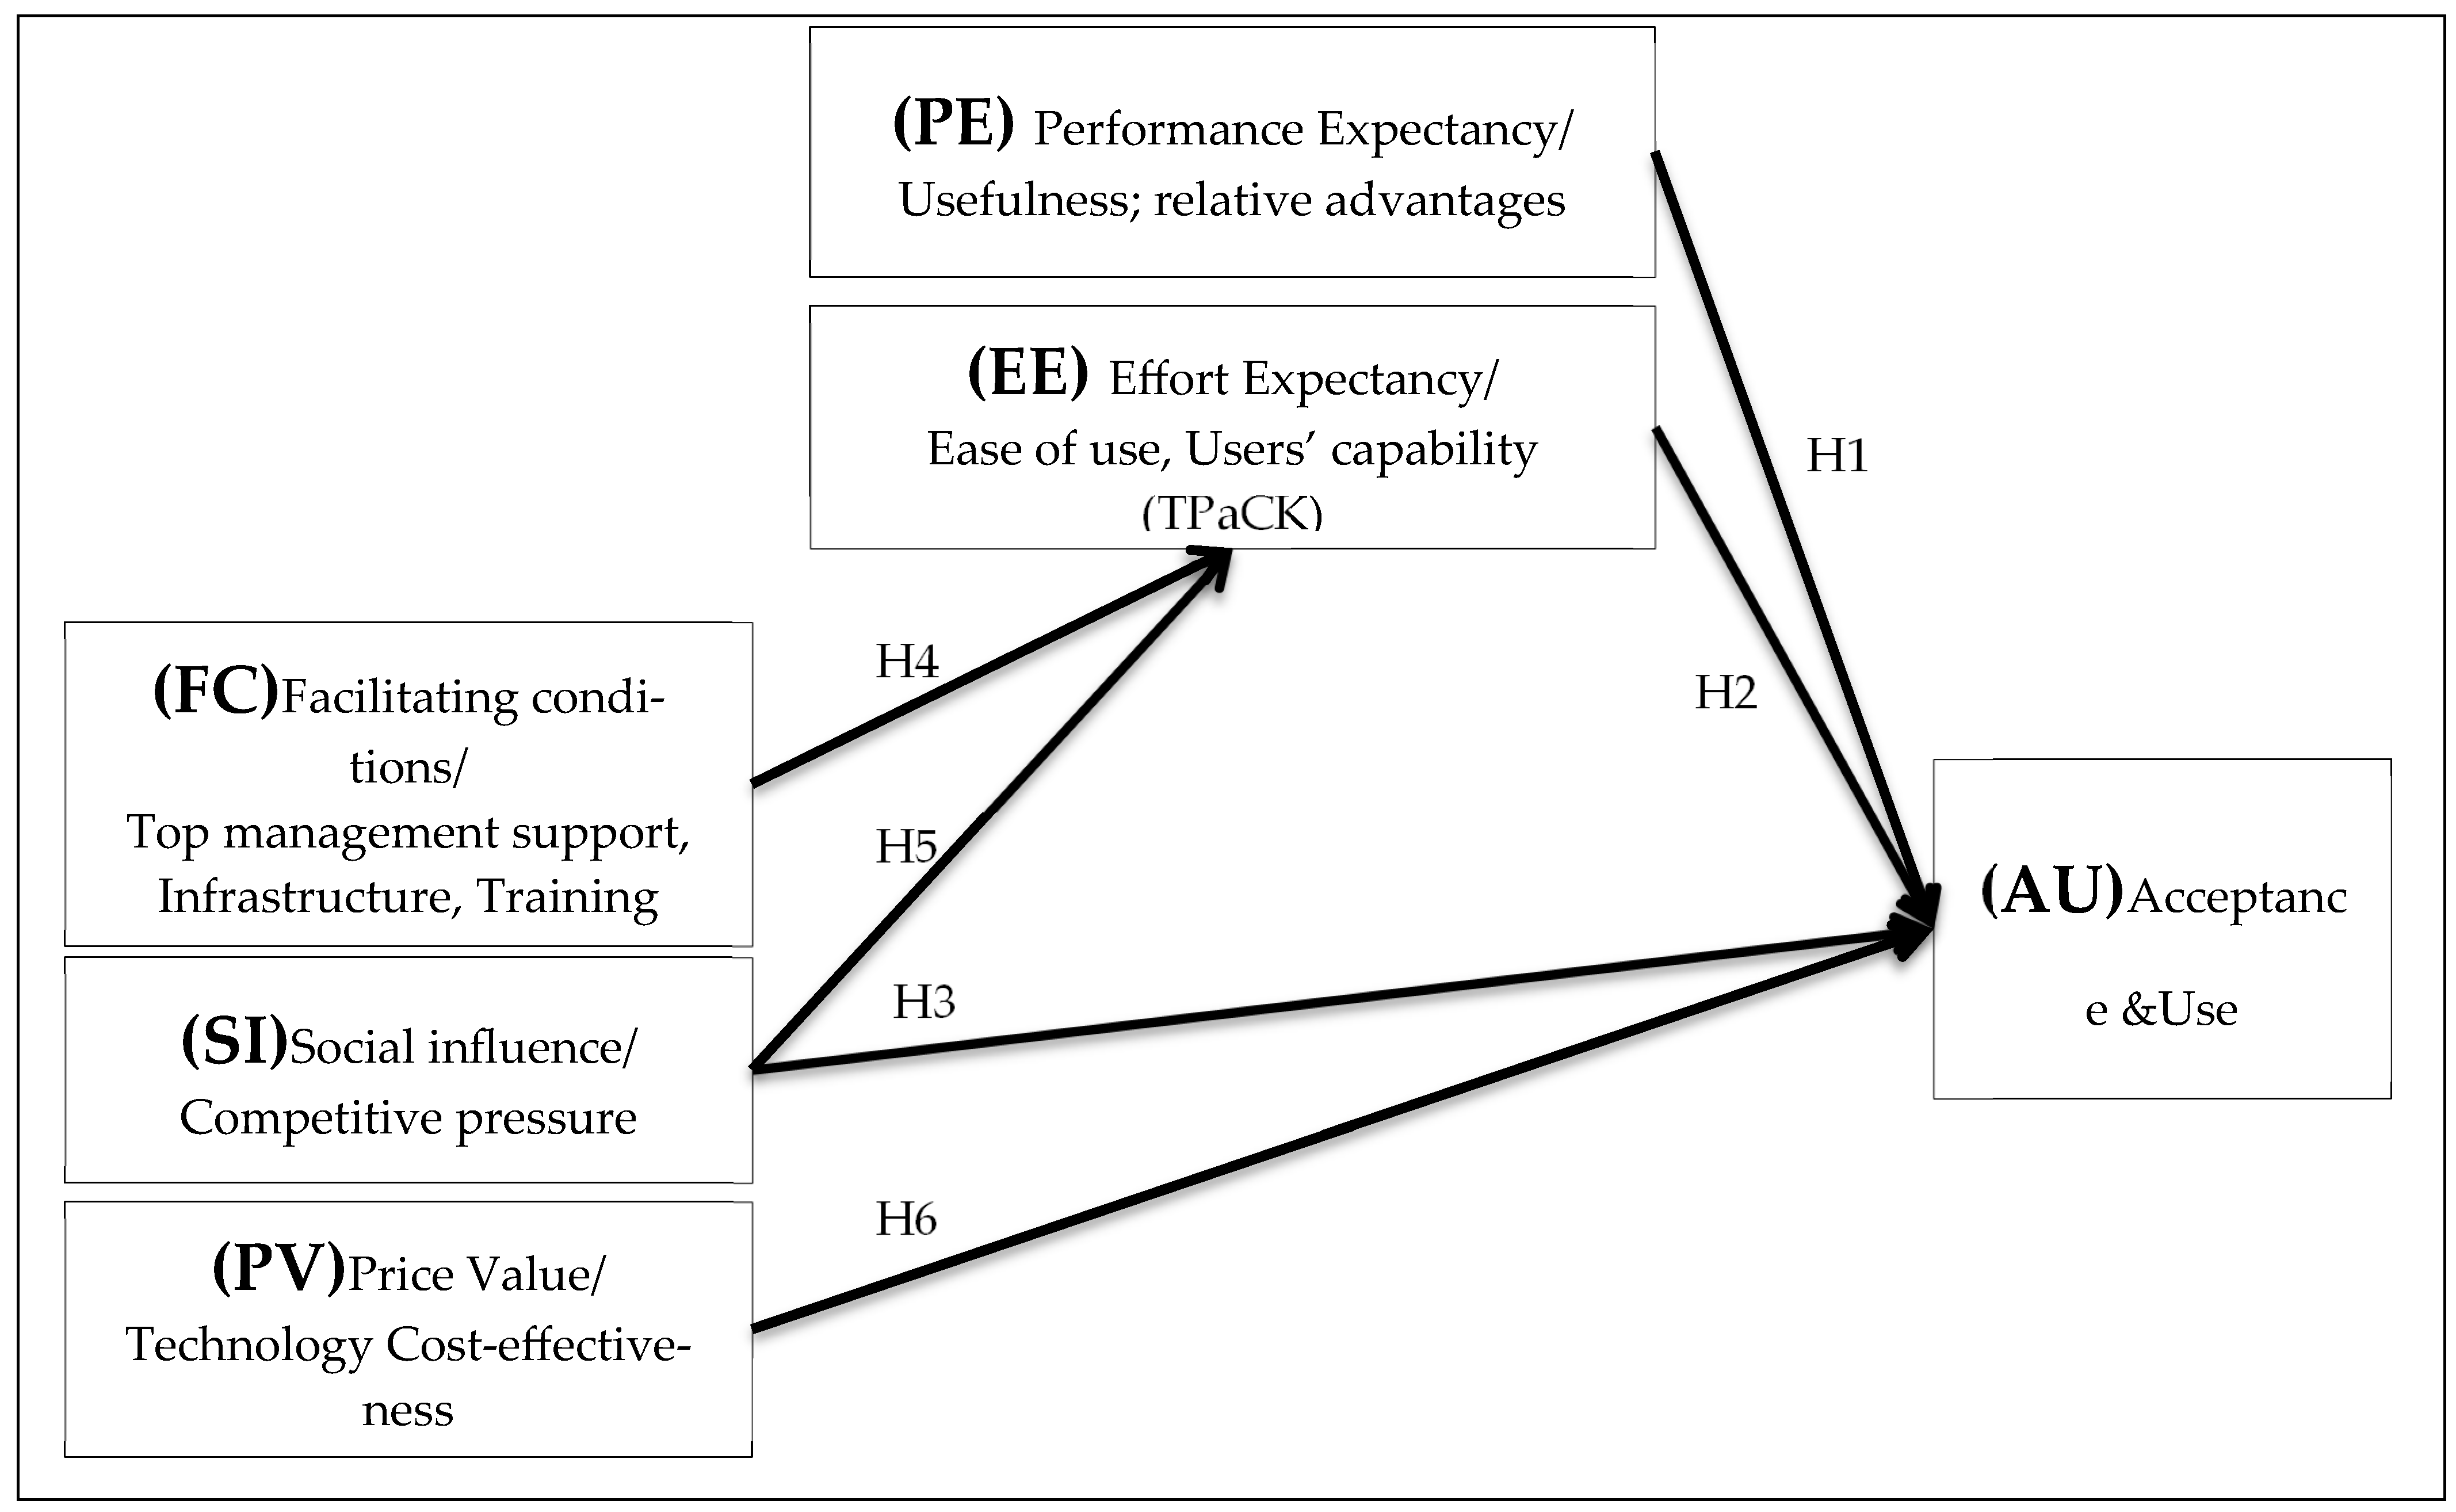
3.4. ETADC Model Structure

After identifying the model components and cause–effect links in the above sections, we have built an educational technology adoption for developing countries (ETADC) model (Figure 3).
This section presents a comprehensive response to the second research question, which focuses on the development of a model specifically tailored for the adoption of educational technology in developing countries. It explores the unique challenges and opportunities that these regions face in integrating technology into their educational systems. Furthermore, it outlines potential strategies for stakeholders, including governments, educational institutions, and technology providers, to collaborate effectively in creating an adaptable framework that promotes sustainable and equitable educational technology usage in these contexts. In addition, in the following sections, the model has been validated through empirical studies in the target countries to ensure its applicability and effectiveness. This is why meta-analytic and two-stage structural equation modeling was applied to validate the developed ETADC model.

4. Validation of the Developed Educational Technology Adoption for Developing Countries (ETADC) Model Through Meta-Analytic and Structural Equation Modeling (MASEM)

To evaluate the validity and generalizability of the educational technology adoption for developing countries (ETADC) model (Figure 3), this study used meta-analytic structural equation modeling (MASEM). This method synthesizes data from multiple studies, accounts for measurement error, and assesses overall model fit. MASEM combines meta-analysis and structural equation modeling, similar to the work of Cheung and Hong, to test hypothesized models effectively [73].

4.1. Selection of Studies for Meta-Analysis and Dataset Preparation

To conduct rigorous multilevel meta-analysis of structural equation modeling (MASEM), it is essential to gather specific data. The minimum requirement consists of correlation or covariance matrices, alongside the corresponding sample sizes for each study included in the analysis. It is important to note that some missing variables are permissible [73], allowing for a broader inclusion of relevant studies. A comprehensive systematic search was carried out to identify pertinent studies published between January 2019 and June 2024. This search spanned nine prominent journals in the field of educational technology indexed on SCOPUS. The selected journals include notable publications such as Education and Information Technologies, the British Journal of Educational Technology, and Computers and Education. During the search, a set of targeted keywords was utilized, including phrases such as “educational technology”, “EduTech”, and “technology adoption”, as well as various related factors, ensuring a thorough exploration of the literature.
A comprehensive review was conducted involving a total of one hundred publications. Out of these, 71 specifically examined the theme of technology adoption within educational settings, highlighting various approaches, challenges, and outcomes associated with integrating technology into teaching and learning processes. Additionally, 48 of the reviewed publications included correlation or covariance matrices, offering valuable statistical insights into the relationships between different variables related to educational technology. After a thorough evaluation of the methodologies and relevance of these studies, 30 publications were ultimately selected as suitable and eligible for inclusion in this meta-analysis.
These studies were mainly focused on investigating in-service university teachers (N = 54) in Bangladesh and Nigeria, exploring the factors affecting the behavioral intention to use Google Classroom [58]; investigating pre-service teachers (university students, N = 537) in Jordan on the determinants of Gen Z’s metaverse adoption decisions in higher education [37]; investigating pre-service teachers (university students N = 365) in Thailand on exploring the drivers for the adoption of metaverse technology in engineering education [38]; investigating pre-service teachers (university students N = 574) in Jordan to predict university students’ intentions to use metaverse-based learning platforms [39]; investigating in-service teachers and pre-service teachers (university students N = 306) in Greece on the mobile augmented reality acceptance model for teachers and future teachers [40]; investigating in-service teachers, pre-service teachers (university students N = 329), and IT in India on the adoption of artificial intelligence in higher education [41]; investigating university in-service teachers (N = 167) in Taiwan on teachers’ adoption of MOOCs [43]; investigating 629 university in-service teachers and IT staff in Poland on the acceptance and use of ChatGPT 3 and 4 in the academic community [44];Investigating pre-service teachers (university students N = 352) in Taiwan on the potential adverse effects of virtual reality-based learning system usage [48]; investigating pre-service teachers (university students N = 218) in Turkey to understand university students’ behavioral intention to use Edmodo LMS [49]; investigating pre-service teachers (university students N = 194) in Canada on the key drivers of student acceptance of online labs [51]; Investigating pre-service teachers (N = 58) in China on the acceptance of technology and achievement of chatbots for learning Chinese [52]; investigating pre-service teachers (university students N = 207) in the United Emirates on student acceptance of an academic advisor chatbot in higher education institutions [53]; investigating pre-service teachers (university students N = 223) in Spain on student acceptance of virtual laboratory and practical work [54]; investigating pre-service teachers (university students N = 134) in China on understanding learners’ acceptance of high-immersion virtual reality systems [55].
To visually represent the selection process of these studies, a flowchart (Figure 4) has been created, detailing each step taken in identifying and refining the studies included in the final analysis. This flowchart serves as an illustrative guide to understanding the methodology employed in selecting the studies for this systematic review.
The synthesis of correlation matrices can be challenging due to varying numbers of variables across studies. Two common methods for handling missing data are listwise deletion, which includes only studies with all variables, and pairwise deletion, which allows for the inclusion of all available studies [73].
This study utilized pairwise deletion, focusing on studies with at least three correlations across variables. Following this process, 30 studies (Table 3) were eligible for correlation-based meta-analytic structural equation modeling.

4.2. Data Analysis Using Two-Stage Structural Equation Modeling

In this study, the model was analyzed in R Studio version 4.4.0 using the METASEM package with Two-Stage Structural Equation Modeling (TSSEM) by combining data from multiple previous studies (Table 3) by following these steps presented in Figure 5.
MASEM enhances the sample size and provides robust estimates of variable relationships, accounting for variations in effect sizes. The two-stage approach offers greater flexibility and superior performance over univariate methods [82].
TSSEM integrates meta-analytic techniques and SEM, allowing for more reliable inferences from complex datasets. A pooled correlation matrix is used to incorporate study heterogeneity, especially with random-effects models [73].
In the first stage, correlations from 30 primary studies were combined into a pooled correlation matrix, enhancing statistical power and the generalizability of results. This matrix (Table 4) is vital as it consolidates information from independent studies for a more comprehensive analysis [83].
Pooled correlation matrices (Table 4) address small sample size issues in individual studies, enhancing statistical power and generalizability. Serving as a crucial input for the second stage of MASEM, the pooled matrix synthesizes relationships across 30 studies (Table 3), enabling the analysis of overall patterns and testing of theoretical models, as described by Jak and Cheung [73].
Following the theoretical framework, a regression model was run using the Lavaan package for model fitting and hypothesis testing.
The structural equation model (SEM) was fitted to the pooled data using weighted least squares estimation, with the pooled correlation matrix as the observed covariance matrix. The model featured six paths aligned with the hypotheses, and the β coefficients, along with standard errors, were derived from this analysis (Figure A1 in Appendix A). MASEM provided model fit estimates and regression coefficients with confidence intervals through the metaSEM package. Results, including z-statistic approximations and corresponding p-values, are detailed in Appendix A, Table A2.

4.3. Interpretation of Results and ETADEC Model Validation

To validate the structural equation model, it is required to follow these steps:
  • First, check the model fit: evaluate the overall model fit using indices such as RMSEA (root mean square error of approximation), SRMR (standardized root mean squared residual), CFI (comparative fit index), and TLI (Tucker–Lewis’s index);
  • Second, assess the explanatory power of the model (R2);
  • Third, assess the path coefficients (β) to ensure that the significance and strength of path coefficients align with theoretical expectations.

4.3.1. ETADEC Model Fit Assessment

After fitting a linear regression model, how well it fits the data must be determined. In this study, goodness-of-fit indices, including the RMSEA, SRMR, TLI, and CFI, which are four common fit measures, were rigorously calculated (Table A3 in Appendix A). Goodness-of-fit indices (GOFI) are essential in meta-analytic structural equation modeling (MASEM) for several reasons. Firstly, they help assess how well a proposed structural equation model fits the meta-analytic data. They provide a quantitative measure of the model’s ability to explain the observed relationships between variables across multiple studies. The GOEI results were crucial for evaluating model validity and conformity, validating the theoretical model, and ensuring that the MASEM results accurately represent the synthesized data from various studies on adopting education technologies.
SEM (structural equation modeling) data were interpreted and reported using the evaluation of the overall appropriateness of the model and summarizing the model fit indices, such as the RMSEA, SRMR, CFI, and TLI, presented in Table 5. A good model fit is considered adequate if the root mean square error of approximation (RMSEA) is <0.05, with zero indicating a perfect fit. In our educational technology adoption for developing countries (ETADC) model, the RMSEA is 0.0387, indicating a good fit. The standardized root mean square residual (SRMR) also supports this with a value of 0.0476, suggesting a good model. The comparative fit index (CFI), which ranges from 0 to 1, with a good fit being CFI ≥ 0.95, shows a value of 0.9916 for our model, indicating a good fit as well. Finally, the Tucker–Lewis index (TLI) is 0.9578, meeting the threshold for a good fit.
Overall, the ETADC model has been found to fit well with the data, which highlights its appropriateness and validity. In conclusion, all model fit indices, such as the RMSEA, SRMR, CFI, and TLI, were found to be appropriate, which indicates good model fit.

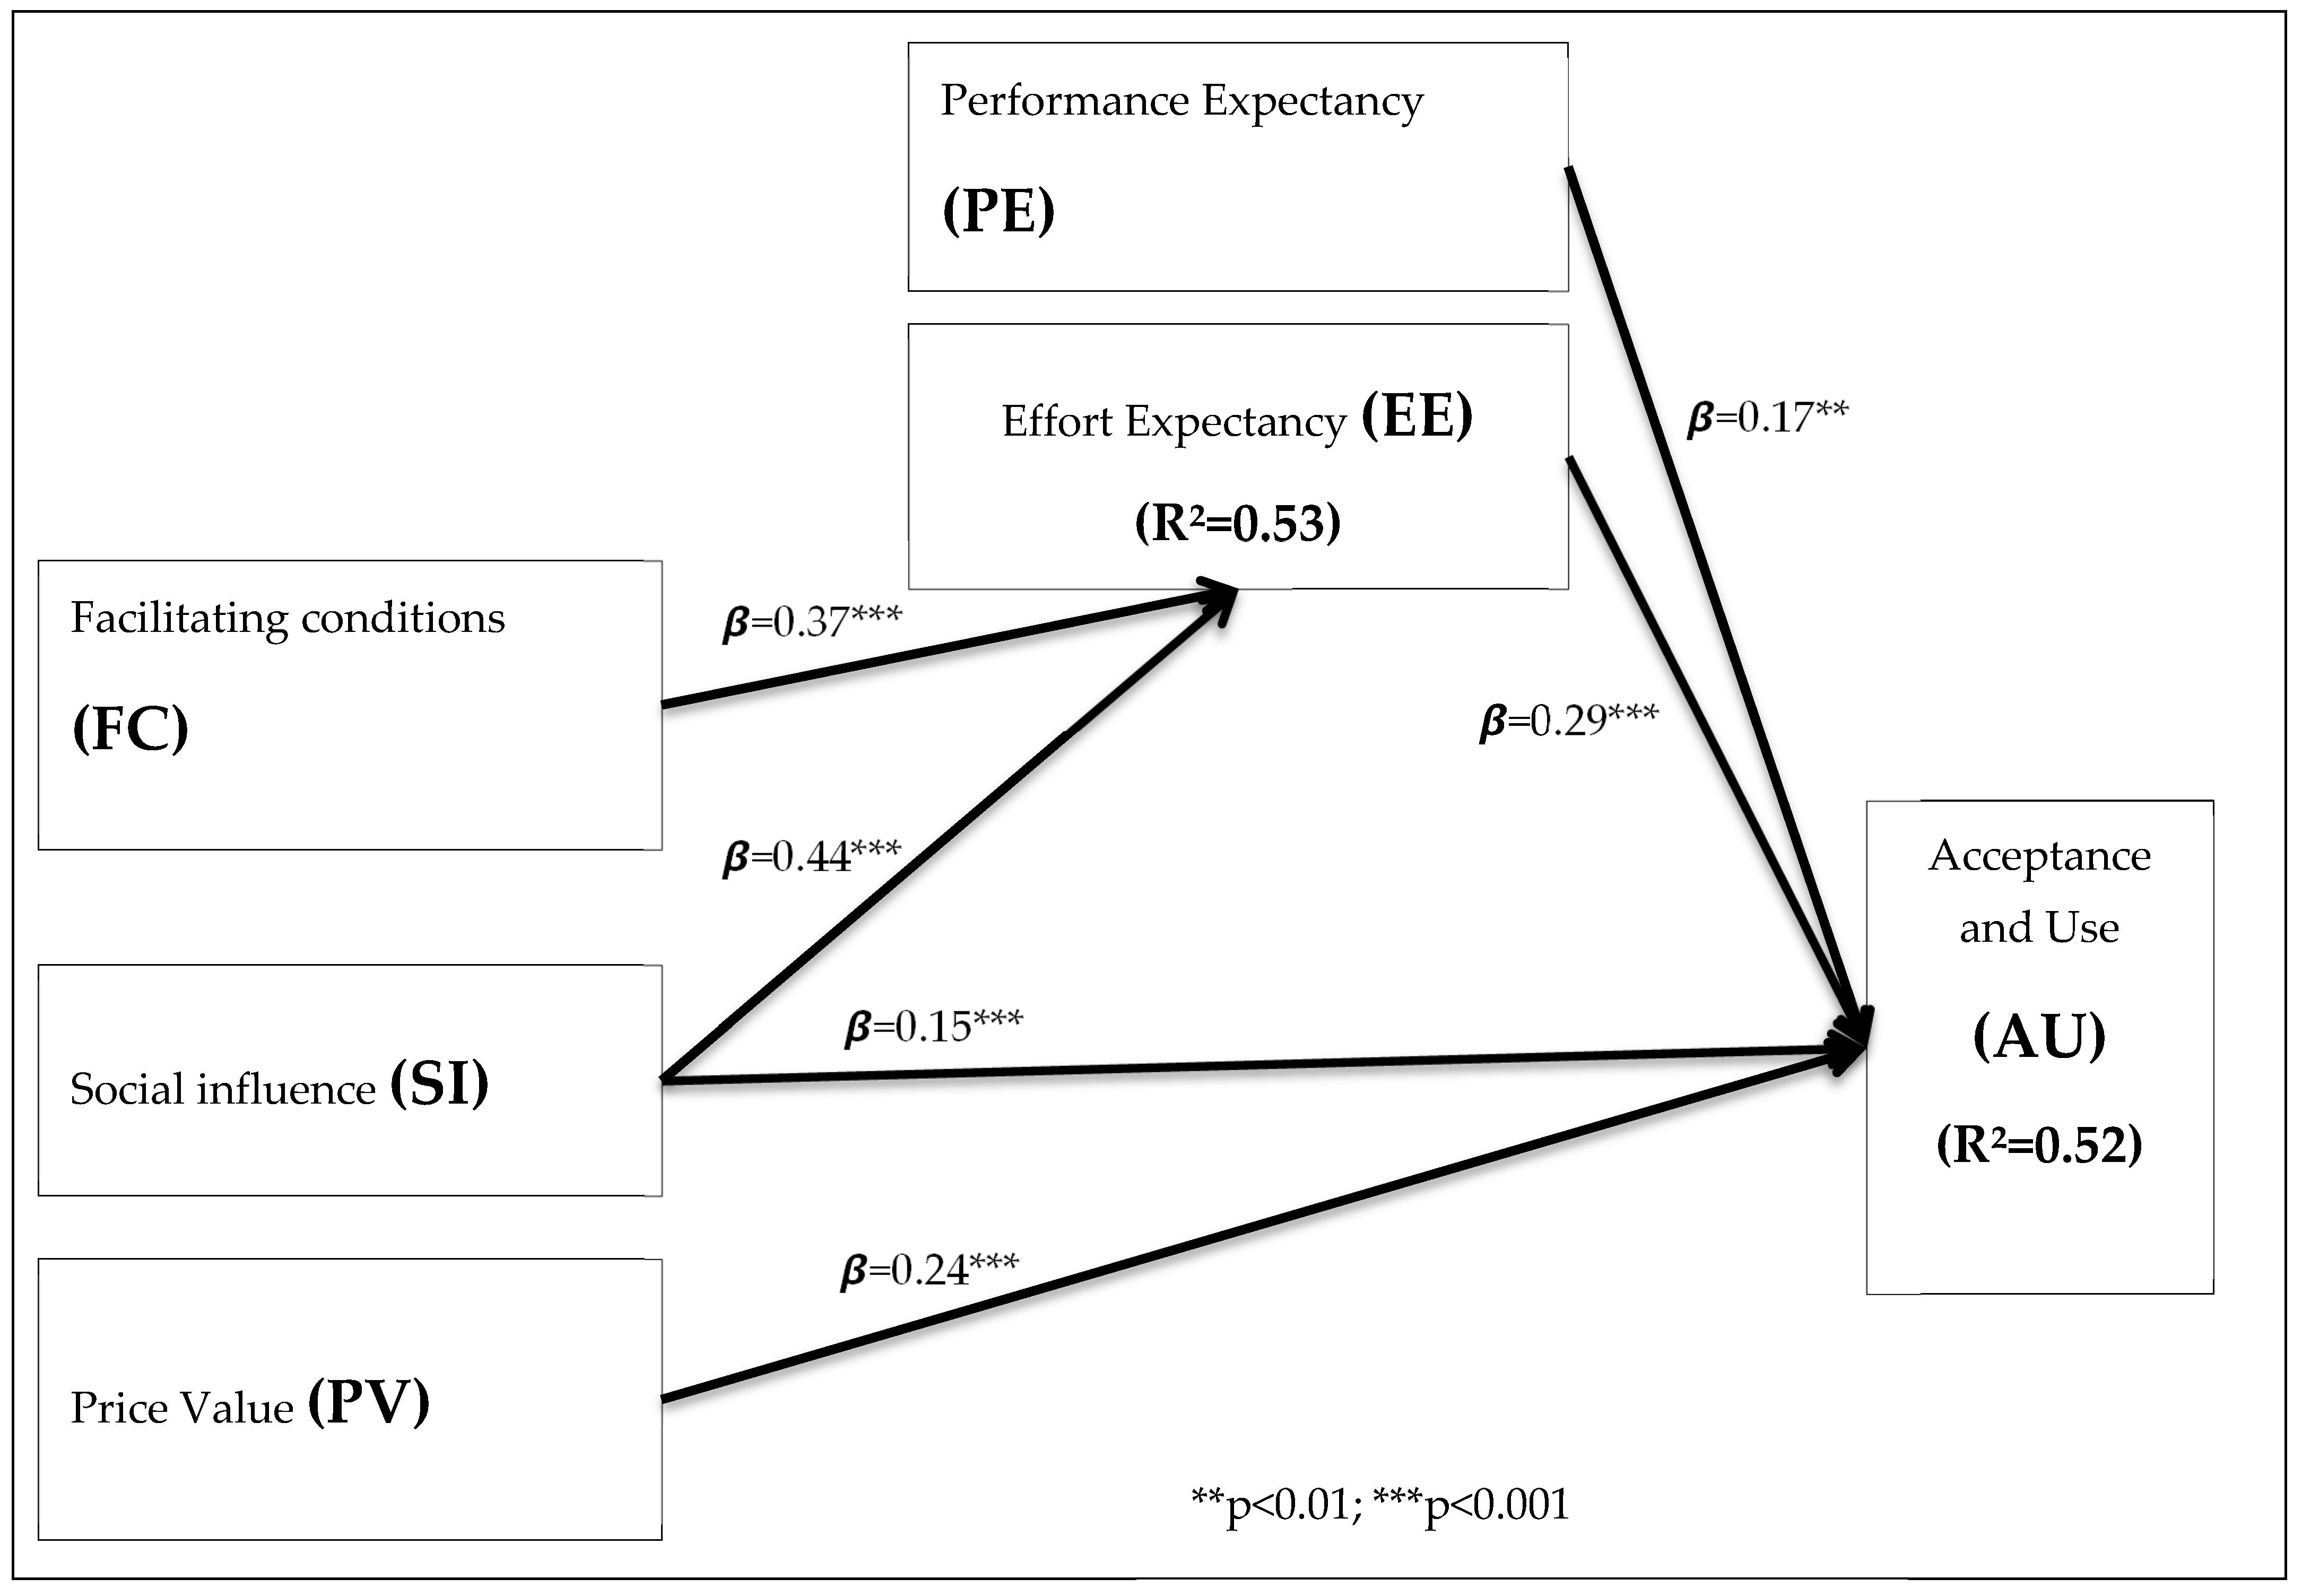
4.3.2. Assessment of the ETADC Model’s Explanatory Power (R2)

R-squared (R2) measures the strength of the relationship between a model and the dependent variable on a scale of 0 to 100%. It indicates the percentage of variance in the dependent variable explained by the independent variables. In this model, “acceptance and use” is the dependent variable influenced by performance expectancy (PE), effort expectancy (EE), social influence (SI), and price value (PV). Conversely, EE acts as a dependent variable influenced by facilitating conditions (FC) and SI. The coefficients of determination (R2) on arrows connecting independent variables represent how much variance in the dependent variable is explained by the independent variables. An R2 between 0.10 and 0.50 is acceptable if most explanatory variables are significant, while an R2 of 0.50 to 0.99 is preferable. An R2 below 0.10 is deemed unacceptable, and if R2 equals 0, the dependent variable cannot be predicted from the independent variables [85].
In this model, the results in Table 6 and Figure A1 in Appendix A show performance expectancy, social influence, facilitating conditions, and price value, which are the independent variables, whereas effort expectancy and acceptance and use are dependent variables. The R2 for EE is 0.53, indicating that FC and SI explain 53% of the variance in EE, while the R2 for acceptance and use is 0.52, meaning that EE, PE, SI, and PV explain 52% of the variance in the acceptance and use of education technologies.
In conclusion, according to the results of the coefficient of determination of the model’s dependent variables, the ETADC model shows high explanatory power.
The ETADC model explains 53% of the variance in effort expectancy and 52% of the variance in the acceptance and use of education technologies.

4.3.3. Assessment of the ETADC Model’s Path Coefficients (β)

Path coefficients (β) and p-values are used to assess the relationships between variables, highlighting significant paths. A predictor and response variable have a statistically significant relationship if the p-value is below α = 0.05 (95% confidence). Path coefficients range from −1 to +1, with values closer to ±1 indicating stronger relationships. Generally, coefficients above 0.1 indicate small effects, coefficients above 0.3 indicate medium effects, and coefficients above 0.5 indicate large effects, although these thresholds can vary by field. This study proposes several hypotheses: H1 suggests that performance expectancy (PE) significantly impacts the adoption of educational technologies, which is confirmed by β = 0.17; p < 0.01. H2 posits that effort expectancy (EE) significantly influences this adoption, supported by β = 0.29; p < 0.001. H3 states that SI significantly affects adoption, supported by β = 0.15; p < 0.001. H4 argues that facilitating conditions (FC) positively affect EE, confirmed by β = 0.37; p < 0.001. H5 indicates that social influence (SI) significantly impacts EE, with results showing β = 0.44; p < 0.001. Lastly, H6 suggests that price value (PV) also considerably affects the adoption of educational technologies, confirmed by β = 0.24; p < 0.001. Accordingly, the effects of the six paths of the model, which represent its six hypotheses, were found to be significant (Table 7 and Figure 6).
Figure 6 shows the validated educational technology adoption for developing countries (ETADC) model after the hypothesis testing results.
Statistical significance levels are indicated by asterisks: two asterisks (**) for p < 0.01, and three asterisks (***) for p < 0.001. A p-value of 0.01 or lower indicates statistical significance, with lower values suggesting stronger results. For this study, hypotheses H2, H3, H4, H5, and H6 showed p-values less than 0.001, while H1 had a p-value less than 0.01, indicating significant and supported results for both.

4.3.4. The ETADC Model’s Innovativeness

When comparing the developed educational technologies adoption for developing countries (ETADC) model to earlier models such as the technology acceptance model (TAM), the unified theory of acceptance and use of technology (UTAUT), and their various extensions, it becomes evident that the ETADC model provides a more contextually relevant and innovative approach tailored for educational environments. This is particularly significant for developing countries, where unique socioeconomic and cultural factors can greatly influence technology adoption in education. Table 8 highlights these differences and emphasizes the specific aspects in which the ETADC model excels, shedding light on its applicability and effectiveness in addressing the challenges faced in these regions.
The model developed for the adoption of educational technologies in developing countries underwent a rigorous validation process, which confirmed its effectiveness and innovative features in comparison to earlier models. This validation not only highlights the practical applicability of the model but also addresses the third research question posed in this study. By showcasing its unique attributes and improvements over existing frameworks, the model provides a significant contribution to the understanding of how educational technologies can be more effectively integrated into the educational systems of developing nations.

4.3.5. Practical Application of the ETADC Model

The ETADC model was applied to evaluate some educational technologies. The ETADC components, categorized into technological, individual, and organizational factors, are used in this study to evaluate educational technologies for developing countries. The stages include the following:
  • Performance expectancy (PE): a technological factor, similar to perceived usefulness, that helps identify suitable education technology by analyzing features;
  • Price value (PV): a technological factor essential when considering technology purchases;
  • Facilitating conditions (FC): a factor that pivots on the availability of devices, resources, and infrastructure, including top management support and expertise, and is crucial for successful technology adoption through effort expectancy (EE);
  • Effort expectancy (EE): a factor that pivots on users’ capability and is impacted by FC and SI;
  • Social influence (SI): A significant sociocultural factor impacting both technology identification and adoption processes.
The data have been extracted from the Google Play Store, App Store, and Huawei Store, which are key markets for educational technologies. These technologies, recognized as mature according to the 2023 Gartner hype cycle, align with educational needs to effectively achieve academic goals. They enhance engagement and promote personalized learning, creativity, critical thinking, and problem-solving skills through interactive and immersive experiences. Additionally, they reduce costs associated with traditional methods, improve accessibility to resources, support student-centered and inclusive education, and ultimately lead to better learning outcomes and preparation for a technology-driven future.
Using the data above in Table 9, the evaluation was conducted following the guide below (created for this study):
The scores range from 1 to 5 stars:
Sustainability 17 03592 i001
Step 1: Performance expectancy (PE)
PE1: Is this technology developed for educational Purposes?
There are 33 types of categories of technologies; we are interested in educational technologies. However, some tools or business technologies can be used for educational purposes; hence, scores are given according to the following guide:
  • 5 stars if the technology is designed for educational purposes;
  • 4 stars if the technology is developed as a tool that can be applied for educational purposes;
  • 3 stars if the technology is designed for business purposes and can be applied to education;
  • 2 stars if the technology is designed for entertainment but can be applied for educational purposes;
  • 1 star if the technology is designed for lifestyle or other purposes but can be applied for educational purposes.
PE2: What are the key features offered by these educational technologies?
Through interactive and immersive experiences, educational technologies can enhance engagement, promote personalized learning, promote creativity, promote critical thinking, and promote problem-solving skills.
Hence, scores are given according to the following guide:
  • 5 stars if the educational technology can offer at least five or more features;
  • 4 stars if the educational technology can offer at least four features;
  • 3 stars if the educational technology can offer at least three features;
  • 2 stars if the educational technology can offer at least two features;
  • 1 star if the educational technology can offer at least one feature.
Step 2: Price value (PV)
Is this technology affordable?
Technology is more accepted in developing countries if it is affordable; hence, scores are given according to the following guide:
  • 5 stars if the educational technology is accessible for FREE or USD 0 (pricing per item);
  • 4 stars if the educational technology is accessible for between USD 1–20 (pricing per item);
  • 3 stars if the educational technology is accessible for between USD 20–50 (pricing per item);
  • 2 stars if the educational technology is accessible for between USD 50–100 (pricing per item);
  • 1 star if the educational technology is accessible for USD 100 or more (pricing per item).
Step 3: Facilitating conditions (FC)
FC1: What kinds of devices are supported by this technology?
Some technologies are supported by smartphones, computers, Android tablets, iPads, iPhones, iTouches, and other devices; Hence, scores are given following the following guide (created by the author):
  • 5 stars if the educational technology is available for five or more types of devices;
  • 4 stars if the educational technology is available for four types of devices;
  • 3 stars if the educational technology is available for three types of devices;
  • 2 stars if the educational technology is available for two types of devices;
  • 1 star if the educational technology is available for one type of device.
FC2: What is the size of this technology?
The size of educational technology impacts its acceptance; technology with the smallest size is preferred. Hence, scores are given following the guide below:
  • 5 stars if the download size of the educational technology is below 50 MB;
  • 4 stars if the download size of the educational technology is between 50 MB and 100 MB;
  • 3 stars if the download size of the educational technology is between 100 MB and 150 MB;
  • 2 stars if the download size of the educational technology is between 150 MB and 199 MB;
  • 1 star if the download size of the educational technology is 200 MB or above.
Step 4: Effort expectancy (EE)
Is this educational technology easy to use? How many users are already using this educational technology?
The number of users (downloads) indicates that the technology has been selected for use or purchased, users have the required devices to use it, and its ease of use; hence, scores are given following the below guide:
  • 5 stars if the educational technology has above 100 M downloads;
  • 4 stars if the educational technology has 10 M+ to 100 M downloads;
  • 3 stars if the educational technology has 100 K+ to 10 M downloads;
  • 2 stars if the educational technology has 50 K to 100 K downloads;
  • 1 star if the educational technology has below 50 K downloads.
Step 5: Social influence (SI1)
SI1: How mature is this educational technology?
Technology maturity is evaluated according to the Gartner cycle’s stages; Hence, scores are given following the below guide:
  • 5 stars if the educational technology has reached the plateau of productivity (the technology becomes widely accepted and integrated into regular use);
  • 4 stars if the educational technology has reached the slope of enlightenment (gradual understanding and practical applications of the technology begin to crystallize as more success stories emerge);
  • 3 stars if the educational technology has reached the trough of disillusionment (realization of the technology’s limitations, leading to disappointment and reduced interest);
  • 2 stars if the educational technology has reached the peak of inflated expectations (high expectations are fueled by hype and speculative success stories);
  • 1 star if the educational technology is still on the technology trigger (the initial emergence of the technology, generating interest and media buzz).
SI2: Is this technology approved by teachers?
Some technologies available on the market are not yet approved by teachers; hence, scores are given following the below guide:
  • 5 stars if teachers have approved the educational technology;
  • 0 stars if teachers have not yet approved the educational technology.
SI3: How many people have reviewed this technology?
A large number of reviewers of an educational technology indicates its dynamic consideration by users.
Accordingly, scores are given according to the guide below:
  • 5 stars if the educational technology has above 1 M reviews;
  • 4 stars if the educational technology has 100 K+ to 1 M reviews;
  • 3 stars if the educational technology has 50 K to 100 K reviews;
  • 2 stars if the educational technology has 10 K to 50 K reviews;
  • 1 star if the educational technology has below 10 K reviews.
SI4: How high is the educational technology’s rating on the technology store market?
On the educational technologies market store, users review technologies and provide ratings. Hence, scores are given regarding their ratings.
  • 5 stars if the educational technology is rated 4.5 stars and above;
  • 4 stars if the educational technology is rated 3.5 to 4.4 stars;
  • 3 stars if the educational technology is rated 2.5 to 3.4 stars;
  • 2 stars if the educational technology is rated 1.5 to 2.4 stars;
  • 1 star if the educational technology is rated 1.4 stars and below.
The summary of the results is given in Table 10. All eleven educational technologies have a good score between 3.8 stars and 4.8 stars, while the maximum score is 5 stars. The evaluated educational technologies were found to be suitable for further adoption in developing countries.

5. Research Implications and Conclusions

This study applied a meta-analysis combined with structural equation modeling (MASEM) using the two-stage structural equation modeling (TSSEM) approach to synthesize data from 30 studies on educational technology adoption in global educational settings. It tested a model for educational technology adoption for developing countries (ETADC) and addressed missing correlations in some studies.
The main outcome was a robust framework for understanding the adoption of educational technologies in developing countries, helping researchers and practitioners identify suitable technologies and enhance their adoption processes.

5.1. Theoretical Contributions: Model Superiority

The educational technology adoption for developing countries (ETADC) model is superior for educational technology adoption due to several key factors:
  • It was specifically developed for the unique challenges of developing countries, whereas most primary models focus on advanced countries, making them less effective in this context;
  • The ETADC model is tailored for education and validated with data exclusively from the education sector, unlike previous models that were adapted from other fields.
  • Unlike primary models that target specific technologies, the ETADC model addresses educational technology adoption in general;
  • It uses a large sample size (8934) from various countries, enhancing its validity, while primary models often rely on small, localized samples;
  • The ETADC model considers a crucial pedagogical variable: TPACK articulates the essential knowledge that educators must possess to effectively integrate technology into their teaching practices;
  • The ETADC model considers crucial variables such as cost-effectiveness, customization, alignment with academic goals, and the unique cultural, infrastructural, and economic factors in developing countries.

5.2. Practical Implications

The developed model may assist educational institutions in developing countries in identifying and adopting effective educational technologies.
  • Performance Expectancy: institutions should meticulously assess a technology’s features and its relevance to curriculum goals to ensure it enhances teaching–learning outcomes before adoption.
  • Facilitating conditions and effort expectancy: successful technology adoption requires strong organizational support, adequate resources, training, and teachers who can effectively integrate technology into their teaching practices.
  • Price value: the benefits of adopting a new technology must outweigh its costs; otherwise, it is not worth the investment.
  • Effort expectancy: through TPACK, the model aims to articulate the essential knowledge that educators must possess to effectively integrate technology into their teaching practices.
  • Social influence: developing countries can enhance their educational standards by learning from successful technology integration in advanced countries, such as China’s community-based professional development strategies.
Technology adoption in education is a very complex process that involves a diverse range of staff from various sectors, such as information technology (IT) staff, teachers and researchers, technological experts, and curriculum designers.
In summary, the main tasks of the team are the following:
  • Selecting suitable technologies;
  • Purchasing software that satisfies the requirements.
  • Piloting, trialing, and testing a technology to be adopted;
  • Conducting regular partnership meetings to monitor and evaluate the adoption, integration, and effects of the technology.
At the technology selection stage, the team should make sure that this specific type of technology improves students’ daily learning, whether it gives students access to a more interactive learning environment at home and in the classroom, and whether it can give teachers additional feedback from learning activities that can assist with assessment.
At the stage of piloting or trialing an educational technology to be adopted, the team could operate as follows (Figure 7):

5.3. Conclusions

Despite numerous studies on educational technology adoption, few focus on developing countries where existing models, primarily tested in advanced nations, often fail to address unique challenges. These challenges include limited resources, infrastructure, and skills.
This study reveals a lack of a tailored model for adopting educational technologies in developing countries, highlighting a significant gap in the existing literature and practices. It focuses on developing a specific model that addresses the unique challenges these regions face in integrating technology into education. Additionally, it suggests collaborative strategies for stakeholders—governments, educational institutions, and technology providers—to create an adaptable framework that promotes sustainable and equitable educational technology use.
This study contributes by (1) developing the educational technology adoption for developing countries (ETADC) model to identify appropriate technologies, (2) validating the ETADC model’s effectiveness and generalizability, and (3) outlining the requirements and steps for successful technology adoption in these educational settings. The educational technology adoption for developing countries (ETADC) model aims to guide the selection and adoption of suitable technologies in educational settings. It hypothesizes that performance expectancy (PE), effort expectancy (EE), social influence (SI), and price value (PV) positively affect technology acceptance and adoption in education. Additionally, facilitating conditions (FC) and social influence (SI) enhance users’ effort expectancy (EE). Identifying the right educational technology requires alignment between its features and users’ goals, as users are more likely to adopt technology that improves their performance. Thus, performance expectancy is central to the model. Technology adoption is a multidimensional process influenced not only by the technology itself but also by the users and their context. The model emphasizes the need for compatibility between technology features and performance expectancy, particularly in developing countries facing unique challenges such as limited resources and infrastructure. It incorporates user capabilities (effort expectancy) and top management support (facilitating conditions) as crucial factors. Success in educational technology interventions relies not just on the technology itself but on its customization to local contexts and policy constraints. Key constructs of the educational technology adoption for developing countries (ETADC) model include technology affordability, accessibility, and cost-effectiveness, along with social influence, which affects decision-making and adoption processes by drawing from the experiences of pioneering countries. Using correlation matrices from 30 studies on technology adoption in education, meta-analytic structural equation modeling (MASEM) was applied to fit a model known as the educational technology adoption for developing countries (ETADC) model. This model includes six hypotheses, all found to be significant, and demonstrates a good fit with the data, validating its appropriateness.
This model is designed to systematically identify and recommend educational technologies that are not only appropriate but also feasible for use in developing regions. This study undertakes three key objectives:
(1)
It delineates the foundational framework of the ETADC model, highlighting its components and how they relate to the specific needs of educational institutions in developing countries;
(2)
This research rigorously validates the effectiveness and generalizability of the ETADC model, ensuring that it holds across various contexts and can be reliably applied to different educational settings;
(3)
The study outlines a detailed list of requirements and actionable steps necessary for the successful adoption of technology in these educational environments, guiding stakeholders involved in the decision-making process.
Using the developed ETADC model and a guide created in this study, eleven educational technologies have been evaluated for further adoption. By leveraging digital tools and resources, educational technologies can bridge gaps in education delivery, particularly in remote and underserved areas, thereby empowering individuals with the skills necessary for economic growth and social progress. Overall, embracing educational technologies is essential for building a more equitable and sustainable future in developing countries.
ETADC provides a comprehensive and practical guide aimed at facilitating the adoption of educational technology across the globe. This guide is specially tailored for environments that face resource constraints, offering strategies and insights that can be effectively implemented in such settings. The goal is to promote sustainable development while helping institutions and organizations achieve their educational objectives. By focusing on innovative solutions and best practices, ETADC seeks to empower educators and learners alike, ensuring that the integration of technology enhances the learning experience and contributes to long-term educational success.
Future research will focus on adopting suitable educational technologies for developing countries using the ETADC model. Additionally, studies are needed to explore factors considered by developers and EduTech companies when developing educational technology, as well as how they incorporate user reviews to enhance EduTech functionalities.

Author Contributions

The authors contributed meaningfully and equally to this study for the research topic, data acquisition and analysis, methodology support, original draft preparation, writing review, and editing. All authors have read and agreed to the published version of the manuscript.

Funding

This work was supported by the National Natural Science Foundation of China under Grant 62177025.

Institutional Review Board Statement

Not applicable.

Informed Consent Statement

Not applicable.

Data Availability Statement

Data are contained within the article.

Conflicts of Interest

Regarding the research, writing, and/or publication of this article, the authors have declared that they have no potential conflicts of interest.

Abbreviations

The following abbreviations are used in this manuscript:
%PercentJRJob Relevance
A Anxiety MASEMMeta-analytic Structural Equation Modeling
AGAge MSEMobile Self-Efficacy
AIArtificial IntelligenceNNumber of studies
ANAnthropomorphism OAOperational ability
ATAttitude Toward Using OPQOutput Quality
ATAttitude OUObjective Usability
AUAcceptance and UsePA Perceived Autonomy
AWAwareness PCRPerceived cyber risk
BIABehavior Intention to Adopt PEPerformance Expectancy
BIUBehavior Intention PECPerception of external control
BIUBehavior Intention to Use PENJPerceived Enjoyment
CAComputer Anxiety PEUPerceived Ease of Use
CBAMConcerns-Based Adoption ModelPIPersonal Innovativeness
CFI Comparative Fit Index PLPlayfulness
CMComplexity PR Perceived risk
CPCompatibility PRA Perceived relative advantage
CPFComputer Playfulness PTPerceived Trust
CSCyber Security PU Perceived usefulness
CSEComputer self-efficacy PV Price Value
DCsDeveloping Countries R2The coefficient of determination
DFDegree of freedomRARelative advantage
DOIDiffusion of Innovations TheoryRDResults Demonstrability
EdTechEducational Technology RMSEARoot Mean Square Error of Approximation
EEEffort Expectancy SASatisfaction
EFEfficiency SE Self-Efficacy
ETADCEducational Technology Adoption for Developing Countries SEMStructural Equation Modeling
EXExperience SISocial influence
FCFacilitating Conditions SISsocial isolation
GDGender SNSubjective Norms
GOFIGoodness-of-fit indicesSRMR Standardized Root Mean Squared Residual
HHypothesisSTStress
HHabitTAMTechnology Acceptance Model,
HEIsHigher education institutions TCTechnology challenges
HMHedonic Motivation TLI Tucker–Lewis index
ICTInformation and Communication TechnologiesTOETechnology–Organization–Environment
IM Image TPACKTechnological Pedagogical Content Knowledge
IMGNImagination TRTrust
IMRNImmersion TSSEMTwo-Stage Structural Equation Modeling
INTR Interaction TTFTask–Technology Fit
IoTInternet of ThingsUBUse Behavior
IUIntention to Use a TechnologyUTAUTUnified Theory of Acceptance and Use of Technology
IUThe Intention of Use WTUWillingness to Use
IVIntrinsic Value βPath coefficients

Appendix A

Table A1. Existing models or theories applied, and the main factors impacting technology adoption in education settings in different countries.
Number of StudiesTheoriesMajor Factors Impacting Technology AdoptionReferences
Technology-Related FactorsContext-Related FactorsIndividual-Related Factors
Interface Quality: Ease of UseFunctionality: Perceived Technology FitTechnology Accessibility (Price Value)Usefulness,
Performance Expectancy
Top Management Support,
Facilitating Conditions, Infrastructure
Academic Expertise, Training, HabitCompetitive Pressure, Hedonic Motivation
(Social Influence), Curiosity, Cultural Influence
Effort Expectancy: Capabilities Perceived Self-EfficacyUsers’ Satisfaction,
Positive Attitude Toward Technology
1TAM [88]
2TAM [89]
3TAM [55]
4TAM [39]
5TAM [54]
6TAM [79]
7TAM [90]
8TAM [80]
9TAM [40]
10TAM [46]
11TAM [52]
12TAM [74]
13TAM [91]
14TAM [92]
15TAM [93]
16TAM [58]
17TAM [75]
18TAM [49]
19TAM [94]
20TAM [95]
21TAM [96]
22TAM [78]
23TAM [97]
24TAM [98]
25TAM [99]
26TAM [100]
27TAM [101]
28TAM [102]
29TAM [103]
30TAM [104]
31TAM [105]
32TAM [106]
33TAM [107]
34UTAUT [108]
35UTAUT [48]
36UTAUT [109]
37UTAUT [37]
38UTAUT [38]
39UTAUT [110]
40UTAUT [51]
41UTAUT [77]
42UTAUT [81]
43UTAUT [111]
44UTAUT [44]
45UTAUT [76]
46UTAUT [47]
47UTAUT [26]
48UTAUT [112]
49UTAUT [113]
50UTAUT [56]
51UTAUT [114]
52UTAUT [115]
53UTAUT [116]
54UTAUT [117]
55UTAUT [70]
56UTAUT [43]
57UTAUT [57]
58UTAUT [118]
59UTAUT [119]
60UTAUT [50]
61TAM & UTAUT [41]
62TAM & UTAUT [53]
63TAM & DOI [120]
64DOI [45]
65NA [121]
66NA [122]
67NA [123]
68NA [124]
69NA [125]
70NA [126]
Total 33419552819332940
Note: TAM: technology acceptance model; UTAUT: unified theory of acceptance and use of technology; DOI: diffusion of innovation theory; NA: not available.
Figure A1. The ETADC model was plotted using R Studio during the TSSEM analysis.
Sustainability 17 03592 g0a1
Table A2. z statistic approximation coefficients at 95% confidence intervals.
Estimate Std. ErrorLowboundUpboundz ValuePr(>|z|)
AU on EE0.2931490.040248 0.214265 0.3720337.2837 3.249 × 10⁻¹³ ***
AU on PE0.1699970.061223 0.050002 0.2899922.77670.0054917 **
AU on PV0.2425600.032{4 0.178403 0.3067177.4101 1.263 × 10⁻¹³ ***
AU on SI0.1508570.044516 0.063607 0.2381073.3888 0.0007019 ***
EE on FC0.3742360.035246 0.305156 0.443316 10.6180 <2.2 × 10⁻¹⁶ ***
EE on SI0.4373340.042322 0.354385 0.520283 10.3336 <2.2 × 10⁻¹⁶ ***
PE with FC 0.6181270.021354 0.576273 0.659981 28.9461<2.2 × 10⁻¹⁶ ***
PV with FC 0.6291350.022312 0.585404 0.672866 28.1970<2.2 × 10⁻¹⁶ ***
PE with PV 0.5437830.027304 0.490268 0.597299 19.9156<2.2 × 10⁻¹⁶ ***
SI with PV 0.5400500.020028 0.500796 0.579304 26.9647<2.2 × 10⁻¹⁶ ***
SI with FC 0.4252930.026239 0.373867 0.476720 16.2087<2.2 × 10⁻¹⁶ ***
PE with SI 0.5747900.018721 0.538098 0.611482 30.7036<2.2 × 10⁻¹⁶ ***
Note: *** p < 0.001; ** p < 0.01.
Table A3. Overall goodness of fit.
Goodness-of-Fit Indices:Value
Sample size8934.0000
Chi-square of the target model43.2121
DF of the target model3.0000
p-value of the target model0.0000
Number of constraints imposed on “Smatrix”0.0000
Manually adjusted DF0.0000
Chi-square of the independence model4776.8168
DF of the independence model15.0000
RMSEA0.0387
RMSEA, lower 95% CI0.0290
RMSEA, upper 95% CI0.0494
SRMR0.0476
TLI0.9578
CFI0.9916
AIC37.2121
BIC15.9192

References

  1. Bozkurt, A. Educational Technology Research Patterns in the Realm of the Digital Knowledge Age. J. Interact. Media Educ. 2020, 2020, 18. [Google Scholar] [CrossRef]
  2. Burch, P.; Miglani, N. Technocentrism and social fields in the Indian EdTech movement: Formation, reproduction and resistance. J. Educ. Policy 2018, 33, 590–616. [Google Scholar] [CrossRef]
  3. Buabeng-Andoh, C. Exploring University students’ intention to use mobile learning: A research model approach. Educ. Inf. Technol. 2021, 26, 241–256. [Google Scholar] [CrossRef]
  4. Almaiah, D.; Alismaiel, O. Examination of factors influencing the use of mobile learning system: An empirical study. Educ. Inf. Technol. 2019, 23, 885–909. [Google Scholar] [CrossRef]
  5. Silva, A.; Garzón, D. Identifying the Cognitive and Digital Gap in Educational Institutions Using a Technology Characterization Software. Int. J. Virtual Pers. Learn. Environ. 2023, 13, 1–12. [Google Scholar] [CrossRef]
  6. Madni, H.; Ali, J.; Husnain, H.; Masum, M.H.; Mustafa, S.; Shuja, J.; Maray, M.; Hosseini, S. Factors Influencing the Adoption of IoT for E-Learning in Higher Educational Institutes in Developing Countries. Front. Psychol. 2022, 13, 915596. [Google Scholar] [CrossRef]
  7. Saleh, S.; Nat, M.; Aqel, M. Sustainable Adoption of E-Learning from the TAM Perspective. Sustainability 2022, 14, 3690. [Google Scholar] [CrossRef]
  8. Ali, J.; Madni, H.; Jahangeer, M.; Danish, M. IoT Adoption Model for E-Learning in Higher Education Institutes: A Case Study in Saudi Arabia. Sustainability 2023, 15, 9748. [Google Scholar] [CrossRef]
  9. Ullah, N.; Al-Rahmi, W.; Alzahrani, A.; Alfarraj, O.; Alblehai, F. Blockchain Technology Adoption in Smart Learning Environments. Sustainability 2021, 13, 1801. [Google Scholar] [CrossRef]
  10. Yip, K.; Lo, P.; Ho, K.; Chiu, D. Adoption of mobile library apps as learning tools in higher education: A tale between Hong Kong and Japan. Online Inf. Rev. 2020, 45, 389–405. [Google Scholar] [CrossRef]
  11. Teo, T.; Doleck, T.; Bazelais, P.; Lemay, D. Exploring the drivers of technology acceptance: A study of Nepali school students. Educ. Technol. Res. Dev. 2019, 67, 495–517. [Google Scholar] [CrossRef]
  12. Binaymin, S.; Rutter, M.; Smith, S. Extending the Technology Acceptance Model to Understand Students’ Use of Learning Management Systems in Saudi Higher Education. Int. J. Emerg. Technol. Learn. (iJET) 2019, 14, 4–21. [Google Scholar] [CrossRef]
  13. Miller, J.; Khera, O. Digital Library Adoption and the Technology Acceptance Model: A Cross-Country Analysis. Electron. J. Inf. Syst. Dev. Ctries. 2010, 40, 1–19. [Google Scholar] [CrossRef]
  14. Tarhini, A.; Hone, K.; Liu, X.; Tarhini, T. Examining the moderating effect of individual-level cultural values on users’ acceptance of E-learning in developing countries: A structural equation modeling of an extended technology acceptance model. Interact. Learn. Environ. 2016, 25, 306–328. [Google Scholar] [CrossRef]
  15. Alshihi, H.; Sharma, S.; Sarrab, M. Neural network approach to predict mobile learning acceptance. Educ. Inf. Technol. 2018, 23, 1805–1824. [Google Scholar] [CrossRef]
  16. Batucan, G.; Gonzales, G.; Balbuena, M.; Pasaol, K.R.; Seno, D.; Gonzales, R. An Extended UTAUT Model to Explain Factors Affecting Online Learning System Amidst COVID-19 Pandemic: The Case of a Developing Economy. Front. Artif. Intell. 2022, 5, 768831. [Google Scholar] [CrossRef]
  17. Venkatesh, V.; Zhang, X. Unified Theory of Acceptance and Use of Technology: U.S. Vs. China. J. Glob. Inf. Technol. Manag. 2010, 13, 5–27. [Google Scholar] [CrossRef]
  18. Hennessy, S.; D’Angelo, S.; McIntyre, N.; Koomar, S.; Kreimeia, A.; Cao, L.; Brugha, M.; Zubairi, A. Technology Use for Teacher Professional Development in Low- and Middle-Income Countries: A systematic review. Comput. Educ. Open 2022, 3, 100080. [Google Scholar] [CrossRef]
  19. Alowayr, A.; Al-Azawei, A. Predicting mobile learning acceptance: An integrated model and empirical study based on higher education students’ perceptions. Australas. J. Educ. Technol. 2021, 37, 38–55. [Google Scholar] [CrossRef]
  20. Orozco-Messana, J.; Martínez-Rubio, J.; Gonzálvez-Pons, A. Sustainable Higher Education Development through Technology Enhanced Learning. Sustainability 2020, 12, 3600. [Google Scholar] [CrossRef]
  21. Walsh, P.P.; Murphy, E.; Horan, D. The role of science, technology and innovation in the UN 2030 agenda. Technol. Forecast. Soc. Change 2020, 154, 119957. [Google Scholar] [CrossRef]
  22. Adenle, A.; Steur, H.; Mwongera, C.; Rola-Rubzen, M.; Barcellos, M.; Font Vivanco, D.; Timilsina, G.; Possas, C.; Alders, R.; Chertow, M.; et al. Correction: Global UN 2030 agenda: How can Science, Technology and Innovation accelerate the achievement of Sustainable Development Goals for All? PLOS Sustain. Transform. 2024, 3, e0000100. [Google Scholar] [CrossRef]
  23. Alsswey, A.; Al-Samarraie, H.; El-Qirem, F.A.; Zaqout, F. M-learning technology in Arab Gulf countries: A systematic review of progress and recommendations. Educ. Inf. Technol. 2020, 25, 2919–2931. [Google Scholar] [CrossRef]
  24. Bice, H.; Tang, H. Teachers’ beliefs and practices of technology integration at a school for students with dyslexia: A mixed methods study. Educ. Inf. Technol. 2022, 27, 10179–10205. [Google Scholar] [CrossRef]
  25. Okai-Ugbaje, S.; Ardzejewska, K.; Imran, A. A mobile learning framework for higher education in resource constrained environments. Educ. Inf. Technol. 2022, 27, 11947–11969. [Google Scholar] [CrossRef]
  26. Abbad, M. Using the UTAUT model to understand students’ usage of e-learning systems in developing countries. Educ. Inf. Technol. 2021, 26, 7205–7224. [Google Scholar] [CrossRef]
  27. Yakubu, N.; Dasuki, S. Factors affecting the adoption of e-learning technologies among higher education students in Nigeria: A structural equation modelling approach. Inf. Dev. 2018, 35, 026666691876590. [Google Scholar] [CrossRef]
  28. Alyoussef, I. Factors Influencing Students’ Acceptance of M-Learning in Higher Education: An Application and Extension of the UTAUT Model. Electronics 2021, 10, 3171. [Google Scholar] [CrossRef]
  29. Teng, Z.; Cai, Y.; Gao, Y.; Zhang, X.; Xinlong, L. Factors Affecting Learners’ Adoption of an Educational Metaverse Platform: An Empirical Study Based on an Extended UTAUT Model. Mob. Inf. Syst. 2022, 2022, 5479215. [Google Scholar] [CrossRef]
  30. Kiwanuka, A. Acceptance Process: The Missing Link between UTAUT and Diffusion of Innovation Theory. Am. J. Inf. Syst. 2015, 3, 40–44. [Google Scholar] [CrossRef]
  31. Zaineldeen, S.; Li, H.; Koffi, A.; Mohammed, B. Technology Acceptance Model’ Concepts, Contribution, Limitation, and Adoption in Education. Univers. J. Educ. Res. 2020, 8, 5061–5071. [Google Scholar] [CrossRef]
  32. Venkatesh, V.; Davis, F. A Theoretical Extension of the Technology Acceptance Model: Four Longitudinal Field Studies. Manag. Sci. 2000, 46, 186–204. [Google Scholar] [CrossRef]
  33. Venkatesh, V.; Morris, M.; Davis, G.; Davis, F. User Acceptance of Information Technology: Toward a Unified View. MIS Q. 2003, 27, 425–478. [Google Scholar] [CrossRef]
  34. Blut, M.; Chong, A.; Tsigna, Z.; Venkatesh, V. Meta-Analysis of the Unified Theory of Acceptance and Use of Technology (UTAUT): Challenging its Validity and Charting a Research Agenda in the Red Ocean. J. Assoc. Inf. Syst. 2022, 23, 13–95. [Google Scholar] [CrossRef]
  35. Tamilmani, K.; Rana, N.; Fosso Wamba, S.; Dwivedi, R. The extended Unified Theory of Acceptance and Use of Technology (UTAUT2): A systematic literature review and theory evaluation. Int. J. Inf. Manag. 2020, 57, 102269. [Google Scholar] [CrossRef]
  36. Venkatesh, V.; Bala, H. Technology Acceptance Model 3 and a Research Agenda on Interventions. Decis. Sci. 2008, 39, 273–315. [Google Scholar] [CrossRef]
  37. Al-Adwan, A.S.; Al-Debei, M.M. The determinants of Gen Z’s metaverse adoption decisions in higher education: Integrating UTAUT2 with personal innovativeness in IT. Educ. Inf. Technol. 2024, 29, 7413–7445. [Google Scholar] [CrossRef]
  38. Wiangkham, A.; Vongvit, R. Exploring the Drivers for the Adoption of Metaverse Technology in Engineering Education using PLS-SEM and ANFIS. Educ. Inf. Technol. 2023, 29, 7385–7412. [Google Scholar] [CrossRef]
  39. Al-Adwan, A.; Li, N.; Al-Adwan, A.; Abbasi, G.; Albelbisi, N.; Habibi, A. Extending the Technology Acceptance Model (TAM) to Predict University Students’ Intentions to Use Metaverse-Based Learning Platforms. Educ. Inf. Technol. 2023, 28, 15381–15413. [Google Scholar] [CrossRef]
  40. Koutromanos, G.; Mikropoulos, T.; Mavridis, D.; Christogiannis, C. The mobile augmented reality acceptance model for teachers and future teachers. Educ. Inf. Technol. 2023, 29, 7855–7893. [Google Scholar] [CrossRef]
  41. Chatterjee, S.; Bhattacharjee, K. Adoption of artificial intelligence in higher education: A quantitative analysis using structural equation modelling. Educ. Inf. Technol. 2020, 25, 3443–3463. [Google Scholar] [CrossRef]
  42. Saif, N.; Khan, S.U.; Shaheen, I.; Alotaibi, F.A.; Alnfiai, M.M.; Arif, M. Chat-GPT; validating Technology Acceptance Model (TAM) in education sector via ubiquitous learning mechanism. Comput. Hum. Behav. 2024, 154, 108097. [Google Scholar] [CrossRef]
  43. Tseng, T.; Lin, S.; Wang, Y.-S.; Liu, H.-X. Investigating teachers’ adoption of MOOCs: The perspective of UTAUT2. Interact. Learn. Environ. 2019, 30, 635–650. [Google Scholar] [CrossRef]
  44. Strzelecki, A.; Cicha, K.; Rizun, M.; Rutecka, P. Acceptance and use of ChatGPT in the academic community. Educ. Inf. Technol. 2024, 29, 22943–22968. [Google Scholar] [CrossRef]
  45. Wang, S.; Yu, H.; Hu, X.; Li, J. Participant or spectator? Comprehending the willingness of faculty to use intelligent tutoring systems in the artificial intelligence era. Br. J. Educ. Technol. 2020, 51, 1657–1673. [Google Scholar] [CrossRef]
  46. Strzelecki, A. To use or not to use ChatGPT in higher education? A study of students’ acceptance and use of technology. Interact. Learn. Environ. 2024, 32, 5142–5155. [Google Scholar] [CrossRef]
  47. Wang, Y.-Y.; Wang, Y.-S.; Jian, S.-E. Investigating the Determinants of Students’ Intention to Use Business Simulation Games. J. Educ. Comput. Res. 2019, 58, 073563311986504. [Google Scholar] [CrossRef]
  48. Wang, Y.-Y.; Chuang, Y.-W. Investigating the potential adverse effects of virtual reality-based learning system usage: From UTAUT2 and PPVITU perspectives. Interact. Learn. Environ. 2023, 32, 5106–5125. [Google Scholar] [CrossRef]
  49. Unal, E.; Uzun, A. Understanding university students’ behavioral intention to use Edmodo through the lens of an extended technology acceptance model. Br. J. Educ. Technol. 2020, 52, 619–637. [Google Scholar] [CrossRef]
  50. Lin, J.-W.; Lai, Y.-C. User acceptance model of computer-based assessment: Moderating effect and intention-behavior effect. Australas. J. Educ. Technol. 2019, 35. [Google Scholar] [CrossRef]
  51. Bazelais, P.; Binner, G.; Doleck, T. Examining the key drivers of student acceptance of online labs. Interact. Learn. Environ. 2022, 32, 1460–1475. [Google Scholar] [CrossRef]
  52. Chen, H.-L.; Widarso, G.; Sutrisno, H. A ChatBot for Learning Chinese: Learning Achievement and Technology Acceptance. J. Educ. Comput. Res. 2020, 58, 073563312092962. [Google Scholar] [CrossRef]
  53. Bilquise, G.; Ibrahim, S.; Salhieh, S.E. Investigating student acceptance of an academic advising chatbot in higher education institutions. Educ. Inf. Technol. 2023, 29, 6357–6382. [Google Scholar] [CrossRef]
  54. Estriégana, R.; Medina, J.; Barchino, R. Student acceptance of virtual laboratory and practical work: An extension of the technology acceptance model. Comput. Educ. 2019, 135, 1–14. [Google Scholar] [CrossRef]
  55. Barrett, A.; Pack, A.; Quaid, E. Understanding learners’ acceptance of high-immersion virtual reality systems: Insights from confirmatory and exploratory PLS-SEM analyses. Comput. Educ. 2021, 169, 104214. [Google Scholar] [CrossRef]
  56. Khechine, H.; Raymond, B.; Augier, M. The adoption of a social learning system: Intrinsic value in the UTAUT model. Br. J. Educ. Technol. 2020, 51, 2306–2325. [Google Scholar] [CrossRef]
  57. Jung, I.; Lee, J. A cross-cultural approach to the adoption of open educational resources in higher education. Br. J. Educ. Technol. 2019, 51, 263–280. [Google Scholar] [CrossRef]
  58. Saidu, M.K.; Al Mamun, M.A. Exploring the Factors Affecting Behavioural Intention to Use Google Classroom: University Teachers’ Perspectives in Bangladesh and Nigeria. TechTrends 2022, 66, 681–696. [Google Scholar] [CrossRef]
  59. Yadegaridehkordi, E.; Nasir, M.; Noor, N.; Shuib, L.; Badie, N. Predicting the Adoption of Cloud-Based Technology Using Fuzzy Analytic Hierarchy Process and Structural Equation Modeling Approaches. Appl. Soft Comput. 2018, 66, 77–89. [Google Scholar] [CrossRef]
  60. El-Masri, M.; Tarhini, A. Factors affecting the adoption of e-learning systems in Qatar and USA: Extending the Unified Theory of Acceptance and Use of Technology 2 (UTAUT2). Educ. Technol. Res. Dev. 2017, 65, 743–763. [Google Scholar] [CrossRef]
  61. Kanwal, F.; Rehman, M. Factors Affecting E-Learning Adoption in Developing Countries–Empirical Evidence From Pakistan’s Higher Education Sector. IEEE Access 2017, 5, 10968–10978. [Google Scholar] [CrossRef]
  62. Miah, M.; Singh, J.; Rahman, M. Factors Influencing Technology Adoption in Online Learning among Private University Students in Bangladesh Post COVID-19 Pandemic. Sustainability 2023, 15, 3543. [Google Scholar] [CrossRef]
  63. Duong, D. How effort expectancy and performance expectancy interact to trigger higher education students’ uses of ChatGPT for learning. Interact. Technol. Smart Educ. 2023, 21, 356–380. [Google Scholar] [CrossRef]
  64. Amrozi, Y.; Ekowati, D.; Putranto, H.; Zikky, M.; Zulkarnain, M. Adoption of Information Technology as a Mediator Between Institutional Pressure and Change Performance. J. Namib. Stud. Hist. Politics Cult. 2023, 34, 788–808. [Google Scholar] [CrossRef]
  65. He, L.; Li, C. Students’ Adoption of ICT Tools for Learning English Based on Unified Theory of Acceptance and Use of Technology. Asian J. Educ. Soc. Stud. 2023, 44, 26–38. [Google Scholar] [CrossRef]
  66. Alghushami, A.; Zakaria, N.H.; Mat Aji, Z. Factors Influencing Cloud Computing Adoption in Higher Education Institutions of Least Developed Countries: Evidence from Republic of Yemen. Appl. Sci. 2020, 10, 8098. [Google Scholar] [CrossRef]
  67. Gómez-Ramirez, I.; Valencia-Arias, A.; Duque, L. Approach to M-learning Acceptance Among University Students. Int. Rev. Res. Open Distrib. Learn. 2019, 20. [Google Scholar] [CrossRef]
  68. Sofwan, M.; Habibi, A.; Yaakob, M. TPACK’s Roles in Predicting Technology Integration during Teaching Practicum: Structural Equation Modeling. Educ. Sci. 2023, 13, 448. [Google Scholar] [CrossRef]
  69. Al-Rahmi, A.; Shamsuddin, A.; Wahab, E.; Al-Rahmi, W.; Alismaiel, O.; Crawford, J. Social media usage and acceptance in higher education: A structural equation model. Front. Educ. 2022, 7, 964456. [Google Scholar] [CrossRef]
  70. Meet, R.K.; Kala, D.; Al-Adwan, A.S. Exploring factors affecting the adoption of MOOC in Generation Z using extended UTAUT2 model. Educ. Inf. Technol. 2022, 27, 10261–10283. [Google Scholar] [CrossRef]
  71. Chomunorwa, S.; Mugobo, V. Challenges of e-learning adoption in South African public schools: Learners’ perspectives. J. Educ. e-Learn. Res. 2023, 10, 80–85. [Google Scholar] [CrossRef]
  72. Dwivedi, Y.K.; Rana, N.P.; Jeyaraj, A.; Clement, M.; Williams, M.D. Re-examining the Unified Theory of Acceptance and Use of Technology (UTAUT): Towards a Revised Theoretical Model. Inf. Syst. Front. 2019, 21, 719–734. [Google Scholar] [CrossRef]
  73. Jak, S.; Cheung, M. Meta-Analytic Structural Equation Modeling With Moderating Effects on SEM Parameters. Psychol. Methods 2019, 25, 430–455. [Google Scholar] [CrossRef]
  74. Ateş, H.; Gündüzalp, C. A unified framework for understanding teachers’ adoption of robotics in STEM education. Educ. Inf. Technol. 2023, 29, 1–27. [Google Scholar] [CrossRef]
  75. Singh, H.; Singh, P.; Sharma, D. Faculty acceptance of virtual teaching platforms for online teaching: Moderating role of resistance to change. Australas. J. Educ. Technol. 2023, 39, 33–50. [Google Scholar] [CrossRef]
  76. Guggemos, J.; Seufert, S.; Sonderegger, S. Humanoid robots in higher education: Evaluating the acceptance of Pepper in the context of an academic writing course using the UTAUT. Br. J. Educ. Technol. 2020, 51, 1864–1883. [Google Scholar] [CrossRef]
  77. Ustun, A.B.; Karaoglan-Yilmaz, F.G.; Yilmaz, R.; Ceylan, M.; Uzun, O. Development of UTAUT-based augmented reality acceptance scale: A validity and reliability study. Educ. Inf. Technol. 2024, 29, 11533–11554. [Google Scholar] [CrossRef]
  78. Kashive, N.; Phanshikar, D. Understanding the antecedents of intention for using mobile learning. Smart Learn. Environ. 2023, 10, 34. [Google Scholar] [CrossRef]
  79. Liu, Y.; Sun, J.C.-Y.; Chen, S.-K. Comparing technology acceptance of AR-based and 3D map-based mobile library applications: A multigroup SEM analysis. Interact. Learn. Environ. 2023, 31, 4156–4170. [Google Scholar] [CrossRef]
  80. Nikou, S. Factors influencing student teachers’ intention to use mobile augmented reality in primary science teaching. Educ. Inf. Technol. 2024, 29, 15353–15374. [Google Scholar] [CrossRef]
  81. Rahman, M.S.; Sabbir, M.; Zhang, J.; Moral, I.; Hossain, G. Examining students’ intention to use ChatGPT: Does trust matter? Australas. J. Educ. Technol. 2023, 39, 51–71. [Google Scholar] [CrossRef]
  82. Cheung, M.; Cheung, S.F. Random-effects models for meta-analytic structural equation modeling: Review, issues, and illustrations. Res. Synth. Methods 2016, 7, 140–155. [Google Scholar] [CrossRef] [PubMed]
  83. Cheung, M. Fixed- and random-effects meta-analytic structural equation modeling: Examples and analyses in R. Behav. Res. Methods 2013, 46, 29–40. [Google Scholar] [CrossRef]
  84. Goretzko, D.; Siemund, K.; Sterner, P. Evaluating Model Fit of Measurement Models in Confirmatory Factor Analysis. Educ. Psychol. Meas. 2023, 84, 001316442311638. [Google Scholar] [CrossRef]
  85. Sova, R.; Tudor, C.; Tartavulea, C. Artificial Intelligence Tool Adoption in Higher Education: A Structural Equation Modeling Approach to Understanding Impact Factors among Economics Students. Electronics 2024, 13, 3632. [Google Scholar] [CrossRef]
  86. Anderson, C.; Al-Gahtani, S.; Hubona, G. The Value of TAM Antecedents in Global IS Development and Research. J. Organ. End User Comput. 2011, 23, 18–37. [Google Scholar] [CrossRef]
  87. Granić, A. Technology Acceptance and Adoption in Education. In Handbook of Open, Distance and Digital Education; Zawacki-Richter, O., Jung, I., Eds.; Springer Nature: Singapore, 2023; pp. 183–197. [Google Scholar]
  88. Adelana, O.; Ayanwale, M.; Ishola, A.; Oladejo, A.; Adewuyi, H. Exploring pre-service teachers’ intention to use virtual reality: A mixed method approach. Comput. Educ. X Real. 2023, 3, 100045. [Google Scholar] [CrossRef]
  89. Barrett, A.; Pack, A.; Guo, Y.; Wang, J. Technology acceptance model and multi-user virtual reality learning environments for Chinese language education. Interact. Learn. Environ. 2020, 31, 1665–1682. [Google Scholar] [CrossRef]
  90. Alvarez-Marin, A.; Velázquez-Iturbide, J.Á.; Castillo-Vergara, M. The acceptance of augmented reality in engineering education: The role of technology optimism and technology innovativeness. Interact. Learn. Environ. 2021, 31, 3409–3421. [Google Scholar] [CrossRef]
  91. Rüth, M.; Birke, A.; Kaspar, K. Teaching with digital games: How intentions to adopt digital game-based learning are related to personal characteristics of pre-service teachers. Br. J. Educ. Technol. 2022, 53, 1412–1429. [Google Scholar] [CrossRef]
  92. Hussein, M.; Ow, S.; Al-Azawei, A.; Ibrhim, I. What drives students’ successful reuse of online learning in higher education? A case of Google Classroom. Australas. J. Educ. Technol. 2022, 38, 1–21. [Google Scholar] [CrossRef]
  93. Francom, G.; Schwan, A.; Nuatomue, J. Comparing Google Classroom and D2L Brightspace Using the Technology Acceptance Model. TechTrends 2020, 65, 111–119. [Google Scholar] [CrossRef]
  94. Elfeky, A.; Elbyaly, M. The use of data analytics technique in learning management system to develop fashion design skills and technology acceptance. Interact. Learn. Environ. 2021, 31, 3810–3827. [Google Scholar] [CrossRef]
  95. Virani, S.; Saini, J.; Sharma, S. Adoption of massive open online courses (MOOCs) for blended learning: The Indian educators’ perspective. Interact. Learn. Environ. 2020, 31, 1060–1076. [Google Scholar] [CrossRef]
  96. Aburub, F. A new integrated model to explore factors that influence adoption of mobile learning in higher education: An empirical investigation. Educ. Inf. Technol. 2019, 24, 2145–2158. [Google Scholar] [CrossRef]
  97. Khlaisang, J.; Songkram, N.; Huang, F.; Teo, T. Teachers’ perception of the use of mobile technologies with smart applications to enhance students’ thinking skills: A study among primary school teachers in Thailand. Interact. Learn. Environ. 2021, 31, 5037–5058. [Google Scholar] [CrossRef]
  98. Al-Rahmi, A.; Al-Rahmi, W.; Alturki, U.; Aldraiweesh, A.; Almotairi, S.; Al-Adwan, A. Acceptance of mobile technologies and M-learning by university students: An empirical investigation in higher education. Educ. Inf. Technol. 2022, 27, 7805–7826. [Google Scholar] [CrossRef]
  99. Tao, D.; Fu, P.; Wang, Y.; Zhang, T.; Qu, X. Key characteristics in designing massive open online courses (MOOCs) for user acceptance: An application of the extended technology acceptance model. Interact. Learn. Environ. 2022, 30, 882–895. [Google Scholar] [CrossRef]
  100. Pozón-López, I.; Kalinić, Z.; Higueras-Castillo, E.; Liébana-Cabanillas, F. A multi-analytical approach to modeling of customer satisfaction and intention to use in Massive Open Online Courses (MOOC). Interact. Learn. Environ. 2019, 28, 1003–1021. [Google Scholar] [CrossRef]
  101. de Oliveira Neto, J.D.; Law, V.; Kang, S.P. Adoption of open educational resources in the global south. J. Comput. High. Educ. 2024, 36, 116–140. [Google Scholar] [CrossRef]
  102. Tang, H.; Lin, Y.J.; Qian, Y. Understanding K-12 teachers’ intention to adopt open educational resources: A mixed methods inquiry. Br. J. Educ. Technol. 2020, 51, 2558–2572. [Google Scholar] [CrossRef]
  103. Zhang, X.; Tlili, A.; Shubeck, K.; Hu, X.; Huang, R.; Zhu, L. Teachers’ adoption of an open and interactive e-book for teaching K-12 students Artificial Intelligence: A mixed methods inquiry. Smart Learn. Environ. 2021, 8, 34. [Google Scholar] [CrossRef]
  104. Sprenger, D.; Schwaninger, A. Video demonstrations can predict the intention to use digital learning technologies. Br. J. Educ. Technol. 2023, 54, 857–877. [Google Scholar] [CrossRef]
  105. Al-Maroof, R.S.; Salloum, S.A.; Hassanien, A.E.; Shaalan, K. Fear from COVID-19 and technology adoption: The impact of Google Meet during Coronavirus pandemic. Interact. Learn. Environ. 2023, 31, 1293–1308. [Google Scholar] [CrossRef]
  106. Kemp, A.; Palmer, E.; Strelan, P.; Thompson, M. Testing a novel extended educational technology acceptance model using student attitudes towards virtual classrooms. Br. J. Educ. Technol. 2024, 55, 2110–2131. [Google Scholar] [CrossRef]
  107. Liu, H.; Wang, L.; Koehler, M. Exploring the intention-behavior gap in the technology acceptance model: A mixed-methods study in the context of foreign-language teaching in China. Br. J. Educ. Technol. 2019, 50, 2536–2556. [Google Scholar] [CrossRef]
  108. Bower, M.; DeWitt, D.; Lai, J. Reasons associated with preservice teachers’ intention to use immersive virtual reality in education. Br. J. Educ. Technol. 2020, 51, 2215–2233. [Google Scholar] [CrossRef]
  109. Branko, A.; Šorgo, A.; Helm, C.; Weinhandl, R.; Lang, V. Exploring Factors Affecting Elementary School Teachers’ Adoption of 3D Printers In Teaching. TechTrends 2023, 67, 990–1006. [Google Scholar] [CrossRef]
  110. Di Natale, A.F.; Bartolotta, S.; Gaggioli, A.; Riva, G.; Villani, D. Exploring students’ acceptance and continuance intention in using immersive virtual reality and metaverse integrated learning environments: The case of an Italian university course. Educ. Inf. Technol. 2024, 29, 14749–14768. [Google Scholar] [CrossRef]
  111. Strzelecki, A.; ElArabawy, S. Investigation of the moderation effect of gender and study level on the acceptance and use of generative AI by higher education students: Comparative evidence from Poland and Egypt. Br. J. Educ. Technol. 2024, 55, 1209–1230. [Google Scholar] [CrossRef]
  112. Zhou, M.; Dzingirai, C.; Hove, K.; Chitata, T.; Mugandani, R. Adoption, use and enhancement of virtual learning during COVID-19. Educ. Inf. Technol. 2022, 27, 8939–8959. [Google Scholar] [CrossRef] [PubMed]
  113. de Leon-Pineda, J.L.; Delos Reyes, E.; Galura, J. C5-LMS design using Google Classroom: User acceptance based on extended Unified Theory of Acceptance and Use of Technology. Interact. Learn. Environ. 2022, 31, 6074–6083. [Google Scholar] [CrossRef]
  114. Raza, S.A.; Qazi, W.; Khan, K.; Salam, J. Social Isolation and Acceptance of the Learning Management System (LMS) in the time of COVID-19 Pandemic: An Expansion of the UTAUT Model. J. Educ. Comput. Res. 2020, 59, 183–208. [Google Scholar] [CrossRef]
  115. Zhang, Z.; Cao, T.; Shu, J.; Liu, H. Identifying key factors affecting college students’ adoption of the e-learning system in mandatory blended learning environments. Interact. Learn. Environ. 2020, 30, 1388–1401. [Google Scholar] [CrossRef]
  116. Rotar, O. Online Course use in Academic Practice: An Examination of Factors from Technology Acceptance Research in the Russian Context. TechTrends 2023, 1–12. [Google Scholar] [CrossRef]
  117. Qashou, A. Influencing factors in M-learning adoption in higher education. Educ. Inf. Technol. 2021, 26, 1755–1785. [Google Scholar] [CrossRef]
  118. Guillen-Gamez, F.; Colomo Magaña, E.; Ruiz-Palmero, J.; Tomczyk, Ł. Teaching digital competence in the use of YouTube and its incidental factors: Development of an instrument based on the UTAUT model from a higher order PLS-SEM approach. Br. J. Educ. Technol. 2023, 55, 340–362. [Google Scholar] [CrossRef]
  119. Orhan-Özen, S.; Sumer, M. Factors affecting undergraduate students’ acceptance and use of live instructions for learning. Interact. Learn. Environ. 2023, 32, 3720–3731. [Google Scholar] [CrossRef]
  120. Al-Rahmi, W.; Yahaya, N.; Alamri, M.; Alyoussef, I.; Al-Rahmi, A.; Kamin, Y. Integrating innovation diffusion theory with technology acceptance model: Supporting students’ attitude towards using a massive open online courses (MOOCs) systems. Interact. Learn. Environ. 2019, 29, 1380–1392. [Google Scholar] [CrossRef]
  121. Okada, A.; Kowalski, R.P.G.; Kirner, C.; Torres, P.L. Factors influencing teachers’ adoption of AR inquiry games to foster skills for Responsible Research and Innovation. Interact. Learn. Environ. 2019, 27, 324–335. [Google Scholar] [CrossRef]
  122. Shonfeld, M.; Greenstein, Y. Factors promoting the use of virtual worlds in educational settings. Br. J. Educ. Technol. 2020, 52, 214–234. [Google Scholar] [CrossRef]
  123. Yang, H.H.; Feng, L.; MacLeod, J. Understanding College Students’ Acceptance of Cloud Classrooms in Flipped Instruction: Integrating UTAUT and Connected Classroom Climate. J. Educ. Comput. Res. 2019, 56, 1258–1276. [Google Scholar] [CrossRef]
  124. Ho, N.; Pham, H.-H.; Sivapalan, S.; Dinh, V.-H. The adoption of blended learning using Coursera MOOCs: A case study in a Vietnamese higher education institution. Australas. J. Educ. Technol. 2022, 38, 121–138. [Google Scholar] [CrossRef]
  125. Dai, H.M.; Teo, T.; Rappa, N.A.; Huang, F. Explaining Chinese university students’ continuance learning intention in the MOOC setting: A modified expectation confirmation model perspective. Comput. Educ. 2020, 150, 103850. [Google Scholar] [CrossRef]
  126. Huang, F.; Teo, T.; Sánchez-Prieto, J.C.; García-Peñalvo, F.J.; Olmos-Migueláñez, S. Cultural values and technology adoption: A model comparison with university teachers from China and Spain. Comput. Educ. 2019, 133, 69–81. [Google Scholar] [CrossRef]
Figure 1. Theories applied to educational technology adoption.
Sustainability 17 03592 g001
Figure 2. The technological, pedagogical, and content knowledge (TPACK) framework developed by Mishra, P. and Koehler [68].
Sustainability 17 03592 g002
Figure 3. Proposed theoretical educational technology adoption for developing countries (ETADC) model.
Sustainability 17 03592 g003
Figure 4. Flowchart of the selection process of studies for the present meta-analysis.
Sustainability 17 03592 g004
Figure 5. Flowchart of predictive modeling.
Sustainability 17 03592 g005
Figure 6. Validated ETADC model.
Sustainability 17 03592 g006
Figure 7. Flowchart of the steps of piloting or trialing a technology to be adopted.
Sustainability 17 03592 g007
Table 1. Popular technology adoption models and their core constructs.
ModelCore ComponentsCause–Effect Links
TAM
[31]
PU, PEU, AT, BIU, UB(1) PU → BIU
(2) PEU → AT
(3) PEU → PU
(4) PU → AT
(5) AT → BIU
(6) BI → UB
TAM2
[32]
PU, PEU, BIU, UB, SN, IM, JR, RD, OPQ(1) PEU → PU
(2) PU → BIU
(3) PEU → BIU
(4) BI → UB
(5) SN → PU
(6) SN → BIU
(7) SN → IM
(8) IM → PU
(9) JR → PU
(10) RD → PU
(11) OPQ → PU
TAM3
[36]
PU, PEU, BIU, UB, SN, IM, JR, RD, OPQ, CSE, PEC, CA, PENJ, OU, CPF, moderators (voluntariness, experience)(1) PEU → PU
(2) PU → BIU
(3) PEU → BIU
(4) BI → UB
(5) SN → PU
(6) SN → IU
(7) SN → IM
(8) IM → PU
(9) JR → PU
(10) RD → PU
(11) OPQ → PU
(12) CSE → PEU
(13) PEC → PEU
(14) CANX → PEU
(15) CPF → PEU
(16) PENJ → PEU
(17) OU → PEU
UTAUT
[33]
PE, EE, SI, FC, BIU, Moderator variables (gender, age, experience, and voluntariness)(1) PE → BIU
(2) EE → BIU
(3) SI → BIU
(4) FC → BIU
(5) FC → UB
(6) B → UB
UTAUT2
[35]
PE, EE, SI, FC, HM, H, PV, BIU, Moderator variables (gender, age, experience, and voluntariness)(1) PE → BIU
(2) EE → BIU
(3) SI → BIU
(4) FC → BIU
(5) FC → UB
(6) HM → BIU
(7) PV → BIU
(8) H → BIU
(9) H → UB
(10) BIU → UB
Note: actual system use (UB), attitude toward using (AT), behavior intention (BIU), computer anxiety (CA), computer playfulness (CPF), computer self-efficacy (CSE), effort expectancy (EE), experience, facilitating condition (FC), habit (H), hedonic motivation (HM), image (IM), intention to use a technology (IU), job relevance (JR), objective usability (OU), output quality (OPQ), perceived ease of use (PEU), perceived enjoyment (PENJ), perceived usefulness (PU), perception of external control (PEC), performance expectancy (PE), price value (PV), results demonstrability (RD), social influence (SI), subjective norms (SN), use behavior (UB).
Table 2. Popular technology adoption models were applied to investigate in-service and pre-service teachers’ adoption of educational technologies in education in many developing countries.
StudiesBase ModelsComponentsCause–Effect Links
[37]UTAUT2PE, EE, SI, FC, HM, PV, BIU, PI(1) PE → BIU
(2) EE → BIU
(3) SI → BIU
(4) FC → BIU
(5) HM → BIU
(6) PV → BIU
(7) PI → BIU
(8) PI → PE
(9) PI → EE
[38]UTAUT2PE, EE, SI, FC, HM, H, BIU, CS, TR(1) PE → BIU
(2) EE → BIU
(3) SI → BIU
(4) FC → BIU
(5) HM → BIU
(6) H → BIU
(7) CS → BIU
(8) TR → BIU
[39]TAMPEU, PU, SE, PEN, PCR, PI, PV, BIU(1) PI → SE
(2) PI → PU
(3) PI → PEU
(4) PI → BIU
(5) SE → PU
(6) SE → PEU
(7) PCR → PU
(8) PCR → BIU
(9) PEU → PU
(10) PEU → PENJ
(11) PEU → BIU
(12) PU → BIU
(13) PENJ → BIU
[40]TAM and UTAUTPU, PEU, AT, FC, PENJ, PRA, MSE, IU(1) PENJ → PU
(2) PENJ → AT
(3) PU → IU
(4) PU → AT
(5) AT → IU
(6) FC → IU
(7) FC → PEU
(8) PEU → PU
(9) PEU → AT
(10) MSE → PEU
(11) PRA → PU
[41]UTAUTPE, EE, FC, BIU, PR, AT, AAHE(1) PR → AT
(2) PE → AT
(3) EE → AT
(4) FC → EE
(5) FC → BIU
(6) AT → BIU
(7) BIU → AAHE
[42]TAMPE, EE, BIU(1) AT → BIU
(2) PEU → AT
(3) PEU → PU
(4) BIU → AT
(5) ST → PU
(6) ST → PEU
(7) ST → A
[43]UTAUT2PE, EE, SI, FC, HM, PV, BIU, UB(1) PE → BIU
(2) EE → BIU
(3) SI → BIU
(4) FC → BIU
(5) FC → UB
(6) HM → BIU
(7) PV → BIU
(8) BIU → UB
[44]UTAUT2PE, EE, SI, FC, HM, H, PV, BIU, UB, PI(1) PE → BIU
(2) EE → BIU
(3) SI → BIU
(4) FC → BIU
(5) FC → UB
(6) HM → BIU
(7) PV → BIU
(8) H → BIU
(9) H → UB
(10) BIU → UB
(11) PI → BIU
[45]IODWTU, PT, RA or PE, CP, CM, EX or EE(1) CP → WTU
(2) CM → WTU
(3) EE → WTU
(4) RA → WTU
(5) PT → WTU
[46]UTAUT2PE, EE, SI, FC, HM, H, BIU, PI(1) PE → BIU
(2) EE → BIU
(3) SI → BIU
(4) FC → BIU
(5) FC → UB
(6) HM → BIU
(7) H → BIU
(8) H → UB
(9) BIU → UB
(10) PI → BIU
[47]UTAUT2PE, EE, SI, FC,
HM, PV, BIU,
(1) PE → BIU
(2) EE → BIU
(3) SI → BIU
(4) FC → BIU
(5) HM → BIU
(6) PV → BIU
[48]UTAUT2PE, EE, SI, FC,
HM, PV, WU
(1) PE → WTU
(2) EE → WTU
(3) SI → WTU
(4) FC → WTU
(5) HM → WTU
(6) PV → WTU
[49]TAM, TAM2 and TAM3PU, PEU, AT, SN or SI, IU, SE, JR,
OPQ, PEC
(1) PU → IU
(2) PU → AT
(3) PEU → AT
(4) PEU → PU
(5) AT → IU
(6) SN → PU
(7) OPQ → PU
(8) PEC → PEU
(9) PENJ → PEU
(10) SE → PEU
[50]UTAUTPE, EE, SI, BIU, UB(1) PE → BIU
(2) EE → BIU
(3) SI → BIU
(4) BI → UB
[51]UTAUTPE, EE, SI, FC, BIU, U(1) PE → BIU
(2) EE → BIU
(3) SI → BIU
(4) FC → UB
(5) BIU → UB
[52]TAMPEU, PU, BIU, PEN(1) PEN → PEU
(2) PEU → BIU
(3) PEU → PU
(4) PU → BIU
[53]TAMPEU, PU, SI, PT, PA, AN, BIA(1) PEU → BIA
(2) PU → BIA
(3) SI → BIA
(4) PT → BIA
(5) PA → BIA
(6) AN → BIA
[54]TAMPEU, PU, U, AT, BIU, EF, PL, SA(1) AT → BIU
(2) PU → AT
(3) PU → BIU
(4) PEU → AT
(5) PEU → PU
(6) SA → PU
(7) SA → AT
(8) SA → BIU
(9) SA → U
(10) PEU → SA
(11) EF → PU
(12) EF → PEU
(13) EF → SA
(14) PL → PU
(15) PL → PEU
(16) PL → SA
[55]TAMPU, PEU, IU, INTR, IMRN, IMGN(1) PU → IU
(2) PEU → IU
(3) INTR → PU
(4) INTR → PEU
(5) IMGN → PU
(6) IMGN → PEU
(7) IMRN → PU
(8) IMRN → PEU
[56]UTAUTPE, EE, SI, FC, BIU, IV(1) PE → BIU
(2) EE → BIU
(3) SI → BIU
(4) FC → BIU
(5) FC → UB
(6) BIU → UB
(7) IV → BIU
(8) IV → UB
[57]UTAUT2PE, EE, SI, FC, H, HM, PV, BIU, GD, AG, EX(1) PE → BIU
(2) EE → BIU
(3) SI → BIU
(4) FC → BIU
(5) HM → BIU
(6) PV → BIU
(7) H → BIU
(8) GD → BIU
(9) AG → BIU
(10) EX → BIU
[58]TAMPEU, IU, AW or SI, OA or FC, TC (1) SI → FC
(2) TC → FC
(3) SI → PEU
(4) FC → PEU
(5) PEU → IU
Note: adoption of AI (AAHE), age (AG), anthropomorphism (AN), anxiety (A), attitude (AT), awareness (AW), behavior intention (BIU), behavior intention to adopt (BIA), behavior intention to use (BIU), compatibility (CP), complexity (CM), cyber security (CS), efficiency (EF), effort expectancy (EE), experience (EX), facilitating condition (FC), gender (GD), habit (H), hedonic motivation (HM), imagination (IMGN), immersion (IMRN), intention of use (IU), interaction (INTR), intrinsic value (IV), job relevance (JR), mobile self-efficacy (MSE), operational ability (OA) or usefulness, output quality (OPQ), perceived autonomy (PA), perceived cyber risk (PCR), perceived ease of use (PEU), perceived enjoyment (PEN), perceived informativeness (PI), perceived relative advantage (PRA), perceived risk (PR), perceived trust (PT), perceived usefulness (PU), perception of external control (PEC), performance expectancy (PE), personal innovativeness (PI), playfulness (PL), price value (PV), relative advantage (RA) or performance expectancy, satisfaction (SA), self-efficacy (SE), social influence (SI), social isolation (SIS), stress (ST), subjective norms (SN), technology challenges (TC), trust (TR), use (U), use behavior (UB), use of OLE (U), willingness to use (WTU).
Table 3. Raw correlations considered for the meta-analytic procedures of 30 studies.
ReferencesNPE → EEPE → SIPE → AUPE → FCPE → PVEE → SIEE → AU EE → FCEE → PVFC → SIFC → AUFC → PVSI → PVSI → AUPV → AU
[43]1610.340.540.70.520.620.310.360.540.450.430.570.550.440.650.59
[57]1520.530.480.550.370.470.340.620.60.530.360.510.490.220.470.62
[44]6290.3510.5650.8090.3410.4150.2130.390.710.3390.3020.4310.4620.3350.6010.479
[74]6050.620.310.35NANA0.390.3NANANANANANA0.39NA
[75]4180.561NA0.412NANANA0.353NANANANANANANANA
[58]54NANANANANA0.5290.6580.658NA0.3660.573NANA0.526NA
[45]1780.341NA0.4040.213NANA0.3960.413NANA0.334NANANANA
[38]3650.8040.6480.6370.654NA0.6380.570.653NA0.5390.436NANA0.66NA
[46]5340.5960.5830.8410.595NA0.420.6360.798NA0.4890.629NANA0.612NA
[47]1410.5080.4780.410.5520.640.4770.3240.5740.3270.6380.5070.5480.60.4160.508
[48]3520.7340.650.6180.6530.4910.6990.5880.6930.4910.7810.6720.6690.6760.7420.586
[37]5370.6320.5280.6370.6350.6060.5070.6370.6090.5770.5010.6050.5640.4840.4740.585
[49]2180.7110.5520.676NANA0.4280.565NANANANANANA0.498NA
[50]1860.740.620.68NANA0.580.6NANANANANANA0.69NA
[42]1560.468NA0.123NANANA0.132NANANANANANANANA
[56]990.6870.7420.6660.771NA0.6420.4630.735NA0.7120.68NANA0.651NA
[41]3290.544NA0.5110.561NANA0.4990.556NANA0.506NANANANA
[76]4620.730.610.7NANA0.550.64NANANANANANA0.64NA
[40]3060.517NA0.6730.528NANA0.5350.676NANA0.601NANANANA
[51]1940.7480.5840.7010.584NA0.4930.6420.715NA0.4250.519NANA0.645NA
[77]5460.5950.577NA0.559NA0.701NA0.525NA0.63NANANANANA
[78]2330.4520.4780.671NANA0.3810.454NANANANANANA0.583NA
[79]4500.6130.6260.796NANA0.3380.573NANANANANANA0.629NA
[39]5740.529NA0.741NANANA0.51NANANANANANANANA
[52]580.7NA0.758NANANA0.641NANANANANANANANA
[53]2070.6130.4330.56NANA0.3330.502NANANANANANA0.672NA
[80]890.6490.480.752NANA0.5240.699NANANANANANA0.562NA
[54]2230.507NA0.579NANANA0.589NANANANANANANANA
[55]1340.396NA0.765NANANA0.366NANANANANANANANA
[81]3440.829NA0.745NANANA0.81NANANANANANANANA
Note: sample size of each study; NA: not available; →: path between variables; PE: performance expectancy; EE: effort expectancy; SI: social influence; FC: facilitating conditions; PV: price value; AU: acceptance and use (adoption decision is BI or BIU (use behavior) and actual use). In some primary studies, terms were substituted as follows: “performance expectancy” became “perceived usefulness” or “relative advantages”; “effort expectancy” was replaced by “perceived ease of use” or “self-efficacy”; “facilitating conditions” turned into “top management support” or “infrastructure”; and “social influence” was rephrased as “subjective norms” or “competitive pressure”. Additionally, “price value” was often referred to as “cost-effectiveness”. Lastly, several studies used “behavior intention to use” or “continuance of using” instead of “acceptance and use”.
Table 4. Pooled correlation matrix from the meta-analysis results.
PEFC SI EE PV AU
PE1 8880
(29)
6160
(19)
8334
(28)
4523
(14)
1972
(6)
FC0.588 ***16214
(20)
8388
(29)
4577
(15)
1972
(6)
SI0.545 ***0.466 ***13764
(12)
4031
(14)
1972
(6)
EE0.623 ***0.517 ***0.507 ***11972
(6)
5668
(19)
PV0.536 ***0.629 ***0.536 ***0.465 ***11972
(6)
AU0.542 **0.458 ***0.547 ***0.581 ***0.551 ***1
Note. rc is in a lower triangle and N (k) is in an upper triangle; *** p < 0.001; ** p < 0.01. rc = pooled correlation values; N = number of participants for each correlation; k = number of studies for each correlation.
Table 5. Summary of the model fit indices of the most important parameters and their accepted values according to the literature.
IndicesRecommended Values [84]ETADC Testing ValuesConclusion
Root Mean Square Error of Approximation (RMSEA)≤0.05; reasonable fit
>0.1; poor fit.
0.0387Good model fit
Standardized Root Mean Squared Residual (SRMR)≤0.08; acceptable fit0.0476Good model fit
Comparative Fit Index (CFI)=1; perfect fit0.9916Good model fit
≥0.95; excellent fit
Tucker–Lewis index (TLI)≥0.9; good fit;0.9578Good model fit
Table 6. The coefficient of determination (R2) for the dependent variables.
Independent VariablesDependent Variable Coefficient of Determination (R2)Conclusion
Social Influence (SI),
Facilitating Conditions (FC)
Effort Expectancy (EE)53% or 0.53Acceptable
Performance Expectancy (PE),
Social influence (SI),
Price Value (PV),
Effort Expectancy (EE)
Acceptance and Use (AU)52% or 0.52Acceptable
Table 7. Hypothesis testing results.
HypothesesPaths
(Connections
Between Variables)
Path
Coefficients
(β)
Std.
Error
z Value p-ValuesStatistical SignificanceConclusion
H1Performance Expectancy Acceptance and Use0.170.0612.77<0.01Significantsupported
H2Effort Expectancy Acceptance and Use0.290.0407.28<0.001Significantsupported
H3Social Influence Acceptance and Use0.150.0443.38<0.001Significantsupported
H4Facilitating Conditions Effort Expectancy 0.370.03510.62<0.001Significantsupported
H5Social Influence Effort Expectancy 0.440.04210.33<0.001Significantsupported
H6Price Value Acceptance and Use0.240.0327.41<0.001Significantsupported
Table 8. Summary of the elements of the superiority and appropriateness of the developed educational technologies adoption for developing countries (ETADC) model compared to the previous models.
Models, Authors, YearOriginal TAM by [31]TAM2 by [32]
TAM3 by [36]
Original UTAUT by [33]UTAUT2 by [35]ETADC
(Developed in the Present Study)
Model Core constructsPerceived usefulness; perceived ease of use.Social influence, age, gender, and core constructs from the TAM.Performance expectancy, effort expectancy, social influence, facilitating conditions, and factors such as gender, age, experience, and voluntariness moderate the impact of the four key constructs.Hedonic motivation, price value, habit, including all constructs from the UTAUT.Performance expectancy, effort expectancy, social influence, facilitating conditions, and price value.
Context of its primary developmentOriginally developed for the adoption of IT in the workplace.Developed for technology adoption in organizations, focusing on employee acceptance of new information systems.Developed in the context of technology adoption, focusing on employee acceptance of new information systems.This focuses on employee acceptance and use of new information systems in technology adoption for consumer contexts.Developed only for education settings in developing countries
OriginOriginated from psychological theories. It was built upon the theory of reasoned action.Originated from the TAM.Originated from the TRA, TPB, TAM, TAM2, TAM3, DOI, motivational model, and social cognitive theory.Originated from the UTAUT.Originated from the TAM, UTAUT, and UTAUT2.
Context of its validationOriginally validated in the United States [86].Originally validated in the United States.Originally validated in the United States [17].Originally validated in the United States.Validated worldwide.
Explanatory powerExplained 40% of the variance in technology use intention [32].In 4 studies, TAM2 explained between 34% and 52% of the variance in the use of IT [32].
In 4 studies, TAM3 explained between 31% and 36% of the variance in the use of IT [36].
The original UTAUT explained 40% of the variance in technology use.The UTAUT2 explained 52% of the variance in technology use.Very high explanatory power. The ETADC explains 51% of the variance in effort expectancy, and it explains 52% of the variance in technology acceptance and use.
General CriticismsLack of subjective norms or social impact on the central constructs of PU and PEU; provides no information about how to make technology more useful and easier to use.They are very complex due to the multitude of factors incorporated.The multitude of moderators incorporated raises the model’s complexity. Accordingly, it is often applied without moderators.The multitude of moderators incorporated raises the model’s complexity. Accordingly, it is often applied without moderators.Even though the model was primarily developed for developing countries, it can be applied worldwide.
UpdateIt was developed 35 years ago.Was developed, respectively, 24 and 16 years agoIt was developed 21 years ago.It was developed 12 years ago.Updated, developed in 2024.
AdvantagesIt has emerged as the predominant model for studying technology adoption in educational contexts due to its flexibility for modifications.They have demonstrated that a technology adoption model should not be complex, and it should not have a large number of constructs.It provides the highest explanatory power among standard acceptance models, supporting the technology development process.It is a good foundation for the development of technology adoption models according to the local context.It is a general and updated model for the identification and adoption of technologies suitable for education settings in developing countries, as well as around the world.
Appropriateness to education settingsThe TAM, while used in education, may not fully address the complexities of technology adoption in this field.Not appropriate for education settings.The UTAUT framework may need adaptations to better address the complexities of technology adoption in education [87].Should be extended or modified to better suit educational environments.Developed specifically for education purposes to achieve sustainable education.
Appropriateness for developing countriesThe TAM’s core constructs may not fully reflect the complexities of technology adoption in developing countries.Not appropriate for developing countries.Should include context-specific factors such as societal aspects and cost-effectiveness to better fit developing countries.Needs adjustment for societal factors and cost-effectiveness to fit developing countries better.Suitable for developing countries as it has been developed according to the unique challenges facing these nations and their local contexts.
Table 9. Example of educational technologies extracted for evaluation using the 5 stages of the ETADC model.
Type of Educational TechnologyPEPV
Pricing
FCEE
Users (Downloads)
SI
PE1
Features
PE2
Category
FC1
Required Devices
FC2
Download Size
SI1
Technology Maturity
SI2
Teacher-Approved
SI3
Reviews
SI4
Ratings on the Market
1. Real-time engagement technologies (Quizlet)Promote engagement,
personalized learning,
creativity,
critical thinking,
problem-solving skills
EducationUSD 1.99–USD 35.99 Computers, iPads, iPhones, iTouches, Android tablets, and smartphones39 MB10 M+YesYes712 K4.7 Sustainability 17 03592 i002
2. Design and creativity technologies (Canva)EducationUSD 1.49–USD 30027 MB100 M+YesYes19.3 M4.8 Sustainability 17 03592 i002
3. Interactive learning labs (PhET Simulations)EducationUSD 0.99123 MB50 K+YesYes5314.7 Sustainability 17 03592 i002
4. Language learning technology (Duolingo)EducationUSD 0.99–USD 239.981 MB500 M+YesYes30.5 M4.7 Sustainability 17 03592 i002
5. Virtual reality and augmented Teality (CamToPlan)Business and EducationFree–USD 17.9920 M100 K+YesYes7.38 K4.5 Sustainability 17 03592 i002
6. Robotics (Mio, the Robot)Education FREE 48 MB100 K+YesYes1.25 K3.1 Sustainability 17 03592 i002
7. Game-based learning platforms (Kahoot)EducationFREE 93 MB50 M+YesYes751 K4.7 Sustainability 17 03592 i002
8. Learning management systems (Google Classroom) Education FREE 21.65 MB 100 M+YesYes2.04 M4.1 Sustainability 17 03592 i002
9. Interactive learning platforms (Nearpod)EducationFREE 3 MB1 M+YesYes7.04 K2.2 Sustainability 17 03592 i002
10. Open education resources (Khan Academy)EducationFREE28 MB10 M+YesYes167 K 4.2 Sustainability 17 03592 i002
11. Three-dimensional printing (Tinkercad)Education FREE 100 K+YesYes8252.5 Sustainability 17 03592 i002
Note: Sustainability 17 03592 i002 is a star rating.
Table 10. The adoption rate of eleven evaluated educational technologies.
Type of Educational TechnologyPE = (PE1 + PE2)/2PVFC = (FC1 + FC2)/2EESI = (SI1 + SI2 + SI3 + SI4)/4Adoption Rate = (PE + PV + FC + EE + SI) /5
PE1PE2PEFC1FC2FCSI1SI2SI3SI4SI
1. Real-time engagement technologies (Quizlet)4445555455454.74.5 Sustainability 17 03592 i002
2. Design and creativity technologies (Canva)55545555555554.8 Sustainability 17 03592 i002
3. Interactive learning labs (PhET Simulations)55545342551543.8 Sustainability 17 03592 i002
4. Language learning technology (Duolingo)544.54544.55555554.6 Sustainability 17 03592 i002
5. Virtual Reality and Augmented reality (CamToPlan)5555454.53551544.3 Sustainability 17 03592 i002
6. Robotics (Mio, the Robot)5555555355233.74.3 Sustainability 17 03592 i002
7. Game-based learning platforms (Kahoot)544.55544.5455454.74.5 Sustainability 17 03592 i002
8. Learning Management Systems (Google Classroom) 544.55555555544.74.8 Sustainability 17 03592 i002
9. Interactive learning platforms (Nearpod)544.55555355123.24.1 Sustainability 17 03592 i002
10. Open Education Resources (Khan Academy)544.55555455444.54.6 Sustainability 17 03592 i002
11. Three-dimensional printing (Tinkercad)544.55544.5355133.54.1 Sustainability 17 03592 i002
Note: Sustainability 17 03592 i002 is a star rating.
Disclaimer/Publisher’s Note: The statements, opinions and data contained in all publications are solely those of the individual author(s) and contributor(s) and not of MDPI and/or the editor(s). MDPI and/or the editor(s) disclaim responsibility for any injury to people or property resulting from any ideas, methods, instructions or products referred to in the content.

