
Digital Economy and High-Quality Agricultural Development: Mechanisms of Technological Innovation and Spatial Spillover Effects


Abstract
:1. Introduction
2. Literature Review
3. Theoretical Analysis and Research Hypothesis
3.1. Defining High-Quality Agricultural Development
3.2. Digital Economy and High-Quality Agricultural Development
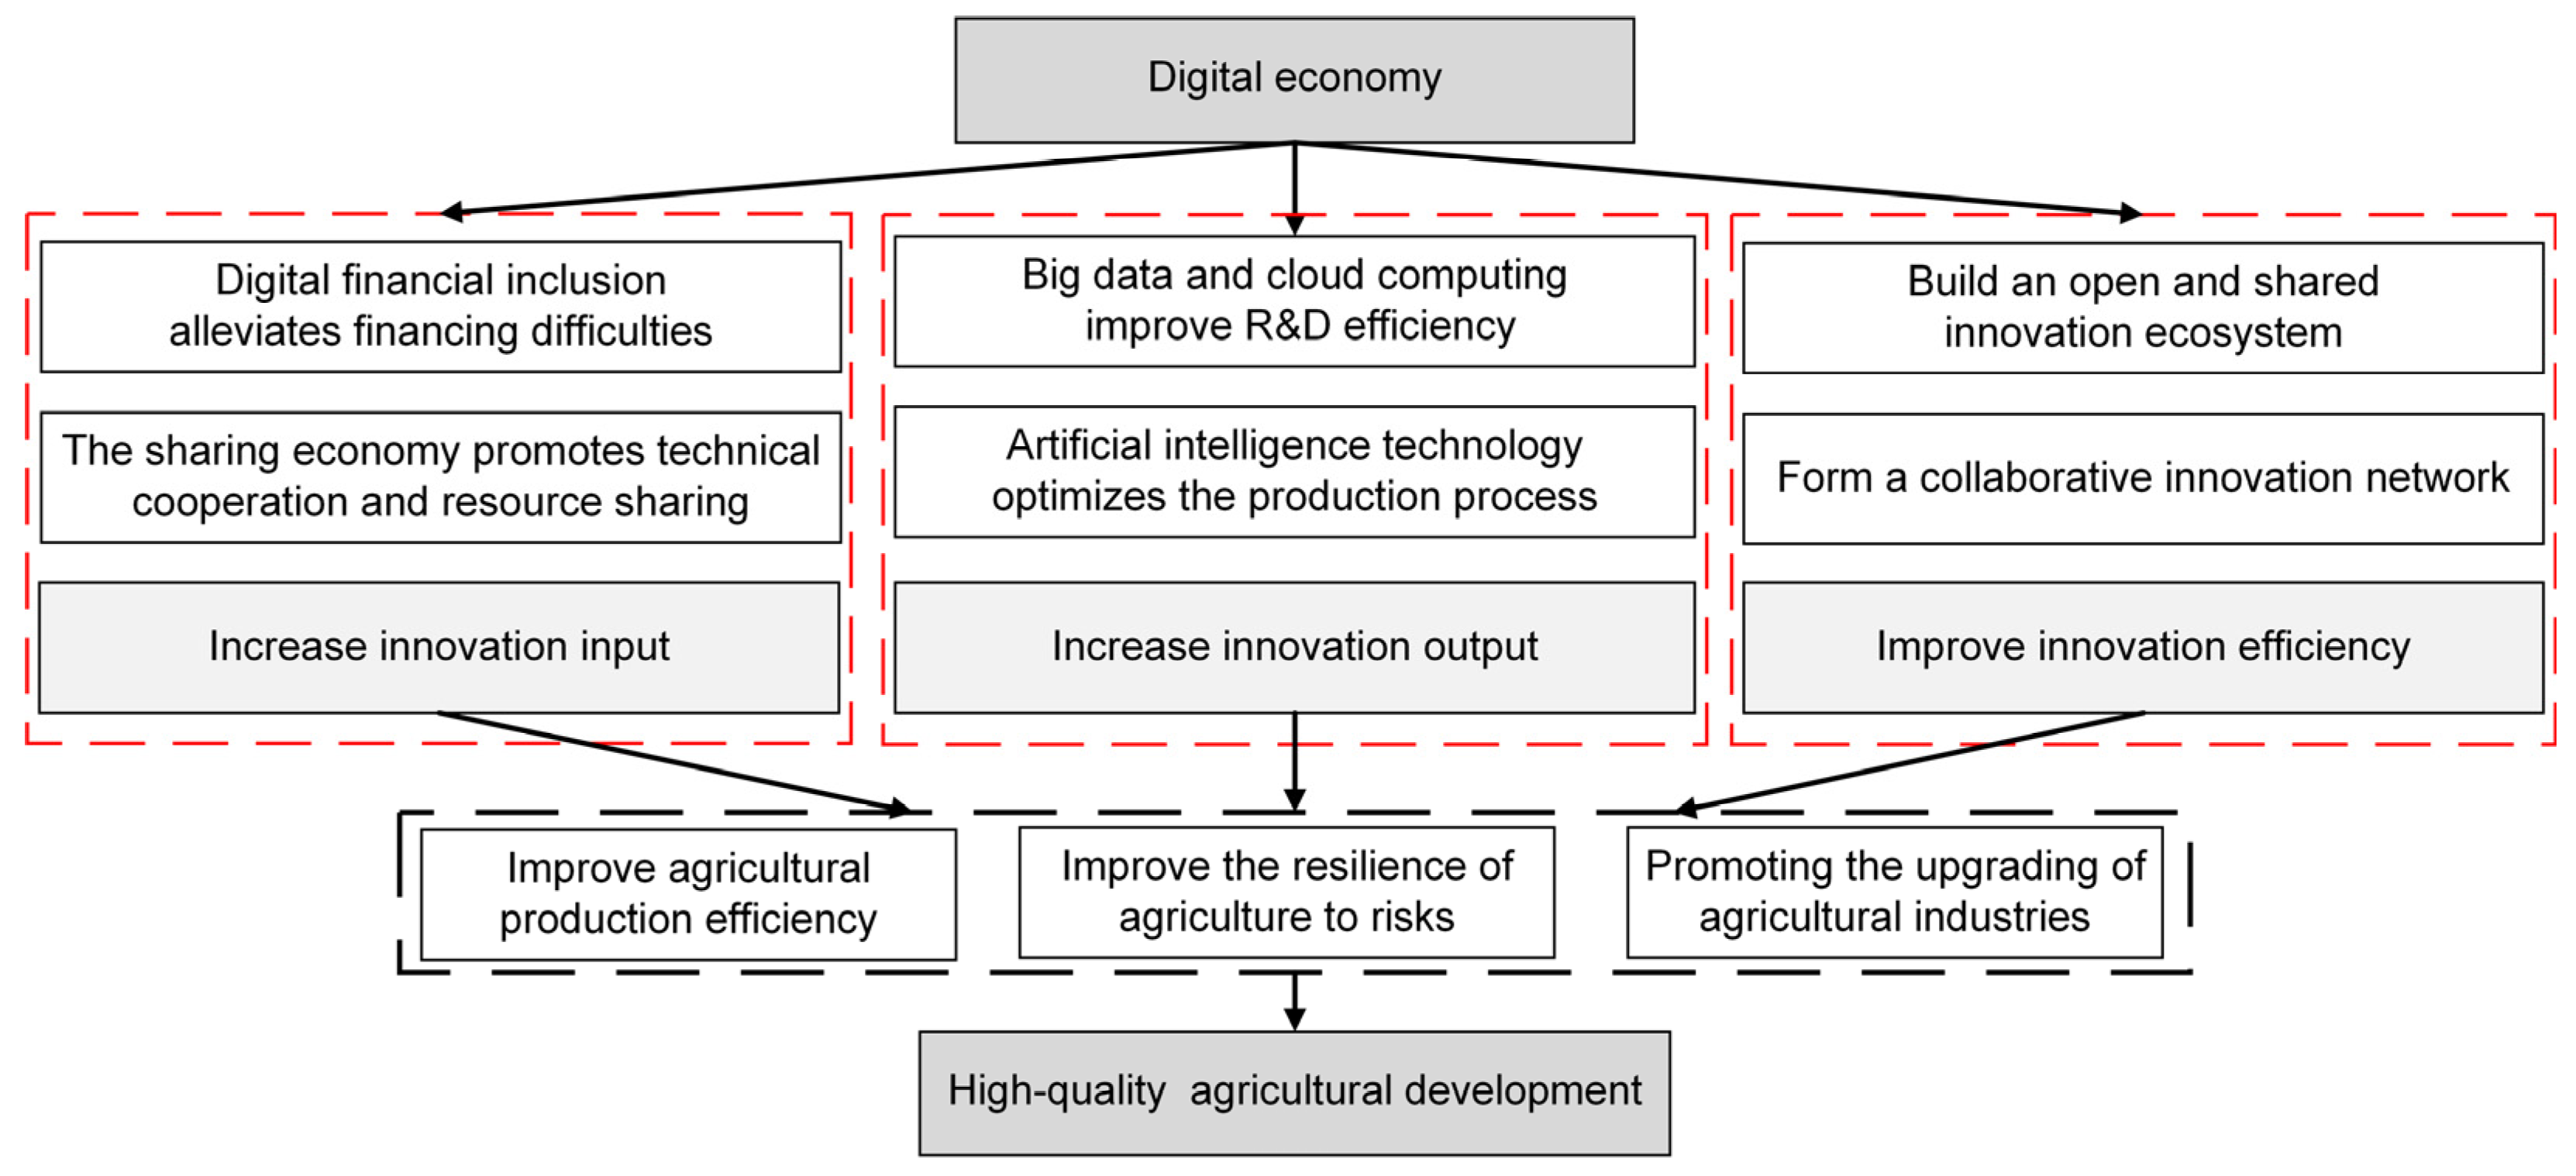
3.3. Digital Economy, Technological Innovation, and High-Quality Agricultural Development
4. Research Design
4.1. Variable Selection
4.1.1. Explained Variable
4.1.2. Core Explanatory Variable
4.1.3. Control Variables
4.1.4. Mechanism Variable
4.2. Data Sources and Variable Descriptive Statistics
4.3. Model Design
4.3.1. Baseline Regression Model
4.3.2. Spatial Econometric Model
5. Results and Analysis
5.1. Baseline Estimate
5.2. Robustness Test
5.2.1. Replacement of Core Variables
5.2.2. Removal of Anomalous Data
5.2.3. 1% Bilateral Shrinkage
5.2.4. Considering External Shocks
5.3. Mechanism Test
6. Further Analysis
6.1. Heterogeneity Analysis
6.1.1. Degree of Intellectual Property Protection
6.1.2. Urban–Rural Income Gap
6.2. Spatial Effects Test
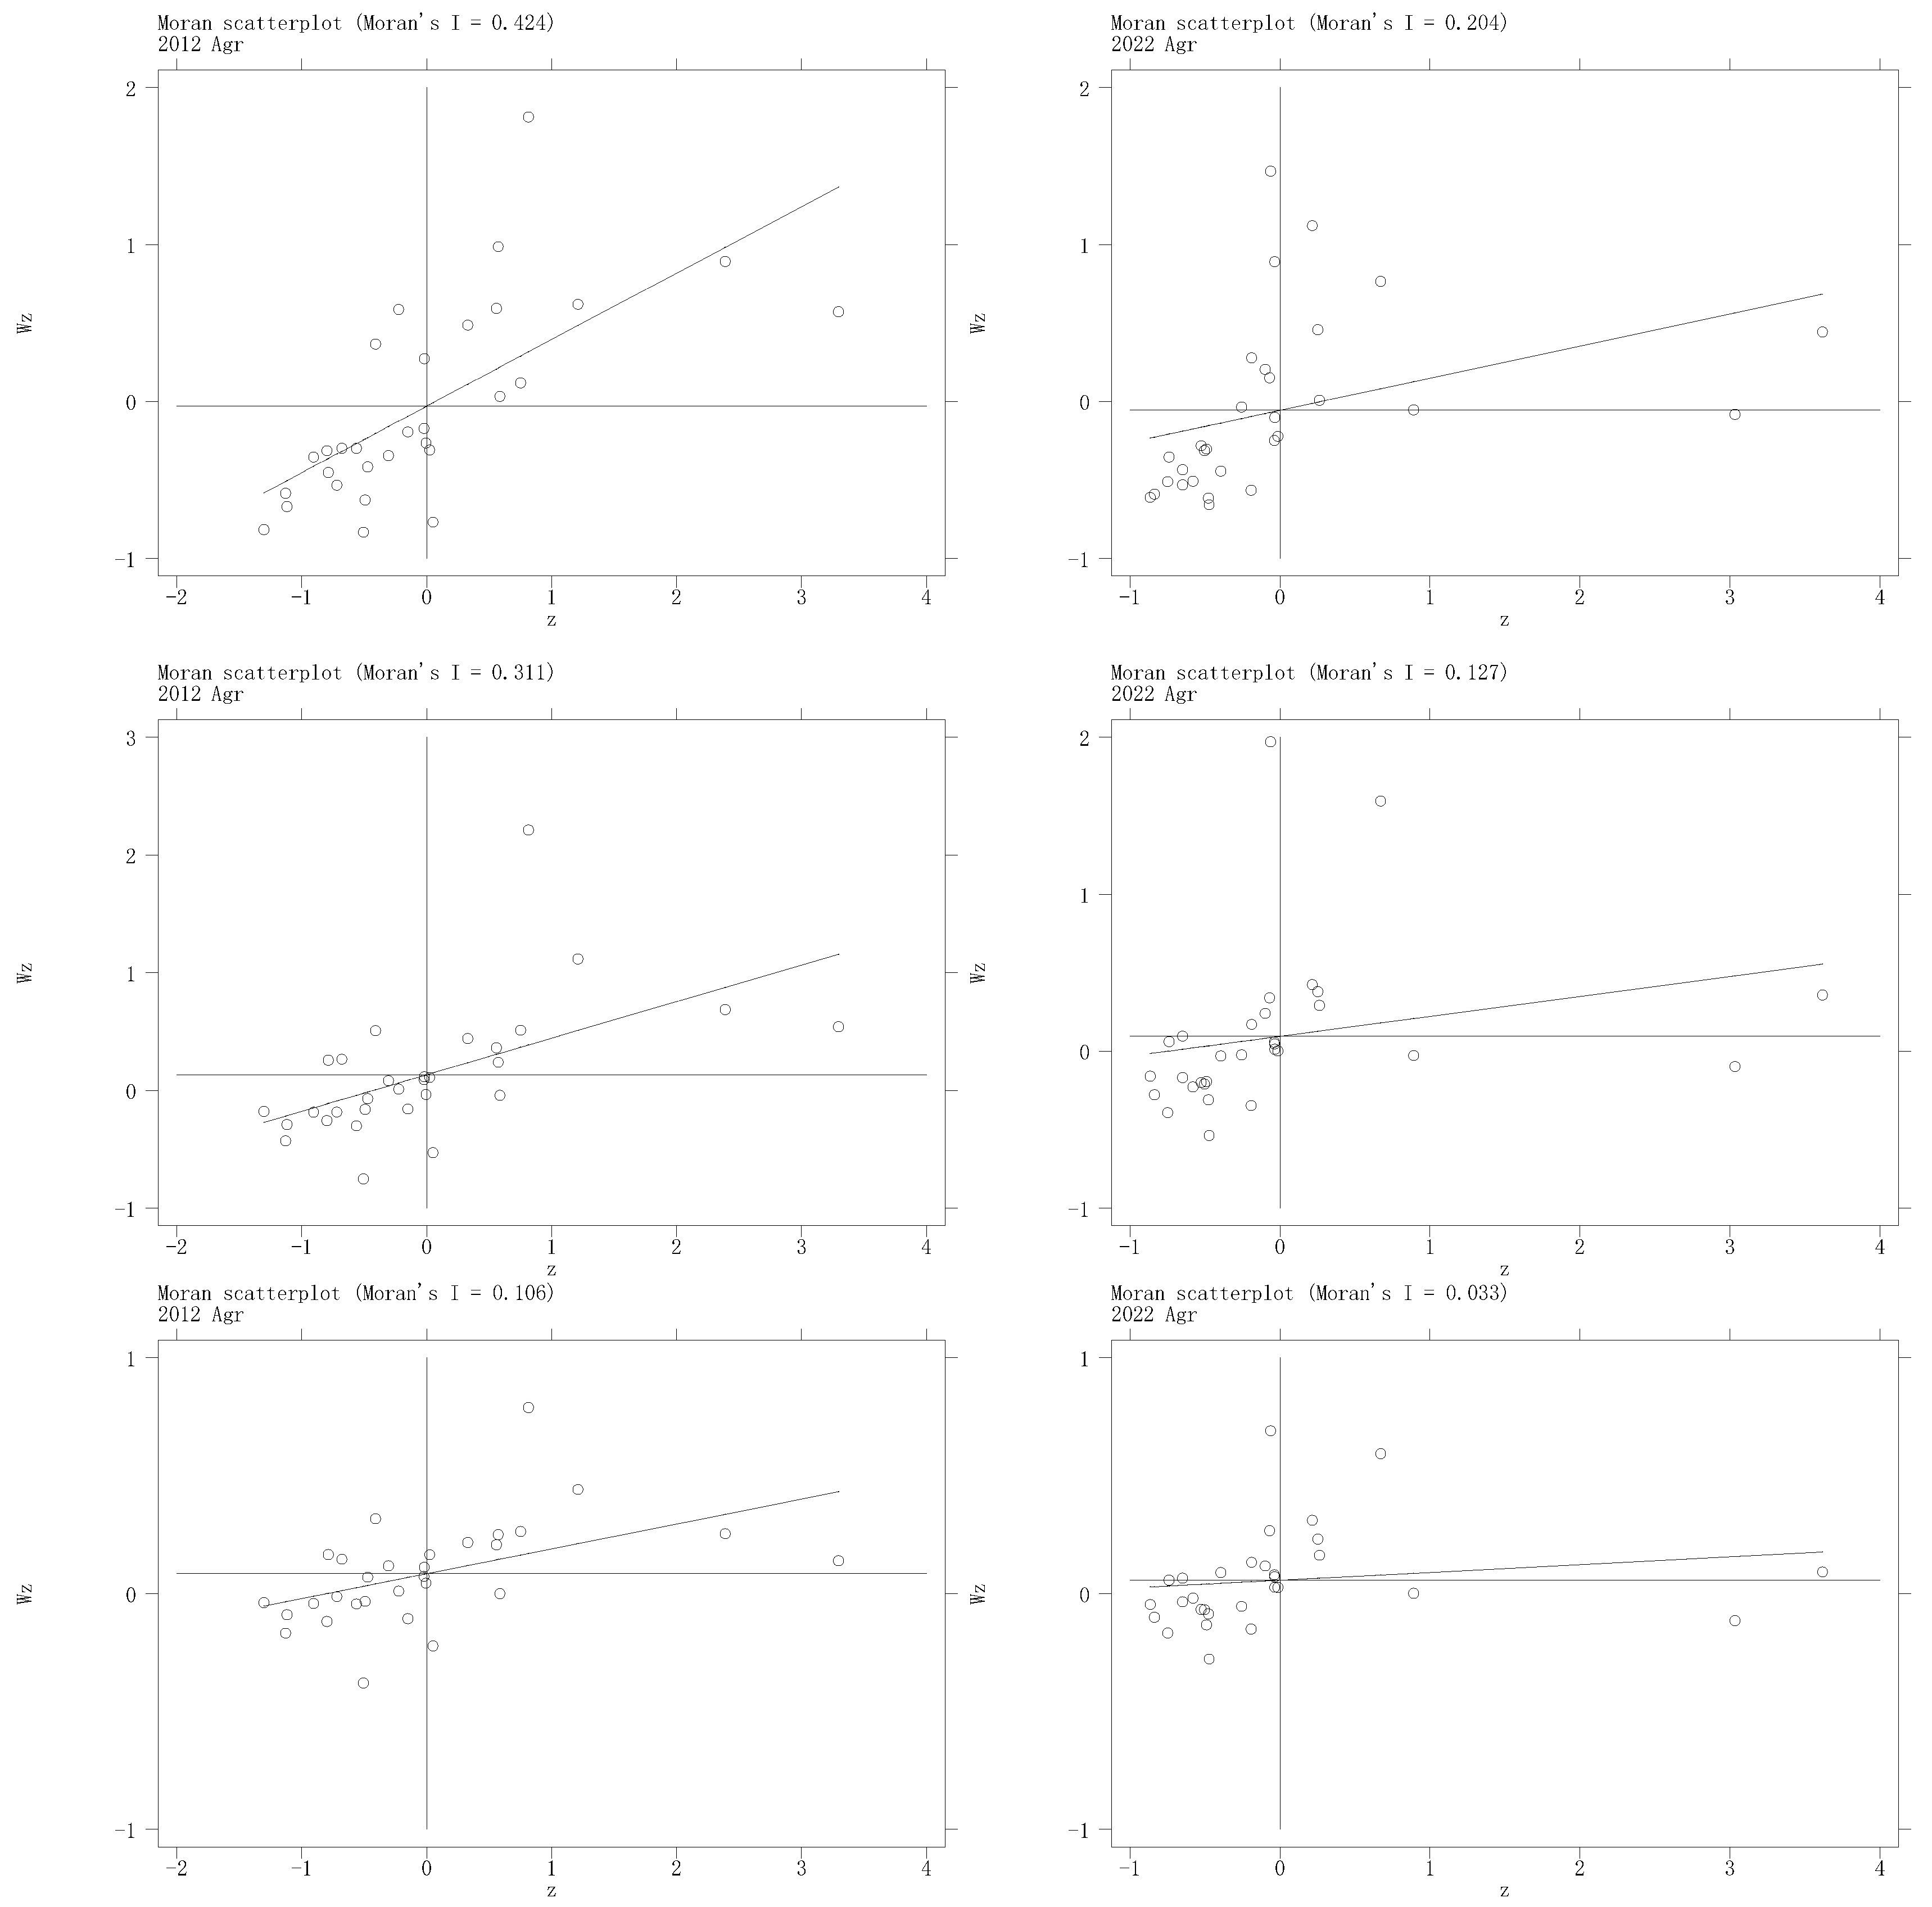
6.2.1. Spatial Correlation Analysis
6.2.2. Space–Time Evolution Characteristics Analysis
6.2.3. Decomposition of Spatial Effects
7. Conclusions and Implications
7.1. Discussion and Conclusions
7.2. Policy Implications
7.3. Limitations and Future Research
Author Contributions
Funding
Institutional Review Board Statement
Informed Consent Statement
Data Availability Statement
Conflicts of Interest
References
- Xia, X.; Chen, Z.; Zhang, H.; Zhao, M. Agricultural high-quality development: Digital empowerment and implementation path. Chin. Rural Econ. 2019, 35, 2–15. [Google Scholar]
- Pylianidis, C.; Osinga, S.; Athanasiadis, I.N. Introducing digital twins to agriculture. Comput. Electron. Agric. 2021, 184, 105942. [Google Scholar] [CrossRef]
- Jin, T.; Han, X. Robotic arms in precision agriculture: A comprehensive review of the technologies, applications, challenges, and future prospects. Comput. Electron. Agric. 2024, 221, 108938. [Google Scholar] [CrossRef]
- Zhang, X. Research on Evolution of Innovation Model under the Condition of Digital Economy. Economist 2019, 7, 32–39. [Google Scholar] [CrossRef]
- Abbate, S.; Centobelli, P.; Cerchione, R. The digital and sustainable transition of the agri-food sector. Technol. Forecast. Soc. Chang. 2023, 187, 122222. [Google Scholar] [CrossRef]
- Zhan, Y.; Gao, D.; Feng, M.; Yan, S. Digital finance, non-agricultural employment, and the income-increasing effect on rural households. Int. Rev. Financ. Anal. 2025, 98, 103897. [Google Scholar] [CrossRef]
- Sun, Y.; Miao, Y.; Xie, Z.; Wu, R. Drivers and barriers to digital transformation in agriculture: An evolutionary game analysis based on the experience of China. Agric. Syst. 2024, 221, 104136. [Google Scholar] [CrossRef]
- Dibbern, T.; Romani, L.A.S.; Massruhá, S. Main drivers and barriers to the adoption of Digital Agriculture technologies. Smart Agric. Technol. 2024, 8, 100459. [Google Scholar] [CrossRef]
- Samadder, S.; Pandya, S.P.; Lal, S.P. Bridging the Digital Divide in Agriculture: An Investigation to ICT Adoption for Sustainable Farming Practices in Banaskantha District of Gujarat, India. Int. J. Environ. Clim. Chang. 2023, 13, 1376–1384. [Google Scholar] [CrossRef]
- Escribà-Gelonch, M.; Liang, S.; van Schalkwyk, P.; Fisk, I.; Long, N.V.D.; Hessel, V. Digital Twins in Agriculture: Orchestration and Applications. J. Agric. Food Chem. 2024, 72, 10737–10752. [Google Scholar] [CrossRef]
- Runck, B.C.; Joglekar, A.; Silverstein, K.A.T.; Chan-Kang, C.; Pardey, P.G.; Wilgenbusch, J.C. Digital agriculture platforms: Driving data-enabled agricultural innovation in a world fraught with privacy and security concerns. Agron. J. 2022, 114, 2635–2643. [Google Scholar] [CrossRef]
- Papadimitropoulos, V.; Malamidis, H. Prefiguring the counter-hegemony of open cooperativism: The case of Open Food Network. J. Rural Stud. 2023, 101, 103067. [Google Scholar] [CrossRef]
- Mota, J.; Santos, J.N.; Alencar, R. Intertwining innovation and business networks for sustainable agricultural systems: A case study of carbon-neutral beef. Technol. Forecast. Soc. Chang. 2023, 190, 122429. [Google Scholar] [CrossRef]
- Räty, N.; Tuomisto, H.L.; Ryynänen, T. On what basis is it agriculture?: A qualitative study of farmers’ perceptions of cellular agriculture. Technol. Forecast. Soc. Chang. 2023, 196, 122797. [Google Scholar] [CrossRef]
- Engås, K.G.; Raja, J.Z.; Neufang, I.F. Decoding technological frames: An exploratory study of access to and meaningful engagement with digital technologies in agriculture. Technol. Forecast. Soc. Chang. 2023, 190, 122405. [Google Scholar] [CrossRef]
- Spykman, O.; Emberger-Klein, A.; Gabriel, A.; Gandorfer, M. Autonomous agriculture in public perception—German consumer segments’ view of crop robots. Comput. Electron. Agric. 2022, 202, 107385. [Google Scholar] [CrossRef]
- Xu, Q.; Zhong, M.; Cao, M. Does digital investment affect carbon efficiency? Spatial effect and mechanism discussion. Sci. Total Environ. 2022, 827, 154321. [Google Scholar] [CrossRef] [PubMed]
- Gorgan, M.; Hartvigsen, M. Development of agricultural land markets in countries in Eastern Europe and Central Asia. Land Use Policy 2022, 120, 106257. [Google Scholar] [CrossRef]
- Rijswijk, K.; Klerkx, L.; Bacco, M.; Bartolini, F.; Bulten, E.; Debruyne, L.; Dessein, J.; Scotti, I.; Brunori, G. Digital transformation of agriculture and rural areas: A socio-cyber-physical system framework to support responsibilisation. J. Rural Stud. 2021, 85, 79–90. [Google Scholar] [CrossRef]
- Jin, M.; Feng, Y.; Wang, S.; Chen, N.; Cao, F. Can the development of the rural digital economy reduce agricultural carbon emissions? A spatiotemporal empirical study based on China’s provinces. Sci. Total Environ. 2024, 939, 173437. [Google Scholar] [CrossRef]
- Hu, Y.; Liu, J.; Zhang, S.; Liu, Y.; Xu, H.; Liu, P. New mechanisms for increasing agricultural total factor productivity: Analysis of the regional effects of the digital economy. Econ. Anal. Policy 2024, 83, 766–785. [Google Scholar] [CrossRef]
- Costa, F.; Frecassetti, S.; Rossini, M.; Portioli-Staudacher, A. Industry 4.0 digital technologies enhancing sustainability: Applications and barriers from the agricultural industry in an emerging economy. J. Clean. Prod. 2023, 408, 137208. [Google Scholar] [CrossRef]
- Hackfort, S. Unlocking sustainability? The power of corporate lock-ins and how they shape digital agriculture in Germany. J. Rural Stud. 2023, 101, 103065. [Google Scholar] [CrossRef]
- Zhu, H.; Bao, W.; Qin, M. Impact analysis of digital trade on carbon emissions from the perspectives of supply and demand. Sci. Rep. 2024, 14, 14540. [Google Scholar] [CrossRef] [PubMed]
- Wang, H.; Jia, Y.; Zhao, R. Trend and Strategies of high-qlity Agricultural Development in the Yellow River Basin with Scientific and technological Innovation. Sci. Manag. Res. 2023, 41, 130–139. [Google Scholar] [CrossRef]
- Millard, J.; Fucci, V. The role of social innovation in tackling global poverty and vulnerability. Front. Sociol. 2023, 8, 966918. [Google Scholar] [CrossRef]
- Halperin, S.; Castro, A.J.; Quintas-Soriano, C.; Brandt, J.S. Assessing high quality agricultural lands through the ecosystem services lens: Insights from a rapidly urbanizing agricultural region in the western United States. Agric. Ecosyst. Environ. 2023, 349, 108435. [Google Scholar] [CrossRef]
- Ma, D.; Zhu, Q. Innovation in emerging economies: Research on the digital economy driving high-quality green development. J. Bus. Res. 2022, 145, 801–813. [Google Scholar] [CrossRef]
- Wolfert, S.; Ge, L.; Verdouw, C.; Bogaardt, M.-J. Big Data in Smart Farming—A review. Agric. Syst. 2017, 153, 69–80. [Google Scholar] [CrossRef]
- Prudhomme, R.; Brunelle, T.; Dumas, P.; Le Moing, A.; Zhang, X. Assessing the impact of increased legume production in Europe on global agricultural emissions. Reg. Environ. Chang. 2020, 20, 91. [Google Scholar] [CrossRef]
- Adesipo, A.; Fadeyi, O.; Kuca, K.; Krejcar, O.; Maresova, P.; Selamat, A.; Adenola, M. Smart and Climate-Smart Agricultural Trends as Core Aspects of Smart Village Functions. Sensors 2020, 20, 5977. [Google Scholar] [CrossRef] [PubMed]
- Hilário, S.; Gonçalves, M.F.M. Endophytic Diaporthe as Promising Leads for the Development of Biopesticides and Biofertilizers for a Sustainable Agriculture. Microorganisms 2022, 10, 2453. [Google Scholar] [CrossRef]
- Rangel-Peraza, J.G.; Sanhouse-García, A.J.; Flores-González, L.M.; Monjardín-Armenta, S.A.; Mora-Félix, Z.D.; Rentería-Guevara, S.A.; Bustos-Terrones, Y.A. Effect of land use and land cover changes on land surface warming in an intensive agricultural region. J. Environ. Manag. 2024, 371, 123249. [Google Scholar] [CrossRef]
- Putri, D.C.; Munandar, A.; Supriatno, B. The implementation of indigenous people local wisdom lekuk 50 tumbi in managing agriculture and lakes as biological learning sources. J. Phys. Conf. Ser. 2019, 1157, 022095. [Google Scholar] [CrossRef]
- Xiujie, H.; Cai, X.; Chu, X.; Ma, L.; Zuo, Z. Index construction and evaluation of high quality development in of agriculture in China. Chin. J. Agric. Resour. Reg. Plan. 2020, 41, 124–133. [Google Scholar]
- Yuan, X.; Zhang, J.; Shi, J.; Wang, J. What can green finance do for high-quality agricultural development? Fresh insights from China. Socio-Econ. Plan. Sci. 2024, 94, 101920. [Google Scholar] [CrossRef]
- Guo, X.; Wang, L.; Meng, X.; Dong, X.; Gu, L. The impact of digital inclusive finance on farmers’ income level: Evidence from China’s major grain production regions. Financ. Res. Lett. 2023, 58, 104531. [Google Scholar] [CrossRef]
- Li, L.; Han, J.; Zhu, Y. Empowering sustainability: How digital agricultural extensions influence organic fertilizer choices among Chinese farmers. J. Environ. Manag. 2024, 371, 123340. [Google Scholar] [CrossRef]
- Chen, C.; Ye, F.; Xiao, H.; Xie, W.; Liu, B.; Wang, L. The digital economy, spatial spillovers and forestry green total factor productivity. J. Clean. Prod. 2023, 405, 136890. [Google Scholar] [CrossRef]
- Wu, Y.; Bi, W.; Xiaohong, L.; Zhang, S. Digital Finance and Agricultural Total Factor Productivity—From the Perspective of Capital Deepening and Factor Structure. Financ. Res. Lett. 2024, 74, 106449. [Google Scholar] [CrossRef]
- Jia, X. Digital Economy, Factor Allocation, and Sustainable Agricultural Development: The Perspective of Labor and Capital Misallocation. Sustainability 2023, 15, 4418. [Google Scholar] [CrossRef]
- Hopkins, J.L. An investigation into emerging industry 4.0 technologies as drivers of supply chain innovation in Australia. Comput. Ind. 2021, 125, 103323. [Google Scholar] [CrossRef]
- Cui, X.; Cai, T.; Deng, W.; Zheng, R.; Jiang, Y.; Bao, H. Indicators for Evaluating High-Quality Agricultural Development: Empirical Study from Yangtze River Economic Belt, China. Soc. Indic. Res. 2022, 164, 1101–1127. [Google Scholar] [CrossRef]
- Lyu, Y.; Wang, W.; Wu, Y.; Zhang, J. Breaking mineral resource curse through digital economy: Resource-based regions’ sustainable path in the age of digitalization. Resour. Policy 2024, 99, 105379. [Google Scholar] [CrossRef]
- Guo, F.; Wang, J.; Wang, F.; Kong, T.; Zhang, X.; Cheng, Z. Measuring China’s Digital Financial Inclusion: Index Compilation and Spatial Characteristics. China Econ. Q. 2020, 19, 1401–1418. [Google Scholar] [CrossRef]
- Usman, A.; Naqvi, S.M.M.A.; Ozturk, I.; Hassan, A.; Arif, A. ICT-driven urbanization and energy security risk: Empirical evidence from Group 7 and Emerging 7 economies. Environ. Impact Assess. Rev. 2025, 112, 107809. [Google Scholar] [CrossRef]
- Gao, Y.D.; Wen, T.; Yi, W.; Wang, X.H. A spatial econometric study on effects of fiscal and financial supports for agriculture in China. Agric. Econ.-Zemed. Ekon. 2013, 59, 315–332. [Google Scholar] [CrossRef]
- Cao, K.H.; Birchenall, J.A. Agricultural productivity, structural change, and economic growth in post-reform China. J. Dev. Econ. 2013, 104, 165–180. [Google Scholar] [CrossRef]
- Sun, H.; Cao, Q.; Gu, T. Can agricultural export trade openness improve residents’ health in China. Econ. Anal. Policy 2024, 84, 1608–1620. [Google Scholar] [CrossRef]
- Lin, Q.; Jian, Y.; Zhang, D.; Li, J.; Mao, S. Exploring the “Double-Edged Sword” effect of the digital economy on sustainable agricultural development: Evidence from China. Sustain. Horiz. 2025, 13, 100122. [Google Scholar] [CrossRef]
- Mgendi, B.G.; Mao, S.; Qiao, F. Does agricultural training and demonstration matter in technology adoption? The empirical evidence from small rice farmers in Tanzania. Technol. Soc. 2022, 70, 102024. [Google Scholar] [CrossRef]
- Bilbao-Osorio, B.; Rodríguez-Pose, A. From R&D to Innovation and Economic Growth in the EU. Growth Chang. 2004, 35, 434–455. [Google Scholar] [CrossRef]
- Pu, G. Achieving agricultural revitalization: Performance of technical innovation inputs in farmland and water conservation facilities. Alex. Eng. J. 2022, 61, 2851–2858. [Google Scholar] [CrossRef]
- Zhou, Q.; Cheng, C.; Fang, Z.; Zhang, H.; Xu, Y. How does the development of the digital economy affect innovation output? Exploring mechanisms from the perspective of regional innovation systems. Struct. Chang. Econ. Dyn. 2024, 70, 1–17. [Google Scholar] [CrossRef]
- Belhadi, A.; Kamble, S.; Benkhati, I.; Gupta, S.; Mangla, S.K. Does strategic management of digital technologies influence electronic word-of-mouth (eWOM) and customer loyalty? Empirical insights from B2B platform economy. J. Bus. Res. 2023, 156, 113548. [Google Scholar] [CrossRef]
- Li, M.; Yang, J. Can digital economy mitigate vertical fiscal imbalances in Chinese local government? The role of fiscal transparency. Int. Rev. Financ. Anal. 2024, 96, 103713. [Google Scholar] [CrossRef]
- Kafouros, M.I.; Buckley, P.J. Under what conditions do firms benefit from the research efforts of other organizations? Res. Policy 2008, 37, 225–239. [Google Scholar] [CrossRef]
- Zhu, S.; Yu, C.; He, C. Export structures, income inequality and urban-rural divide in China. Appl. Geogr. 2020, 115, 102150. [Google Scholar] [CrossRef]
- Yan, D.; Sun, W.; Li, P.; Liu, C.; Li, Y. Effects of economic growth target on the urban–rural income gap in China: An empirical study based on the urban bias theory. Cities 2025, 156, 105518. [Google Scholar] [CrossRef]
- Hua, J.G.; Yu, J.J.; Song, Y.; Xue, Q.; Zhou, Y.J. The Enabling Effect of Digital Economy on High-Quality Agricultural Development-Evidence from China. Sustainability 2024, 16, 3859. [Google Scholar] [CrossRef]
- Gao, D.D.; Lyu, X.G. Agricultural total factor productivity, digital economy and agricultural high-quality development. PLoS ONE 2023, 18, e0292001. [Google Scholar] [CrossRef] [PubMed]
- Zhang, Y.F.; Ji, M.X.; Zheng, X.Z. Digital Economy, Agricultural Technology Innovation, and Agricultural Green Total Factor Productivity. Sage Open 2023, 2023, 1–13. [Google Scholar] [CrossRef]
- Wang, M.Y.; Ren, S.Y.; Xie, G. Going “green trade”: Assessing the impact of digital technology application on green product export. Technol. Soc. 2024, 77, 102487. [Google Scholar] [CrossRef]
- Song, Z.Y.; Wang, C.; Bergmann, L. China’s prefectural digital divide: Spatial analysis and multivariate determinants of ICT diffusion. Int. J. Inf. Manag. 2020, 52, 102072. [Google Scholar] [CrossRef]


| Indicator | Basic Indicators | Explanation | Direction | Weight |
|---|---|---|---|---|
| Growth Catalysts | Number of patents granted | Direct data | + | 0.1023 |
| Agricultural GDP yield per acre | Agricultural output value per unit of sown area | + | 0.0440 | |
| Level of farm mechanization | Agricultural machinery power per unit of sown area | + | 0.0420 | |
| Three expenditures for science | Local government spending on science and technology as a percentage of the overall local budget | + | 0.0475 | |
| Structural Efficiency | Level of industrial coordination | Contribution of the primary sector to GDP | + | 0.0261 |
| Consumption level of rural residents | Per capita rural consumption expenditure | + | 0.0214 | |
| Government subsidies for agriculture | Local government spending on agriculture, forestry, and water resources as a percentage of the overall local budget | + | 0.0185 | |
| Rural Engel coefficient | Proportion of rural residents’ consumption expenditure allocated to food | − | 0.0066 | |
| Agricultural sector restructuring index | Ratio of the output of agriculture, forestry, livestock, and fisheries to the total output of agriculture | + | 0.017 | |
| Sustainable Practice | Forest coverage rate | Forest area relative to total land area | + | 0.0330 |
| Pesticide use per unit area | Pesticide application per total sown acreage | − | 0.0040 | |
| Agricultural plastic film usage per acre | Use of agricultural plastic films per total sown acreage | − | 0.0050 | |
| Fertilizer use per unit area | Volume of agricultural fertilizer applied compared to the total area planted | − | 0.0093 | |
| Total agricultural water use | Direct data | − | 0.0112 | |
| Agricultural energy consumption | Ratio of energy consumption of agriculture, forestry, animal husbandry, and fishery to output value | − | 0.0054 | |
| Inclusive Progress | Reliance on agricultural exports | Export volumes of agricultural products as a fraction of primary industry value added | + | 0.1577 |
| Reliance on agricultural imports | Import volumes of agricultural products as a fraction of primary industry value added | + | 0.3287 | |
| Equitable Distribution | Number of village clinics | Direct data | + | 0.0557 |
| Urban–rural consumption gap | Ratio of urban to rural per capita disposable income | − | 0.0042 | |
| Urban–rural income ratio | Ratio of urban to rural per capita consumption expenditure | − | 0.0102 | |
| Per capita disposable income of residents | Direct data | + | 0.0300 | |
| Rural residents’ living standards | Rural per capita spending on culture, education, and entertainment | + | 0.0206 |
| Primary Indicator | Secondary Indicators | Direction | Weight |
|---|---|---|---|
| Digital infrastructure | Domain count | + | 0.0058 |
| IPv4 site count | + | 0.0785 | |
| Mobile phone adoption rate | + | 0.0130 | |
| Number of access points for broadband internet | + | 0.0348 | |
| Number of access users for broadband internet | + | 0.0401 | |
| Long-distance cable length per unit area | + | 0.0750 | |
| Cell phone base station density | + | 0.1025 | |
| Digital industrialization | Sales generated from e-commerce | + | 0.0848 |
| Websites available per 100 businesses | + | 0.0065 | |
| Software industry revenue as a share of GDP | + | 0.1116 | |
| Percentage of businesses engaged in e-commerce | + | 0.0206 | |
| Number of informatization enterprises | + | 0.1141 | |
| Number of 5G invention patent applications | + | 0.1456 | |
| Express volume | + | 0.1217 | |
| Digital-inclusive finance | Digitization index | + | 0.0175 |
| Depth of use index | + | 0.0159 | |
| Breadth of coverage index | + | 0.0120 |
| Variable Type | Variable Name | Symbol | Measurement Method |
|---|---|---|---|
| Explained Variable | High-quality agricultural development | Agr | Entropy method |
| Core Explanatory Variable | Digital economy | Dig | Entropy method |
| Control Variables | Urbanization level | Urb | Urban population as a percentage of year-end total residents |
| Government intervention | Gov | Ratio of general fiscal budget expenditures to gross regional product | |
| Rural human capital | Edu | Average duration of formal education among rural inhabitants | |
| Industrial structure adjustment | Str | Added value from the secondary and tertiary sectors/the added value from the primary sector | |
| Openness to external markets | Ope | (Total import and export of goods × USD to RMB exchange rate)/gross regional product | |
| Regional resource endowment | Res | Logarithm of total water resources by region | |
| Agricultural technology training | Att | Logarithm of the number of graduates from rural adult cultural and technical training schools |
| Indicator | Basic Indicators | Explanation |
|---|---|---|
| Input Factors | Labor input | Number of employees engaged in crop production |
| Land input | Total sown area of crops | |
| Agricultural machinery input | Total power of agricultural machinery | |
| Fertilizer input | Quantity of chemical fertilizers used in agriculture | |
| Pesticide input | Amount of pesticide applied | |
| Agricultural film input | Amount of agricultural plastic film used | |
| Irrigation input | Area of effectively irrigated agricultural land | |
| Desirable Outputs | Gross agricultural output value | Total output value of crop production |
| Agricultural carbon sequestration | Total amount of carbon sequestration by crops | |
| Undesirable Outputs | Agricultural carbon emissions | Total carbon emissions from crop production |
| Agricultural non-point source pollution | Discharge of non-point source pollutants from crop production |
| Variables | N | Mean | SD | Min | Max |
|---|---|---|---|---|---|
| Agr | 330 | 0.190 | 0.0850 | 0.0850 | 0.669 |
| Dig | 330 | 0.125 | 0.0920 | 0.0130 | 0.444 |
| Urb | 330 | 0.607 | 0.117 | 0.363 | 0.896 |
| Gov | 330 | 0.249 | 0.102 | 0.107 | 0.643 |
| Edu | 330 | 7.831 | 0.607 | 5.848 | 9.884 |
| Str | 330 | 29.590 | 70.280 | 2.957 | 459.300 |
| Ope | 330 | 0.260 | 0.274 | 0.008 | 1.441 |
| Res | 330 | 6.067 | 1.435 | 2.092 | 8.082 |
| Att | 330 | 12.47 | 2.095 | 6.332 | 15.54 |
| Tec1 | 330 | 0.0180 | 0.0120 | 0.00400 | 0.0680 |
| Tec2 | 330 | 0.0310 | 1.001 | −0.964 | 4.302 |
| Tec3 | 330 | 0.701 | 0.234 | 0.251 | 1.201 |
| Method | Results | ||
|---|---|---|---|
| 0–1 Neighborhood Matrix | Geographic Distance Matrix | Economic Geography Matrix | |
| LR spatial lag | 81.137 *** | 85.119 *** | 127.837 *** |
| LR spatial error | 93.708 *** | 95.342 *** | 58.785 *** |
| Wald spatial lag | 104.63 *** | 45.32 *** | 48.84 *** |
| Wald spatial error | 90.67 *** | 27.23 *** | 22.67 *** |
| Hausman Test | 21.81 *** | 22.98 *** | 30.92 *** |
| Variables | FE | DIF-GMM | SYS-GMM |
|---|---|---|---|
| (1) | (2) | (3) | |
| Dig | 0.0384 *** | 0.0856 *** | 0.0952 *** |
| (0.0146) | (0.0094) | (0.0347) | |
| Urb | 0.3548 *** | −0.2443 | −0.1105 ** |
| (0.0246) | (0.1909) | (0.0451) | |
| Gov | −0.0129 | −0.0026 | −0.1543 *** |
| (0.0277) | (0.0806) | (0.0537) | |
| Edu | 0.0101 ** | −0.0074 | −0.0047 |
| (0.0046) | (0.0138) | (0.0037) | |
| Str | 0.0012 *** | 0.0009 *** | 0.0007 *** |
| (0.0000) | (0.0002) | (0.0001) | |
| Ope | −0.0033 | 0.0597 * | 0.0312 ** |
| (0.0127) | (0.0336) | (0.0127) | |
| Res | −0.0029 | −0.0031 | 0.0057 * |
| (0.0025) | (0.0056) | (0.0029) | |
| Att | 0.0008 | 0.0065 *** | −0.0015 |
| (0.0010) | (0.0025) | (0.0012) | |
| _cons | −0.1336 *** | −0.5458 *** | 0.1865 *** |
| (0.0427) | (0.0698) | (0.0671) | |
| AR (2) | 0.230 | 0.107 | |
| Sargan | 0.896 | 0.796 | |
| Hansen | 1.000 | 1.000 | |
| N | 330 | 270 | 300 |
| R2 | 0.8915 |
| Variables | Replacement of Core Explanatory Variables | Replacement of Explained Variable | ||||
|---|---|---|---|---|---|---|
| FE | DIF-GMM | SYS-GMM | FE | DIF-GMM | SYS-GMM | |
| (1) | (2) | (3) | (4) | (5) | (6) | |
| Dig_PCA | 0.1194 *** | 0.1209 *** | 0.1155 *** | 1.4741 *** | 0.5512 *** | 0.6734 *** |
| (0.0325) | (0.0141) | (0.0142) | (0.4913) | (0.1448) | (0.1070) | |
| _cons | 0.1096 | −0.2116 *** | −0.0701 *** | −1.7463 | −2.6853 *** | −0.3915 ** |
| (0.0743) | (0.0287) | (0.0214) | (1.0897) | (0.3239) | (0.1751) | |
| Control | Yes | Yes | Yes | Yes | Yes | Yes |
| AR (2) | 0.429 | 0.494 | 0.107 | 0.114 | ||
| Sargan | 0.996 | 0.505 | 0.828 | 0.247 | ||
| Hansen | 0.999 | 0.867 | 1.000 | 1.000 | ||
| N | 330 | 270 | 300 | 330 | 270 | 300 |
| R2 | 0.9841 | 0.9866 | ||||
| Variables | Removal of Anomalous Data | 1% Bilateral Shrinkage | Considering External Shocks | ||||||
|---|---|---|---|---|---|---|---|---|---|
| FE | DIF-GMM | SYS-GMM | FE | DIF-GMM | SYS-GMM | FE | DIF-GMM | SYS-GMM | |
| (1) | (2) | (3) | (4) | (5) | (6) | (7) | (8) | (9) | |
| Dig | 0.0186 *** | 0.0135 *** | 0.0130 *** | 0.0350 ** | 0.0266 *** | 0.0363 *** | 0.0362 *** | 0.1570 ** | 0.0159 ** |
| (0.0075) | (0.0013) | (0.0052) | (0.0157) | (0.0101) | (0.0107) | (0.0103) | (0.0732) | (0.0074) | |
| _cons | 0.1420 *** | −0.0910 | 0.0575 | 0.2249 *** | −0.0051 | 0.1337 ** | 0.1592 ** | 0.3182 | −0.0705 * |
| (0.0426) | (0.1056) | (0.0502) | (0.0781) | (0.0656) | (0.0647) | (0.0735) | (0.4895) | (0.0401) | |
| Control | Yes | Yes | Yes | Yes | Yes | Yes | Yes | Yes | Yes |
| AR (2) | 0.846 | 0.459 | 0.357 | 0.430 | 0.751 | 0.159 | |||
| Sargan | 0.309 | 0.577 | 0.997 | 0.697 | 0.143 | 0.095 | |||
| Hansen | 0.998 | 0.989 | 1.000 | 0.792 | 0.263 | 0.267 | |||
| N | 286 | 234 | 260 | 330 | 270 | 300 | 270 | 120 | 180 |
| R2 | 0.972 | 0.9813 | 0.9824 | ||||||
| Variables | Innovation Input | Innovation Output | Innovation Efficiency | ||||||
|---|---|---|---|---|---|---|---|---|---|
| FE | DIF-GMM | SYS-GMM | FE | DIF-GMM | SYS-GMM | FE | DIF-GMM | SYS-GMM | |
| (1) | (2) | (3) | (4) | (5) | (6) | (7) | (8) | (9) | |
| Dig | 0.0041 ** | 0.0060 ** | 0.0030 ** | 2.1646 *** | 1.6839 *** | 0.6870 *** | 0.0465 *** | 0.3640 *** | 0.2736 *** |
| (0.0016) | (0.0030) | (0.0015) | (0.5824) | (0.6283) | (0.1773) | (0.0148) | (0.0998) | (0.0342) | |
| _cons | 0.0089 | −0.0041 | −0.0018 | −0.1026 | 0.8201 | −4.4712 *** | 0.9013 | 0.1709 | 0.2710 ** |
| (0.0082) | (0.0104) | (0.0034) | (2.0048) | (4.3353) | (0.6165) | (0.5697) | (0.6635) | (0.1112) | |
| Control | Yes | Yes | Yes | Yes | Yes | Yes | Yes | Yes | Yes |
| AR (2) | 0.273 | 0.257 | 0.076 | 0.082 | 0.968 | 0.589 | |||
| Sargan | 0.943 | 0.407 | 0.981 | 0.231 | 0.250 | 0.651 | |||
| Hansen | 1.000 | 1.000 | 1.000 | 0.580 | 0.993 | 0.757 | |||
| N | 330 | 270 | 300 | 330 | 270 | 300 | 330 | 270 | 300 |
| R2 | 0.9847 | 0.8391 | 0.8364 | ||||||
| Variables | Higher Degree of Intellectual Property Protection | Lower Degree of Intellectual Property Protection | ||||
|---|---|---|---|---|---|---|
| FE | DIF-GMM | SYS-GMM | FE | DIF-GMM | SYS-GMM | |
| (1) | (2) | (3) | (4) | (5) | (6) | |
| Dig | 0.0335 *** | 0.0351 *** | 0.0200 *** | 0.0229 | 0.0021 | 0.0139 |
| (0.0054) | (0.0023) | (0.0012) | (0.0171) | (0.0077) | (0.0101) | |
| _cons | 0.5930 *** | 0.2622 ** | 0.4756 *** | 0.0904 | 0.0036 | 0.0201 |
| (0.1148) | (0.1281) | (0.1700) | (0.0592) | (0.0035) | (0.0473) | |
| Control | Yes | Yes | Yes | Yes | Yes | Yes |
| AR (2) | 0.212 | 0.608 | 0.374 | 0.354 | ||
| Sargan | 0.997 | 0.351 | 0.229 | 0.934 | ||
| Hansen | 1.000 | 1.000 | 1.000 | 1.000 | ||
| N | 174 | 162 | 169 | 156 | 108 | 131 |
| R2 | 0.9137 | 0.9808 | ||||
| Variables | Greater Urban–Rural Income Gap | Smaller Urban–Rural Income Gap | ||||
|---|---|---|---|---|---|---|
| FE | DIF-GMM | SYS-GMM | FE | DIF-GMM | SYS-GMM | |
| (1) | (2) | (3) | (4) | (5) | (6) | |
| Dig | 0.1027 *** | 0.1257 *** | 0.0631 ** | 0.0050 | 0.0701 * | 0.0200 |
| (0.0328) | (0.0195) | (0.0272) | (0.0106) | (0.0419) | (0.0612) | |
| _cons | 0.3765 *** | 0.0186 | −0.1111 | 0.0587 | 0.0455 | −0.0270 |
| (0.1430) | (0.0724) | (0.1150) | (0.0766) | (0.1479) | (0.1462) | |
| Control | Yes | Yes | Yes | Yes | Yes | Yes |
| AR (2) | 0.364 | 0.332 | 0.143 | 0.106 | ||
| Sargan | 0.990 | 0.522 | 0.998 | 0.817 | ||
| Hansen | 1.000 | 1.000 | 1.000 | 0.950 | ||
| N | 174 | 162 | 169 | 156 | 108 | 131 |
| R2 | 0.9763 | 0.9948 | ||||
| Year | 0–1 Neighborhood Matrix | Geographic Distance Matrix | Economic Geography Matrix | |||
|---|---|---|---|---|---|---|
| Moran’s I | Z Value | Moran’s I | Z Value | Moran’s I | Z Value | |
| 2012 | 0.312 *** | 0.000 | 0.311 *** | 0.000 | 0.106 *** | 0.000 |
| 2013 | 0.343 *** | 0.000 | 0.345 *** | 0.000 | 0.120 *** | 0.000 |
| 2014 | 0.321 *** | 0.000 | 0.338 *** | 0.000 | 0.115 *** | 0.000 |
| 2015 | 0.288 *** | 0.001 | 0.299 *** | 0.000 | 0.098 *** | 0.000 |
| 2016 | 0.281 *** | 0.001 | 0.270 *** | 0.000 | 0.090 *** | 0.000 |
| 2017 | 0.227 *** | 0.005 | 0.208 *** | 0.002 | 0.065 *** | 0.001 |
| 2018 | 0.219 *** | 0.006 | 0.193 *** | 0.004 | 0.058 *** | 0.001 |
| 2019 | 0.195 *** | 0.010 | 0.166 *** | 0.009 | 0.046 *** | 0.004 |
| 2020 | 0.223 *** | 0.005 | 0.201 *** | 0.003 | 0.059 *** | 0.001 |
| 2021 | 0.174 ** | 0.015 | 0.132 ** | 0.021 | 0.035 *** | 0.009 |
| 2022 | 0.175 ** | 0.015 | 0.127 ** | 0.025 | 0.033 ** | 0.011 |
| Variables | 0–1 Neighborhood Matrix | Geographic Distance Matrix | Economic Geography Matrix | ||||||
|---|---|---|---|---|---|---|---|---|---|
| Direct | Indirect | Total | Direct | Indirect | Total | Direct | Indirect | Total | |
| (1) | (2) | (3) | (4) | (5) | (6) | (7) | (8) | (9) | |
| Dig | 0.018 *** | 0.100 *** | 0.118 *** | 0.039 *** | 0.182 *** | 0.221 *** | 0.044 *** | 0.467 *** | 0.511 *** |
| (0.006) | (0.029) | (0.033) | (0.012) | (0.034) | (0.038) | (0.012) | (0.103) | (0.107) | |
| Control | Yes | Yes | Yes | Yes | Yes | Yes | Yes | Yes | Yes |
| ρ | 0.177 ** | 0.129 | −0.077 | ||||||
| (0.069) | (0.092) | (0.193) | |||||||
| sigma2_e | 0.000 *** | 0.000 *** | 0.000 *** | ||||||
| (0.00) | (0.00) | (0.00) | |||||||
| N | 330 | 330 | 330 | 330 | 330 | 330 | 330 | 330 | 330 |
| R2 | 0.463 | 0.463 | 0.463 | 0.635 | 0.635 | 0.635 | 0.514 | 0.514 | 0.514 |
Disclaimer/Publisher’s Note: The statements, opinions and data contained in all publications are solely those of the individual author(s) and contributor(s) and not of MDPI and/or the editor(s). MDPI and/or the editor(s) disclaim responsibility for any injury to people or property resulting from any ideas, methods, instructions or products referred to in the content. |
© 2025 by the authors. Licensee MDPI, Basel, Switzerland. This article is an open access article distributed under the terms and conditions of the Creative Commons Attribution (CC BY) license (https://creativecommons.org/licenses/by/4.0/).
Share and Cite
Liang, J.; Qiao, C. Digital Economy and High-Quality Agricultural Development: Mechanisms of Technological Innovation and Spatial Spillover Effects. Sustainability 2025, 17, 3639. https://doi.org/10.3390/su17083639
Liang J, Qiao C. Digital Economy and High-Quality Agricultural Development: Mechanisms of Technological Innovation and Spatial Spillover Effects. Sustainability. 2025; 17(8):3639. https://doi.org/10.3390/su17083639
Chicago/Turabian StyleLiang, Jingyi, and Cuixia Qiao. 2025. "Digital Economy and High-Quality Agricultural Development: Mechanisms of Technological Innovation and Spatial Spillover Effects" Sustainability 17, no. 8: 3639. https://doi.org/10.3390/su17083639
APA StyleLiang, J., & Qiao, C. (2025). Digital Economy and High-Quality Agricultural Development: Mechanisms of Technological Innovation and Spatial Spillover Effects. Sustainability, 17(8), 3639. https://doi.org/10.3390/su17083639