Article

How to Fit Energy Demand Under the Constraint of EU 2030 and FIT for 55 Goals: An Italian Case Study

by
Hamid Safarzadeh
* and
Francesco Di Maria
LAR5 Laboratory, Dipartimento di Ingegneria, University of Perugia, Via G. Duranti 93, 06125 Perugia, Italy
*
Author to whom correspondence should be addressed.
Sustainability 2025, 17(8), 3743; https://doi.org/10.3390/su17083743
Submission received: 24 February 2025 / Revised: 15 April 2025 / Accepted: 17 April 2025 / Published: 21 April 2025

Abstract

:
Replacing approximately 7,000,000 internal combustion vehicles by 2030 with battery electric vehicles (BEVs) and promoting renewable energy sources are among the main strategies for decreasing greenhouse gas emissions and pollution in urban areas proposed in the EU FIT 55 program. Increasing the number of BEVs will lead to an increase in the electrical energy demand, which, according to the FIT 55 program, will be mainly supplied by the exploitation of renewable energies. In the present study, several possible scenarios were investigated for supplying the electrical energy necessary for the 7,000,000 BEVs within the goals imposed by FIT 55. To address this objective, four scenarios were proposed and analyzed for Italy, paying attention to the renewable energy share imposed by the EU on this country. The scenarios were photovoltaic-based; wind based; nuclear power-based; and thermal resource-based. The results show that if the EU FIT 55 goals are realized and 20% of the current number of internal combustion vehicles are replaced by BEV ones, there will be an energy imbalance at different times of the day. In the first scenario, if photovoltaic resources are used to the maximum extent to address the energy deficit, a 5.5-fold increase in the number of solar panels is required compared to 2023. In the second scenario, a 2.6-fold increase in the number of existing wind turbines is estimated to be required. In the third scenario, the supply of the energy deficit from nuclear resources with the production of 8.5 kWh in the daily energy cycle is examined. The use of the BESS to store excess energy at certain hours of the day and during energy shortage hours has been examined, indicating that on average, based on different scenarios, a system with a minimum capacity of 24 gigawatts and a maximum of about 130 gigawatts will be required. The fourth scenario is also possible based on the Fit for 55 targets and the use of thermal resources. An increase of 10 to 25 gigawatts is visible in each scenario during peak energy production hours. Also, a comparison of the scenarios shows that the energy storage during the surplus hours of scenario 1 is much greater than in the other scenarios.

Graphical Abstract

1. Introduction

The transition from internal combustion engine (ICE) vehicles to battery electric vehicles (BEVs) represents a crucial step toward achieving the European Union’s climate and energy goals. As part of the Fit for 55 (FIT 55) package, Italy is committed to reducing greenhouse gas emissions by at least 55% by 2030, which necessitates a significant transformation of the transportation and energy sectors. One major challenge in this transition is the impact that widespread BEV adoption will have on the country’s electrical grid. In this context, replacing 7 million ICE-powered vehicles with an equivalent number of BEVs will substantially increase the electricity demand, requiring a strategic approach to ensure grid stability and energy sufficiency. Without proper planning, this surge in electricity consumption could lead to grid congestion, demand peaks, and challenges in balancing supply from renewable sources. Therefore, it is essential to evaluate how Italy’s daily electricity demand can be managed effectively while aligning with FIT for 55 constraints [1,2].
The transport sector in the European Union is responsible for 25% of greenhouse gas emissions, of which 14.4% are related to aviation, 13.5% are related to maritime transport, 1% are related to rail transport, and the rest are related to another area, and a significant portion, nearly 71%, are related to road transport [3,4]. Therefore, countries are trying to reduce the use of fossil fuel vehicles and replace them with electric vehicles. Currently, 95% of transport vehicles in Europe use fossil fuels to supply vehicle energy, and only 5% of vehicles use electric energy. In Italy, extensive research is also being carried out to replace fossil fuel vehicles with electric vehicles. Today, air pollution has become an undeniable challenge for the world with the increase in the input of greenhouse gas pollutants, especially CO2, and the subsequent increase in global temperature. The intensity of CO2 emissions has increased faster since 2000. As can be seen in Figure 1, CO2 emissions in 1940 were approximately 4.85 billion tons per year, which increased to 25.2 billion tons in 2000 and to more than 37 billion tons in 2023, which is a significant figure, with 15% of these emissions coming from the transportation sector [5,6,7].
With the increase in the production of energy and its consumption by electric vehicles, the daily consumption of electric energy will undergo extensive changes; therefore, considering the existing resources and the supply of electric, energy requires a new approach. In 2023, nearly 40 million cars were circulating in Italian cities and roads, of which 81% were small cars, 17% were medium-sized cars, and 2% were large cars. The fuel used by these cars was mainly gasoline and diesel. The peak of the traffic and refueling of these cars was between 9 and 11 a.m. and 5 to 7 p.m. By replacing internal combustion cars with electric cars, the energy consumption pattern will change because the charging hours of these cars will mainly be from 10 p.m. to 7 a.m. and in the middle of the day between 12 and 4 p.m. [8,9,10].
There are various sources of energy supply, which are mainly divided into renewable sources (such as solar energy, wind energy, hydroelectricity, and biomass) and non-renewable sources (such as natural gas, coal, and fossil fuels). The use of non-renewable sources to supply countries with daily energy is an easy and accessible method. On the other hand, it has many destructive environmental effects, the most important of which is an increase in CO2 emissions, followed by ozone layer depletion and global warming [11,12]. In this regard, the European Union has taken a big step towards reducing greenhouse gas emissions with the “FIT for 55” policy package. This policy aims to reduce CO2 emissions by 55% by 2030 compared to 1990 [13,14]. This is only a short-term goal for the EU member states, and the main goal is to be “the first climate-neutral continent by 2050”. This package was proposed in 2019; however, with the increase in military conflict with the war between Russia and Ukraine, the European Union decided to prepare an amendment to this package in 2022. According to this new policy, new medium-term goals have been set for countries, which, in addition to reducing CO2 emissions, are aimed at reducing gas consumption and, as a result, reducing gas imports from Russia. Supporting economic and social solidarity between EU member states, the European Union has separated the goals of each country for the “FIT for 55” policy package based on geographical and economic conditions (Figure 2) [14,15,16]. This table shows the goals approved in 2019 and the new goals after added the start of the Russian war against Ukraine (approved in 2022).
Each country’s packages include various goals, such as reducing fossil fuel production and consumption, increasing the production of hydrogen as a clean fuel, increasing forest areas, estimating each country’s income and current expenses, cutting methane emissions, increasing the use of renewable energy, and levying energy taxes [15,17,18]. Table 1 shows the projected goals for Italy in 2030.
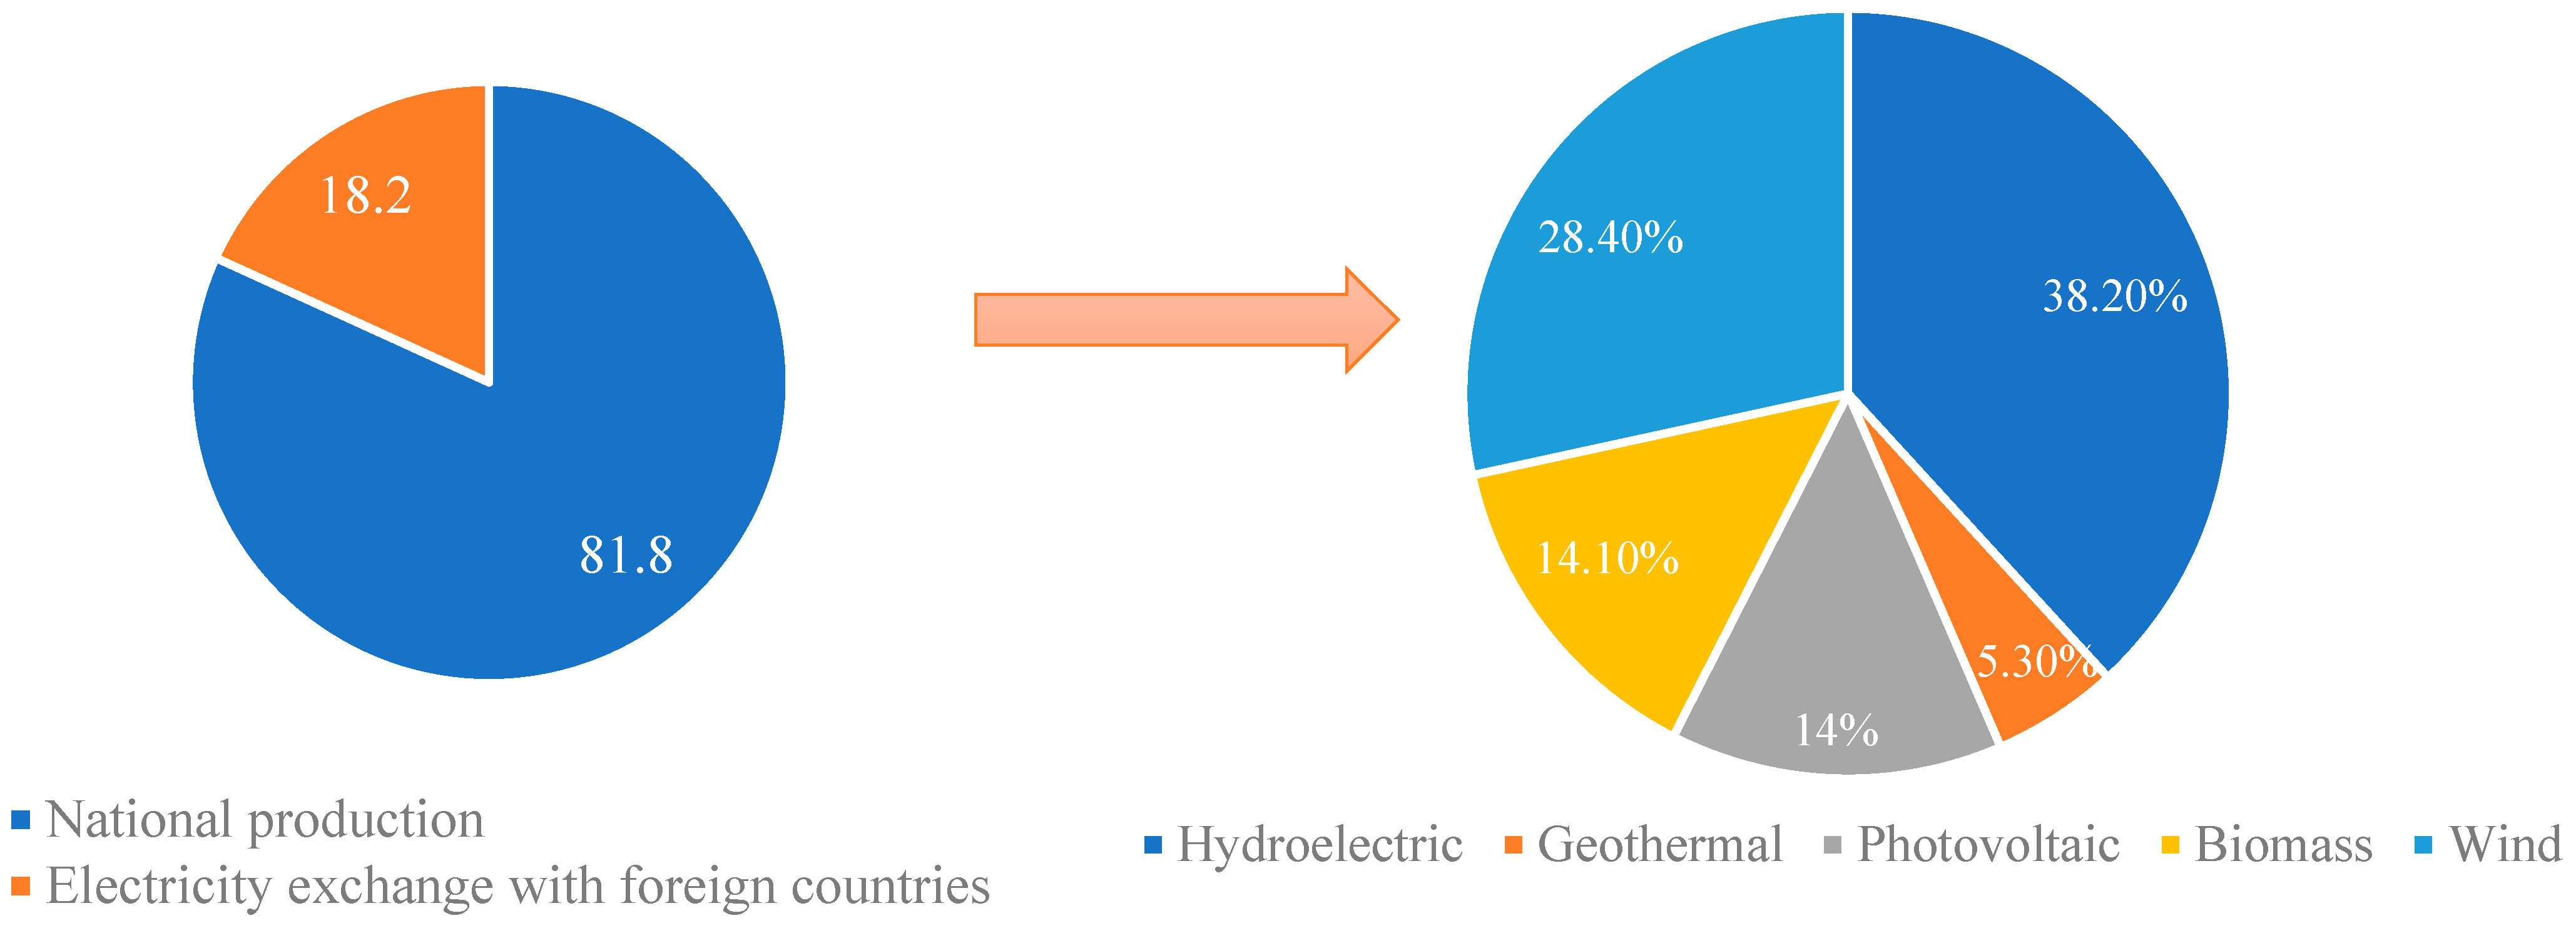
However, according to Table 1 and in line with the “FIT for 55” policy package, it is planned to replace 16% of internal combustion vehicles with electric vehicles by 2030 and half of these vehicles by 2050, which is an ambitious goal. With the increase in the production of energy and its consumption by electric vehicles, the daily consumption of electrical energy will undergo extensive changes. According to the latest data extracted from Terna, in December 2023, the energy consumption in Italy reached 305.6 TWh, of which 18.2% was supplied through imports from other countries and 81.8% was supplied by domestic production. Of the total domestic production, nearly 34.5% involved the supply of electricity from new energies (Figure 3) [19].
According to the projected goals of this plan, the capacity of renewable power plants will reach 131 GW by 2030, of which about 28 GW is related to wind energy and 79.9 GW is associated with PV. With these goals, the photovoltaic capacity will increase by 59 GW and wind energy production will increase by 17 GW. In total, the supply of resources through renewable energies will increase by 74 GW compared to 2021. The supply of this power in different regions of Italy will vary depending on climate and weather conditions. Still, given the high potential of the center and south of the country, the development of these resources will be greater in these regions [20,21,22].
To facilitate the development of offshore renewables, the TEN-E 2022 regulation requires Member States, within their respective priority trans-coastal network corridors, taking into account the specificities and development of each region, to conclude non-binding agreements for cross-border cooperation on offshore renewable energy targets within the framework of each of the steps. In 2030 and 2040, in line with the INECPs and the offshore renewable potential of each sea basin. Another requirement of the EU package is for each country to promote the supply of energy from offshore sources. This is stipulated by the TEN-E 2022 regulation. This regulation requires countries to promote this area with the 2030 and 2040 targets, taking into account regional specificities and cross-border relations with each other, in line with the independent national electoral commission (INEC) [23,24,25].
In January 2023, a non-binding agreement was signed to connect 4 gigawatts of hydrogen outside the West, with Italy, Spain, Malta, France, Croatia, Greece, and Slovenia all having the capacity to implement it. Italy, on the other hand, has been given priority in this capacity due to its proximity to the Mediterranean Sea. The Italian government is also working to achieve its ambition of importing 10 million tons of hydrogen and producing another 10 million tons by 2030 [20,25].
Replacing 7 million ICEVs with BEVs (approximately 20% of all passenger cars) is a larger goal than the EU package proposed. On the other hand, with the significant increase in electric vehicles predicted in 2030 and then in 2050, the need for electricity generation will increase significantly. According to the goals mentioned in Table 1, the supply of energy from renewable sources will require the promotion of energy supply from solar, wind, hydro, and other renewable sources, which will pose new challenges.
The aim of this paper is to analyze the potential impacts of replacing 7 million internal combustion passenger cars with BEVs on the Italian electricity system on a large scale, taking into account the constraints of the proposed EU Fit for 55 package and the deployment of charging infrastructure, grid reinforcement, and demand-side management strategies, as well as the role of renewable energy sources. Therefore, possible scenarios have been designed using the Expert Choice software (11.0). The research gap is that the scenario of replacing 7 million internal combustion vehicles with electric vehicles, which represent 20% of passenger cars in Italy, has not been accurately modeled. Also, given the approach of 2030 and the updated targets in the EU Fit for 55 agreements, this research is of great importance and can be used by transport policymakers.
Given the country’s vision for 2030 and even 2050 regarding the reduction in carbon dioxide emissions, extensive research has been conducted. The Middle East, as a region with high carbon dioxide emissions, plays a key role in meeting global emissions reduction targets. Nahla Samargandi et al. (2024) [26] examined the input demand for renewable energy generation in Saudi Arabia in 2030. According to the results of this study, solar power plants will play a key role in providing the energy needed for Saudi Arabia in 2030. Also, the reduction in natural resources and the geopolitical risks of the world in the use of fossil fuels emphasize these results. These results were also confirmed in the study of Mahmood Abdoos et al. (2025) [27] in the Mediterranean region. In this study, the aim was to meet the energy deficit through solar energy, which was investigated using convolutional neural networks (CNNs).
The two countries of China and the United States, as pioneers in the production of electric vehicles and in increasing the amount of energy production from renewable sources, have also conducted new and extensive research to reduce the emission of gaseous pollutants. In their 2024 study, Shupeng Li et al. [28] predicted CO2, CO, SO2, NOX, PM10, and PM2.5 emissions to be 31,089.51, 1794.4, 20.59, 205.88, 6.6, and 6.5 kt, respectively, by 2030 under a business-as-usual (BAU) scenario. This scenario is achievable under conditions where PV and wind resources can be increased by 4 to 8 times. Bing Li et al. (2024) [29] also reached similar results in a similar study for industrial areas in China. This study emphasizes a 50% increase in energy demand by 2030 and prioritizes the use of renewables and coal. D. Kamani and M.M. Ardehali (2023) [30] examined the long-term impact of new energy on demand in the United States compared to developing countries such as China, India, and Iran. According to the results of this research, carbon dioxide emissions can experience a significant reduction of 40 to 50 percent by increasing the use of renewable energies.
In the European Union, as in other parts of the world, several studies have been conducted and scenarios have been predicted in accordance with the FIT for 55 packages. Lorenc Malka and his colleagues [31] examined the energy system analysis in 2023, focusing on future energy demand forecasts in Norway. In this study, which was carried out using the Python library (3.11), data from seven countries, Italy, Spain, France, the Netherlands, Germany, Sweden and Poland, were examined. The multi-objective energy algorithm of this study showed that carbon dioxide emissions can experience a significant reduction with the implementation of the EU plan. This reduction can also be seen in a case study of Italy by Ilaria Henke et al. [32]. In this study, case scenarios regarding traffic in 2030 and the increase in energy demand were examined.

2. Methodology

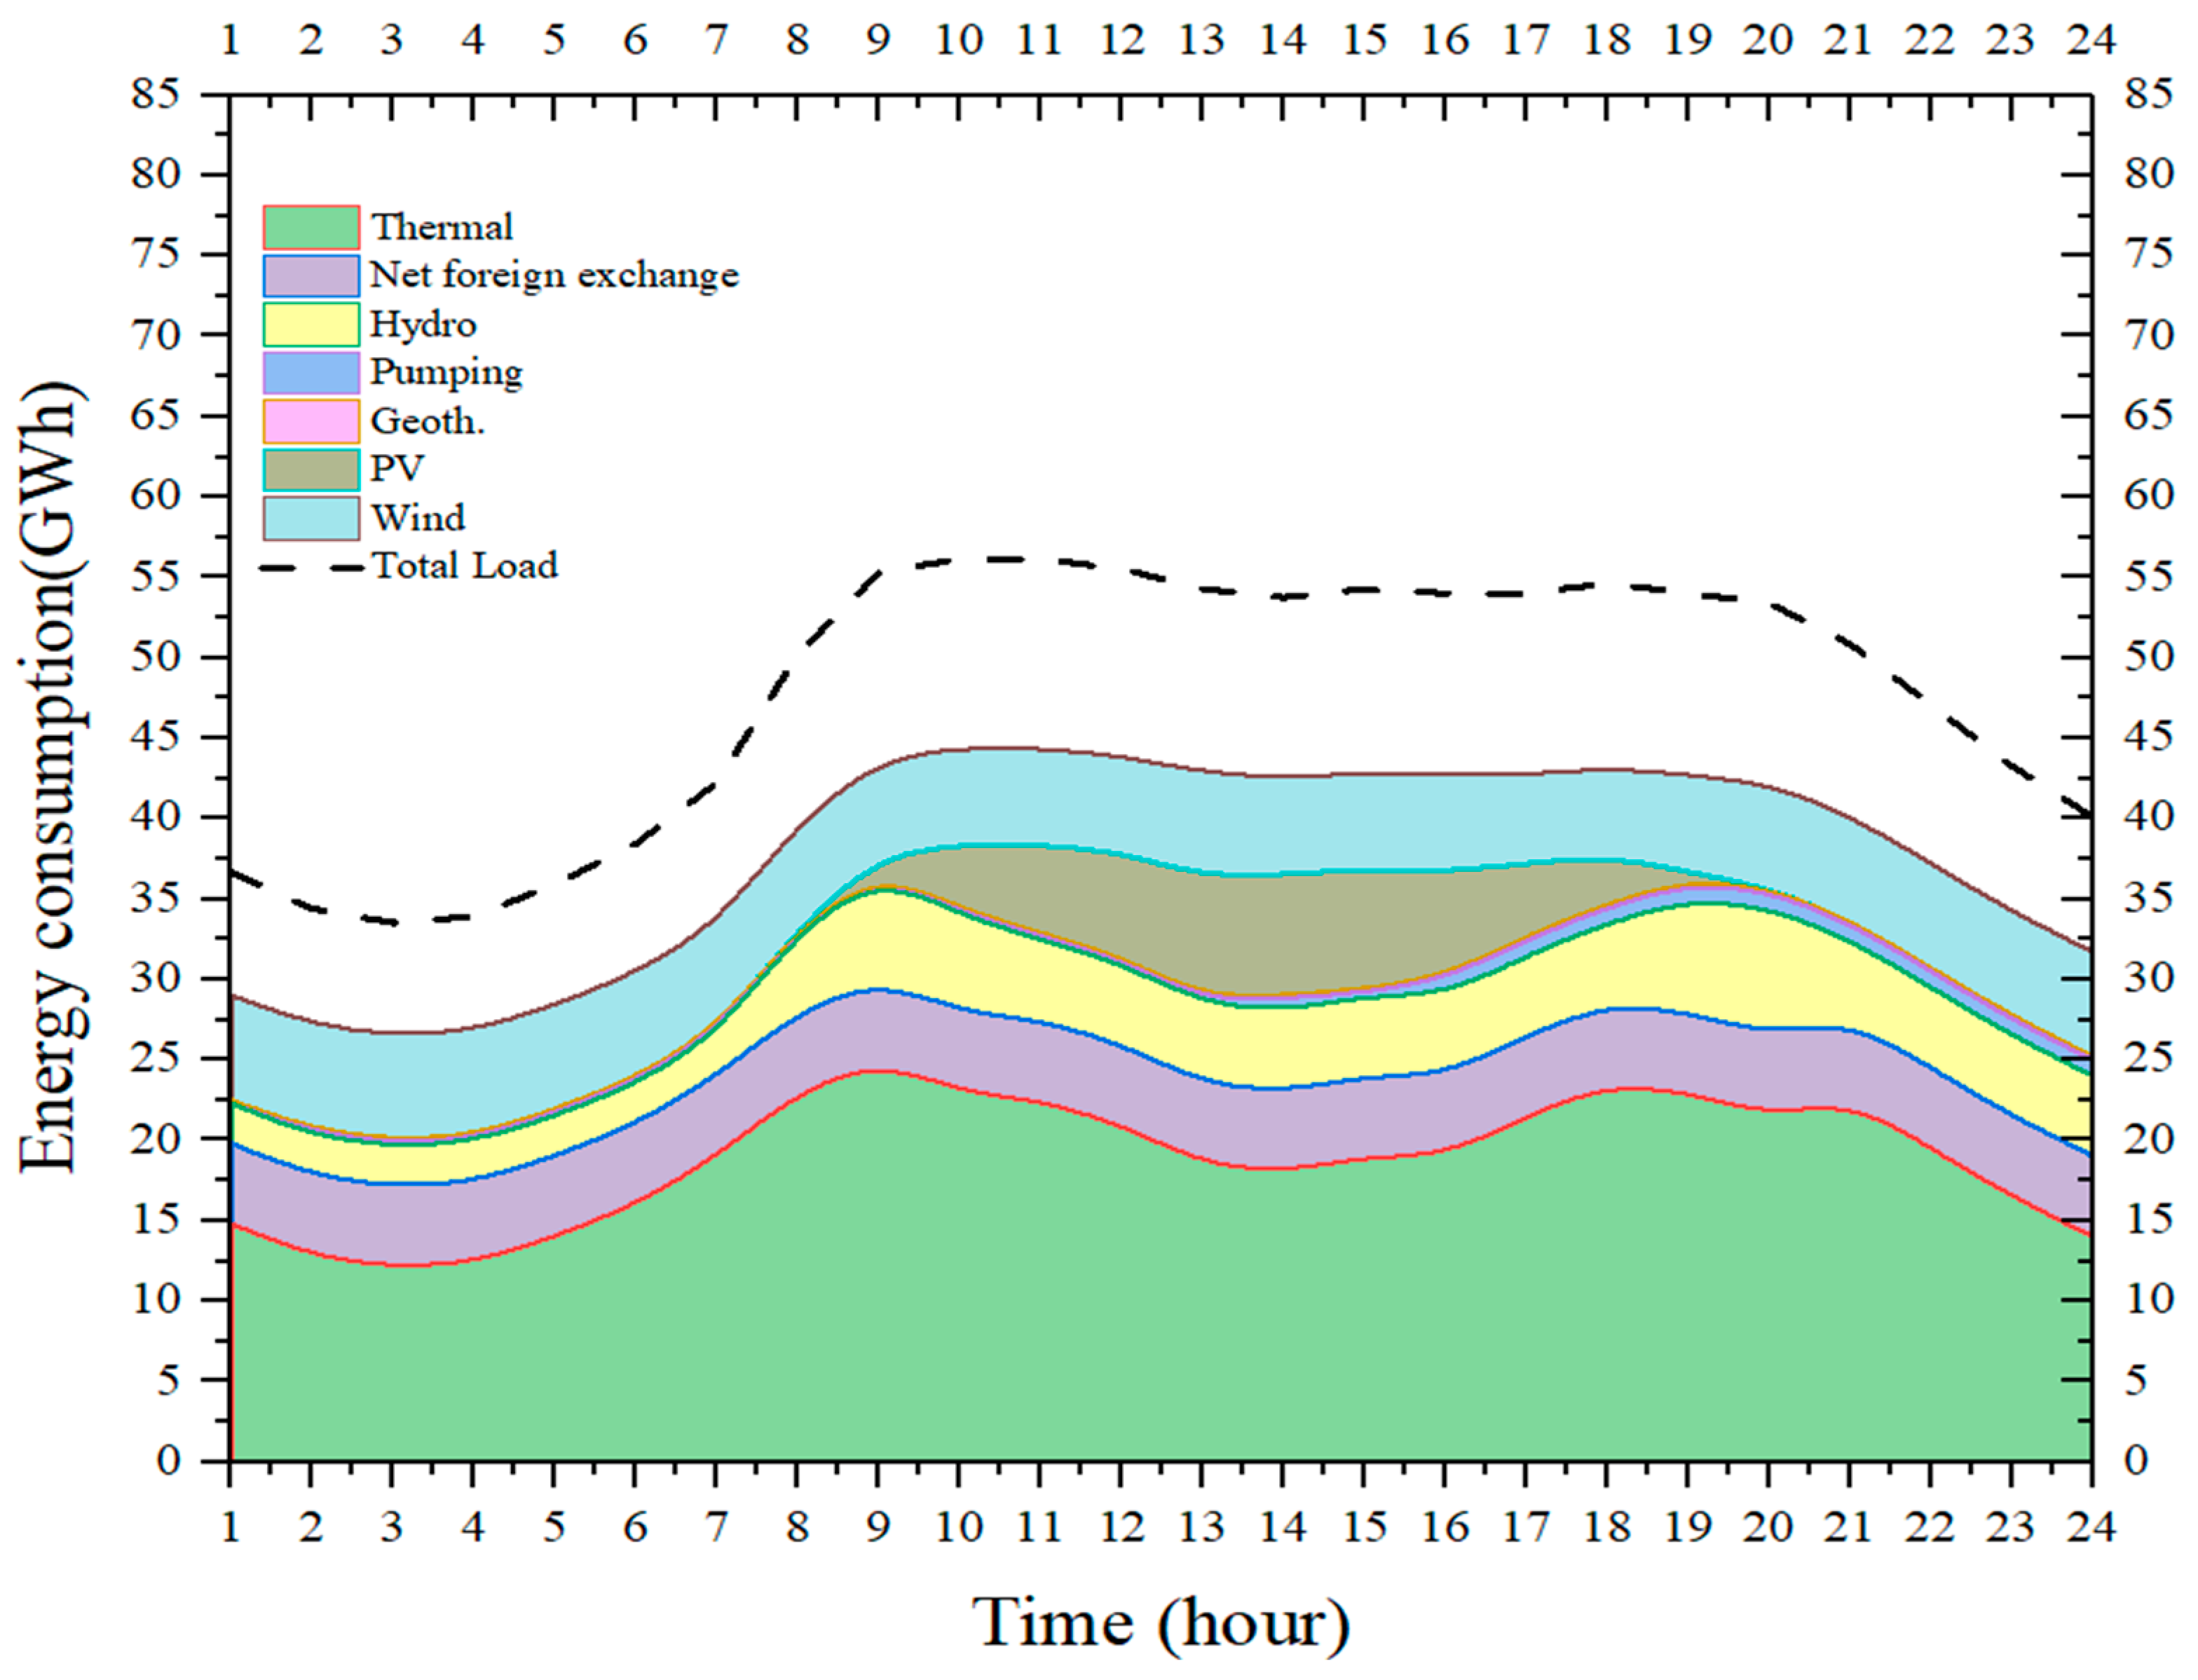
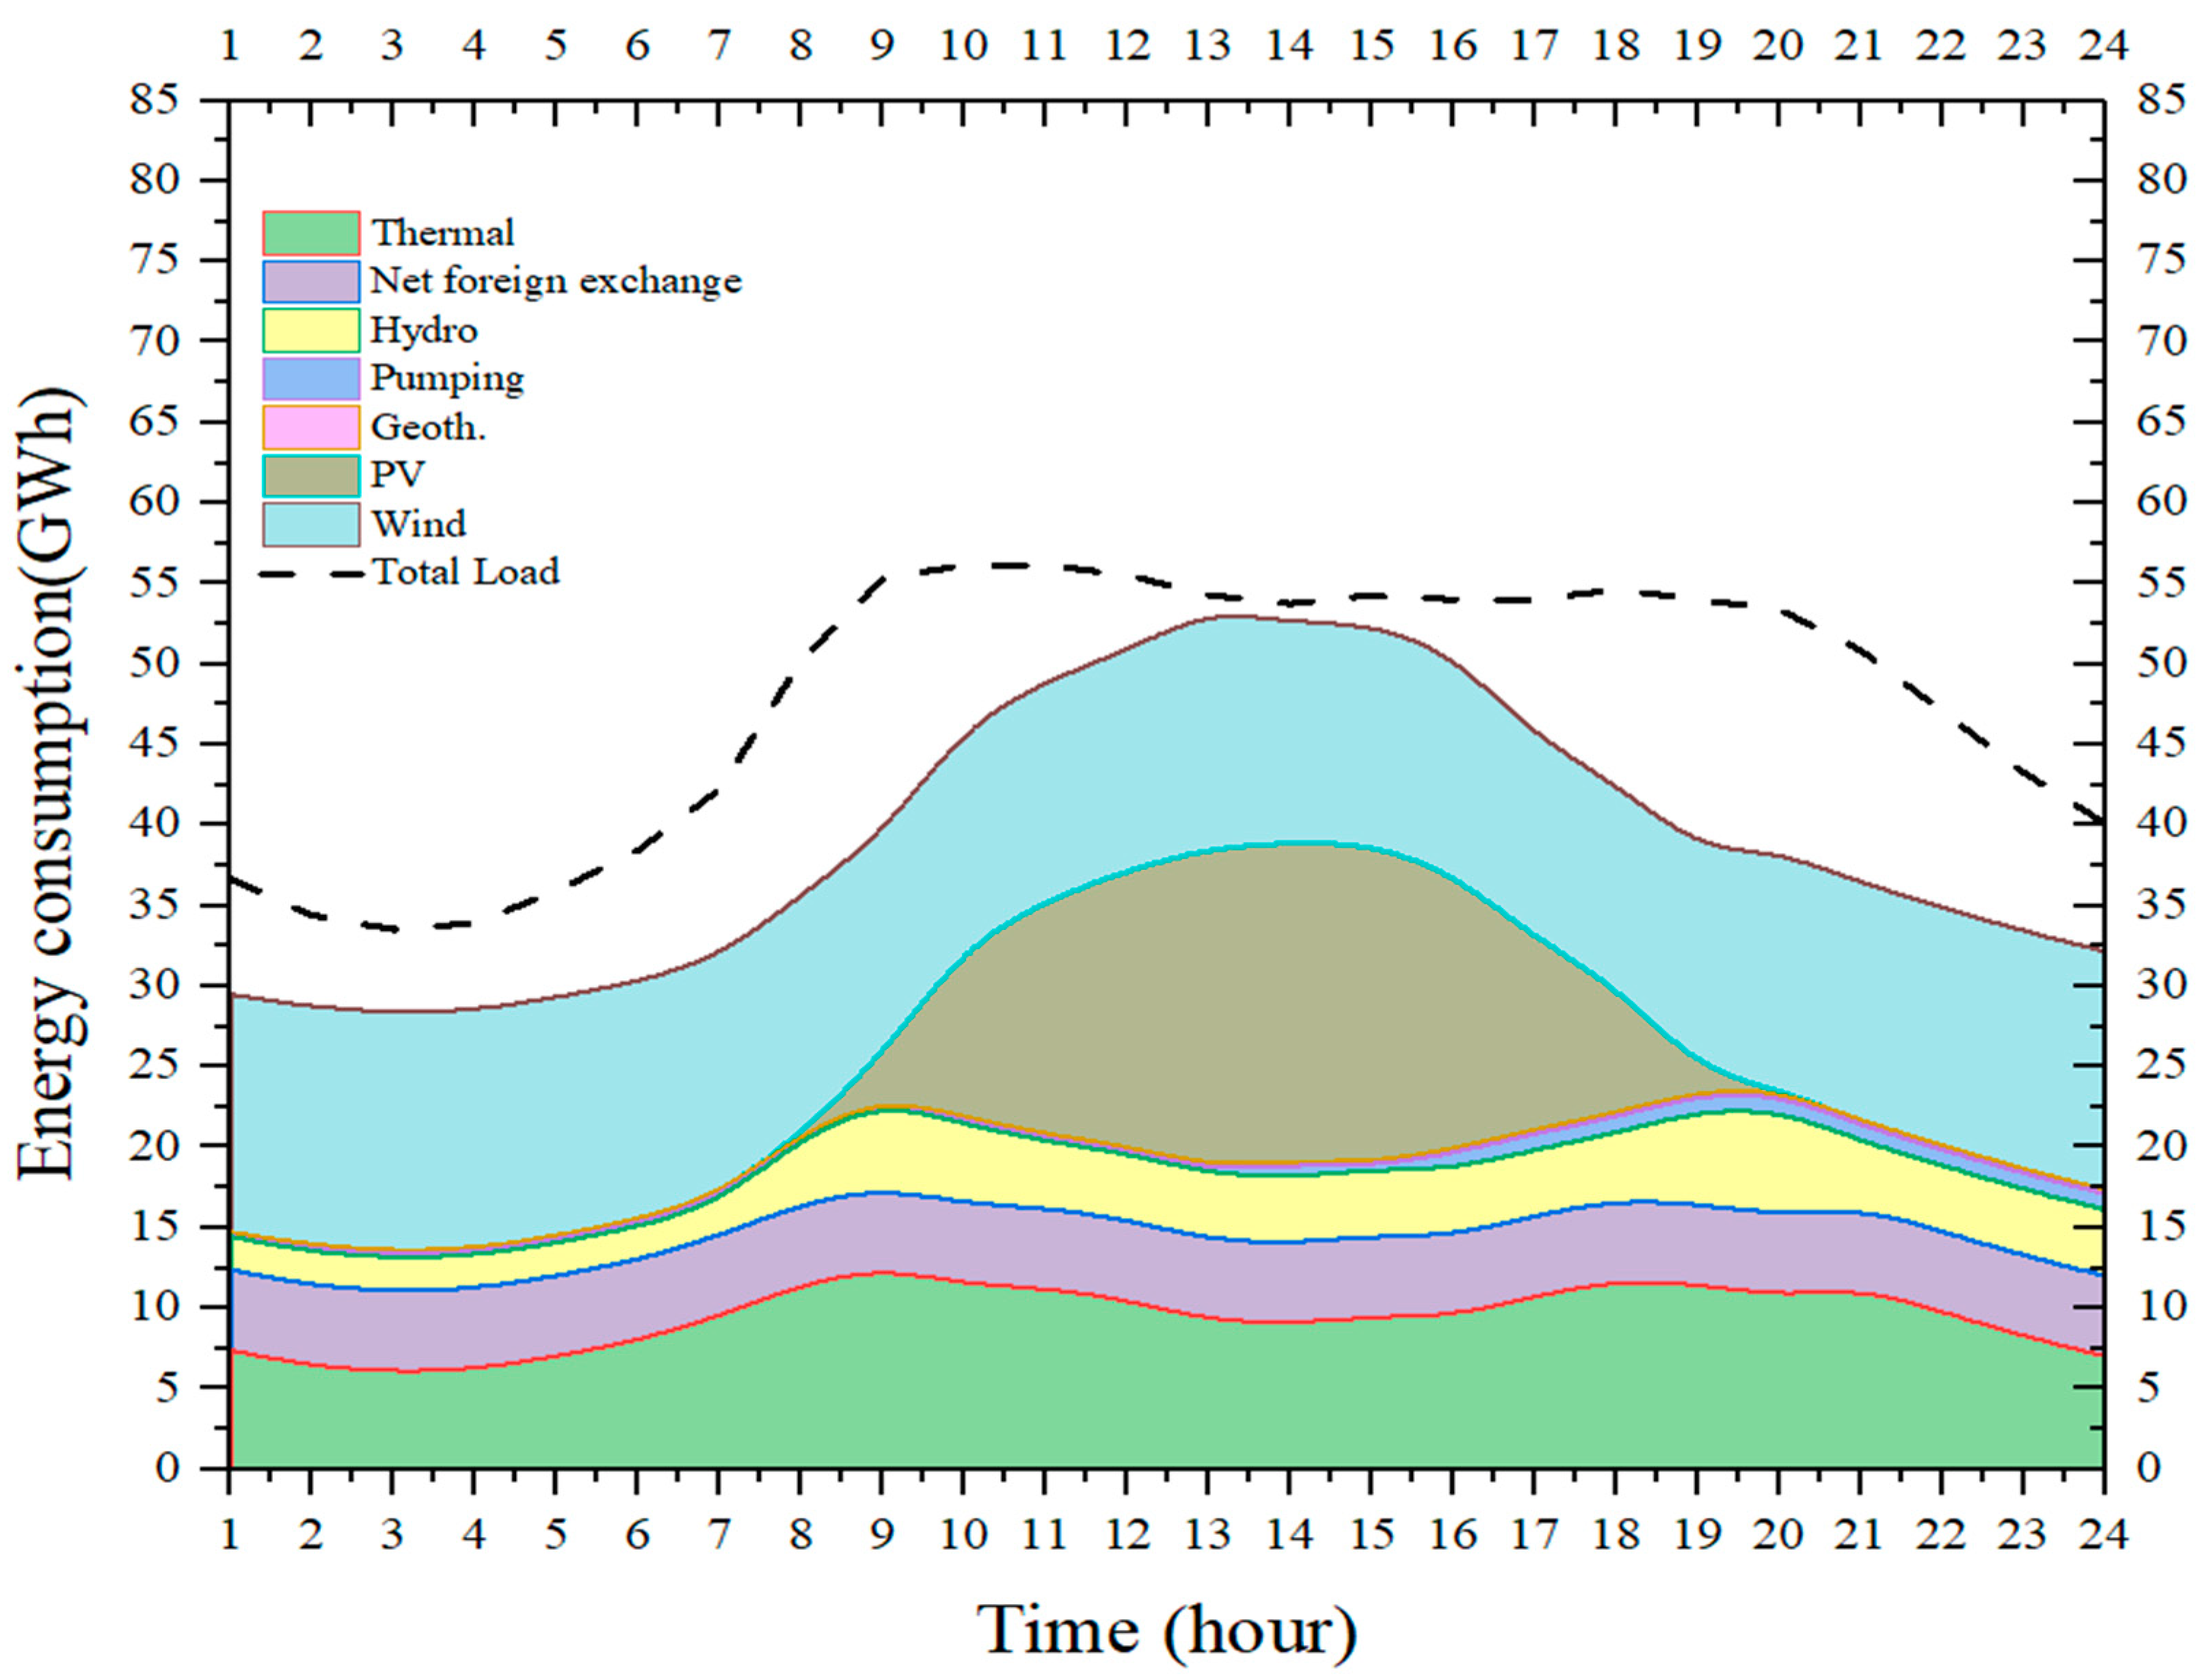
By replacing fossil fuel vehicles with electric vehicles and increasing the number of electric vehicles at once, Italy will face a significant increase in energy demand. Hence, a large gap will be created in the daily energy demand graph (Figure 4), which must be filled by managing the energy supply networks. On the other hand, in line with the FIT for 55 package, countries are required to reduce the use of natural gas fuel for energy supply and increase the number of renewable fuels [15]. With the implementation of the EU proposal and the increase in the demand for electric vehicles, we are faced with the graph in Figure 5, which clearly shows the energy supply deficit at certain hours of the day. Also, increasing the amount of energy supply from renewable sources will provide energy during the peak hours of the day between 11 a.m. and 2 p.m.
To address the energy supply problem in 2030 (Figure 5), given the increase in electric vehicles and the need for more electrical energy generation, several energy systems can be utilized. The first scenario could be to increase energy generation through PV sources and utilize the BESS for the daily energy surplus. The second scenario could be similar to the previous scenario, with the difference being that this time, instead of photovoltaic sources, there is only an increase in wind generators. If the amount of energy generation from PV and wind sources is taken into account, the third scenario could be based on supplying the energy deficit by nuclear sources and utilizing the BESS for a daily energy surplus. Finally, in another scenario, without the need for the BESS, the energy deficit can be supplied through the control of thermal sources.
Various factors are involved in the design and establishment of scenarios. These range from the provision of the equipment required to achieve the Fit for 55 targets to examining the weaknesses of each energy supply source, such as the programmability of renewable resources and the lack of continuous switching on and off of nuclear power reactors [33,34]. One of the important points regarding solar energy is that the PV source reaches its maximum efficiency in the middle of the day but is practically a switched-off source during the night; therefore, storing excess energy in the middle of the day and distributing it at night causes an energy imbalance [35,36].
As mentioned, to compensate for the energy deficit during some hours of the day, a battery energy storage system is used. A battery energy storage system (BESS) takes energy from renewable and non-renewable sources and stores it in rechargeable batteries (storage devices) for later use [37,38,39]. According to the latest statistics provided by the Italian Energy Distribution System, the capacity of the BESS in 2023 was 0.5 GW, which increased to 2.3 GW by the end of 2024. According to the statistics, the capacity of this system in the European Union will reach more than 120 GW by 2030, with Italy’s share increasing to 10.46 GW by 2025, 14.66 GW by the end of 2027, and more than 22 GW by the end of 2030 [40,41].
Since 1990, according to the 1987 referendum, Italy’s nuclear reactors have been deactivated [35], and so the use of new-generation reactors could be an alternative source of natural gas.
Load Curve Calculation per Source
Each energy source has a different methodology for calculating its hourly contribution:
(a)
Fossil Fuel-Based Generation
This uses thermal power plant scheduling and economic dispatch models.
Generation follows demand patterns, peaking in the morning and evening.
(b)
Solar PV
This is modeled using solar irradiance data.
This uses the following equation:
P(t) = P installed × CF(t)
where CF(t) (capacity factor) is calculated based on solar radiation intensity at time (t).
(c)
Wind Power
This is forecasted using wind speed data and power curves of wind turbines.
Wind power output:
P(t) = P installed × CF wind(t)
where CF wind(t) is derived from wind conditions.
(d)
Hydropower
Run-of-river plants depend on river flow.
Reservoir-based plants are managed based on demand and storage levels.
(e)
Biomass and Geothermal
They are considered constant throughout the day due to stable fuel supply.
After calculating the hourly generation for each source, the total electricity supply curve is obtained by summing these values:
Ptotal(t) = Pfossil(t) + Psolar(t) + Pwind(t) + Phydro(t) + Pbiomass(t) + Pgeo(t)
This curve is then compared to the demand curve, and grid operators adjust supply accordingly [42,43,44].

2.1. The 1st Scenario

The first and second scenarios aim to evaluate the maximum use of renewable resources to the extent that PV and wind energy can provide 50% of the energy supply. In the first scenario, the energy deficit is met through solar energy and the installation of new panels in different regions of Italy. Currently, according to the latest statistics published by Terna, the number of solar panels installed in Italy reached 1,594,974 panels by 2023 and 1,786,515 active panels by 2024, providing a capacity of 30.3 GW and 37.1 GW, respectively [45]. Italia Solare (ITALIA SOLARE is a social promotion association which works to enhance environmental and human health protection by supporting smart and sustainable ways to produce, store, manage and distribute energy through distributed generation from renewable sources, especially solar PV) stated that PV plants above 10 MW accounted for 1896 MW of the total. The regions with the largest share of total new capacity additions are Lombardia with 4056 MW, Apulia with 3306 MW, Veneto with 3164 MW, and Emilia Romagna with 3027 MW. According to Italia Solare, 43% (2.26 GW) of the solar energy connected to the grid last year came from residential installations, while the C&I segment accounted for 35% (1.82 GW). Utility-scale PV plants accounted for 22% (1.16 GW) of the total [46,47]. Using the Expert Choice statistical software (11.0), the required number of solar panels and the amount of energy power needed to meet the daily energy deficit in 2030 have been estimated. The energy produced above the amount consumed at different times of the day is also stored by BESS technology and added to the system during energy shortage hours.

2.2. The 2nd Scenario

In the second scenario, like the first scenario, the share of renewable energies for energy supply in Italy is considered to be 50%. In the second scenario, the source controlling the imbalance is wind energy. The number of wind turbines installed in Italy by 2023 was 7000 turbines with a capacity of 12.34 GW, which was increased by 450 wind turbines in 2024, providing a capacity of over 13 GW [48,49]. Using the Expert Choice statistical software (11.0), the required number of wind turbines and the amount of energy power to meet the daily energy deficit in 2030 have been estimated. In this scenario, the surplus energy produced during the day and night hours by BESS technology is stored in batteries and injected into the system during energy shortage hours.

2.3. The 3rd Scenario

The activation of new nuclear power plants in recent years has largely been balanced by the retirement of old power plants. Over the past 20 years, 106 reactors have been retired, and 102 reactors have started up. Today, there are about 440 nuclear power reactors operating in 31 countries plus Taiwan, with a combined capacity of about 400 GW. In 2023, these will supply 2602 TWh, or about 9% of the world’s electricity. About 30 countries are considering, planning, or starting nuclear power programs [50,51,52]. The third scenario involves the return of nuclear energy to the Italian energy supply cycle. In Italy, there are 4 nuclear power plants, as shown in Table 2 [53,54]. By returning these plants to the energy supply cycle, the energy deficit can be met during most of the day and night, and by storing the energy produced at night in BESS technology batteries, the energy imbalance in the early morning and evening hours can be addressed. In this scenario, the operation of the power plants is assumed to be based on fixed fossil fuel, so that the energy deficit can be met only through energy storage batteries. Microreactors are also being considered to replace older reactors, as microreactors are 100 to 1000 times smaller than conventional nuclear reactors, while the output of small modular reactors (SMRs) ranges from 20 to 300 MW. Microreactors offer a combination of reliability and operational flexibility that no other small-scale generation system can match [55,56].

2.4. The 4th Scenario

The fourth scenario is based on controlling the imbalance using existing resources. In this setup, considering that the energy supply from renewable sources is unplanned and the use of nuclear fuel is unregulated, increasing and decreasing throughout the day, the only adjustable way to meet the energy imbalance at different times of the day is the use of fossil fuels in turbines of power plants. However, accounting for the proposed FIT for 55 percent of the natural gas in the country and the reduction in gas imports from Russia, it is proposed to use alternative fuels such as coal or oil to supply power plants during energy deficit hours. According to this scenario, 5 to 7 gigawatt hours of electricity can be continuously supplied through nuclear sources, and the energy imbalance can be supplied by employing fossil fuels in power plants. In this case, gas turbines play a key role in supplying the energy deficit.
Various factors are involved in the operation of all these scenarios. In addition to the amount of equipment required and the amount of energy produced by the sources, the required area and the efficiency of each source are also taken into account. Meanwhile, due to the increase in the amount of energy produced by solar and wind sources, the amount of area required to install solar cells and wind turbines is also increasing. On average, each solar panel with an efficiency of 20% occupies an area of 1.6 m2. Accordingly, the amount of energy produced by each panel, which experiences an average of 4 to 6 h of sunlight per day, is estimated to be about 1 to 3 kilowatt hours per day [36,57].
An example is given as follows:
1.6 m2 × 20% = 0.32
0.32 × 4.5 h = 1.44 kWh/day
Also, a modern wind turbine starts generating electricity when the wind speed reaches 6–9 mph, and if it exceeds 55 mph (88.5 km/h), it must be shut down, as its mechanism is at risk of damage [58]. So, while they can generate electricity most of the time, there are other times when they must be shut down. However, most wind turbines operate at an efficiency of around 30–40 percent, although this can increase to 50 percent in ideal wind conditions. It is estimated that the average onshore wind turbine with a capacity of 2.5–3 megawatts can produce over 6 million kilowatt-hours per year. A 3.6-megawatt offshore turbine can double this amount. However, an area of about 6 m2 per kilowatt of installed capacity is considered necessary. This means that for a 1000-watt wind turbine, an area of about 6 m2 or about 64 square feet is required. Also, the average area of wind farms producing electricity is about 25 to 40 hectares [59,60,61].
The Expert Choice software (11.0) is used for the Analytic Hierarchy Process (AHP), and calibrating it means fine-tuning pairwise comparisons and checking the consistency of the data. The general steps of calibration in this software are setting up pairwise comparisons, checking the Consistency Ratio (CR), adjusting the final weights, validating the results, and extracting and analyzing the reports. After going through the data validation stages, they were compared and subjected to scenario-based analysis [62,63].
Also, for each scenario, calculations were performed and validated according to the average data for 2023, published by Terna. In the scenario design, the basis of the work was the targets of the proposed Fit for 55 package, as well as the limitation of the use of gas and other fossil fuels for energy supply. Accordingly, the gap created for each scenario was designed with a new scenario design and with the maximum use of alternative fuels to replace fossil fuels.

3. Result

Given the assumptions of an increased number of electric vehicles in 2030 and 20% of internal combustion vehicles being replaced with electric ones, the energy demand will increase significantly. However, according to the FIT for 55 energy package, the European Union countries will face energy imbalances at different times of the day and night, with the goals of reducing gas consumption for energy supply and increasing the use of renewable energy sources. In this study, by examining these assumptions, the results are reported in 4 possible scenarios for Italy.
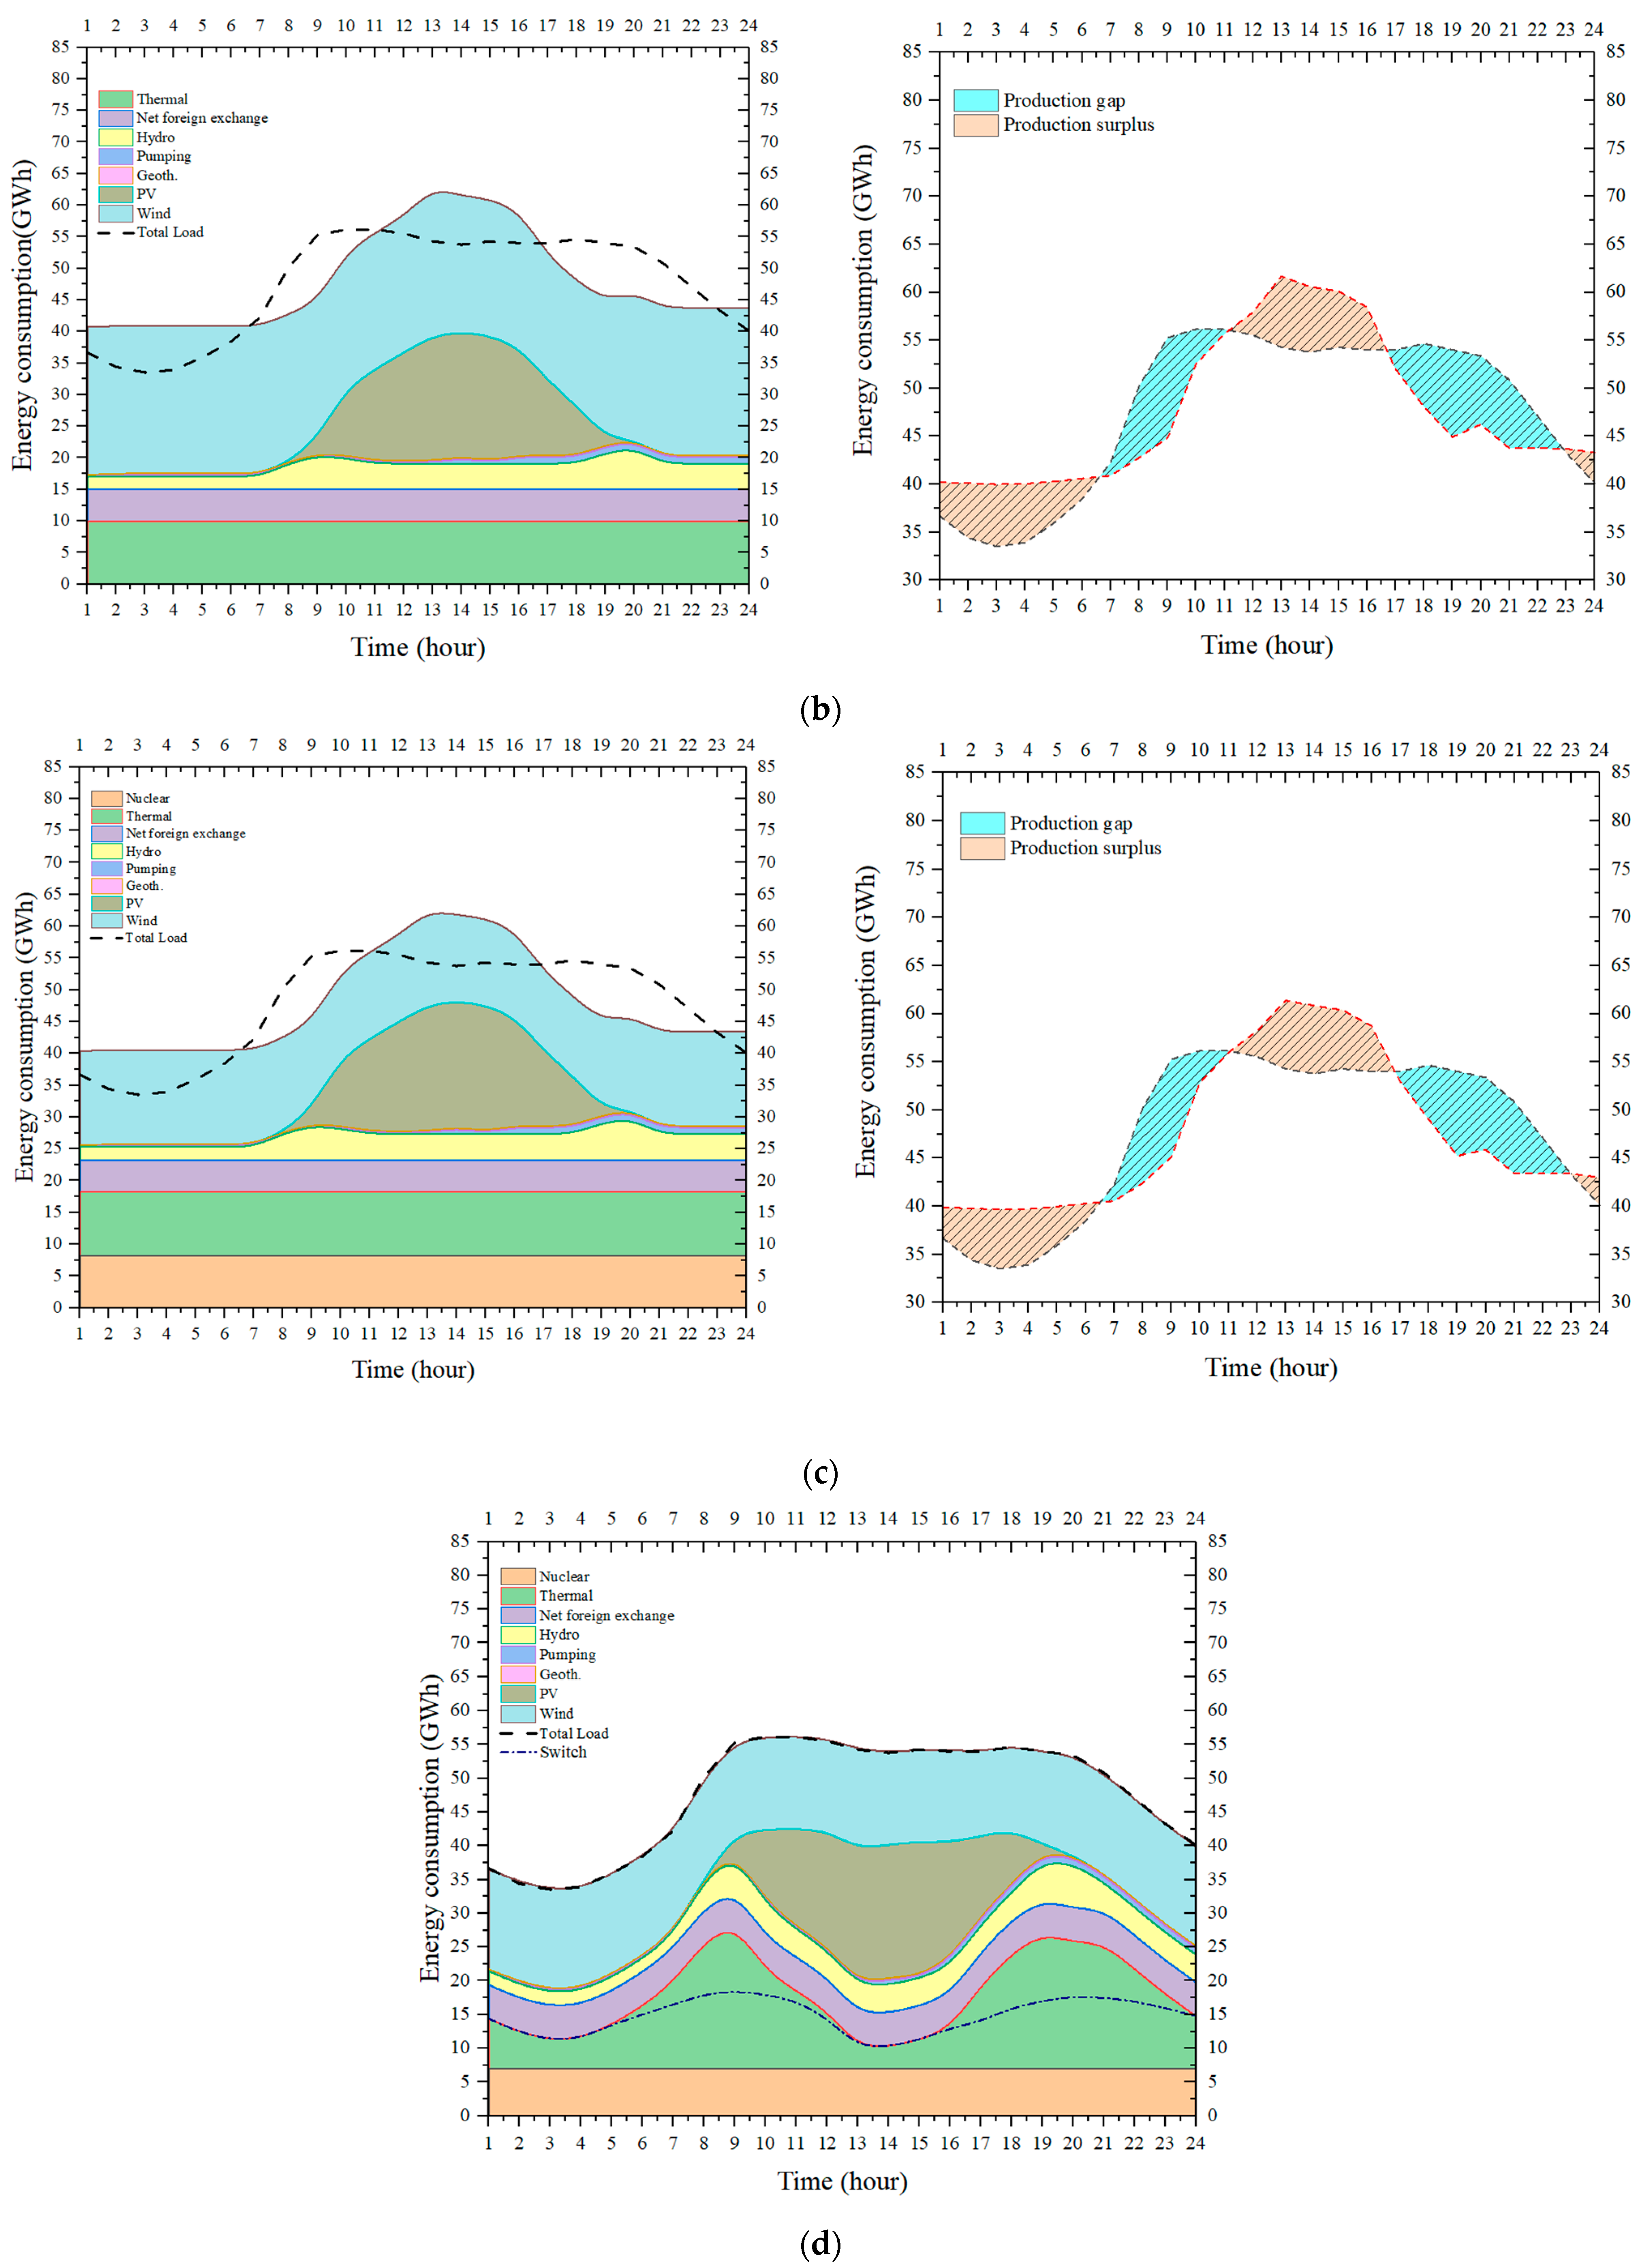
Increasing the efficiency of solar energy sources can prevent energy deficits in the middle of the day. The average sunlight hours are from 7 a.m. to 7 p.m., with an average of 4–5 h of direct sunlight on sunny days from 11 a.m. to 3 p.m. According to the first scenario and the graph in Figure 6a, the number of solar panels in Italy will grow by 555% compared to 2023 and will reach 9,778,500 panels. Also, as each panel covers an area of about 1.6 m2 with 60 solar cells, an area of about 12,800 km2 (1280 hectares) will be needed for the insertion of new panels with an increase in the number of panels. This number of panels can meet the demand for about 50 gigawatt hours of energy at 2 p.m. However, the lack of sunlight at night causes the amount of energy supply in the cycle to drop sharply and causes an energy imbalance in the distribution network. Therefore, BESSs are used to store energy during sunlight hours and inject it into the energy circuit at night. Based on the 87.7% efficiency of the BESS, lithium batteries with a total capacity of 135 gigawatts are needed, which is 5 times the capacity predicted for 2030. In the second scenario, the maximum efficiency of renewable sources is also considered. In this scenario, wind energy is considered a source of energy imbalance. Wind energy can usually be considered a good renewable energy source at all hours of the day and only declines during the middle of the day between 9 a.m. and 5 p.m. However, during these hours, the largest portion of the energy supply is from solar sources. A 260% increase in the capacity of wind power plants, along with the energy supply at night, make it possible to make up the energy deficit at night and also send the excess energy produced to the BESS for storage. From 11 p.m. to 6 a.m., more than 31 gigawatts of excess energy are produced, a level that can meet the energy deficit in the early hours of the day. Also, according to the results of Figure 6b, in the middle of the day, with the help of a PV source, more than 27 gigawatts of excess energy is produced from 12 p.m. to 4 p.m., which can meet the deficit from 5 p.m. to 10 p.m. With the realization of this scenario, the production capacity of Italian wind power plants will increase from 12.3 GW in 2023 to 44.28 GW in 2030.
The re-emergence of nuclear power generation could largely eliminate the need for gas and fossil fuels for energy supply. According to the renewable energy targets for Italy in 2030, by continuously generating 8.5 GWh from nuclear power, the imbalances created in the early hours of the day and early evening can be compensated. Also, with the introduction of small-sized nuclear reactors (microreactors), less space is needed to build nuclear power plants than is required when constructing medium-sized reactors. According to Figure 6c, the energy imbalance between 7 and 11 a.m. can be covered by the energy stored in the BESS from 11 p.m. to 6 a.m. There is also another energy deficit, as expected, between 5 p.m. and 10 p.m., which can be covered by storing energy from 2 p.m. to 6 p.m. Due to the un-programmability of renewables and the inability to switch off and on nuclear power plants, the daily energy imbalance can be compensated by managing fossil and gas power plants. According to the FIT for 55 proposal, the consumption of natural gas for energy supply should be halved; hence, alternative fuels for power plants such as coal, fossil fuels, hydrogen, etc., become more important than ever. According to the scenario in Figure 6d and the 2030 targets, there is no need to increase the energy production from natural gas fuel because the energy deficit in the early hours of the day and early evening can be met by starting gas turbines and switching them off (according to the current trend in 2024). The switching hours of gas turbines are about 5:50 to 11:50 in the morning and 16:30 to 23:30 at the evening, with the peak energy deficit in the early morning at 9 a.m. and early evening at 7 p.m. (Figure 7)

4. Discussion

Italy’s daily energy demand is projected to rise significantly, by 40% per day, due to the planned replacement of 20% of internal combustion engine vehicles (ICEVs) with battery electric vehicles (BEVs). Currently, night-time energy demand is considerably lower than daytime demand, primarily due to the reduced traffic volumes of ICEVs in cities and on highways. However, with the widespread adoption of electric vehicles and the need for overnight home charging, as well as charging at highway stations, the night-time energy consumption pattern will undergo a substantial transformation.
Existing research has predominantly focused on estimating the impact of increased BEV penetration on the annual energy demand of cities and countries. However, a more detailed examination is required to understand the temporal shifts in demand patterns and their implications for grid stability, energy storage, and peak load management.
The findings of numerous studies highlight the critical role of renewable energy sources in meeting future energy demand. Additionally, discussions have emerged regarding the potential reinstatement of nuclear power as a viable energy source. Nuclear power remains the largest provider of carbon-free electricity and serves as a key baseload electricity generator in Europe. With 167 operational units possessing a combined capacity of 148,000 MW, nuclear energy accounted for 22% of the EU-27’s electricity production in 2022 [64]. Furthermore, increased reliance on nuclear power has been shown to mitigate the necessity for extensive transmission infrastructure, large-scale energy storage, and the curtailment of variable renewable energy (VRE), thereby optimizing land use and reinforcing the role of nuclear energy in low-carbon power systems [65].
In the present study, four different scenarios are analyzed concerning CO2 emission reduction under the assumption of a 20% ICEV-to-BEV conversion. A key innovation of this study is the emphasis on maximizing the utilization of renewable energy sources. The optimal scenario envisions that 50% of Italy’s daily energy supply is derived from renewable sources, primarily from photovoltaic (PV) systems and wind turbines. Additionally, the feasibility of reintroducing nuclear energy is examined by considering the deployment of next-generation small modular reactors (SMRs) alongside the expansion of renewable energy infrastructure. To address potential supply–demand imbalances, a dynamic approach has been adopted that leverages existing energy resources while incorporating feed-in tariff (FIT) schemes for 55 energy packages. The reliance on fossil fuels under these different scenarios has also been assessed, aiming to establish a balance between sustainability and energy security.
Italy exhibits considerable regional variation in climate and energy resource potential, making region-specific studies an essential component of future research. Some areas possess higher wind energy potential, while others are more favorable for solar power generation. Conducting localized assessments will enhance the accuracy of future energy planning and facilitate the development of tailored renewable energy strategies that optimize regional strengths. Furthermore, additional research could explore the integration of emerging energy storage technologies, grid modernization efforts, and demand–response programs to create a resilient and adaptive energy infrastructure.

5. Conclusions

The upcoming goals and measures to reduce greenhouse gas emissions, especially CO2, require countries to achieve individual and collective goals. Italy is no exception to this rule and is pursuing the FIT for 55 package goals. Also, advancing the goal of replacing 20% of internal combustion vehicles with electric vehicles means the country will face energy imbalance challenges at different times of the day. Therefore, this study examines possible scenarios for the maximum use of existing resources and examines the need for increasing renewable resources. Four different scenarios have been considered, with the first and second scenarios emphasizing the maximum use of solar and wind resources, even more than the European Union package targets for 2030. The results show a significant increase in the need for solar resources and, as a result, a 4- to 8-fold increase in the area needed for installing and operating solar power plants. Also, a 2- to 4-fold increase in the need for wind turbines is predicted for wind power plants. However, the scenario of using nuclear power plants and launching new power plants with new-generation reactors (microreactors) has been studied, indicating that by adding nuclear resources along with the FIT for 55 goals for 2030, it is possible to manage resources at different times of the day. In the final scenario, the use of a mix of nuclear resources and fossil fuels with energy management by thermal resources during energy imbalance hours has been studied. In the first three scenarios, energy imbalance management is possible with the help of an energy storage system using BESS technology; due to this, the need for the BESS has been studied, considering the 87.7% efficiency of this system. Hence, the hours of excess energy storage and the use of these reserves during energy deficit hours have also been studied. Scholars have considered the effects of increasing the capacities of renewable resources and reducing the use of fossil fuel resources to supply energy for the existing needs of each country and the potential for obtaining new equipment according to the economy of that country. The European Union countries have also developed the FIT for 55 package by examining existing economic resources and additional budget sources for investment in the renewable energy sector. Therefore, extensive research is needed, not only for Italy and Europe but also for all countries in the world, to achieve a reduction in pollutant greenhouse gas emissions for the entire planet.

6. Suggestions

There are some professional policy suggestions for Italy to strike a balance between renewable energy expansion, nuclear reactivation, and the phasing out of fossil fuels:
  • Invest in smart grids and energy storage (batteries, pumped hydro);
  • Expand offshore wind projects in the Adriatic and Tyrrhenian seas to diversify renewable energy sources;
  • Promote the use of rooftop solar panels with simplified permits and financial incentives for households and businesses;
  • Develop hydrogen infrastructure for long-term energy storage and industrial decarbonization;
  • Initiate independent assessments of small modular reactors (SMRs) and next-generation nuclear to assess safety and cost-effectiveness;
  • International cooperation: partner with France (EDF), the United States, or Canada on nuclear technology transfer and knowledge sharing;
  • Create a transparent legal and financial structure to attract private investment while ensuring safety and public trust.

Author Contributions

Methodology, H.S.; Software, H.S.; Validation, F.D.M.; Formal analysis, H.S.; Resources, H.S.; Writing—original draft, H.S.; Writing—review & editing, H.S.; Visualization, F.D.M.; Supervision, F.D.M.; Project administration, F.D.M. All authors have read and agreed to the published version of the manuscript.

Funding

This research received no external funding.

Institutional Review Board Statement

Not applicable.

Informed Consent Statement

Not applicable.

Data Availability Statement

Data are contained within the article.

Conflicts of Interest

The authors declare no conflict of interest.

References

  1. Schlacke, S.; Wentzien, H.; Thierjung, E.-M.; Köster, M. Implementing the EU Climate Law via the ‘Fit for 55’ package. Oxf. Open Energy 2022, 1, oiab002. [Google Scholar] [CrossRef]
  2. Dolge, K.; Barisa, A.; Kirsanovs, V.; Blumberga, D. The status quo of the EU transport sector: Cross-country indicator-based comparison and policy evaluation. Appl. Energy 2023, 334, 120700. [Google Scholar] [CrossRef]
  3. Rigogiannis, N.; Bogatsis, I.; Pechlivanis, C.; Kyritsis, A.; Papanikolaou, N. Moving towards Greener Road Transportation: A Review. Clean Technol. 2023, 5, 766–790. [Google Scholar] [CrossRef]
  4. Sporkmann, J.; Liu, Y.; Spinler, S. Carbon emissions from European land transportation: A comprehensive analysis. Transp. Res. Part D Transp. Environ. 2023, 121, 103851. [Google Scholar] [CrossRef]
  5. Zhang, J.; Shen, J.; Xu, L.; Zhang, Q. The CO2 emission reduction path towards carbon neutrality in the Chinese steel industry: A review. Environ. Impact Assess. Rev. 2022, 99, 107017. [Google Scholar] [CrossRef]
  6. Cao, J.; Zhang, J.; Chen, Y.; Fan, R.; Xu, L.; Wu, E.; Xue, Y.; Yang, J.; Chen, Y.; Yang, B.; et al. Current status, future prediction and offset potential of fossil fuel CO2 emissions in China. J. Clean. Prod. 2023, 426, 139207. [Google Scholar] [CrossRef]
  7. Wang, W.; Tang, Q.; Gao, B. Exploration of CO2 emission reduction pathways: Identification of influencing factors of CO2 emission and CO2 emission reduction potential of power industry. Clean Technol. Environ. Policy 2022, 25, 1589–1603. [Google Scholar] [CrossRef]
  8. Watson, H.C. Benefit from In-service Life Optimized for Minimum CO2–Comparison of ICEVs, PHEVs, BEVs and FCEVs. No. 2024-01-2443; SAE Technical Papers. 2024. Available online: https://www.sae.org/publications/technical-papers/content/2024-01-2443/ (accessed on 23 February 2025).
  9. Maselli, M.; Pelegrina, J.; de Mello, A.M.; Souza, J.V.R.; Marx, R.; Priarone, P.C. Electric or internal combustion vehicles? A Life Cycle Assessment in São Paulo. Sustain. Energy Rev. 2025, 212, 115431. [Google Scholar] [CrossRef]
  10. Kataoka, R.; Ogimoto, K.; Iwafune, Y.; Nishi, T. Does BEV always help to reduce CO2 emission? Impact of charging strategy. Transp. Res. Part D Transp. Environ. 2024, 129, 104124. [Google Scholar] [CrossRef]
  11. Yi, S.; Abbasi, K.R.; Hussain, K.; Albaker, A.; Alvarado, R. Environmental concerns in the United States: Can renewable energy, fossil fuel energy, and natural resources depletion help? Gondwana Res. 2023, 117, 41–55. [Google Scholar] [CrossRef]
  12. Miyazaki, K.; Bowman, K. Predictability of fossil fuel CO2 from air quality emissions. Nat. Commun. 2023, 14, 1604. [Google Scholar] [CrossRef] [PubMed]
  13. Rodrigues, A.A. “Fit for 55”: The EU Plan for a Green Transition. In Sustainable Finances and the Law: Between Public and Private Solutions; Springer Nature: Cham, Switzerland, 2024; pp. 333–344. [Google Scholar]
  14. Brożyna, J.; Strielkowski, W.; Zpěvák, A. Evaluating the chances of implementing the “Fit for 55” Green Transition Package in the V4 countries. Energies 2023, 16, 2764. [Google Scholar] [CrossRef]
  15. Plötz, P.; Wachsmuth, J.; Sprei, F.; Gnann, T.; Speth, D.; Neuner, F.; Link, S. Greenhouse gas emission budgets and policies for zero-Carbon road transport in Europe. Clim. Policy 2023, 23, 343–354. [Google Scholar] [CrossRef]
  16. Pisoni, E.; Thunis, P.; De Meij, A.; Wilson, J.; Bessagnet, B.; Crippa, M.; Guizzardi, D.; Belis, C.A.; Van Dingenen, R. Modelling the air quality benefits of EU climate mitigation policies using two different PM2. 5-related health impact methodologies. Environ. Int. 2023, 172, 107760. [Google Scholar] [CrossRef]
  17. Fit for 55—Consilium.europa.eu. 2024. Available online: https://www.consilium.europa.eu/en/policies/fit-for-55/ (accessed on 14 February 2025).
  18. Chovancová, J.; Popovičová, M.; Huttmanová, E. Decoupling transport-related greenhouse gas emissions and economic growth in the European Union countries. J. Sustain. Dev. Energy Water Environ. Syst. 2023, 11, 1–18. [Google Scholar] [CrossRef]
  19. Terna: Electricity Consumption Totalled 306.1 TWh in 2023. Available online: https://www.terna.it/en/media/press-releases/detail/electricity-consumption-2023 (accessed on 14 February 2025).
  20. Ollier, L.; Metz, F.; Nuñez-Jimenez, A.; Späth, L.; Lilliestam, J. The European 2030 climate and energy package: Do domestic strategy adaptations precede EU policy change? Policy Sci. 2022, 55, 161–184. [Google Scholar] [CrossRef] [PubMed]
  21. Ghisellini, P.; Passaro, R.; Ulgiati, S. Environmental assessment of multiple “cleaner electricity mix” scenarios within just energy and circular economy transitions, in Italy and Europe. J. Clean. Prod. 2023, 388, 135891. [Google Scholar] [CrossRef]
  22. Europian Parliament—Directorate General for Internal Policies. 2009. Available online: https://www.europarl.europa.eu/document/activities/cont/201111/20111130ATT32841/20111130ATT32841EN.pdf (accessed on 14 February 2025).
  23. Schittekatte, T.; Pototschnig, A.; Meeus, L.; Jamasb, T.; Llorca, M. Making the TEN-E regulation compatible with the Green Deal: Eligibility, selection, and cost allocation for PCIs. Energy Policy 2021, 156, 112426. [Google Scholar] [CrossRef]
  24. Yafimava, K. The TEN-E Regulation: Allowing a Role for Decarbonised Gas; Oxford Institute of Energy Studies: Oxford, UK, 2022. [Google Scholar]
  25. Ceglia, F.; Marrasso, E.; Samanta, S.; Sasso, M. Addressing energy poverty in the energy community: Assessment of energy, environmental, economic, and social benefits for an Italian residential case study. Sustainability 2022, 14, 15077. [Google Scholar] [CrossRef]
  26. Samargandi, N.; Islam, M.; Sohag, K. Towards realizing vision 2030: Input demand for renewable energy production in Saudi Arabia. Gondwana Res. 2024, 127, 47–64. [Google Scholar] [CrossRef]
  27. Abdoos, M.; Rashidi, H.; Esmaeili, P.; Yousefi, H.; Jahangir, M.H. Forecasting solar energy generation in the Mediterranean region up to 2030–2050 using convolutional neural networks (CNN). Clean. Energy Syst. 2025, 10, 100167. [Google Scholar] [CrossRef]
  28. Li, S.; Yue, Q. Analysis on the energy demand, CO2 and pollutant emissions, and health benefits from urban road transport sector: A case study of Shenyang. Green Low-Carbon Econ. 2024, 2, 143–150. [Google Scholar] [CrossRef]
  29. Li, B.; Zhou, W.; Xian, Y.; Guan, X. Forecasting the energy demand and CO2 emissions of industrial sectors in China’s Beijing-Tianjin-Hebei region under energy transition. Environ. Sci. Pollut. Res. 2024, 31, 7283–7297. [Google Scholar] [CrossRef]
  30. Kamani, D.; Ardehali, M.M. Long-term forecast of electrical energy consumption with considerations for solar and wind energy sources. Energy 2023, 268, 126617. [Google Scholar] [CrossRef]
  31. Malka, L.; Bidaj, F.; Kuriqi, A.; Jaku, A.; Roçi, R.; Gebremedhin, A. Energy system analysis with a focus on future energy demand projections: The case of Norway. Energy 2023, 272, 127107. [Google Scholar] [CrossRef]
  32. Henke, I.; Cartenì, A.; Beatrice, C.; Di Domenico, D.; Marzano, V.; Patella, S.M.; Picone, M.; Tocchi, D.; Cascetta, E. Fit for 2030? Possible scenarios of road transport demand, energy consumption and greenhouse gas emissions for Italy. Transp. Policy 2024, 159, 67–82. [Google Scholar] [CrossRef]
  33. Italy’s Enel (2024)—Consilium.europa.eu. Available online: https://www.world-nuclear-news.org/Articles/Italy-s-Enel-signs-for-up-to-1200-MWe-of-nuclear (accessed on 14 February 2025).
  34. Barelli, L.; Bidini, G.; Ciupageanu, D.; Pelosi, D. Integrating Hybrid Energy Storage System on a Wind Generator to enhance grid safety and stability: A Levelized Cost of Electricity analysis. J. Energy Storage 2021, 34, 102050. [Google Scholar] [CrossRef]
  35. Ali, A.O.; Elmarghany, M.R.; Abdelsalam, M.M.; Sabry, M.N.; Hamed, A.M. Closed-loop home energy management system with renewable energy sources in a smart grid: A comprehensive review. J. Energy Storage 2022, 50, 104609. [Google Scholar] [CrossRef]
  36. Dambhare, M.V.; Butey, B.; Moharil, S.V. Solar photovoltaic technology: A review of different types of solar cells and its future trends. J. Phys. Conf. Ser. 2021, 1913, 012053. [Google Scholar] [CrossRef]
  37. Alcañiz, A.; Grzebyk, D.; Ziar, H.; Isabella, O. Trends and gaps in photovoltaic power forecasting with machine learning. Energy Rep. 2023, 9, 447–471. [Google Scholar] [CrossRef]
  38. Zhang, R.; Lee, M.; Huang, L.; Ni, M. Optimization of battery energy storage system (BESS) sizing in different electricity market types considering BESS utilization mechanisms and ownerships. J. Clean. Prod. 2024, 470, 143317. [Google Scholar] [CrossRef]
  39. Kaewnukultorn, T.; Sepúlveda-Mora, S.B.; Hegedus, S. The impacts of DC/AC ratio, battery dispatch, and degradation on financial evaluation of bifacial PV+ BESS systems. Renew. Energy 2024, 236, 121402. [Google Scholar] [CrossRef]
  40. Nair, U.R.; Sandelic, M.; Sangwongwanich, A.; Dragicevic, T.; Costa-Castello, R.; Blaabjerg, F. An analysis of multi objective energy scheduling in PV-BESS system under prediction uncertainty. IEEE Trans. Energy Convers. 2021, 36, 2276–2286. [Google Scholar] [CrossRef]
  41. Cirio, D.; Conte, F.; Gabriele, B.; Gandolfi, C.; Massucco, S.; Rapizza, M.R.; Silvestro, F. Fast Frequency regulation from a wind farm-BESS unit by model predictive control: Method and hardware-in-the-loop validation. IEEE Trans. Sustain. Energy 2023, 14, 2049–2061. [Google Scholar] [CrossRef]
  42. Liu, B.Y.H.; Jordan, R.C. The long-term average performance of flat-plate solar-energy collectors: With design data for the US, its outlying possessions and Canada. Sol. Energy 1963, 7, 53–74. [Google Scholar] [CrossRef]
  43. Layton, B.E. A comparison of energy densities of prevalent energy sources in units of joules per cubic meter. Int. J. Green Energy 2008, 5, 438–455. [Google Scholar] [CrossRef]
  44. Olczak, P.; Matuszewska, D.; Zabagło, J. The comparison of solar energy gaining effectiveness between flat plate collectors and evacuated tube collectors with heat pipe: case study. Energies 2020, 13, 1829. [Google Scholar] [CrossRef]
  45. Terna: 39.5 GW Installed Wind and Photovoltaic Capacity Reached in June (2024). Available online: https://www.terna.it/en/media/press-releases/detail/electrical-consumption-june-2023 (accessed on 14 February 2025).
  46. PV-Magazine. 2024. Available online: https://www.pv-magazine.com/2024/02/20/italy-added-5-23-gw-of-new-solar-in-2023/ (accessed on 14 February 2025).
  47. IEA. 2024. Available online: https://www.iea.org/reports/italy-2023/executive-summary (accessed on 14 February 2025).
  48. Terna: Electricity Demand Fell by 3.3% in July. 2024. Available online: https://www.terna.it/en/media/press-releases/detail/electrical-consumption-july-2023 (accessed on 14 February 2025).
  49. Terna: Electricity Consumption Increases by 2.2%. 2024. Available online: https://www.terna.it/en/media/press-releases/detail/electricity-consumption-2024#:~:text=According%20to%20Terna%2C%20the%20total,13%20GW%20of%20wind%20power (accessed on 14 February 2025).
  50. Krūmiņš, J.; Kļaviņš, M. Investigating the potential of nuclear energy in achieving a carbon-free energy future. Energies 2023, 16, 3612. [Google Scholar] [CrossRef]
  51. Durdovic, M.; Turcanu, C.; Sala, R.; Geysmans, R.; López-Asensio, S.; Gonçalves, L. The outlooks of nuclear energy in society: Unraveling public attitudes in the context of climate and energy security challenges. Prog. Nucl. Energy 2024, 174, 105286. [Google Scholar] [CrossRef]
  52. Liu, L.; Guo, H.; Dai, L.; Liu, M.; Xiao, Y.; Cong, T.; Gu, H. The role of nuclear energy in the carbon neutrality goal. Prog. Nucl. Energy 2023, 162, 104772. [Google Scholar] [CrossRef]
  53. Gatto, A. Quantifying management efficiency of energy recovery from waste for the circular economy transition in Europe. J. Clean. Prod. 2023, 414, 136948. [Google Scholar] [CrossRef]
  54. Thimet, P.J.; Mavromatidis, G. Review of model-based electricity system transition scenarios: An analysis for Switzerland, Germany, France, and Italy. Renew. Sustain. Energy Rev. 2022, 159, 112102. [Google Scholar] [CrossRef]
  55. Testoni, R.; Bersano, A.; Segantin, S. Review of nuclear microreactors: Status, potentialities and challenges. Prog. Nucl. Energy 2021, 138, 103822. [Google Scholar] [CrossRef]
  56. Black, G.; Shropshire, D.; Araújo, K.; van Heek, A. Prospects for nuclear microreactors: A review of the technology, economics, and regulatory considerations. Nucl. Technol. 2023, 209, S1–S20. [Google Scholar] [CrossRef]
  57. Al-Ezzi, A.S.; Ansari, M.N.M. Photovoltaic solar cells: A review. Appl. Syst. Innov. 2022, 5, 67. [Google Scholar] [CrossRef]
  58. Zuo, J.; Dong, L.; Yang, F.; Guo, Z.; Wang, T.; Zuo, L. Energy harvesting solutions for railway transportation: A comprehensive review. Renew. Energy 2023, 202, 56–87. [Google Scholar] [CrossRef]
  59. Shorabeh, S.N.; Firozjaei, H.K.; Firozjaei, M.K.; Jelokhani-Niaraki, M.; Homaee, M.; Nematollahi, O. The site selection of wind energy power plant using GIS-multi-criteria evaluation from economic perspectives. Renew. Sustain. Energy Rev. 2022, 168, 112778. [Google Scholar] [CrossRef]
  60. He, C.; Singh, P.; P’yavka, S.; Wolfe, L.; Caldwell, K.; Islam, T.M.; Tang, C.; Mustafa, A. Balancing Trade-Offs: The Energy Efficiency of Unmanned Aircraft Systems Integration in Last-Mile Delivery and Operational Policy Restrictions. In Proceedings of the AIAA Aviation Forum and Ascend, Las Vegas, NV, USA, 29 July–2 August 2024; p. 3646. [Google Scholar]
  61. Alphan, H. Modelling potential visibility of wind turbines: A geospatial approach for planning and impact mitigation. Renew. Sustain. Energy Rev. 2021, 152, 111675. [Google Scholar] [CrossRef]
  62. Alanbay, O. ERP selection using expert choice software. In Proceedings of the International Symposium on the Analytic Hierarchy Process, Honolulu, HI, USA, 8–10 July 2005. [Google Scholar]
  63. Bagheri, M.; Ibrahim, Z.Z.; Mansor, S.; Manaf, L.A.; Akhir, M.F.; Talaat, W.I.A.W.; Pour, A.B. Application of multi-criteria decision-making model and expert choice software for coastal city vulnerability evaluation. Urban Sci. 2021, 5, 84. [Google Scholar] [CrossRef]
  64. Aszódi, A.; Biró, B.; Adorján, L.; Dobos, Á.C.; Illés, G.; Tóth, N.K.; Zagyi, D.; Zsiborás, Z.T. The effect of the future of nuclear energy on the decarbonization pathways and continuous supply of electricity in the European Union. Nucl. Eng. Des. 2023, 415, 112688. [Google Scholar] [CrossRef]
  65. Hjelmeland, M.; Nøland, J.K.; Backe, S.; Korpås, M. The role of nuclear energy and baseload demand in capacity expansion planning for low-carbon power systems. Appl. Energy 2025, 377, 124366. [Google Scholar] [CrossRef]
Figure 1. Annual carbon dioxide emissions worldwide from 1940 to 2024 (in billion metric tons).
Sustainability 17 03743 g001
Figure 2. Greenhouse gas emission reduction targets by 2030 for EU member states.
Sustainability 17 03743 g002
Figure 3. Electricity consumption in Italy (December 2023) (34.5% of demand covered by renewables).
Sustainability 17 03743 g003
Figure 4. The mean contributions of the different energy sources to the Italian daily electrical energy demand in the 2023 and amount of energy to be supplied due to the replacement of 7M ICEVs powered vehicles with equivalent BEV ones.
Sustainability 17 03743 g004
Figure 5. A forecast of the mean contributions of the different energy sources to the Italian daily electrical energy demand in 2030 on the basis of FIT 55 constraints and the amount of energy to be supplied due to the replacement of 7M ICE-powered vehicles with equivalent BEV ones.
Sustainability 17 03743 g005
Figure 6. Possible scenarios for fixing Italian energy demand in 2030 under the EU FIT for 55 constraints: (a) photovoltaic energy and BESS storage system, (b) wind energy and BESS storage system, (c) nuclear energy and BESS storage system, and (d) gas turbine fossil fuel thermal power plants.
Sustainability 17 03743 g006aSustainability 17 03743 g006b
Figure 7. Comparison of 4 research scenarios.
Sustainability 17 03743 g007
Table 1. Italy’s goals under the FIT for 55 agreements.
TopicTargetExpectation
CO2DecreasingThe target for 2030 is −43% and for 2050 is −63% (−4.4% per year)
Fossil fuelsDecrease of 34%Currently, renewable and low-carbon gases make up 85%, driving the transition to phase out fossil fuels by 2030.
H240 GW electrolyzer capacityThis target is 2030 and involves making 10 tons of renewable hydrogen
Forest areaIncreasingAdsorb 310 MT CO2 (this target is related to 2030)
TransportationReplacing ICEVs with H2, CH4 and electric5% (now), 16% (2030), and 50% (2050) of vehicles
CBAM (Carbon Border Adjustment Mechanism)Transport of harmful industrial to non-EUImport of iron, steel, cement, fertilizers, aluminum, hydrogen production, and electricity instead of products into the EU
Fund to support65 billion eurosFund sources: new energy trading; carbon price; buy allowance; revenues of social climate fund; taxes
Aviation and maritimeIncreasing the uptake of greener fuelsAviation: decrease from 2% in 2025 to 6% in 2030 and 70% in 2050
Maritime: decrease from 2% in 2025 to 6% in 2030 and 80% in 2050
CH4Cutting methane emissions60% of production is related to animal grazing, energy, waste, and biomass burning
Energy taxationRevise the rulesIn the industrial areas: decreasing the tax on renewable energy users and on the other hand, increasing the taxes on fossil fuel users
Boost renewable energyPrevent the import of fuels from RussiaUnder the new rule, renewable energy sources have to increase to 42.5% by 2030
BuildingsReducing energy consumptionNew buildings will have to be zero-emission; by 2030, this will apply to all buildings
Table 2. Italian nuclear power plants.
Reactor NameModelReactor TypeReference Unit Power (MWe)Permanent Shutdown
GariglianoBWR-1BWR150March 1982
LatinaMAGNOXGCR153December 1987
CaorsoBWR-4 (Mark 2)BWR860July 1990
Enrico FermiW (4-loop)PWR260July 1990
Mwe: one million watts of electric capacity.
Disclaimer/Publisher’s Note: The statements, opinions and data contained in all publications are solely those of the individual author(s) and contributor(s) and not of MDPI and/or the editor(s). MDPI and/or the editor(s) disclaim responsibility for any injury to people or property resulting from any ideas, methods, instructions or products referred to in the content.