Article

Sustainable Breakthrough in Manganese Oxide Thermochemical Energy Storage: Advancing Efficient Solar Utilization and Clean Energy Development

School of Energy and Power Engineering, Xi’an Jiaotong University, Xi’an 710049, China
*
Author to whom correspondence should be addressed.
Sustainability 2025, 17(8), 3752; https://doi.org/10.3390/su17083752
Submission received: 12 March 2025 / Revised: 11 April 2025 / Accepted: 19 April 2025 / Published: 21 April 2025

Abstract

:
Solar power generation systems, recognized for their high energy quality and environmental benefits, require efficient energy storage to ensure stable grid integration and reduce reliance on fossil fuels. Thermochemical energy storage (TCS) using metal oxides, such as the Mn2O3/Mn3O4 redox system, offers advantages like high energy density, wide temperature range, and stability, making it ideal for solar power applications. This study investigates Mn3O4 and Mn2O3 as initial reactants, analyzing reaction temperature range, rate, conversion efficiency, and cyclic performance via synchronous thermal analysis. Microstructural characterization was performed using XRD, SEM, BET, XPS, nanoparticle size, and zeta potential measurements. The results show that Mn3O4 reversibly converts to Mn2O3 with over 100% conversion efficiency over five cycles with 3.3% weight loss, indicating stable performance. Mn3O4 oxidation follows Arrhenius’ Law below 700 °C but deviates at higher temperatures. The oxidation mechanism function is G(α) = α and f(α) = 1, with an activation energy of 20.47 kJ/mol and a pre-exponential factor of 0.268/s. Mn2O3 synthesized via ammonia precipitation exhibits reversible redox behavior with 3.3% weight loss but samples from low-concentration precursors show poor cyclic performance. The reduction reaction of Mn2O3 has an activation energy of 249.87 kJ/mol. By investigating the Mn2O3/Mn3O4 redox system for TCS, this study advances its practical integration into solar thermal power systems and offers critical guidance for developing scalable, low-carbon energy storage technologies. These findings can support Sustainable Development Goals (SDGs) by advancing renewable energy storage technologies, reducing carbon emissions, and promoting the integration of solar power into sustainable energy grids.

1. Introduction

To deal with global warming and high carbon emissions, we need to increase the proportion of clean and renewable energy in primary energy consumption. Among many renewable energy sources, solar energy has attracted the attention of many scholars because of its wide distribution, inexhaustible supply, and great development potential [1,2,3,4]. Due to the intermittent instability of the solar energy supply, solar power generation systems cannot be fully integrated into the grid, which has restricted the rapid development of solar power generation technology for a long time [5,6,7].
It was found that the combination of a thermal energy storage system and solar power generation system could effectively solve the problem of unstable power generation [8,9,10]. The thermal energy storage system mainly stores the temporarily unused or redundant solar energy in the medium through a certain heat storage method, then releases and uses it when the demand increases or solar energy is supplied intermittently [11,12,13].
Thermochemical energy storage (TCS) stores heat in the chemical bond of a substance through certain chemical reactions [14,15,16]. This kind of method can keep heat stable for a long time and adapt to a wide range of temperatures [17,18]. The thermochemical energy storage technology based on metal oxides mainly uses its reversible oxidation-reduction reaction to store and release heat [19,20]. The higher reaction (500~1200 °C) meets the requirements of the solar power generation system [21]. In addition, the redox reaction has the advantages of higher energy storage density, a simpler device, and low heat loss [22,23,24].
Among many metal oxides, Co3O4/CoO, CuO/Cu2O, Fe2O3/Fe3O4, BaO2/BaO, Mn2O3/Mn3O4, and so on were found to have the potential for thermochemical energy storage by some scholars’ research [25]. Among them, a Mn2O3/Mn3O4 reaction system has attracted the interest of some scholars because of its abundant reserves, low price, non-toxicity, and the fact that it is harmless [26]. The redox reaction equation of the reaction system is as follows:
6Mn2O3 ↔ 4Mn3O4 + O2(g)  ∆H = 202 kJ/kg
Gokon et al. [27] compared the heat release kinetics of the Fe-substituted Mn2O3/Mn3O4 material in high-temperature thermochemical energy storage between long-term thermal cycling and initial preparation, revealing changes in different reaction models and kinetic parameters and their effects on the energy storage performance of the next generation of concentrated solar power generation systems. Huang et al. [28] modified manganese-based oxide with silicon doping, which significantly improved the thermochemical energy storage performance of the material, solved the problem of insufficient reoxidation capacity of pure manganese trioxide, and provided theoretical support and application guidance for the development of low-cost environmentally friendly large-scale thermochemical energy storage materials. Fetisov et al. [29] studied the redox characteristics of a Mn2O3/Mn3O4 reaction system with a thermogravimetric analysis. It was found that Mn3O4 could not be oxidized to Mn2O3 at the cooling stage. However, the research on Mn series oxides by Müller et al. [30] and Block et al. [31] showed that Mn2O3/Mn3O4 could realize the reversible redox reaction cycle. According to the analysis results of Zhao et al. [32], the chemical activity of Mn2O3 is related to its physical properties, which may be one of the reasons for the above contradiction. In the follow-up study on the physical nature of Mn2O3, it was found that the parameters in the synthesis of Mn2O3 had a great influence on its physical nature, especially the concentration of the precursor solution. In addition, Carillo et al. [23] emphatically studied the effect of the initial particle size of Mn2O3/Mn3O4 on redox reactions. They found that the reaction rate and conversion temperature of the oxidation reaction decreased gradually as the particle size decreased. Meanwhile, the decrease in particle size also brought about a sintering phenomenon, which led to the end of the cycle. Liu et al. [33] investigated the redox and melting properties of mangan-based ores to test their potential applications in thermochemical energy storage. The results show that manganese ore with a high oxygen capacity and deformation temperature has the potential to be used as a TCS material.
This study innovatively investigates the Mn2O3/Mn3O4 redox system through integrated advanced characterization techniques and kinetic analysis to elucidate its thermochemical energy storage mechanisms. The redox reaction characteristics, microstructure properties, and phase transitions of Mn3O4 and synthetic Mn2O3 were analyzed using synchronous thermal analysis (STA), X-ray diffraction (XRD), and scanning electron microscopy (SEM). The key findings reveal that Mn3O4 undergoes an initial transformation to Mn2O3 prior to participating in reversible redox cycles, thereby clarifying the reaction pathway. Furthermore, the influence of a precursor solution concentration on Mn2O3’s physical properties and reactivity was systematically explored, emphasizing the critical role of synthesis conditions in material design. The oxidation-reduction kinetics of both Mn3O4 and Mn2O3 were rigorously analyzed, providing a theoretical foundation for optimizing reaction conditions to enhance energy conversion efficiency.
By integrating these approaches, this work advances the fundamental understanding of the Mn2O3/Mn3O4 system while offering practical guidance for its application in solar thermal energy storage systems, thereby facilitating the development of efficient and sustainable energy solutions.

2. Materials and Methods

2.1. Materials

High-purity Mn3O4 (99.97%) supplied by McLean (Shanghai, China) was used in the experiments. Mn2O3 was synthesized via the ammonia precipitation method using manganese nitrate (50% by mass, analytical reagent, AR) and ammonia solution (25–28% by mass, AR).
The sample preparation procedure was as follows: First, a series of precursor solutions with varying concentration gradients were prepared by mixing Mn(NO3)2 (50% by mass, AR) with distilled water. Subsequently, NH3·H2O (25–28% by mass, AR) was added dropwise to the Mn(NO3)2 solution. The mixture was allowed to stand for 20 h to facilitate solidification. After filtration and washing, the samples were dried overnight at 80 °C. The dried solid was ground into a fine powder. A brown coloration of the powder indicates that Mn3O4 is the dominant phase. The powder was then calcined in a muffle furnace at 700 °C for 4 h with a heating rate of 2 °C/min under static air to yield the final required sample. For clarity in subsequent descriptions, the samples were labeled Mnx, where x represents the concentration of the manganese nitrate precursor solution in mol/L. For example, a sample prepared from a 0.025 mol/L manganese nitrate solution was denoted as Mn0.025.
Samples were prepared using manganese nitrate solutions with initial concentrations of 0.025, 0.05, 0.1, 0.5, 1, 2, 3, 4, 5, 6, and 7.6 mol/L, and were named Mn0.025, Mn0.05, Mn0.1, Mn0.5, Mn1, Mn2, Mn3, Mn4, Mn5, Mn6, and Mn7.6, respectively.

2.2. Thermal Analysis

The samples were analyzed using a synchronous thermal analysis (STA) instrument (STA 449F3, Netzsch, Germany). This STA system combines thermogravimetric analysis (TGA) and differential scanning calorimetry (DSC), enabling simultaneous measurement of mass changes and heat flow during oxidation-reduction reactions. The experiments were performed in a reactive gas atmosphere containing 20% oxygen and 80% nitrogen. A precisely weighed sample was loaded into the STA instrument for thermal analysis, with the temperature ranging from ambient to 1000 °C at a constant heating and cooling rate of 2 °C/min. Furthermore, the cyclic performance of the sample was evaluated through a cycle experiment, which consisted of two parts: heating to 1000 °C at 500 °C and cooling back to 500 °C at a rate of 2 °C/min.

2.3. Kinetic Analysis

Kinetic analysis methods are primarily categorized into isothermal and non-isothermal approaches. The isothermal method involves heating the sample under constant temperature conditions to obtain the thermal analysis curve. The non-isothermal method can be further divided into single-heating rate and multi-heating rate methods, depending on whether the heating and cooling rates are fixed.
In the study of the thermal conversion performance of Mn3O4, the isothermal method was employed to analyze the reaction kinetics of the Mn2O3/Mn3O4 system. The oxidation reaction kinetics were investigated through isothermal experiments, where the sample was subjected to oxidation at different constant temperatures. During the heating stage, the sample was heated to 1000 °C at a rate of 2 °C/min and maintained in an air atmosphere for 1 h. In the cooling stage, the temperature was reduced to the desired isothermal temperature at a rate of 2 °C/min under a nitrogen atmosphere to prevent premature oxidation. The temperature was held at the target isotherm for 10 min, after which the atmosphere was switched to air to initiate the oxidation reaction. The isothermal stage lasted approximately 5.5 h until the reaction was completed, followed by cooling to room temperature.
For the thermal conversion study of Mn2O3, the non-isothermal multi-heating rate method was utilized to determine the reduction reaction kinetics. Using sample Mn0.5 as an example, the thermal analysis data at 50% conversion (α) obtained from experiments at heating rates of 2 °C/min, 5 °C/min, and 10 °C/min in an air atmosphere served as the basis for kinetic analysis. The reaction kinetics were subsequently calculated and analyzed.

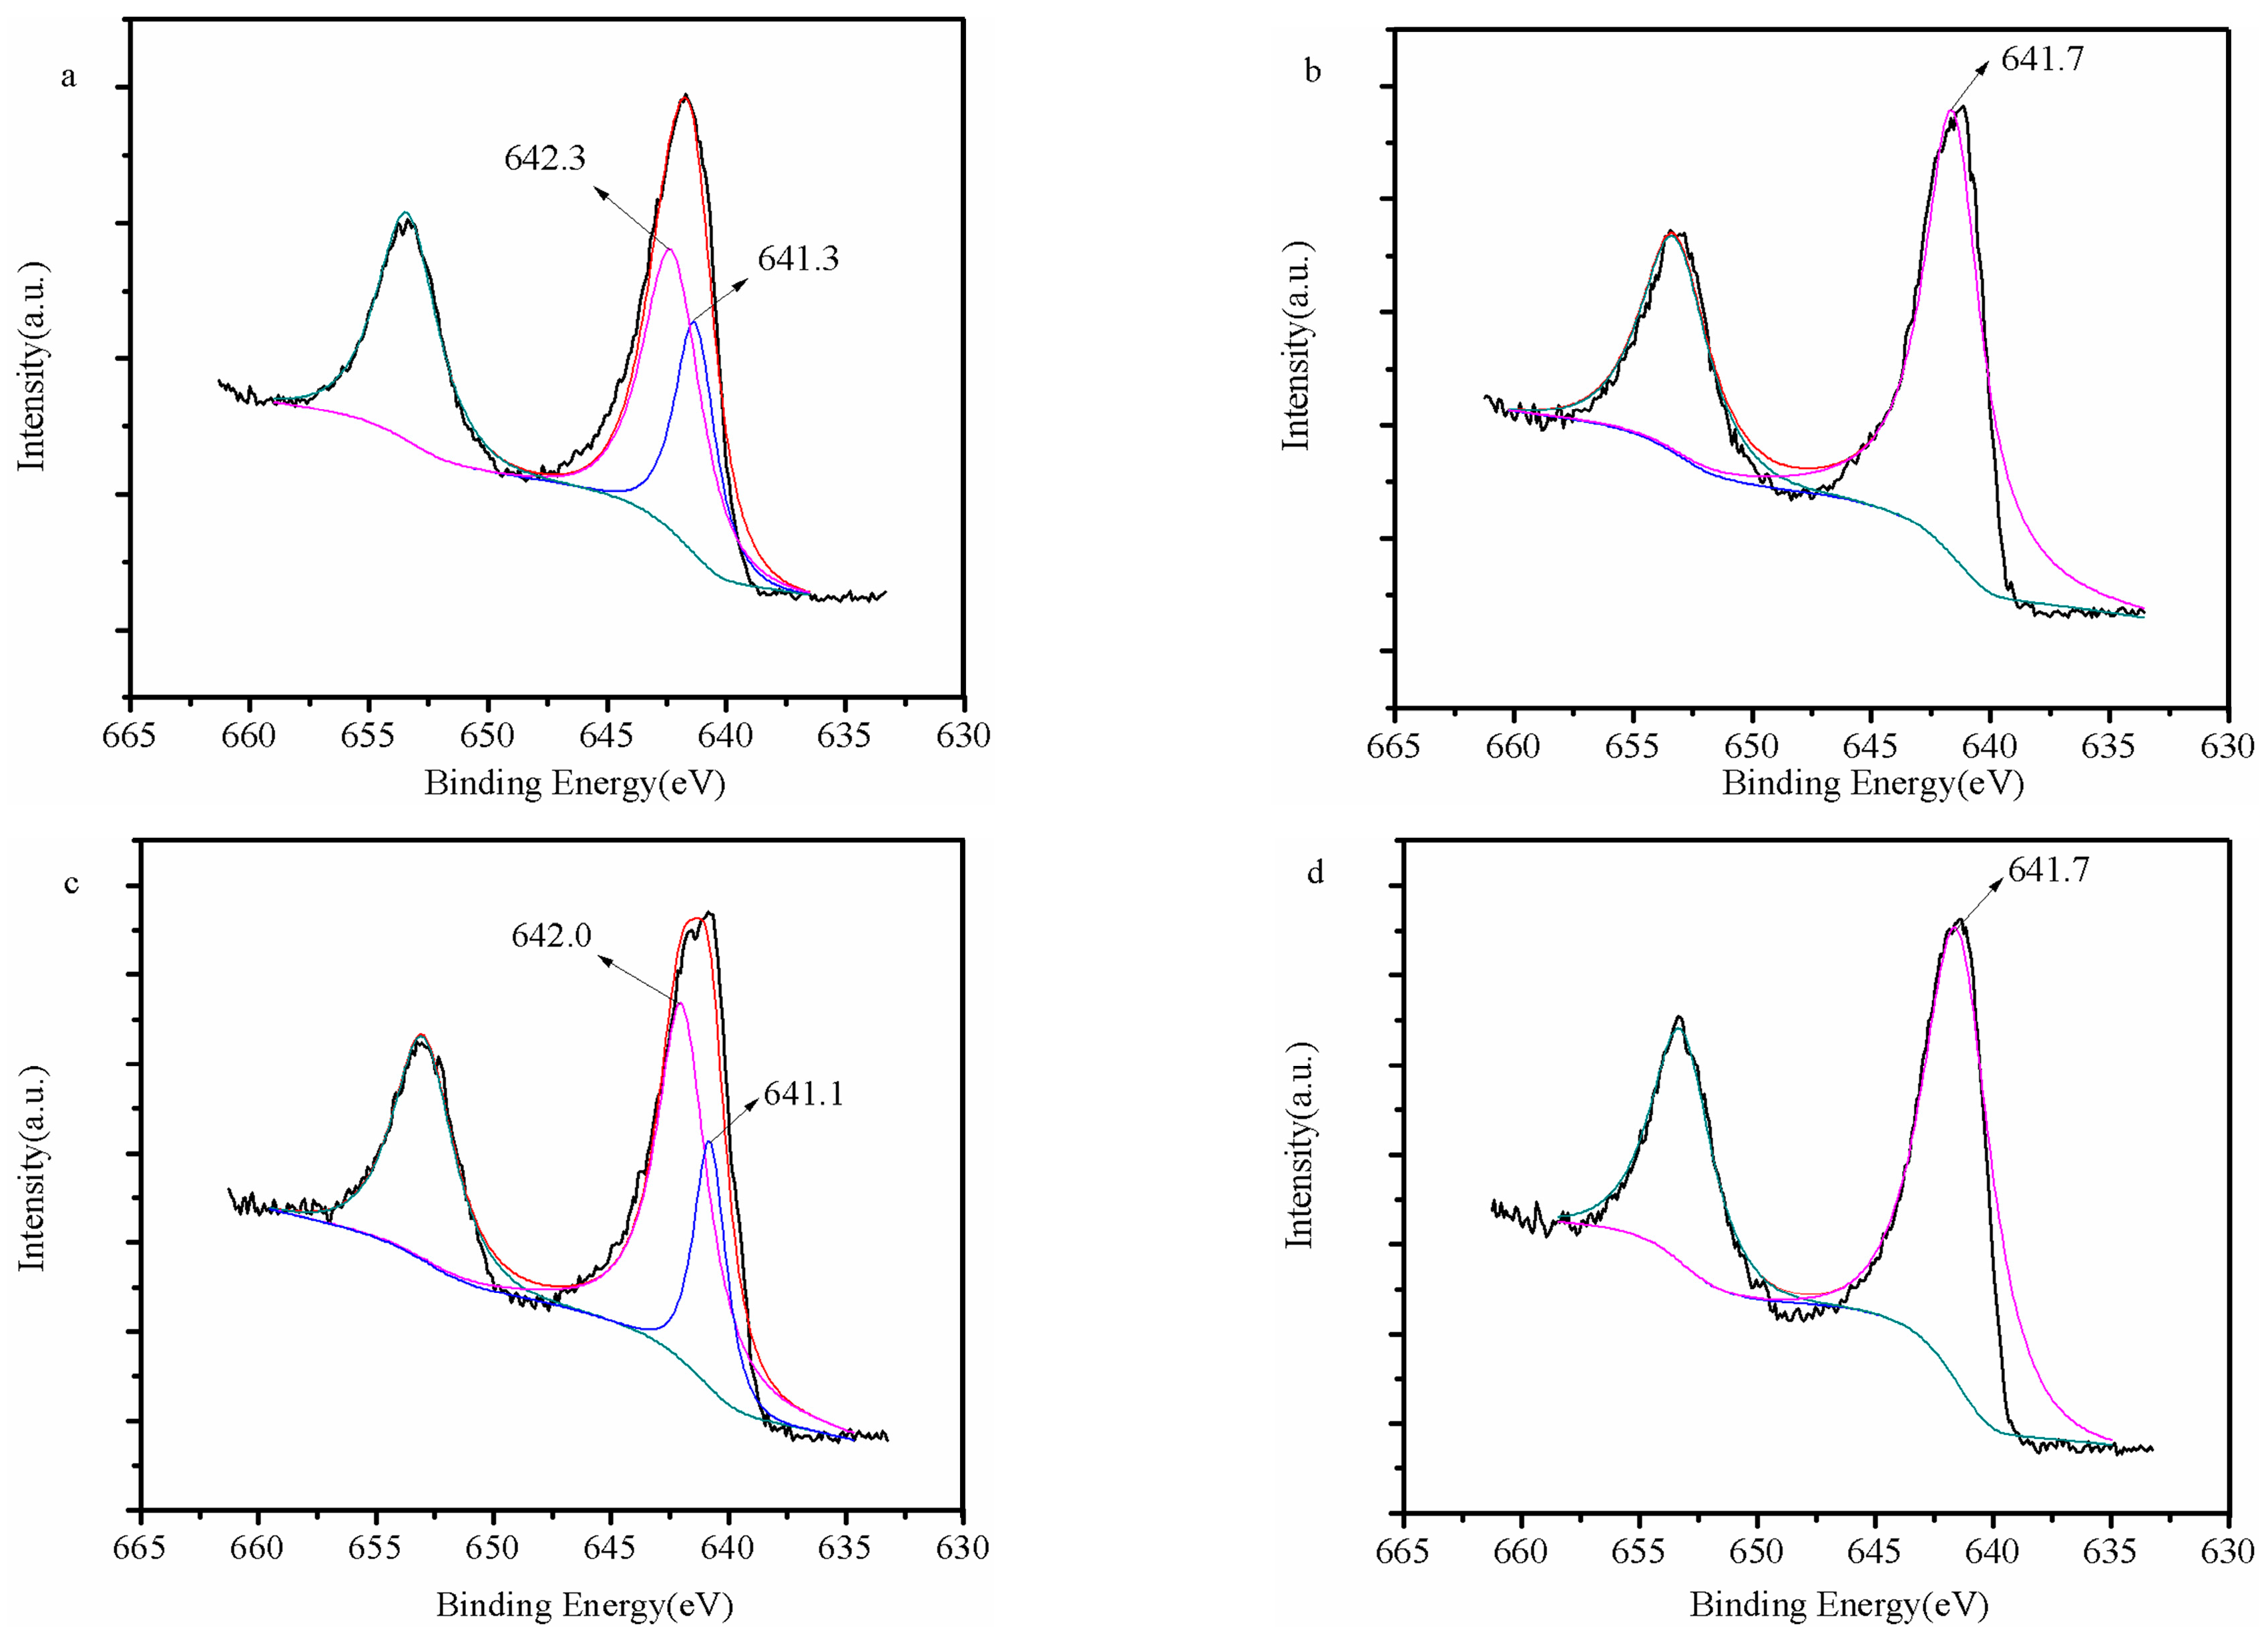
2.4. Material Characterization

To investigate the impact of reactant morphology on reaction properties, comprehensive characterization techniques were employed, including X-ray diffraction (XRD), field emission scanning electron microscopy (SEM), Brunauer–Emmett–Teller (BET) analysis, X-ray photoelectron spectroscopy (XPS), nanoparticle size analysis, and zeta potential measurements.
The diffraction pattern of the sample was obtained using XRD, and the crystal size of the sample was calculated according to the Debye–Scherrer formula. For qualitative analysis of metal oxides, the sample crystals were analyzed with an XRD meter (Xpert pro, Almelo, The Netherlands), employing characteristic Cu Kα radiation (40 Kv, 40 mA). SEM was used to observe the microstructure of the samples, which were made in Tokyo, Japan (Joel 7800f). Zetasizer ultra (ZSE) was used to measure the nanoparticle size distribution. The XPS was used to measure the surface elemental valence states of samples, calibrating all binding energies of Mn 2p with C1s at 284.8 eV as the standard. BET analysis enables the determination of specific surface area and pore structure parameters, which play a critical role in governing the gas–reactant interaction and, consequently, the reaction performance of the material. Nanoparticle size analysis, conducted through physical methods, is primarily employed to measure the particle size distribution of the material.

3. Results and Discussion

3.1. Thermal Conversion Performance Evaluation of Mn3O4

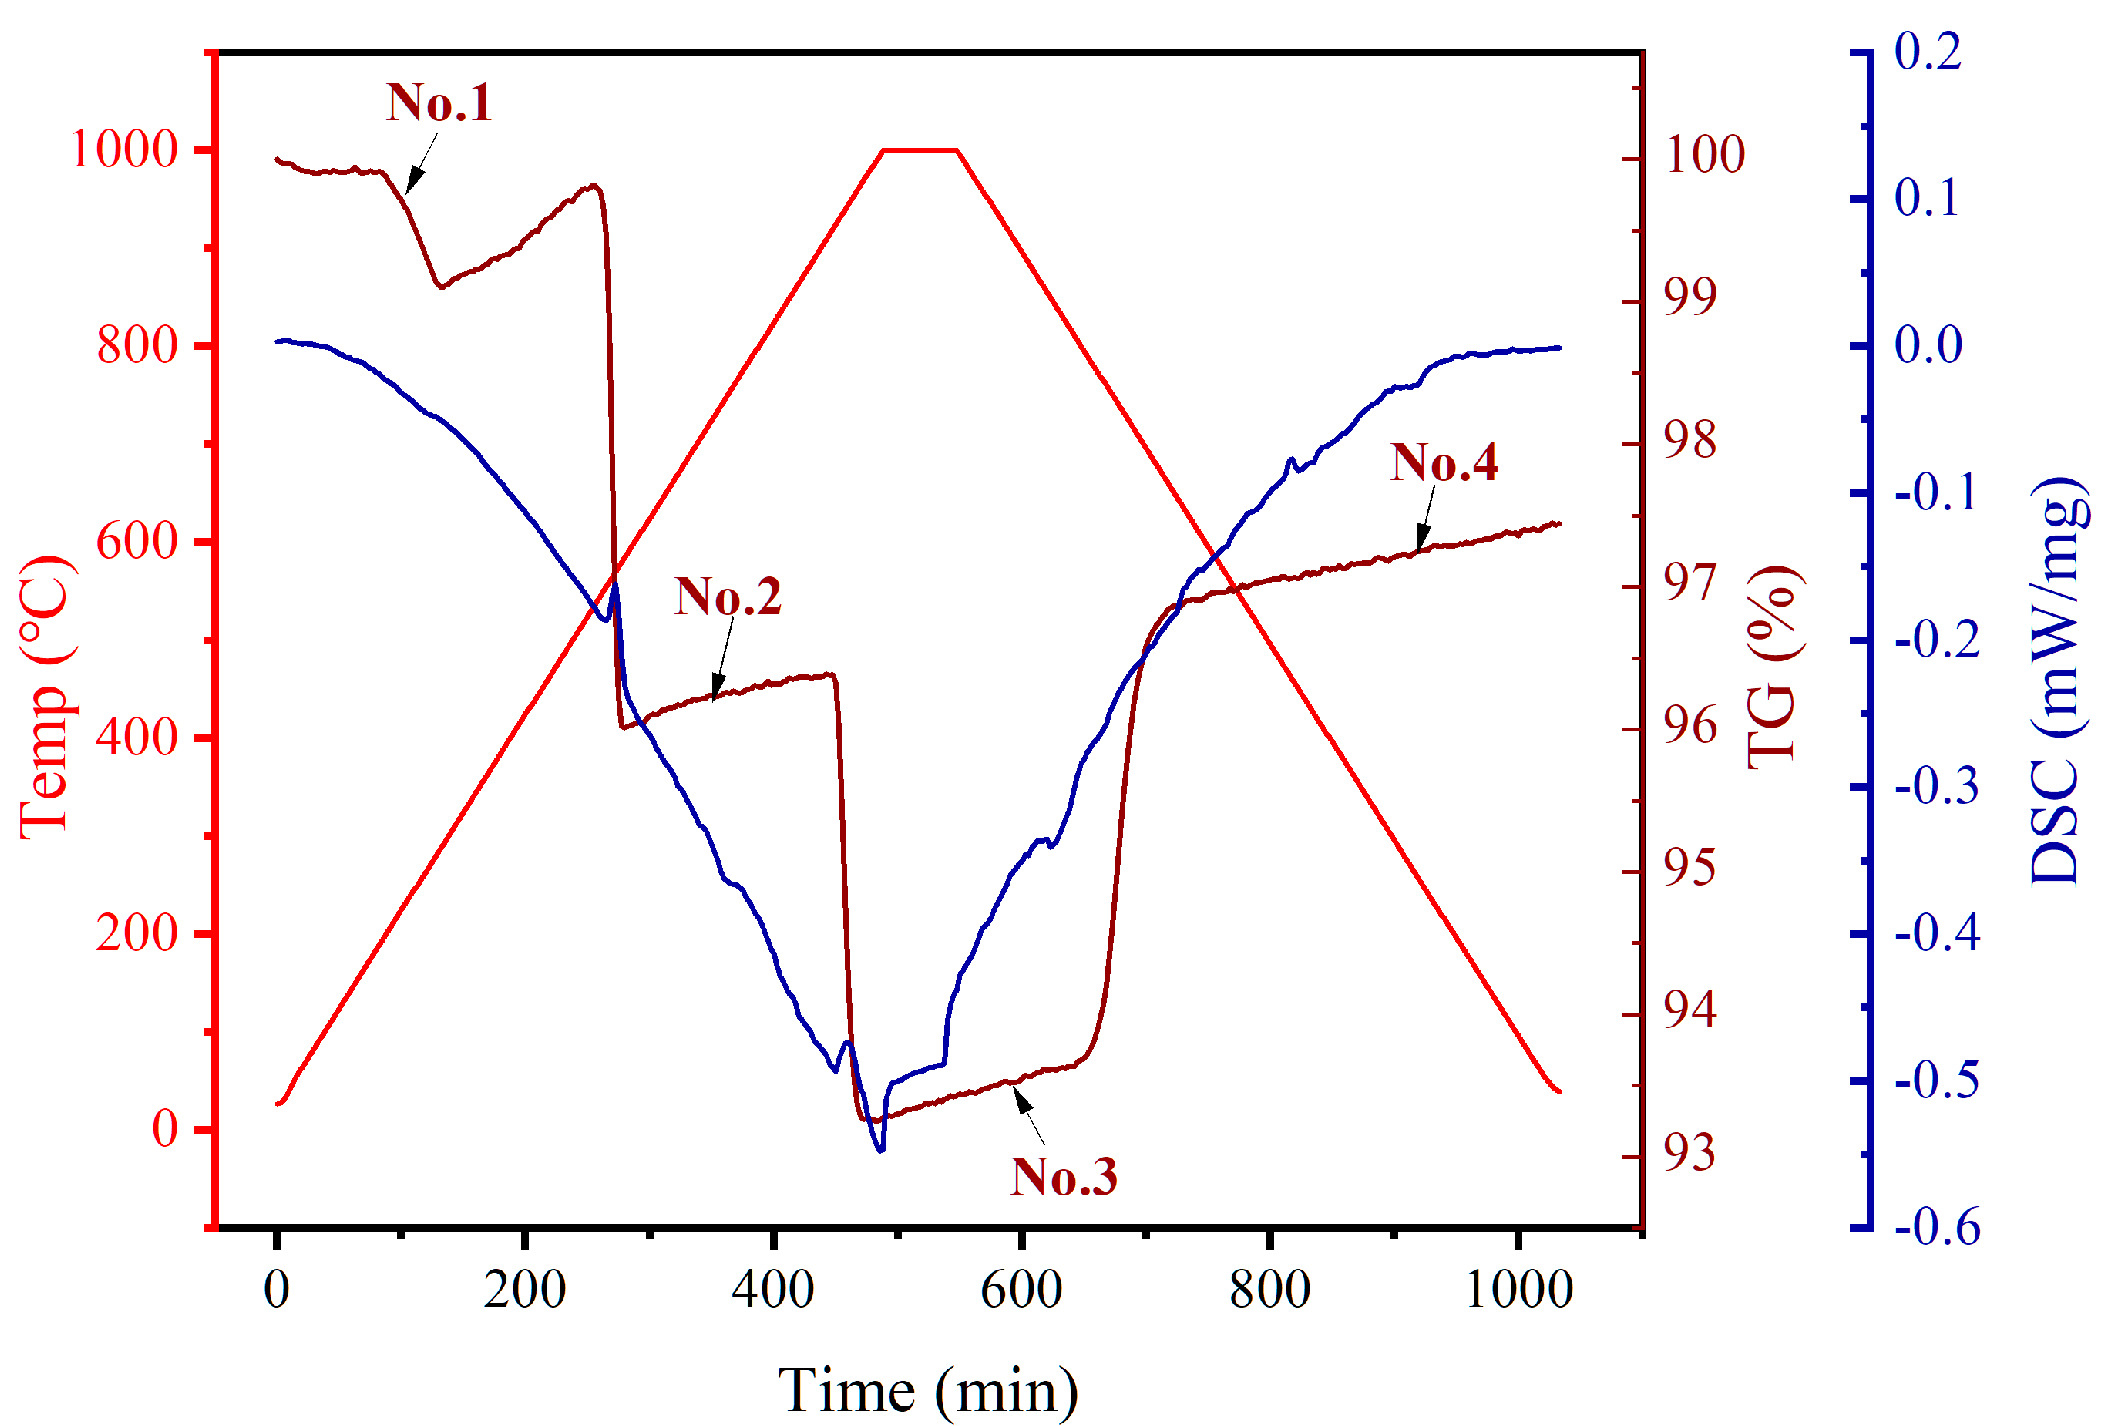
3.1.1. Thermochemical Reaction Assessment

The purchased Mn3O4 was directly loaded into the thermogravimetric analyzer for experimental investigation at a heating and cooling rate of 2 °C/min. As shown in Figure 1, the TG curve exhibits two distinct stages of weight loss during the heating process. In the first stage, when the temperature reaches approximately 550 °C, the TG curve shows a significant decrease to about 97% of the initial weight. In the second stage, when the temperature rises to around 950 °C, the TG curve further declines to approximately 94%. During the cooling process, as the temperature decreases to 700 °C, the TG curve recovers to 97%, stabilizing at a level similar to that observed at the end of the first weight loss stage. Based on the changes in the TG curve illustrated in Figure 1, redox reaction cycles are inferred to occur between the second weight loss stage and the subsequent weight recovery stage.
Concurrently, the DSC curve reveals two prominent endothermic peaks during the heating process, corresponding to the two stages of weight loss observed in the TG curve. The first endothermic peak at around 550 °C indicates the initial phase transformation or decomposition of Mn3O4, while the second endothermic peak near 950 °C suggests the onset of the redox reaction. During cooling, an exothermic peak appears at approximately 700 °C, aligning with the weight recovery in the TG curve.
For a clearer description of the reaction products at each phase, the initial sample and reaction products at each phase were numbered and analyzed. The initial sample was named No.1. The products obtained by two distinct decreases in the TG curve were named No.2 and No.3, respectively. The product after the TG curve rise was named No.4. In order to analyze the sample and products, XRD and XPS tests were conducted. The XPS diffraction results of the Mn 2p of the No.1 sample are shown in Figure 2a. The peak value of 641.3 eV was ascribed to Mn2+ and the value of 642.3 eV was put down to Mn3+. The XRD pattern of the No.1 sample shown in Figure 3a was in keeping with pure Mn3O4 (PDF#24-0734). Thus, it could be ensured that the sample purchased was Mn3O4. The XPS diffraction results of the Mn 2p of the No.2 product are shown in Figure 2b. The peak value of 641.7 eV was put down to Mn3+, showing that Mn was present as Mn3+. To further confirm this, an XRD test was carried out for the No.2 product. As shown in Figure 3b, the XRD pattern of the No.2 product was the same as that of pure Mn2O3 (PDF#78-0390). It could be determined that the No.2 product was Mn2O3. The XPS diffraction results of the Mn 2p of the No.3 product are shown in Figure 2c. The peak value of 641.1 eV was assigned to Mn2+, while the peak value of 642.0 eV was put down to Mn3+. It indicated that the No.3 product was Mn3O4, which was further validated by the XRD results shown in Figure 3c (Mn3O4, PDF#24-0734). The XPS diffraction results of the Mn 2p of the No.4 product are shown in Figure 2d, which is greatly similar to the spectra in Figure 2b. The peak value of 641.7 eV was ascribed to Mn3+, indicating that Mn existed in pure Mn3+. The XRD pattern of the No.4 product shown in Figure 3d was also consistent with pure Mn2O3 (PDF#78-0390). In summary, the thermodynamic analysis of Mn3O4 as the initial material showed that Mn3O4 first turned into Mn2O3, and then Mn2O3 was reduced to Mn3O4. Finally, Mn3O4 was oxidized to Mn2O3. The redox reaction equation is Equation (1). From the above, it can be seen that if Mn3O4 was used as the TCS material, it first reversibly changed to Mn2O3, and then Mn2O3/Mn3O4 actually acted as a circulating substance.

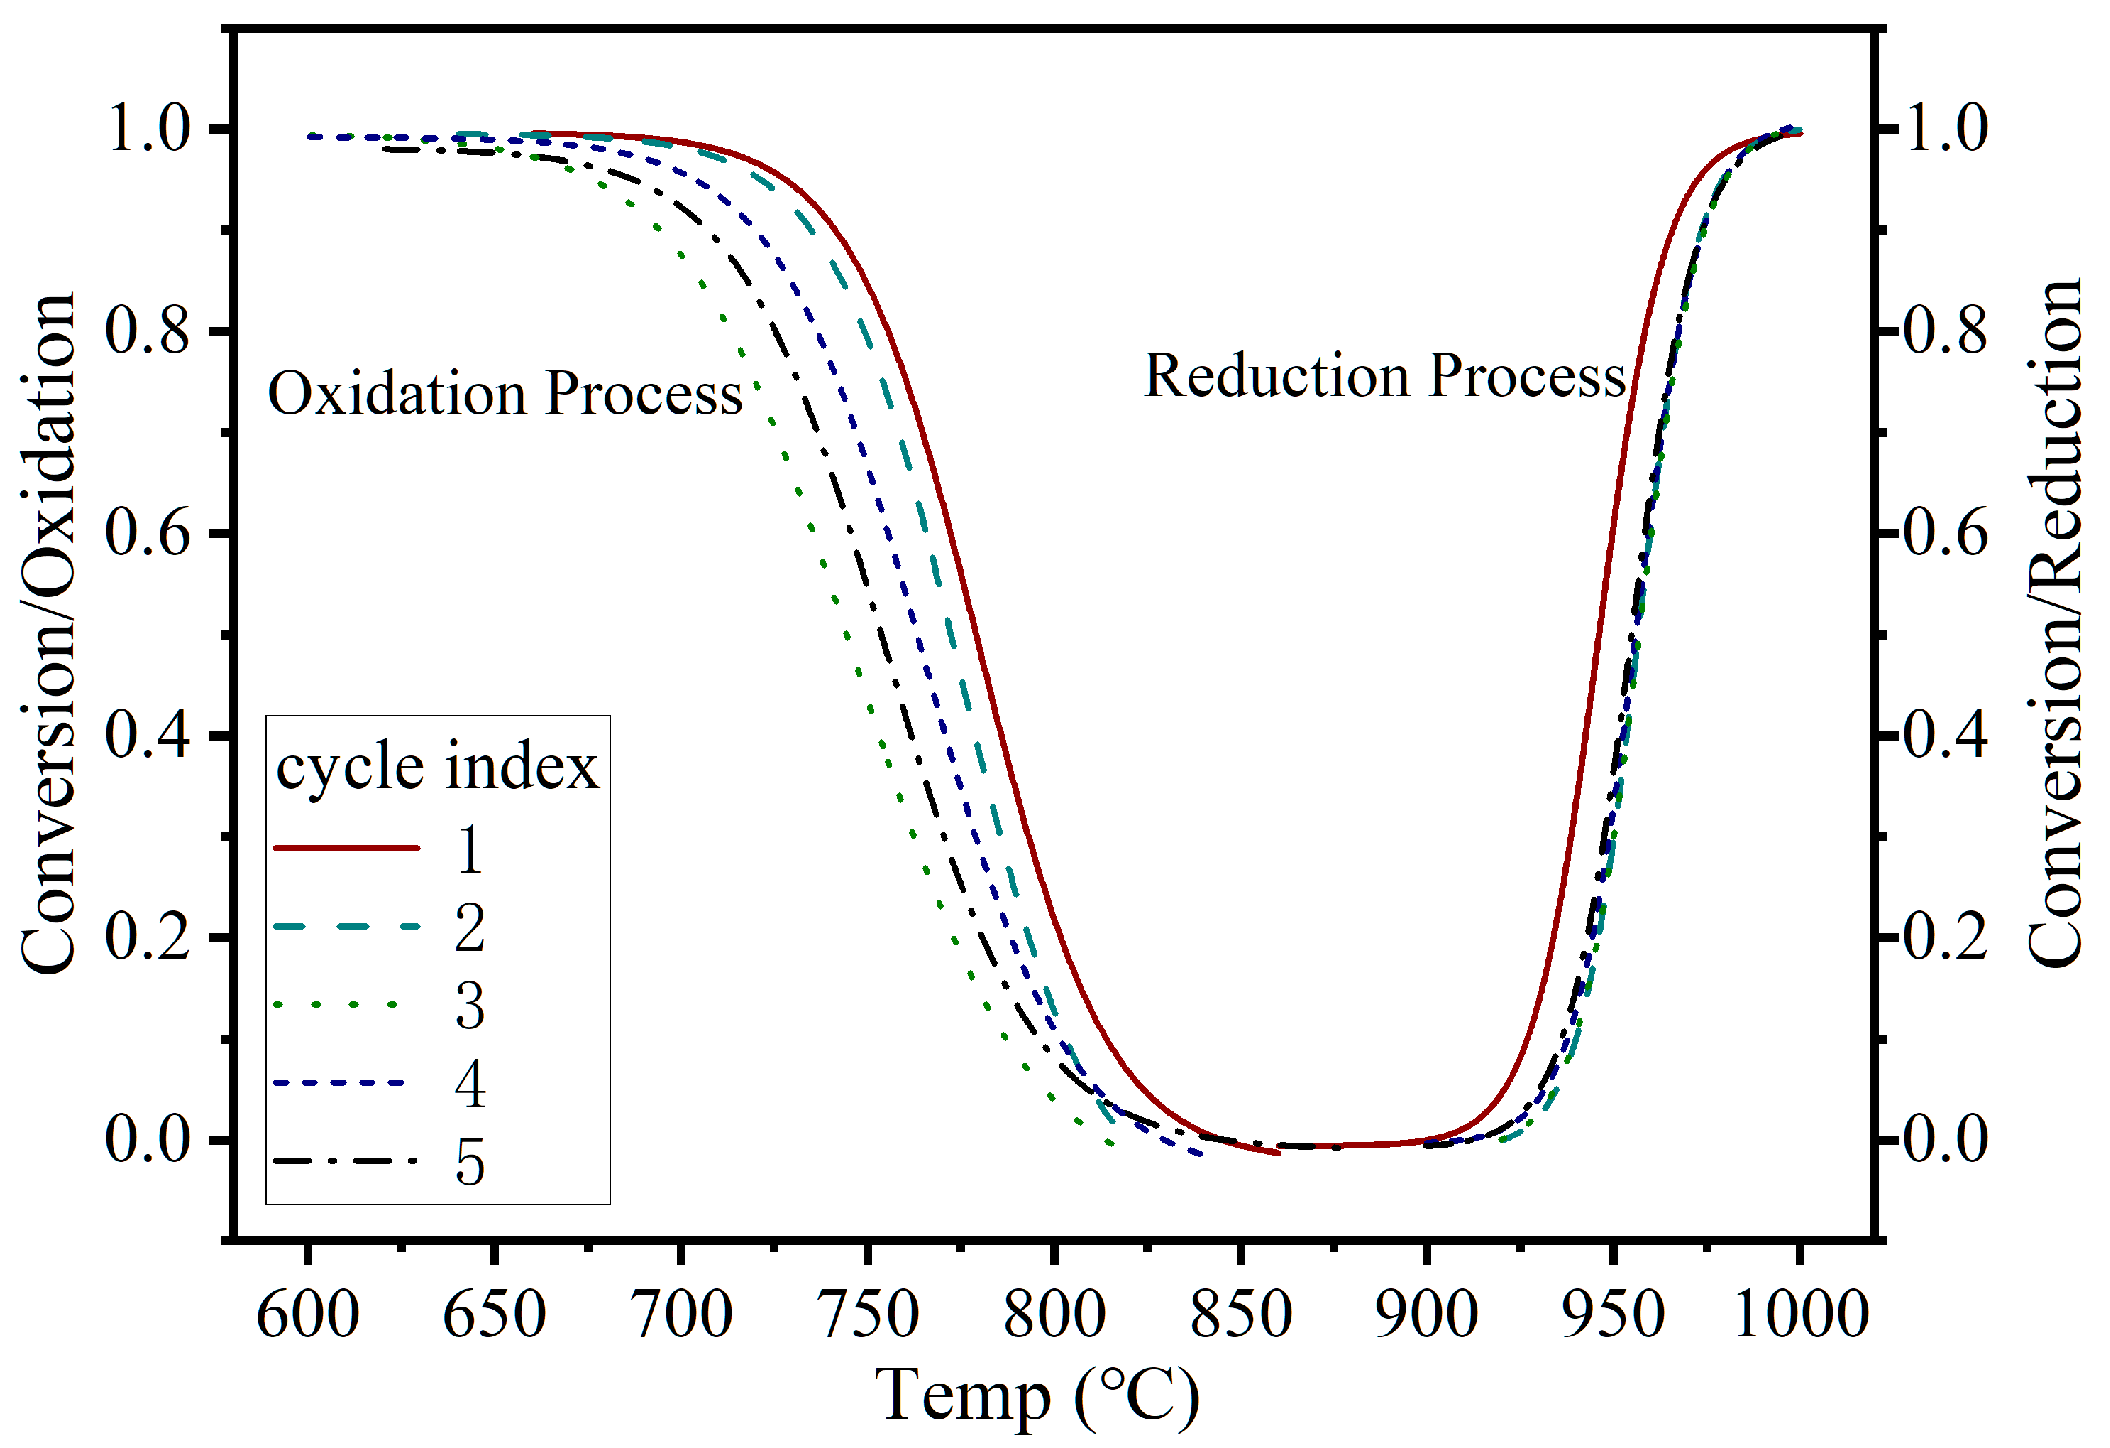
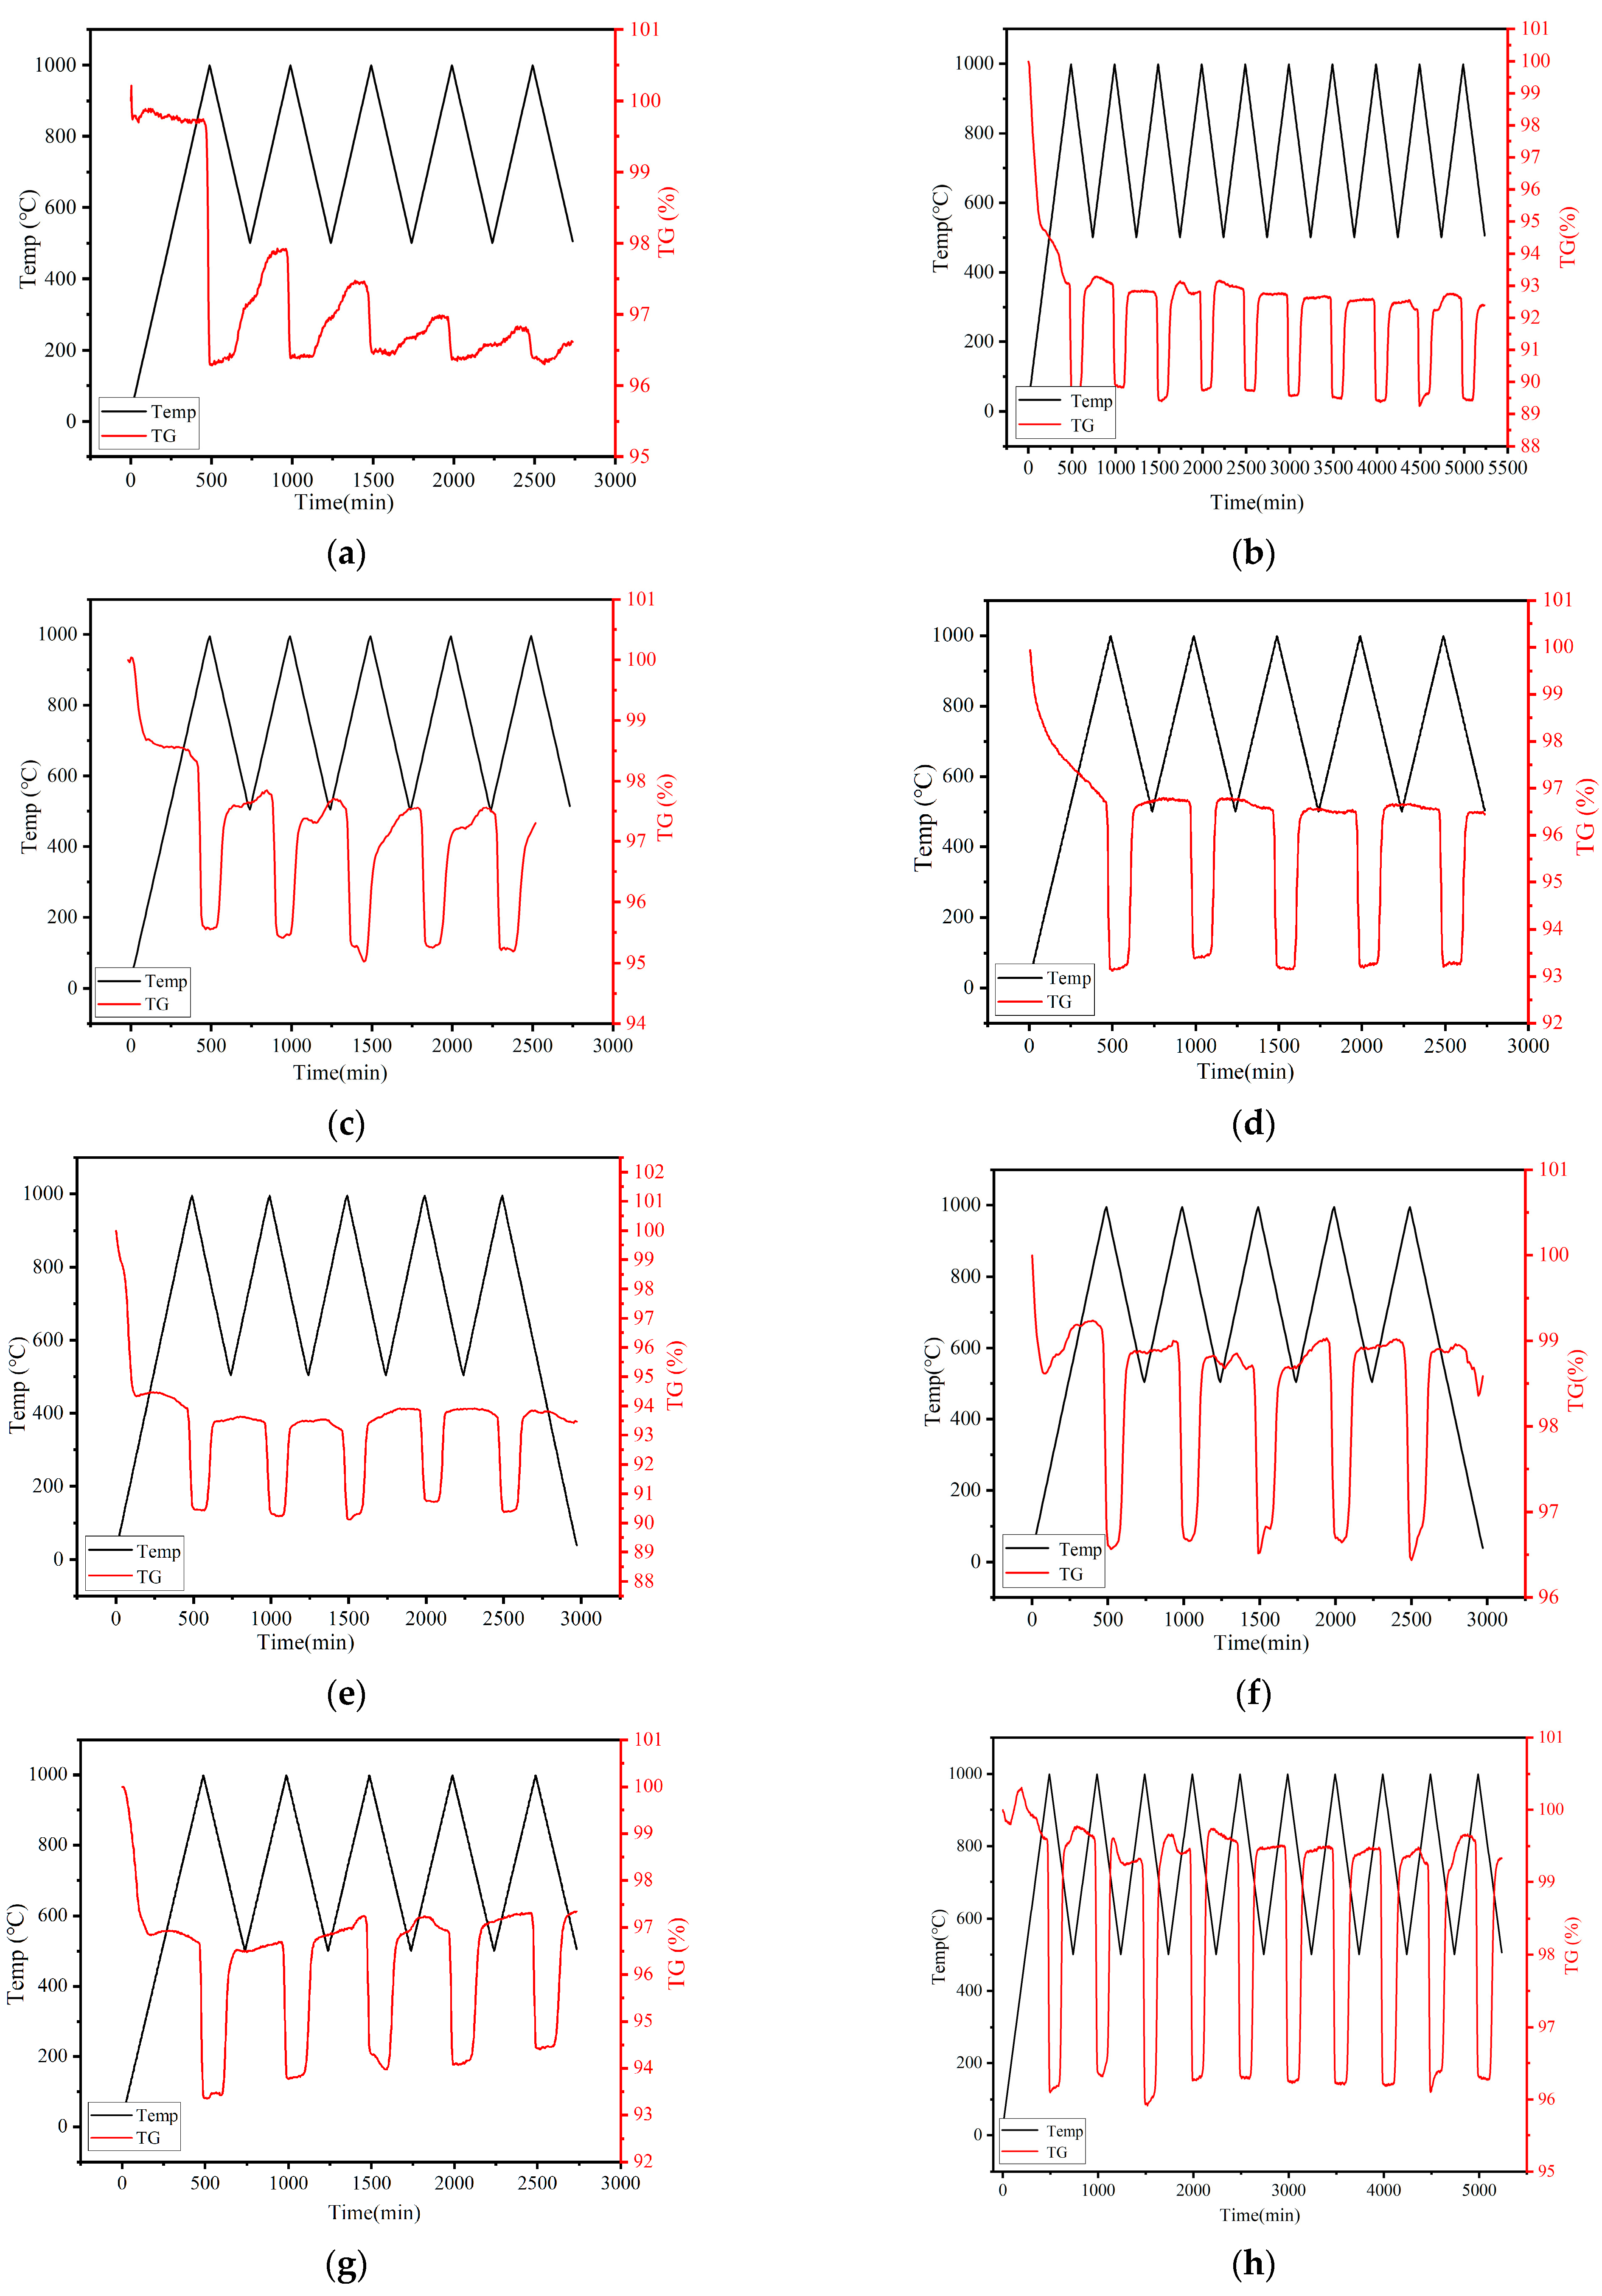
3.1.2. Cyclic Performance Assessment

Figure 4 shows the results of five cyclic experiments conducted on the Mn2O3/Mn3O4 system within a temperature range of 500–1000 °C, with heating and cooling rates of 2 °C/min. The results indicate that the redox reaction proceeds effectively, exhibiting a high conversion rate and a weight loss rate close to 3.3%. Figure 5 illustrates the variation in the reactant conversion with temperature over the five cycles. The reaction temperature range and reaction time remain relatively stable during the reduction reactions of cycles 2–5. However, during the oxidation reactions, the temperature range gradually shifts toward lower temperatures as the number of cycles increases. These results demonstrate that the redox reaction, with Mn3O4 as the initial reactant, exhibits excellent conversion efficiency and cycling performance, highlighting its potential for energy storage applications.

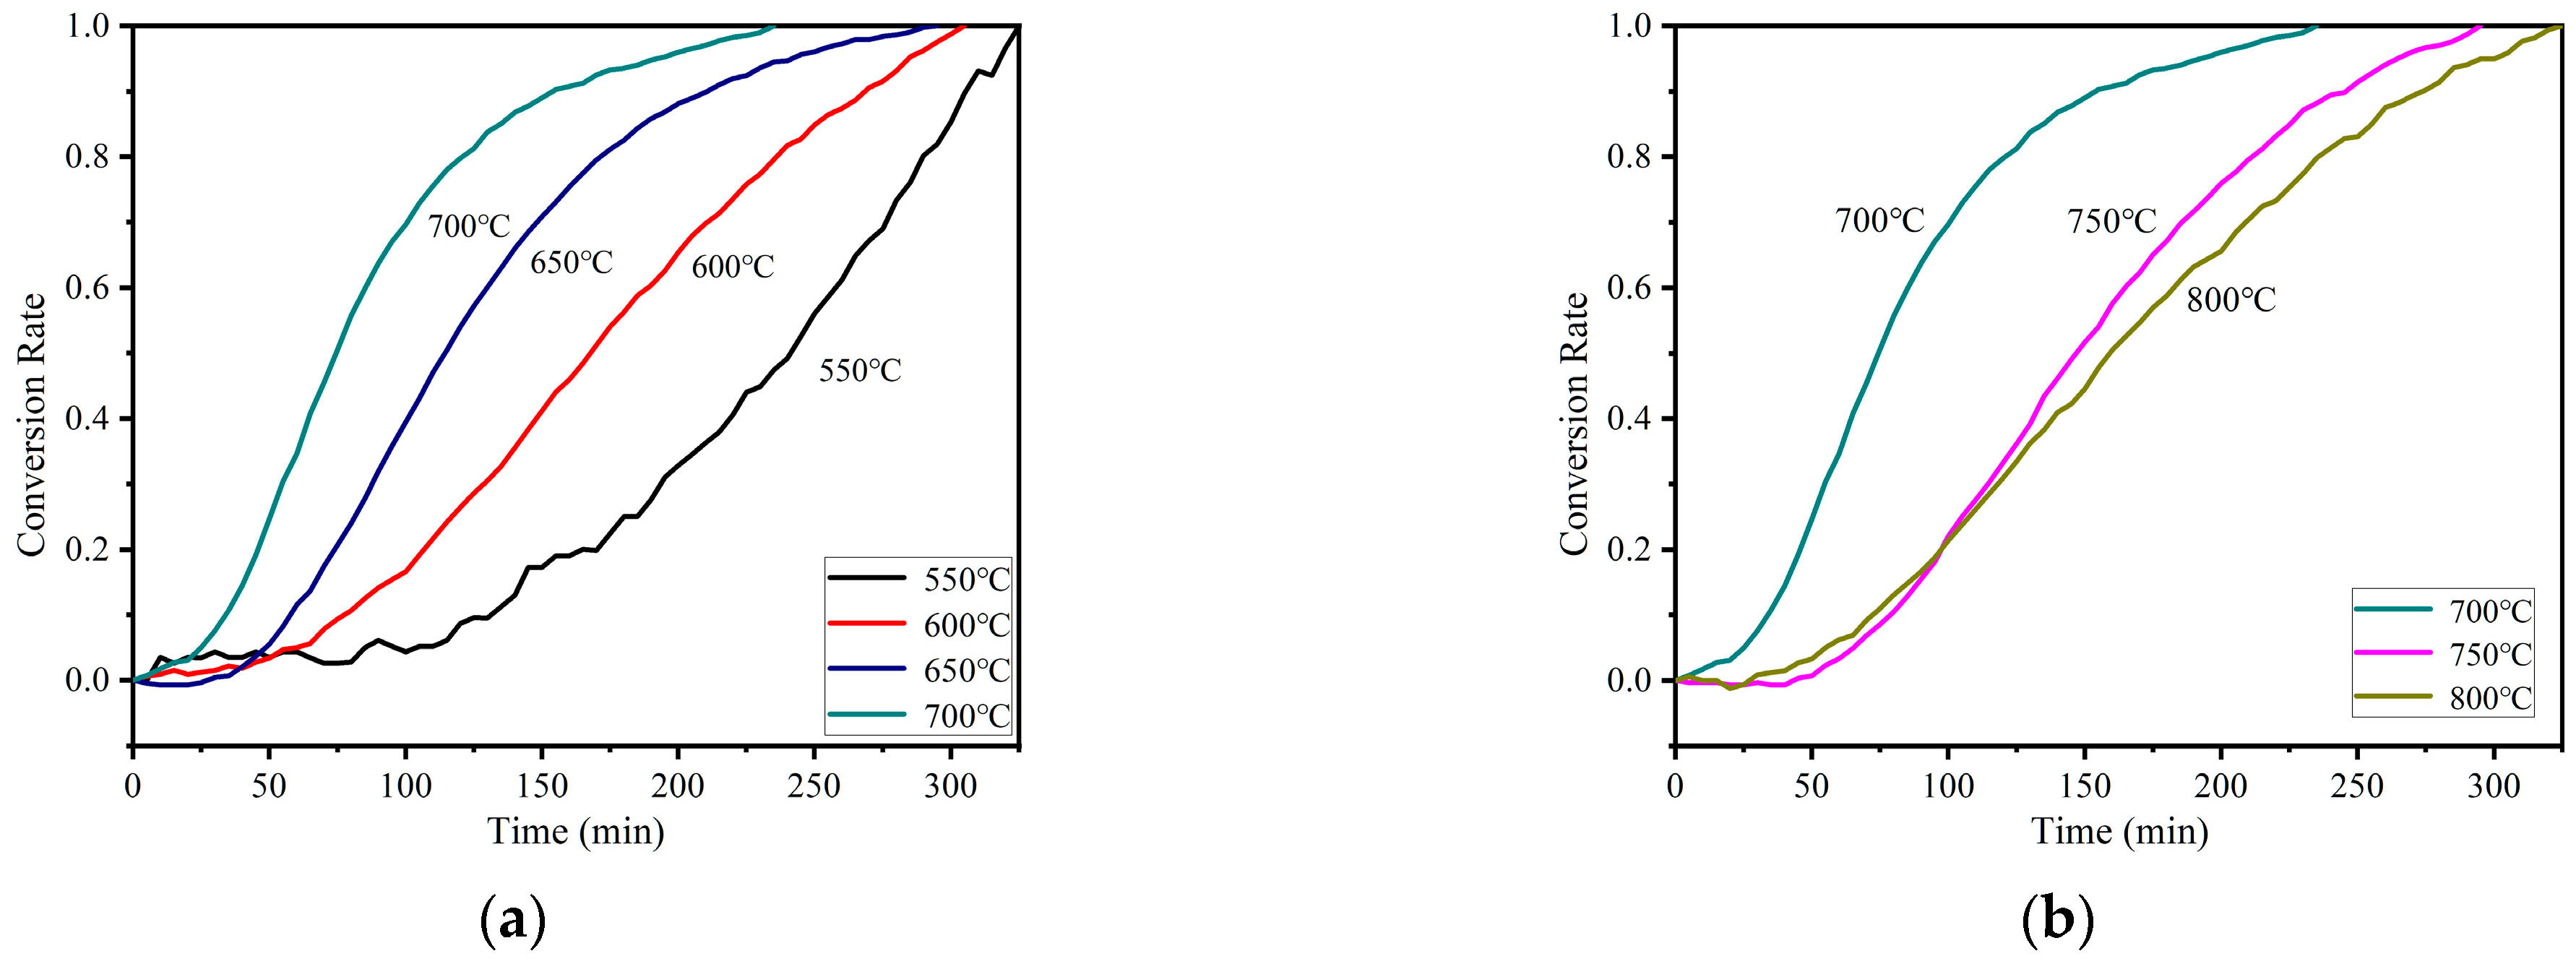
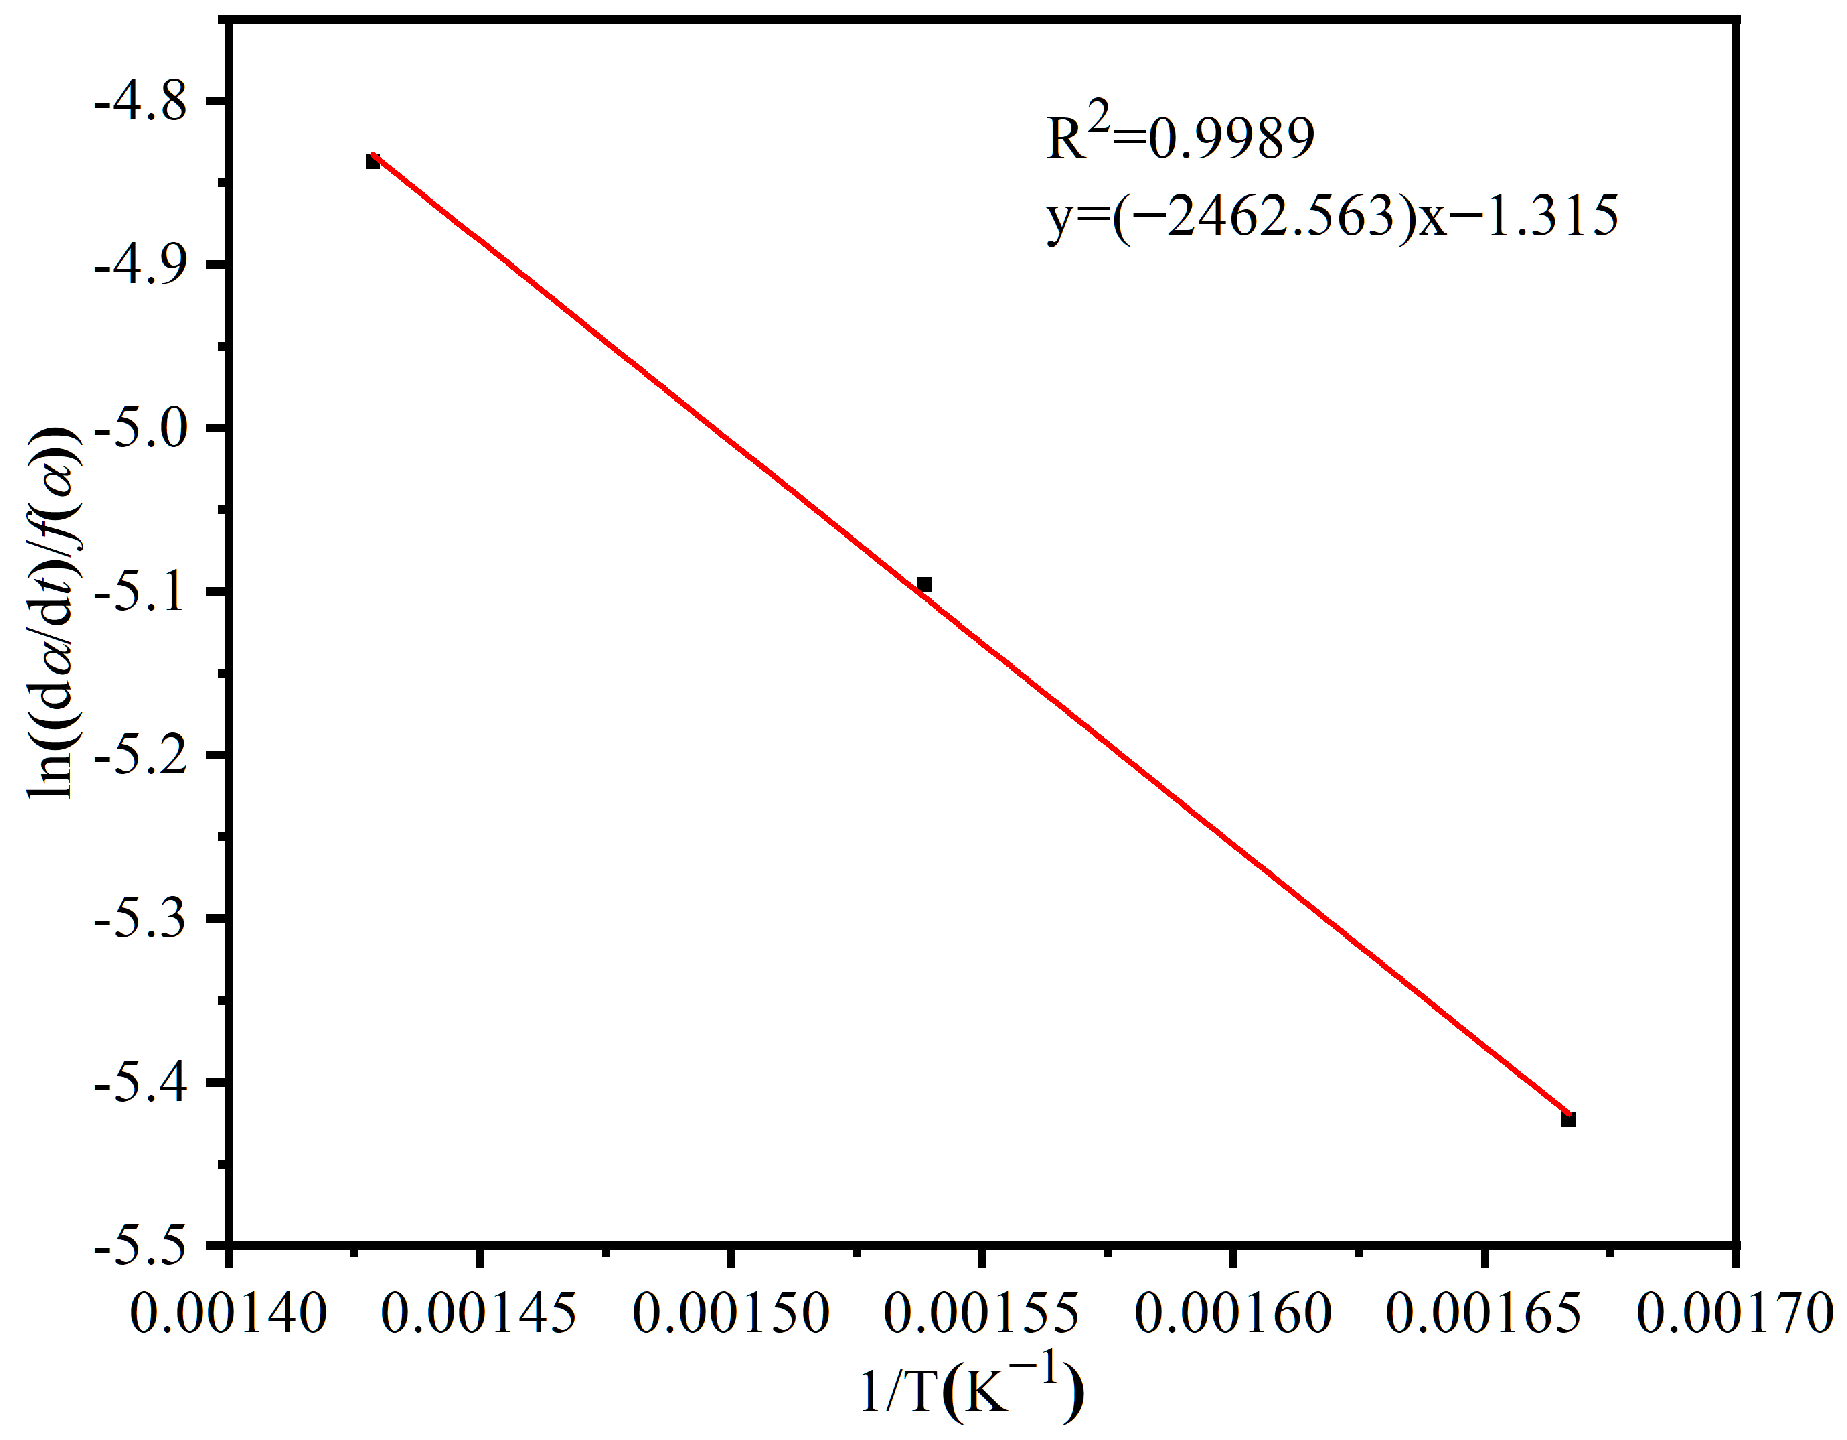
3.1.3. Reaction Kinetics Analysis

The experimental data obtained at different temperatures were processed to generate α–t curves at constant temperatures of 550, 600, 650, 700, 750, and 800 °C, as illustrated in Figure 6. As shown in Figure 6a, the reaction rate increases with the rising oxidation temperature of Mn3O4. Consequently, when T ≤ 700 °C, the oxidation reaction adheres to the mathematical description of Arrhenius’ Law. However, as depicted in Figure 6b, when the temperature exceeds 700 °C, the oxidation reaction rate begins to decline with further temperature increase. Thus, when T > 700 °C, the oxidation reaction no longer conforms to the Arrhenius’ Law. These results indicate that when the oxidation reaction temperature surpasses a certain threshold, the reaction rate decreases with increasing temperature, leading to a reduction in the conversion rate. Therefore, in practical applications, the reaction temperature should be carefully controlled to ensure a high conversion efficiency.
Furthermore, the kinetic mechanism function was determined. Based on the aforementioned conclusions, experimental data at isothermal temperatures below 700 °C were selected. Specifically, the experimental data obtained from the isothermal oxidation reaction at 600 °C were used to plot the t/t0.5–α curve, with the experimental curve labeled “exp” in the diagram as shown in Figure 7, following the isothermal method for mechanism function determination. This curve was employed to identify the most probable mechanism function for the oxidation reaction. By comparing the experimental curve with standard mechanism functions, it was found that the experimental curve overlaps with mechanism function number 25. Therefore, the mechanism function for the oxidation reaction in this study is determined to be the phase boundary reaction (one-dimensional) R1, with n = 1. The corresponding mechanism function expressions are G(α) = α and f(α) = 1.
The experimental curve is labeled “exp” in the diagram.
It is known from the above that when the constant temperature is greater than 700 °C, the oxidation reaction no longer obeys Arrhenius’ law. Therefore, the linear curve shown in Figure 8 is obtained by using the experimental data of an oxidation reaction with a constant temperature of less than 700 °C and a conversion rate greater than 0.1. Using the isothermal method for calculating the activation energy and pre-exponential factor, the slope and intercept of the linear fit in Figure 8 were determined. The slope was calculated to be −2462.563, and the intercept was −1.315. Based on these values, the activation energy (E) for the oxidation reaction was found to be 20.47 kJ/mol, and the pre-exponential factor (A) was 0.268/s.

3.2. Thermal Conversion Performance Evaluation of Mn2O3

3.2.1. Thermochemical Reaction Assessment

Figure 9 shows the thermal analysis curves of the Mn2O3 samples. As illustrated in the figure, a reversible redox reaction can be achieved for the Mn2O3 powders prepared from precursor manganese nitrate solutions of different concentrations. However, due to the presence of a small amount of impurities, the samples exhibited a slight weight loss during the initial heating stage, which is attributed to impurity decomposition rather than the reduction reaction. The weight loss rate during the reduction reaction stage was approximately 3.3%. However, the weight gain rate during the oxidation reaction varied among samples prepared with different concentrations of manganese nitrate. For instance, the oxidation reaction weight gain rates for the Mn0.025 and Mn0.1 samples were only about 2%, indicating incomplete conversion. The remaining samples exhibited comparable weight gain rates during oxidation to their weight loss rates during reduction, achieving nearly complete conversion in the redox reactions.
In this study, the Mn0.5 sample was selected as a representative example to analyze the reaction performance in detail. During heating, the TG curve showed a significant drop, indicating the occurrence of a reduction reaction, during which Mn2O3 transformed into Mn3O4. The reduction reaction began at 941 °C and ceased after approximately 47 min when the temperature reached 963 °C, with a weight loss rate of 3.4%, close to the ideal value. During the cooling stage, the TG curve exhibited a clear increase, indicating the oxidation of Mn3O4 back to Mn2O3. The oxidation reaction started at 803 °C and ended after about 53 min when the temperature dropped to 698 °C, with a weight gain rate of 3.3%, achieving nearly complete conversion. Throughout the entire reaction process, the reduction reaction began at a temperature 138 °C higher than that of the oxidation reaction, and its duration was 6 min shorter, suggesting that the reduction reaction proceeded faster than the oxidation reaction.
To further investigate the cycling stability of the samples, cyclic experiments were conducted on Mn0.025, Mn0.05, Mn0.1, Mn0.5, Mn1, Mn3, Mn6, and Mn7.6. The experiments were performed at a heating and cooling rate of 2 °C/min in a reaction atmosphere consisting of 80% nitrogen and 20% oxygen. As shown in Figure 10, the weight loss rate of the Mn0.025 sample during the first reduction reaction was approximately 3.37%, while the weight gain rate was only about 1.64%, significantly lower than the ideal value of 3.37%. In the subsequent cycles, the oxidation capacity of the sample gradually decreased, resulting in a weight gain rate of only 0.3% by the fifth cycle.
Although the weight gain rate of the Mn0.1 sample in the first cycle was lower than its weight loss rate, the sample maintained relatively stable weight loss and weight gain rates in subsequent cycles. This indicates that the Mn0.1 sample exhibits good cycling stability and meets the requirements for energy storage systems. In addition, the Mn0.1, Mn0.5, Mn1, Mn3, and Mn6 samples exhibited relatively stable cycling performance and good conversion efficiency over five cycles. However, after five cycles, their cycle stability and conversion efficiency deteriorated significantly. This decline was attributed to sintering-induced pore closure, which compromised their ability to maintain good cycling performance. In contrast, the Mn0.05 and Mn7.6 samples demonstrated consistently stable conversion performance throughout the cycling process. To further investigate their long-term durability in thermochemical energy storage applications, we extended their cycling to 10 cycles. After 10 cycles, their performance remained stable, suggesting that these samples likely retained favorable porosity and surface area characteristics.

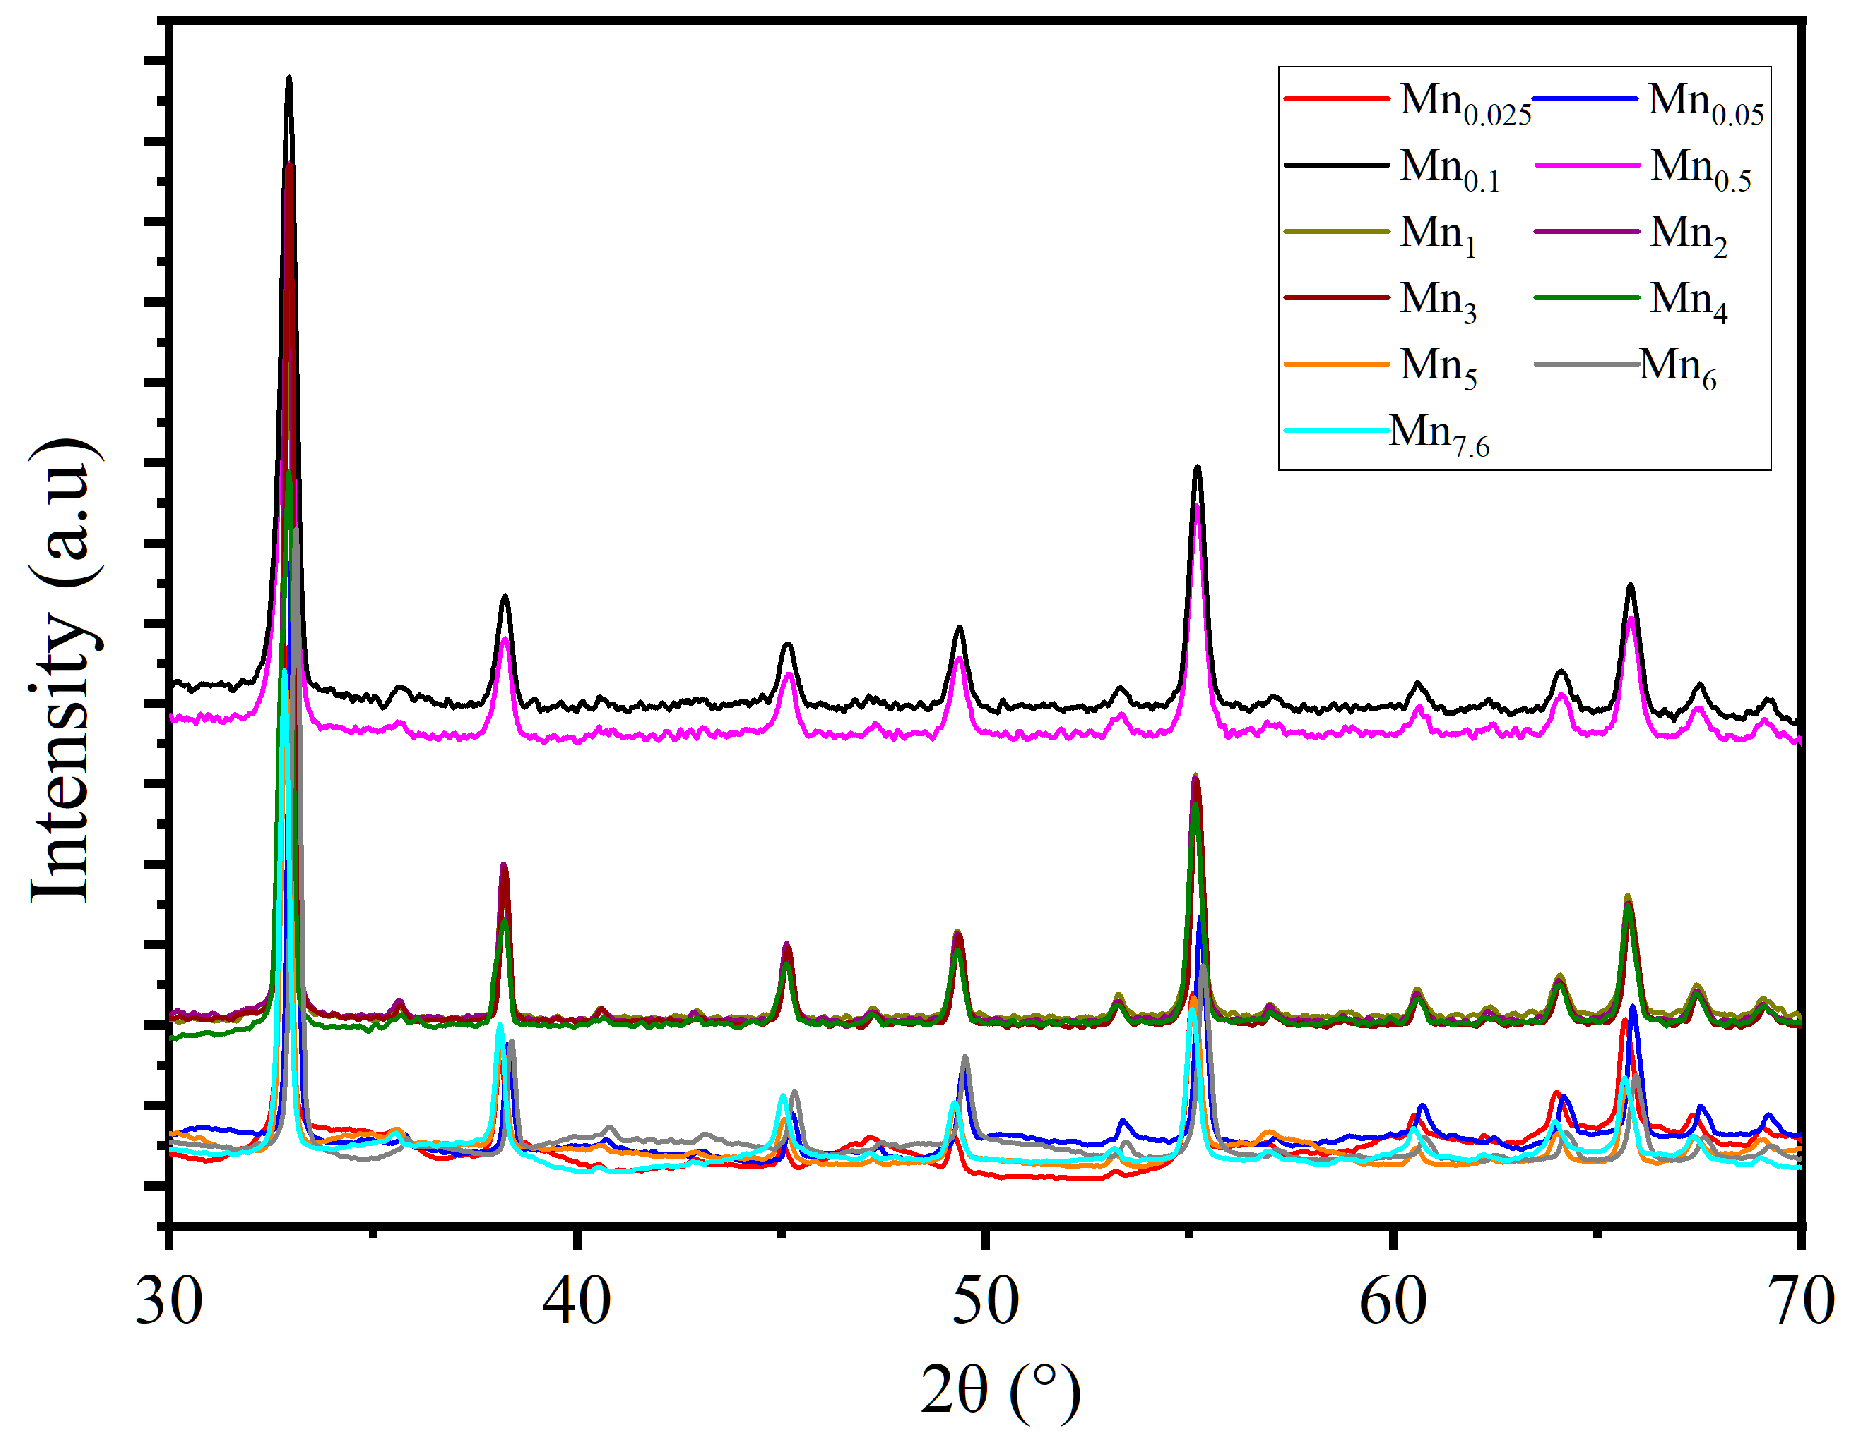
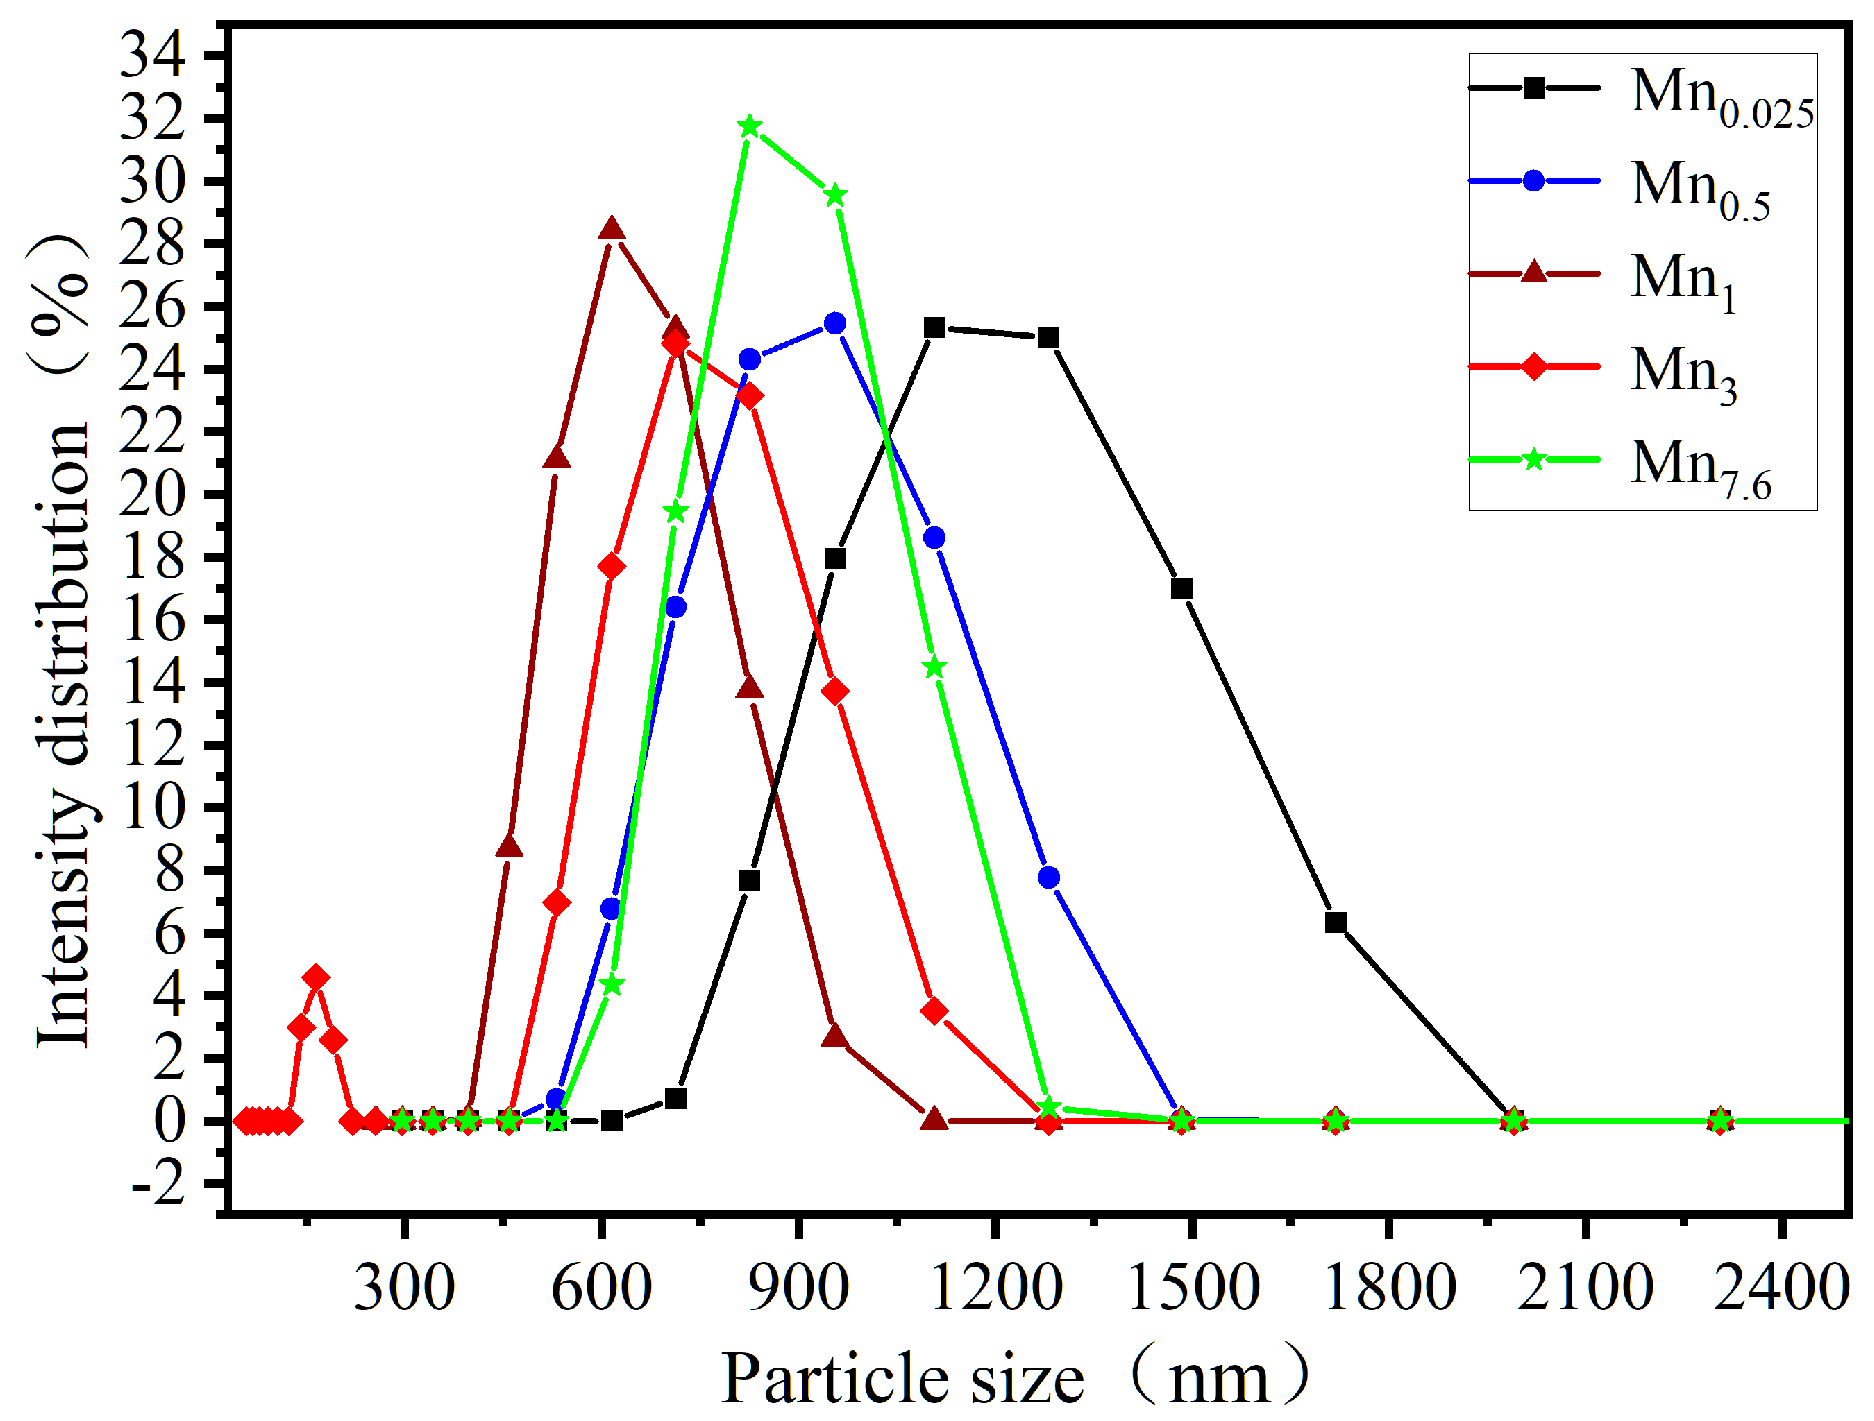
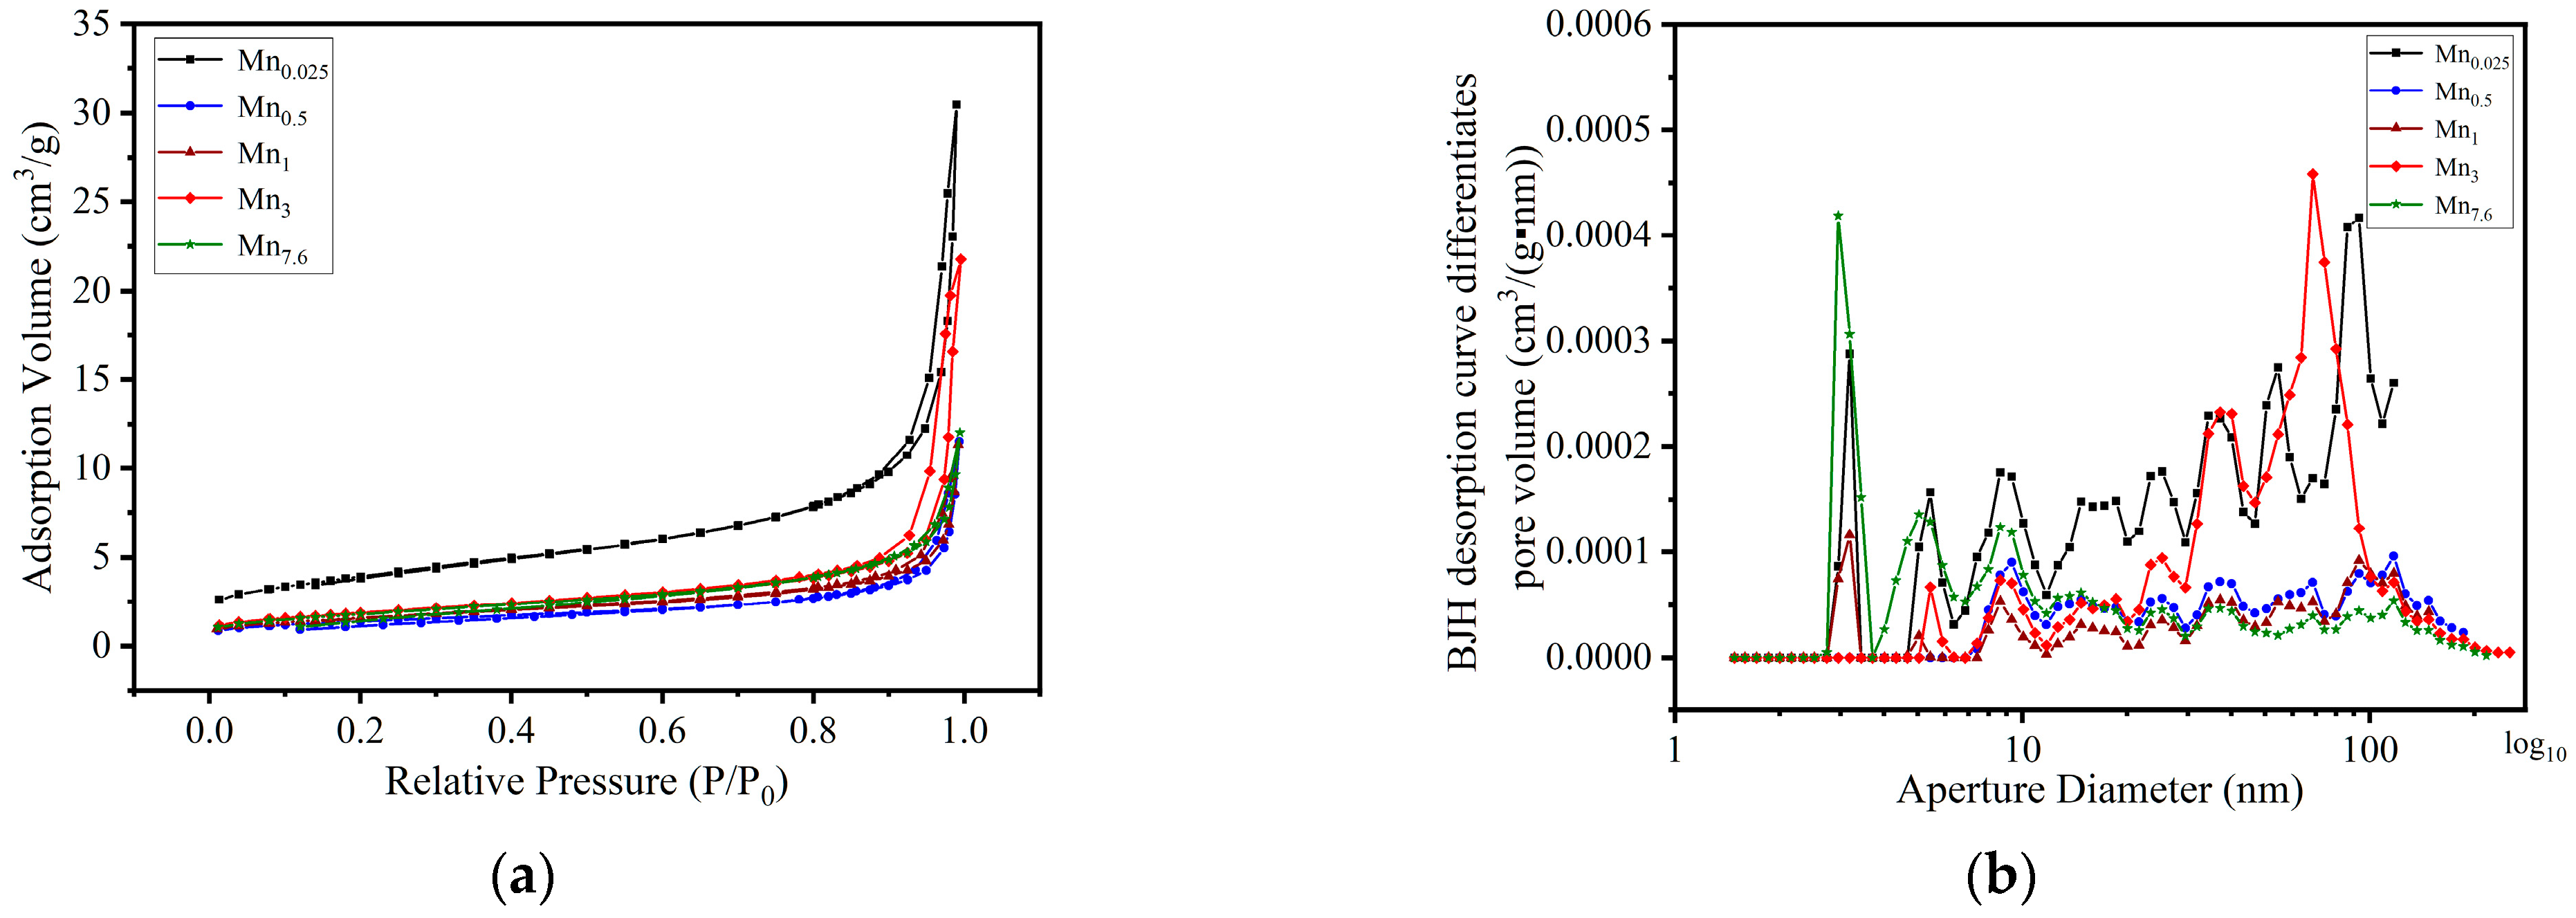
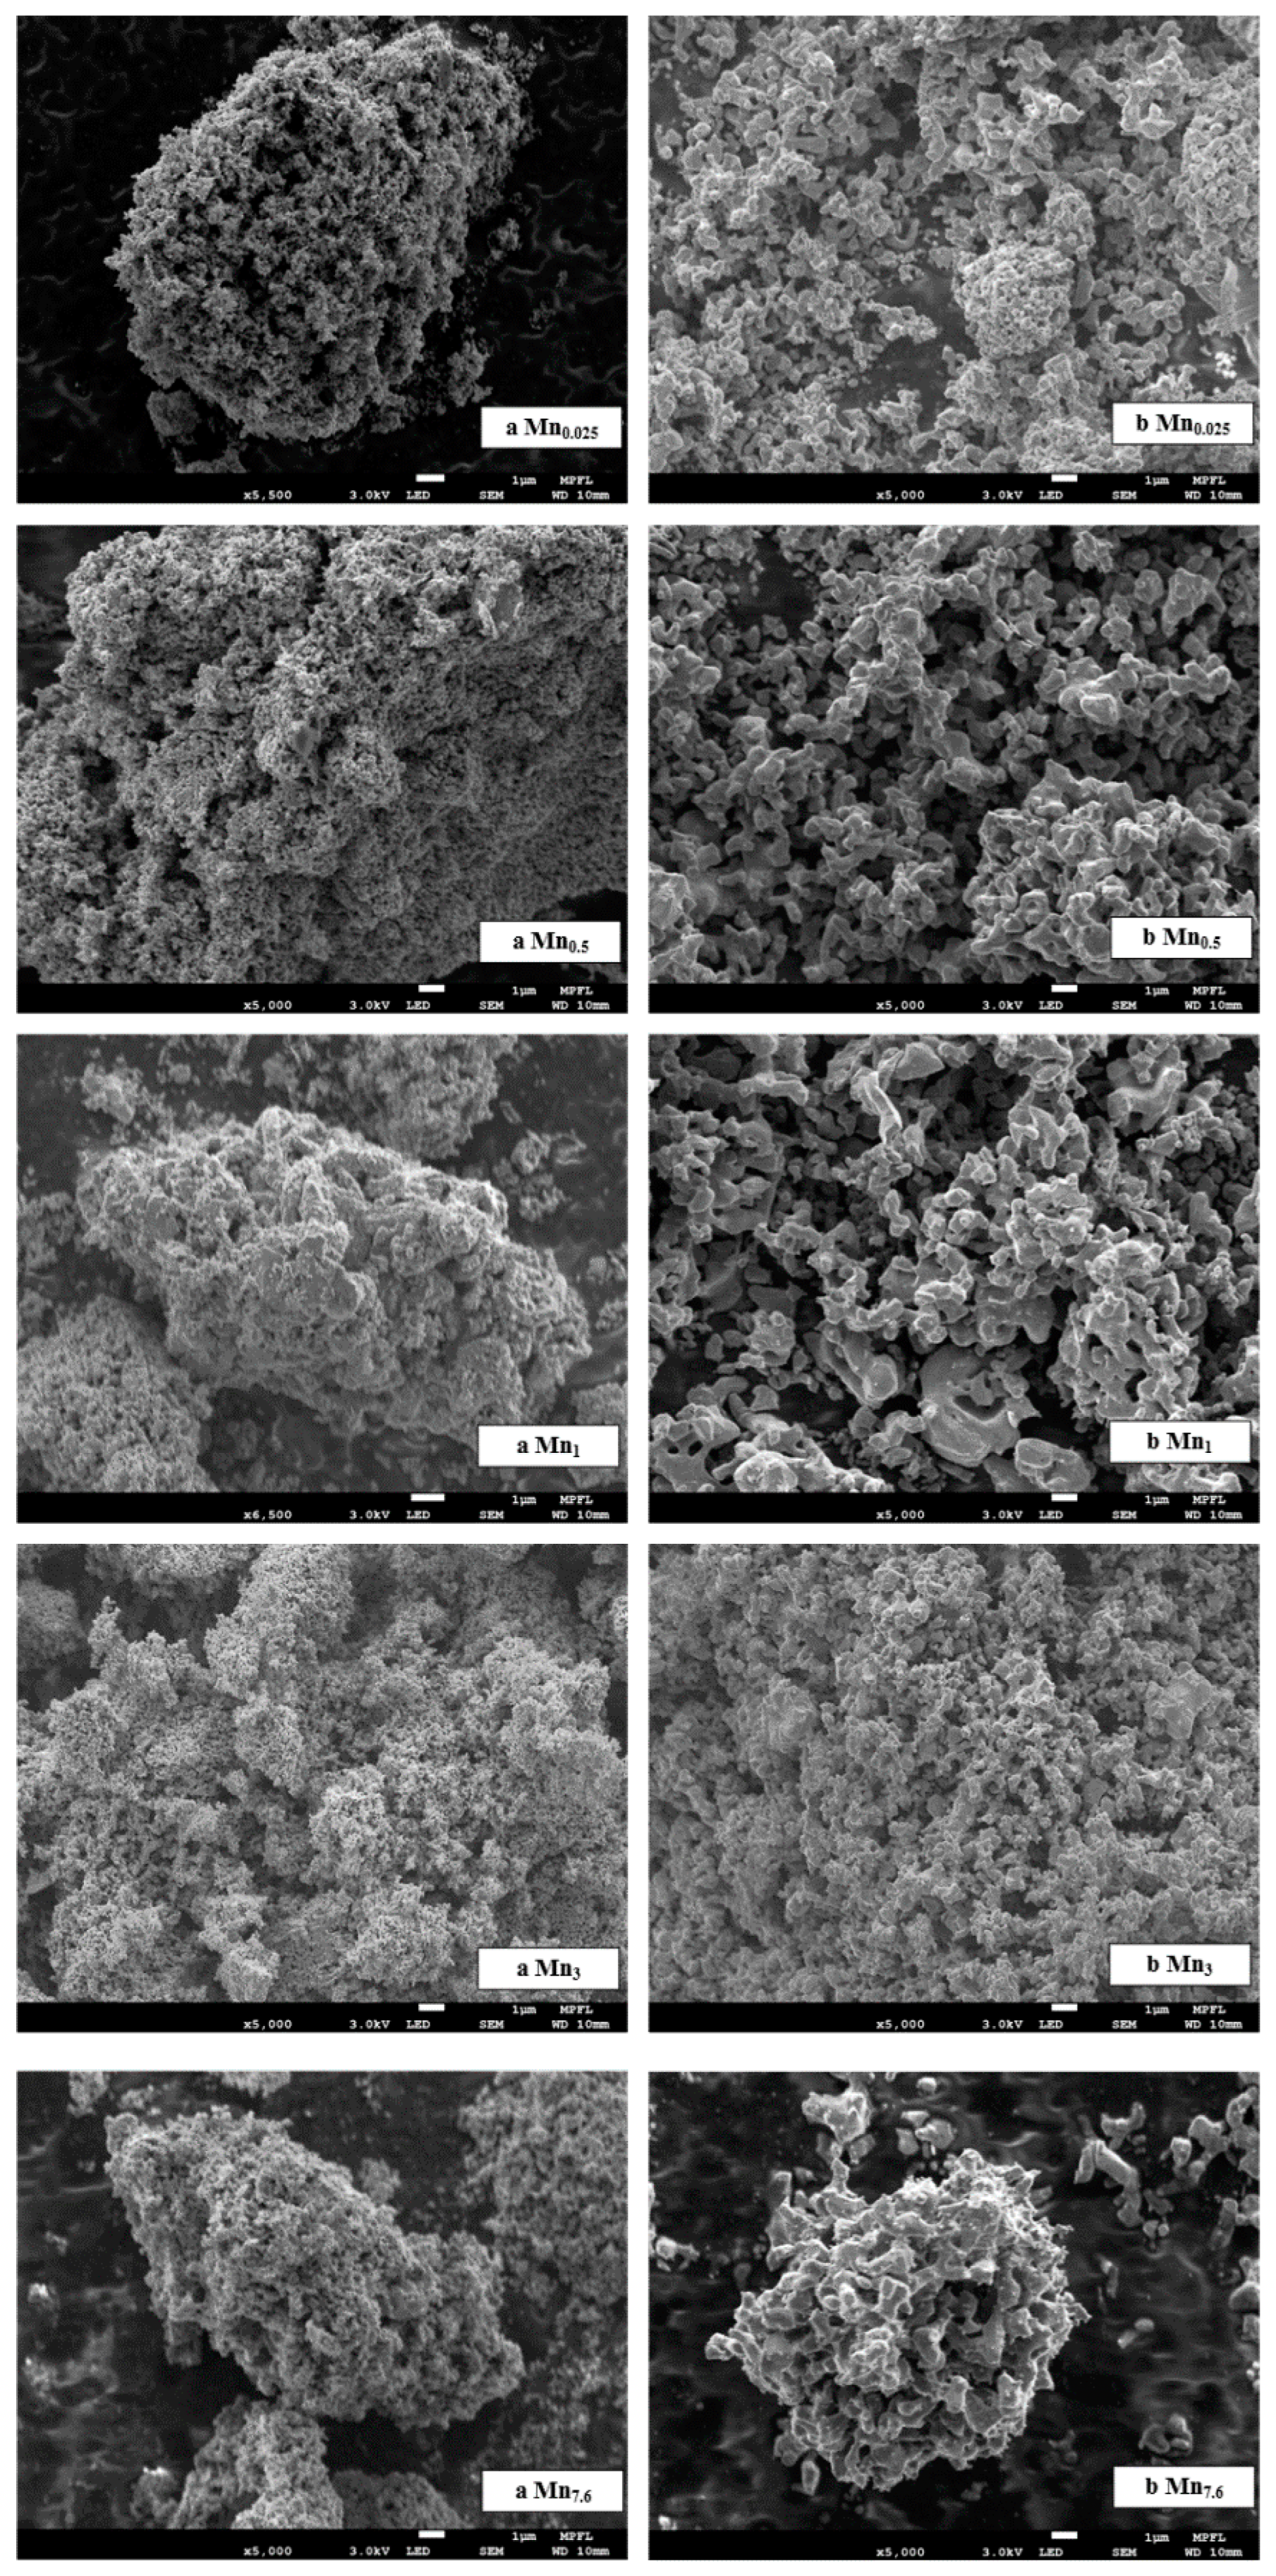
3.2.2. Synthesis Parameters Assessment on Physical Properties

To confirm that all the prepared samples consist of Mn2O3 powder, an XRD analysis was performed on the synthesized samples. Figure 11 shows the XRD patterns of the homemade samples. From the results, it is evident that the Mn0.5 and Mn0.1 samples exhibit the highest characteristic peak intensities and the best crystallinity. In contrast, the Mn1, Mn2, Mn3, and Mn4 samples show lower peak intensities and reduced crystallinity. The Mn0.025, Mn0.05, Mn5, Mn6, and Mn7.6 samples display the lowest peak intensities and the poorest crystallinity.
To further investigate the influence of the precursor solution concentration on physical properties such as particle size, specific surface area, and pore size, five samples (Mn0.025, Mn0.5, Mn1, Mn3, and Mn7.6) were selected for detailed analysis. The calculated crystal particle sizes, as well as the results of nanoparticle size and zeta potential analysis, are presented in Table 1 and Figure 12. The particle size distribution of Mn2O3 ranges from approximately 600 to 1100 nm. According to the test results, as the precursor solution concentration increases, the particle size exhibits a non-monotonic dependence on precursor concentration, with a minimum observed at Mn1. As shown in Figure 12, larger particle sizes are associated with more dispersed particle size distributions.
A nitrogen desorption test was performed on the above five Mn2O3 samples. The nitrogen desorption curve and the BJH desorption curve differential pore volume distribution were obtained. The nitrogen adsorption and desorption curves of the five samples were hysteresis curves, as shown in Figure 13.
Figure 13a shows that all samples prepared with different manganese nitrate concentrations display Type IV nitrogen adsorption-desorption isotherms with distinct hysteresis loops. The generation of this kind of curve was due to the capillary condensation of the sample during the adsorption process, indicating that the pore size of the sample tested was distributed between 2 and 50 nm, which belonged to mesopores. As shown in Figure 13b, the pore volume change rate of Mn0.025 in the pore diameter range of 80–90 nm and 2–3 nm was large, which indicated that the pore diameter of the sample was mainly distributed in these two ranges, and the average pore diameter showed that the number of pores in the pore diameter range of 2–3 nm was more than that in 80–90 nm. The pore volume of Mn0.5, Mn1, and Mn7.6 was the largest in the range of 2–4 nm, so the pore diameter of these three samples was the majority in this range. The pore volume change rate of the Mn3 sample was the largest in the range of a pore diameter of 60–80 nm, so the pore diameter distribution of the Mn3 sample was more in this range. It can be seen from Table 1 that the specific surface area of Mn0.025 is two to three times that of other samples, while the pore volume and pore diameter of Mn0.025 are similar to those of other samples, indicating that the Mn0.025 has fewer pores so that the gas could not fully make contact with the sample, which should be one of the reasons for the low weight gain rate of the re-oxidation reaction.
To further investigate the microstructure of the samples, a SEM analysis was conducted on the five selected samples (Mn0.025, Mn0.5, Mn1, Mn3, and Mn4). Figure 14 shows the SEM images, with the left side displaying the initial morphology of the samples and the right side showing their morphology after cyclic reactions. Initially, the five Mn2O3 samples exhibited a structure composed of small, round primary particles with loose pores, which facilitated full contact between the sample and the gas, enabling complete reactions. In contrast, after cycling, the samples displayed a coral-like morphology with a smooth surface and no visible pores, likely due to sintering effects during the cyclic reactions.

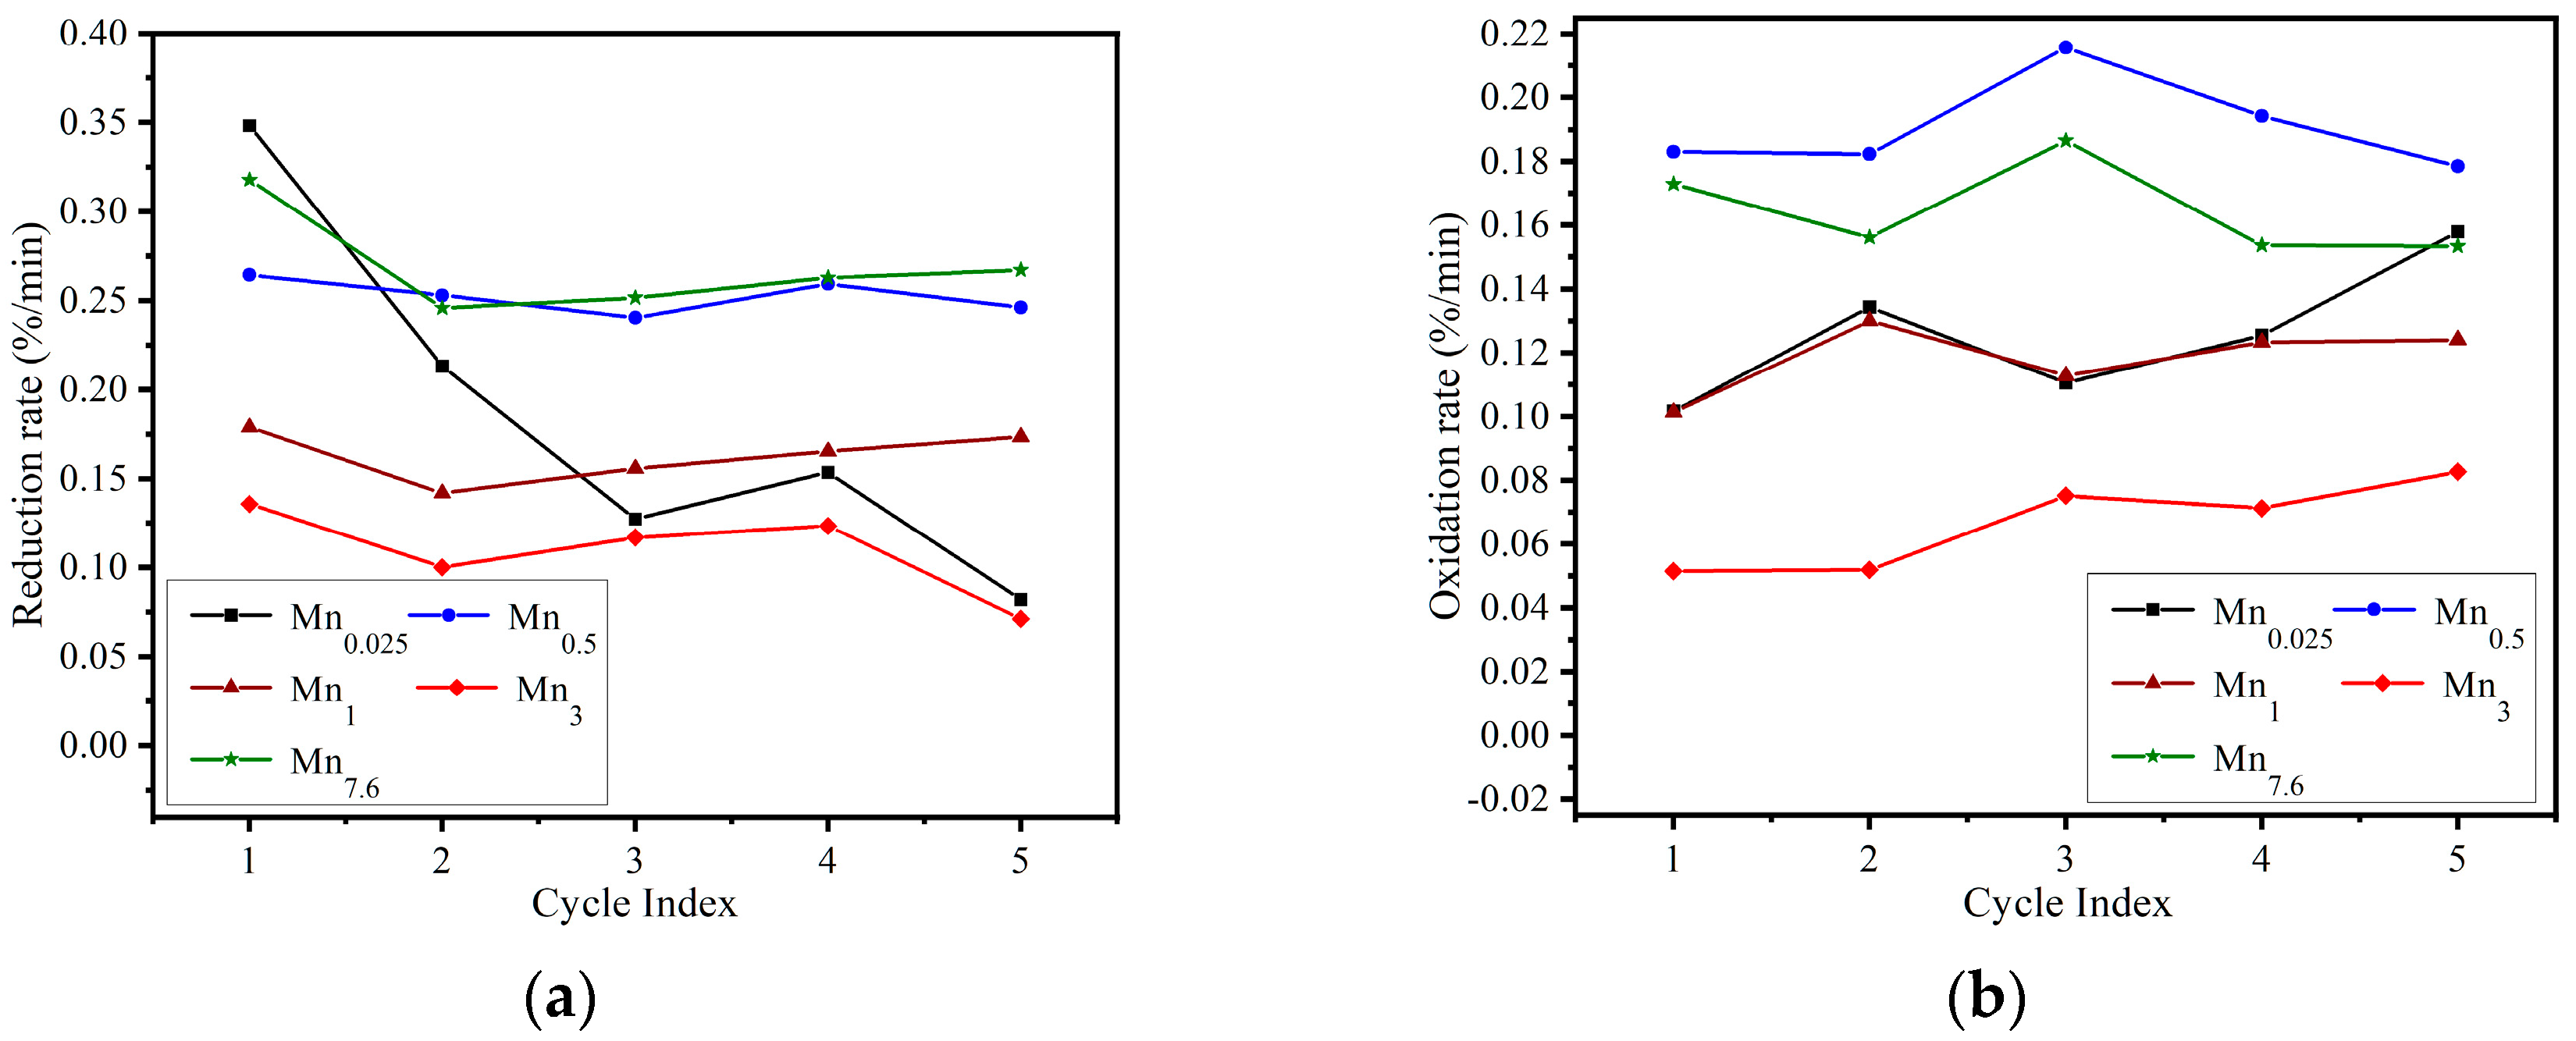
3.2.3. Synthesis Parameters Assessment on Reaction Performance

Figure 15 presents the temperature dependence curves of the reduction and oxidation degrees for Mn0.025, Mn0.5, Mn1, Mn3, and Mn7.6, respectively. A comparison of Figure 15 reveals that the initial particle size has a smaller influence on the reduction reaction compared to the oxidation reaction. The reduction reaction temperatures for Mn0.025 and Mn7.6, which have larger particle sizes, are higher than those of the other samples, while their oxidation reaction temperatures are lower. This suggests that larger initial particle sizes require more stringent temperature conditions for the reactions. Regardless of particle size, the temperature range for the reduction reaction of the five Mn2O3 samples is narrower than that for the oxidation reaction.
In this study, the maximum peak value of the differential curve of the TG curve with respect to time was used to determine the reaction rate. As shown in Figure 16a, the Mn0.025 sample, influenced by its larger particle size, not only exhibited a significant decrease in the oxidation reaction weight gain rate but also showed a rapid decline in the reduction reaction rate as the number of cycles increased. In contrast, the reduction reaction rates of the other samples remained relatively stable over the five cycles. Additionally, samples with larger initial particle sizes demonstrated faster reduction reaction rates. Figure 16b indicates that the oxidation reaction rate remains relatively stable with increasing cycle numbers, showing no significant variation. Similar to the reduction reaction, the sample with larger initial particle sizes exhibited a higher oxidation reaction rate. However, for the Mn0.025 sample, the oxidation reaction was influenced by factors such as particle size, specific surface area, and pore size distribution. As a result, the reaction kinetics slowed with successive cycles, preventing complete transformation and leading to a lower oxidation reaction rate.

3.2.4. Reaction Kinetics Analysis

The temperatures corresponding to the reduction reaction of Mn2O3 at different heating rates are summarized in Table 2. The corresponding temperature of the Mn2O3 reduction reactions is shown at different heating and conversion rates. As indicated in the table, at the same conversion rate, higher heating rates result in higher reaction temperatures. This is attributed to the fact that faster heating rates cause the sample to react more slowly as it reaches the required temperature.
To avoid errors in activation energy calculations arising from the determination of mechanism functions, the activation energy in this study was determined using an iterative method. The detailed calculation results are presented in Table 3. As shown in the table, the activation energies calculated by the two methods and their corresponding iterative approaches are 239.42 kJ/mol, 249.82 kJ/mol, 239.11 kJ/mol, and 249.87 kJ/mol, respectively. Based on the study by Dizaji et al. [11], it was determined that the activation energy calculated using the Kissinger–Akahira–Sunose (KAS) method is more accurate. Therefore, the activation energy for this reaction is 249.87 kJ/mol, and the KAS method is deemed more suitable for the kinetic analysis of this reaction.

4. Conclusions

Mn3O4, as the initial reactant, can undergo redox reactions with Mn2O3. In the initial stage, Mn3O4 first undergoes elemental restructuring to transform into Mn2O3, followed by subsequent redox reactions. In a five-cycle experiment with a heating and cooling rate of 2 °C/min, the reaction exhibited stable cyclic performance, with a conversion rate exceeding 95% and a weight loss of approximately 3.3%. As the cycling proceeded, the temperature range of the oxidation reaction shifted toward lower temperatures but the reaction rate and conversion rate remained largely unchanged, meeting the requirements for energy storage systems. A kinetic analysis of the oxidation reaction using the isothermal method revealed that the reaction follows Arrhenius’ Law at temperatures below 700 °C but deviates from it at temperatures above 700 °C. Using experimental data below 700 °C, the most probable mechanism function for the oxidation reaction was determined to be G(α) = α and f(α) = 1, with an activation energy (E) of 20.47 kJ/mol and a pre-exponential factor (A) of 0.268/s.
Using the ammonia precipitation method, Mn2O3 samples prepared from precursor solutions of varying concentrations, except for the 0.025 mol/L manganese nitrate solution, demonstrated excellent performance in cyclic reactions. The results indicate that Mn2O3 samples prepared using this method are suitable for thermochemical energy storage (TCS). However, the particle size of Mn2O3 samples varied with the precursor concentration. Particle size had a more pronounced effect on the oxidation reaction: larger particles required stricter temperature conditions for redox reactions. The activation energy for the reduction reaction of Mn2O3, calculated using the non-isothermal multi-heating rate method, was determined to be 249.87 kJ/mol.

Author Contributions

Conceptualization, D.W.; Methodology, M.Z.; Validation, M.Z.; Formal analysis, Z.W.; Investigation, M.Z.; Resources, M.Z.; Data curation, Z.W.; Writing—original draft, Z.W.; Writing—review & editing, Z.W.; Visualization, Z.W.; Supervision, D.W.; Project administration, D.W.; Funding acquisition, D.W. All authors have read and agreed to the published version of the manuscript.

Funding

This research received no external funding.

Institutional Review Board Statement

Not applicable.

Informed Consent Statement

Not applicable.

Data Availability Statement

Data are contained within the article.

Conflicts of Interest

The authors declare no conflict of interest.

References

  1. Wu, S.; Li, T.X.; Yan, T.; Wang, R.Z. Advanced thermochemical resorption heat transformer for high-efficiency energy storage and heat transformation. Energy 2019, 175, 1222–1233. [Google Scholar] [CrossRef]
  2. Zhang, Z.K.; Andre, L.; Abanades, S. Experimental assessment of oxygen exchange capacity and thermochemical redox cycle behavior of Ba and Sr series perovskites for solar energy storage. Sol. Energy 2016, 134, 494–502. [Google Scholar] [CrossRef]
  3. Xu, J.X.; Li, T.X.; Chao, J.W.; Yan, T.S.; Wang, R.Z. High energy-density multi-form thermochemical energy storage based on multi-step sorption processes. Energy 2019, 185, 1131–1142. [Google Scholar] [CrossRef]
  4. Carrillo, A.J.; Sastre, D.; Serrano, D.P.; Pizarro, P.; Coronado, J.M. Revisiting the BaO2/BaO redox cycle for solar thermochemical energy storage. Phys. Chem. Chem. Phys. 2016, 18, 8039–8048. [Google Scholar] [CrossRef]
  5. André, L.; Abanades, S.; Flamant, G. Screening of thermochemical systems based on solid-gas reversible reactions for high temperature solar thermal energy storage. Renew. Sustain. Energy Rev. 2016, 64, 703–715. [Google Scholar] [CrossRef]
  6. Agrafiotis, C.; de Oliveira, L.; Roeb, M.; Sattler, C. A Solar Receiver-Storage Modular Cascade Based on Porous Ceramic Structures for Hybrid Sensible/Thermochemical Solar Energy Storage. In Proceedings of the 21st International Conference on Concentrating Solar Power and Chemical Energy Systems (SolarPACES), Cape Town, South Africa, 13–16 October 2015. [Google Scholar]
  7. Bayon, A.; Bader, R.; Jafarian, M.; Fedunik-Hofman, L.; Sun, Y.P.; Hinkley, J.; Miller, S.; Lipinski, W. Techno-economic assessment of solid-gas thermochemical energy storage systems for solar thermal power applications. Energy 2018, 149, 473–484. [Google Scholar] [CrossRef]
  8. Agrafiotis, C.; Roeb, M.; Schmücker, M.; Sattler, C. Exploitation of thermochemical cycles based on solid oxide redox systems for thermochemical storage of solar heat. Part 1: Testing of cobalt oxide-based powders. Solar Energy 2014, 102, 189–211. [Google Scholar] [CrossRef]
  9. Alonso, E.; Pérez-Rábago, C.; Licurgo, J.; Fuentealba, E.; Estrada, C.A. First experimental studies of solar redox reactions of copper oxides for thermochemical energy storage. Sol. Energy 2015, 115, 297–305. [Google Scholar] [CrossRef]
  10. Carrillo, A.J.; Moya, J.; Bayón, A.; Jana, P.; O’Shea, V.A.D.; Romero, M.; Gonzalez-Aguilar, J.; Serrano, D.P.; Pizarro, P.; Coronado, J.M. Thermochemical energy storage at high temperature via redox cycles of Mn and Co oxides: Pure oxides versus mixed ones. Sol. Energy Mater. Sol. Cells 2014, 123, 47–57. [Google Scholar] [CrossRef]
  11. Dizaji, H.B.; Hosseini, H. A review of material screening in pure and mixed-metal oxide thermochemical energy storage (TCES) systems for concentrated solar power (CSP) applications. Renew. Sustain. Energy Rev. 2018, 98, 9–26. [Google Scholar] [CrossRef]
  12. Prieto, C.; Cooper, P.; Fernández, A.I.; Cabeza, L.F. Review of technology: Thermochemical energy storage for concentrated solar power plants. Renew. Sustain. Energy Rev. 2016, 60, 909–929. [Google Scholar] [CrossRef]
  13. Singh, A.; Tescari, S.; Lantin, G.; Agrafiotis, C.; Roeb, M.; Sattler, C. Solar thermochemical heat storage via the Co3O4/CoO looping cycle: Storage reactor modelling and experimental validation. Sol. Energy 2017, 144, 453–465. [Google Scholar] [CrossRef]
  14. Tamayo, A.; Rodríguez, M.A.; Arroyo, C.; Beltran-Heredia, J.; Rubio, F. Dependence of the synthetic strategy on the thermochemical energy storage capability of CuxCo3-xO4 spinels. J. Eur. Ceram. Soc. 2018, 38, 1583–1591. [Google Scholar] [CrossRef]
  15. Tescari, S.; Singh, A.; Agrafiotis, C.; de Oliveira, L.; Breuer, S.; Schlögl-Knothe, B.; Roeb, M.; Sattler, C. Experimental evaluation of a pilot-scale thermochemical storage system for a concentrated solar power plant. Appl. Energy 2017, 189, 66–75. [Google Scholar] [CrossRef]
  16. Wokon, M.; Block, T.; Nicolai, S.; Linder, M.; Schmücker, M. Thermodynamic and kinetic investigation of a technical grade manganese-iron binary oxide for thermochemical energy storage. Sol. Energy 2017, 153, 471–485. [Google Scholar] [CrossRef]
  17. Imponenti, L.; Albrecht, K.J.; Wands, J.W.; Sanders, M.D.; Jackson, G.S. Thermochemical energy storage in strontium-doped calcium manganites for concentrating solar power applications. Sol. Energy 2017, 151, 1–13. [Google Scholar] [CrossRef]
  18. Silakhori, M.; Jafarian, M.; Arjomandi, M.; Nathan, G.J. Thermogravimetric analysis of Cu, Mn, Co, and Pb oxides for thermochemical energy storage. J. Energy Storage 2019, 23, 138–147. [Google Scholar] [CrossRef]
  19. Block, T.; Knoblauch, N.; Schmücker, M. The cobalt-oxide/iron-oxide binary system for use as high temperature thermochemical energy storage material. Thermochim. Acta 2014, 577, 25–32. [Google Scholar] [CrossRef]
  20. Agrafiotis, C.; Roeb, M.; Schmücker, M.; Sattler, C. Exploitation of thermochemical cycles based on solid oxide redox systems for thermochemical storage of solar heat. Part 2: Redox oxide-coated porous ceramic structures as integrated thermochemical reactors/heat exchangers. Sol. Energy 2015, 114, 440–458. [Google Scholar] [CrossRef]
  21. Cabeza, L.F.; Solé, A.; Fontanet, X.; Barreneche, C.; Jové, A.; Gallas, M.; Prieto, C.; Fernández, A.I. Thermochemical energy storage by consecutive reactions for higher efficient concentrated solar power plants (CSP): Proof of concept. Appl. Energy 2017, 185, 836–845. [Google Scholar] [CrossRef]
  22. Pagkoura, C.; Karagiannakis, G.; Zygogianni, A.; Lorentzou, S.; Kostoglou, M.; Konstandopoulos, A.G.; Rattenburry, M.; Woodhead, J.W. Cobalt oxide based structured bodies as redox thermochemical heat storage medium for future CSP plants. Sol. Energy 2014, 108, 146–163. [Google Scholar] [CrossRef]
  23. Carrillo, A.J.; Serrano, D.P.; Pizarro, P.; Coronado, J.M. Design of Efficient Mn-based Redox Materials for Thermochemical Heat Storage at High Temperatures. In Proceedings of the 21st International Conference on Concentrating Solar Power and Chemical Energy Systems (SolarPACES), Cape Town, South Africa, 13–16 October 2015. [Google Scholar]
  24. Chen, Z.P.; Jiang, Q.Q.; Tong, J.H.; Yang, M.; Jiang, Z.X.; Li, C. Influences of morphology and structure on Mn-based multi-step thermochemical H2O splitting cycle. Sol. Energy 2016, 129, 236–243. [Google Scholar] [CrossRef]
  25. Sun, H.; Li, Y.J.; Bian, Z.G.; Yan, X.Y.; Wang, Z.Y.; Liu, W.Q. Thermochemical energy storage performances of Ca-based natural and waste materials under high pressure during CaO/CaCO3 cycles. Energy Convers. Manag. 2019, 197, 111885. [Google Scholar] [CrossRef]
  26. Sturzenegger, M.; Nüesch, P. Efficiency analysis for a manganese-oxide-based thermochemical cycle. Energy 1999, 24, 959–970. [Google Scholar] [CrossRef]
  27. Gokon, N.; Ohashi, F.; Sawaguri, H.; Hayashi, K. Comparative Study of Heat-Discharging Kinetics of Fe-Substituted Mn2O3/Mn3O4 Being Subjected to Long-Term Cycling for Thermochemical Energy Storage. Energies 2023, 16, 3367. [Google Scholar] [CrossRef]
  28. Huang, Y.; Zhu, P.; Gu, C.; Xu, H.; Zhou, J.; Xiao, G. Investigations on substituted Si-doped Mn2O3/Mn3O4 redox pair for thermochemical energy storage. J. Energy Storage 2023, 73, 108804. [Google Scholar] [CrossRef]
  29. Fetisov, V.B.; Fetisov, A.V.; Korchemkina, N.V.; Ovchinnikova, L.A.; Pastukhov, E.A.; Fishman, A.Y. Kinetics of redox processes in manganese oxides. Dokl. Phys. Chem. 2002, 387, 291–293. [Google Scholar] [CrossRef]
  30. Müller, D.; Knoll, C.; Artner, W.; Harasek, M.; Gierl-Mayer, C.; Welch, J.M.; Werner, A.; Weinberger, P. Combining in-situ X-ray diffraction with thermogravimetry and differential scanning calorimetry—An investigation of Co3O4, MnO2 and PbO2 for thermochemical energy storage. Sol. Energy 2017, 153, 11–24. [Google Scholar] [CrossRef]
  31. Block, T.; Schmücker, M. Metal oxides for thermochemical energy storage: A comparison of several metal oxide systems. Sol. Energy 2016, 126, 195–207. [Google Scholar] [CrossRef]
  32. Zhao, Q.; Shih, W.Y.; Shih, W.H. Effects of Processing Parameters on the Morphology of Precipitated Manganese Oxide Powders. Ind. Eng. Chem. Res. 2009, 48, 1490–1494. [Google Scholar] [CrossRef]
  33. Liu, L.; Xu, W.; Liu, H. Redox and melting characteristics of Mn-based ores for high-temperature thermochemical energy storage. Front. Energy Res. 2024, 12, 1361460. [Google Scholar] [CrossRef]
Figure 1. TG and DSC of Mn3O4 thermally tested at a heating and cooling rate of 2 °C/min.
Sustainability 17 03752 g001
Figure 2. XPS spectra for Mn 2p of (a) No.1 initial sample, (b) No.1 product, (c) No.2 product, and (d) No.3 product.
Sustainability 17 03752 g002
Figure 3. XRD patterns of (a) No.1 initial sample, (b) No.2 product, (c) No.3 product, and (d) No.4 product.
Sustainability 17 03752 g003
Figure 4. Five redox cycle tests of Mn3O4 with heating and cooling rates of 2 °C/min.
Sustainability 17 03752 g004
Figure 5. The change of reactant conversion with temperature over five cycles.
Sustainability 17 03752 g005
Figure 6. A versus time curves for Mn3O4 oxidation isothermal assays run at (a) T = 550, 600, 650, and 700 °C; (b) T = 700, 750, and 800 °C.
Sustainability 17 03752 g006
Figure 7. The theoretical dynamic curves and experimental curve of t/t0.5 − α.
Sustainability 17 03752 g007
Figure 8. The Arrhenius curve of oxidation reactions of Mn3O4.
Sustainability 17 03752 g008
Figure 9. Thermal analysis test curves of synthesized Mn2O3 with varied particle sizes. (a) Thermal analysis test diagram of Mn0.025, Mn0.05, Mn0.1, Mn0.5, and Mn1. (b) Thermal analysis test diagram of Mn2, Mn3, Mn4, Mn5, Mn6, and Mn7.6.
Sustainability 17 03752 g009
Figure 10. Cyclic thermal analysis of Mn2O3 samples. (a) Mn0.025; (b) Mn0.05; (c) Mn0.1; (d) Mn0.5; (e) Mn1; (f) Mn3; (g) Mn6; (h) Mn7.6. A representative TG curve is shown; all replicates exhibited identical trends.
Sustainability 17 03752 g010
Figure 11. XRD patterns of Mn2O3 samples.
Sustainability 17 03752 g011
Figure 12. Nanoparticle size distribution of five Mn2O3 samples.
Sustainability 17 03752 g012
Figure 13. Nitrogen desorption test results. (a) Adsorption desorption curves of five Mn2O3 samples; (b) differential pore volume distribution of five Mn2O3 samples.
Sustainability 17 03752 g013
Figure 14. The SEM images of the five initial Mn2O3 samples (a) and after cyclic reaction (b).
Sustainability 17 03752 g014
Figure 15. Temperature dependence curves of five Mn2O3 samples. (a) Reduction degree; (b) oxidation degree.
Sustainability 17 03752 g015
Figure 16. The reaction rate of five samples in five cycles. (a) Reduction experiment; (b) oxidation experiment.
Sustainability 17 03752 g016
Table 1. The crystal size, specific surface area, and particle size of the sample were determined.
Sample Name[Mn(NO3)2]/MCrystal Phased/nmd50 */nmSBET/(m2/g)Pore Volume/(cm3/g)Average Hole Diameter/nm
Mn0.0250.025Mn2O340.357109914.0630.04717.580
Mn0.50.5Mn2O326.9648334.9520.01816.227
Mn11Mn2O342.5135915.7240.01814.755
Mn33Mn2O346.2556756.7240.03221.640
Mn7.67.6Mn2O336.2688076.5740.0188.573
* d50 is the corresponding median aperture in the cumulative distribution curve of the aperture distribution.
Table 2. The corresponding temperature of the Mn2O3 reduction reaction at different heating and conversion rates.
αHeating Rate (°C/min)
2510
T/K
0.1954.80957.72960.72
0.2959.80962.00964.57
0.3962.12965.14967.69
0.4965.03967.64970.42
0.5966.66970.19973.06
0.6969.41972.83975.98
0.7970.19975.82979.05
0.8976.93979.16982.63
0.9981.80984.17987.82
Table 3. The activation energy of the Mn2O3 reduction reaction was calculated using Ozawa and KAS methods.
αOzawaKAS ln β H 1 T ln β h T 2 1 T
Activation Energy E/(kJ/mol)
0.1236.93247.19237.55247.22
0.2295.82309.16295.79309.20
0.3256.40267.70256.12267.75
0.4265.38277.13264.81277.18
0.5225.36235.05224.90235.10
0.6220.71230.16220.23230.13
0.7162.12168.54161.29168.61
0.8251.15262.16250.81262.20
0.9240.88251.34240.48251.40
Ave.239.42249.82239.11249.87
Disclaimer/Publisher’s Note: The statements, opinions and data contained in all publications are solely those of the individual author(s) and contributor(s) and not of MDPI and/or the editor(s). MDPI and/or the editor(s) disclaim responsibility for any injury to people or property resulting from any ideas, methods, instructions or products referred to in the content.

