Abstract
Although there has been a notable increase in Life Cycle Assessment (LCA) studies in civil engineering, the field of Mechanically Stabilized Earth (MSE) with geosynthetics remains relatively underexplored. This research aimed to perform LCA together with a circularity analysis of countries that could represent the South American context. The materials and methods section covers an environmental analysis using LCA, spanning the manufacturing phase to the end of the structures of MSE with different geosynthetics, comparing Earth-Retaining Walls (ERWs), employing the ReCiPe method. Material circularity analyses for the three structures under consideration were performed using the Material Circularity Indicator (MCI). The proposed scenarios were conducted not only when recycled materials were introduced to replace virgin materials, but also when examining the concrete face and incorporating vegetation planting. The results suggest that MSEs can be environmentally more sustainable than ERWs. Therefore, the decreases were 80%in almost all categories. Furthermore, the material circularity analysis indicated that the incorporation of recycled materials increased the MCI, achieving 250% circularity for geosynthetics. Thus, it was inferred that the LCA methodology and circularity analysis effectively enabled qualitative and quantitative assessments. Notably, the findings highlighted the superior environmental sustainability of soil structures compared to their concrete counterparts.
1. Introduction
The construction industry ranks among the leading contributors to greenhouse gas emissions [1]. Therefore, it is essential to seek solutions that can mitigate the potential impacts associated with the construction sector [2]. Over recent decades, there has been a notable surge in the demand for natural resources, where by civil construction accounts for more than 50% of these demands [3]. Therefore, the relentless exploitation of resources by the construction industry has led to the degradation of ecological systems that are crucial for the sustenance of all living organisms [4].
A viable solution lies in adopting alternative structures with reduced environmental impacts compared to traditional counterparts. In the field of geotechnical engineering, the solution can be created by implementing Mechanically Stabilized Earth (MSE) techniques and integrating geosynthetics or other sustainable materials [5]. Moreover, MSEs can be reinforced with grids, polymeric straps, or metal reinforcement [6].
In reference to geosynthetics, these materials have been important for sustainable development for many years, as they can replace scarce raw materials [7]. Geosynthetics offer cost competitiveness compared to traditional Earth-Retaining Wall (ERW) systems [8]. Therefore, assessing the environmental feasibility of using these MSE techniques requires using instruments to quantify and qualify the potential impacts to minimize them [9]. To this end, Life Cycle Assessment (LCA) has proven to be an effective method to assess the potential environmental impacts of products or services throughout their life cycle [10,11].
In recent years, there has been a notable surge in research focusing on LCA within the field of Civil Engineering [12,13]. Despite the growth in research, LCA applications in civil construction projects involving geosynthetics remain relatively uncommon [14]. However, geosynthetic technologies have been widely utilized in various civil engineering endeavors globally, including projects related to landfills [15], recycled construction and demolition waste [16], retaining structures [17], roads [18], and railway infrastructure [19]. Although these studies are very important for civil engineering, they tend to evaluate mechanical efficiency and its long-term performance, leaving environmental analyses in the background.
With the increase in the average global temperature, phenomena such as flooding, drought, and rising sea levels are becoming increasingly frequent and severe [20]. The aforementioned climate changes can be attributed to greenhouse gas emissions, with approximately 70% of these impacts potentially resulting from infrastructure construction and operation activities [21]. As emphasized by [22], conventional ERWs constitute essential elements of infrastructure. In this context, conducting environmental assessments is essential to propose alternative solutions that have reduced environmental impacts.
Several comparative studies have been conducted using LCA to examine the different environmental impacts of different retaining walls [23,24,25,26,27,28,29,30,31]. However, all of these studies focus on the analysis of ERWs with concrete. As in the study conducted by [32], the researchers found that gabion and masonry walls generate less carbon emissions than concrete walls at heights of 1 to 6 m. However, for heights above 4.5 m, cantilever walls are considered more suitable than gravity walls.
Other LCA research on MSEs has been employed. A study conducted by [33] investigated the benefits of geosynthetics in two geotechnical applications: an MSE and a conventional wall solution, showing environmental advantages for MSE. The authors in the research [34] indicated that using geosynthetic materials as reinforcement in MSE generates considerably lower environmental impacts than those observed in similar structures with metallic reinforcement. In another analysis [35], researchers detailed the main LCA methodologies and their applications to environmental impacts in typical earth-retaining structures and MSEs. In the study by [36], the authors reported that the use of geosynthetic reinforcement in MSE results in slightly lower environmental impacts compared to those constructed with metal reinforcement. All this LCA research performed on traditional ERWs and MSEs with alternative materials, such as geosynthetics, suggests the hypothesis that MSEs may be more environmentally sustainable when compared to conventional ERWs.
In addition to the LCA methodology, another instrument for making structures more sustainable is the recovery or reuse of materials through the Materials Circular Economy [37]. The Circular Economy (CE) represents a regenerative system in which inputs, waste, and emissions are reduced or can be fully reused or recovered [38].
Introducing the CE to the construction sector aims to significantly limit the environmental impact of construction-related human activities by reducing the built environment’s impact throughout its life cycle [39]. However, despite the urgency of a sustainable economic system and the enormous impact of the construction sector, there remains a notable absence of a comprehensive methodology to monitor and assess circularity in the Civil Engineering sector [40].
Circularity analysis can be more effective when performed in conjunction with LCA [41]. This, in turn, can support decision-making and strategies related to environmental performance and guide the search for more effective environmental improvements of products and procedures [42].
Despite the relevance, previous research has predominantly focused on studies regarding MSEs with geosynthetics in European countries and North America [23,24,25,26,27,28,29,30,31,32,33,34,35,36], thus lacking results that could be applicable to the South American context. Hence, our study aims to address the described gap. Furthermore, it seeks to assess the circularity of materials comprising the primary constituents of these structures. Thus, as far as we know, none of the studies carried out in LCA in containment structures have analyzed material circularities, highlighting the unique contribution of our work.
The combination of LCA and CE for designing MSEs with geosynthetics can contribute to sustainable development [43]. Moreover, our research can provide a contribution to the Sustainable Development Goals (SDGs), especially SDG 9 (industry, innovation, and infrastructure), SDG 12 (responsible consumption and production) and SDG 13 (climate action), promoting an opportunity to reflect on ways to make Civil Engineering a more environmentally efficient activity [44]. Therefore, our study can add to regional and governmental trends because, in a country where the National Solid Waste Policy needs to be more widespread [45], this study can encourage sustainable construction practices with environmental responsibility.
Additionally, one of the key motivations driving our research is to offer scientific support to professional designers and builders engaged in constructing such structures, enabling them to choose structures and materials with lower environmental impacts.
2. Materials and Methods
This section describes the procedures that guided the methodology of our research, namely, the definition of the structures studied, the application of the LCA phases, the analysis of material circularity, and the proposal of scenarios.
2.1. Types of Structures Where LCA Has Been Applied
A slope is defined as a sloping surface comprising soil or rock, which may occur naturally or be artificially constructed [46]. Ensuring slope stability is paramount in all contexts, as ERWs serve as a crucial means to achieve this objective [47,48].
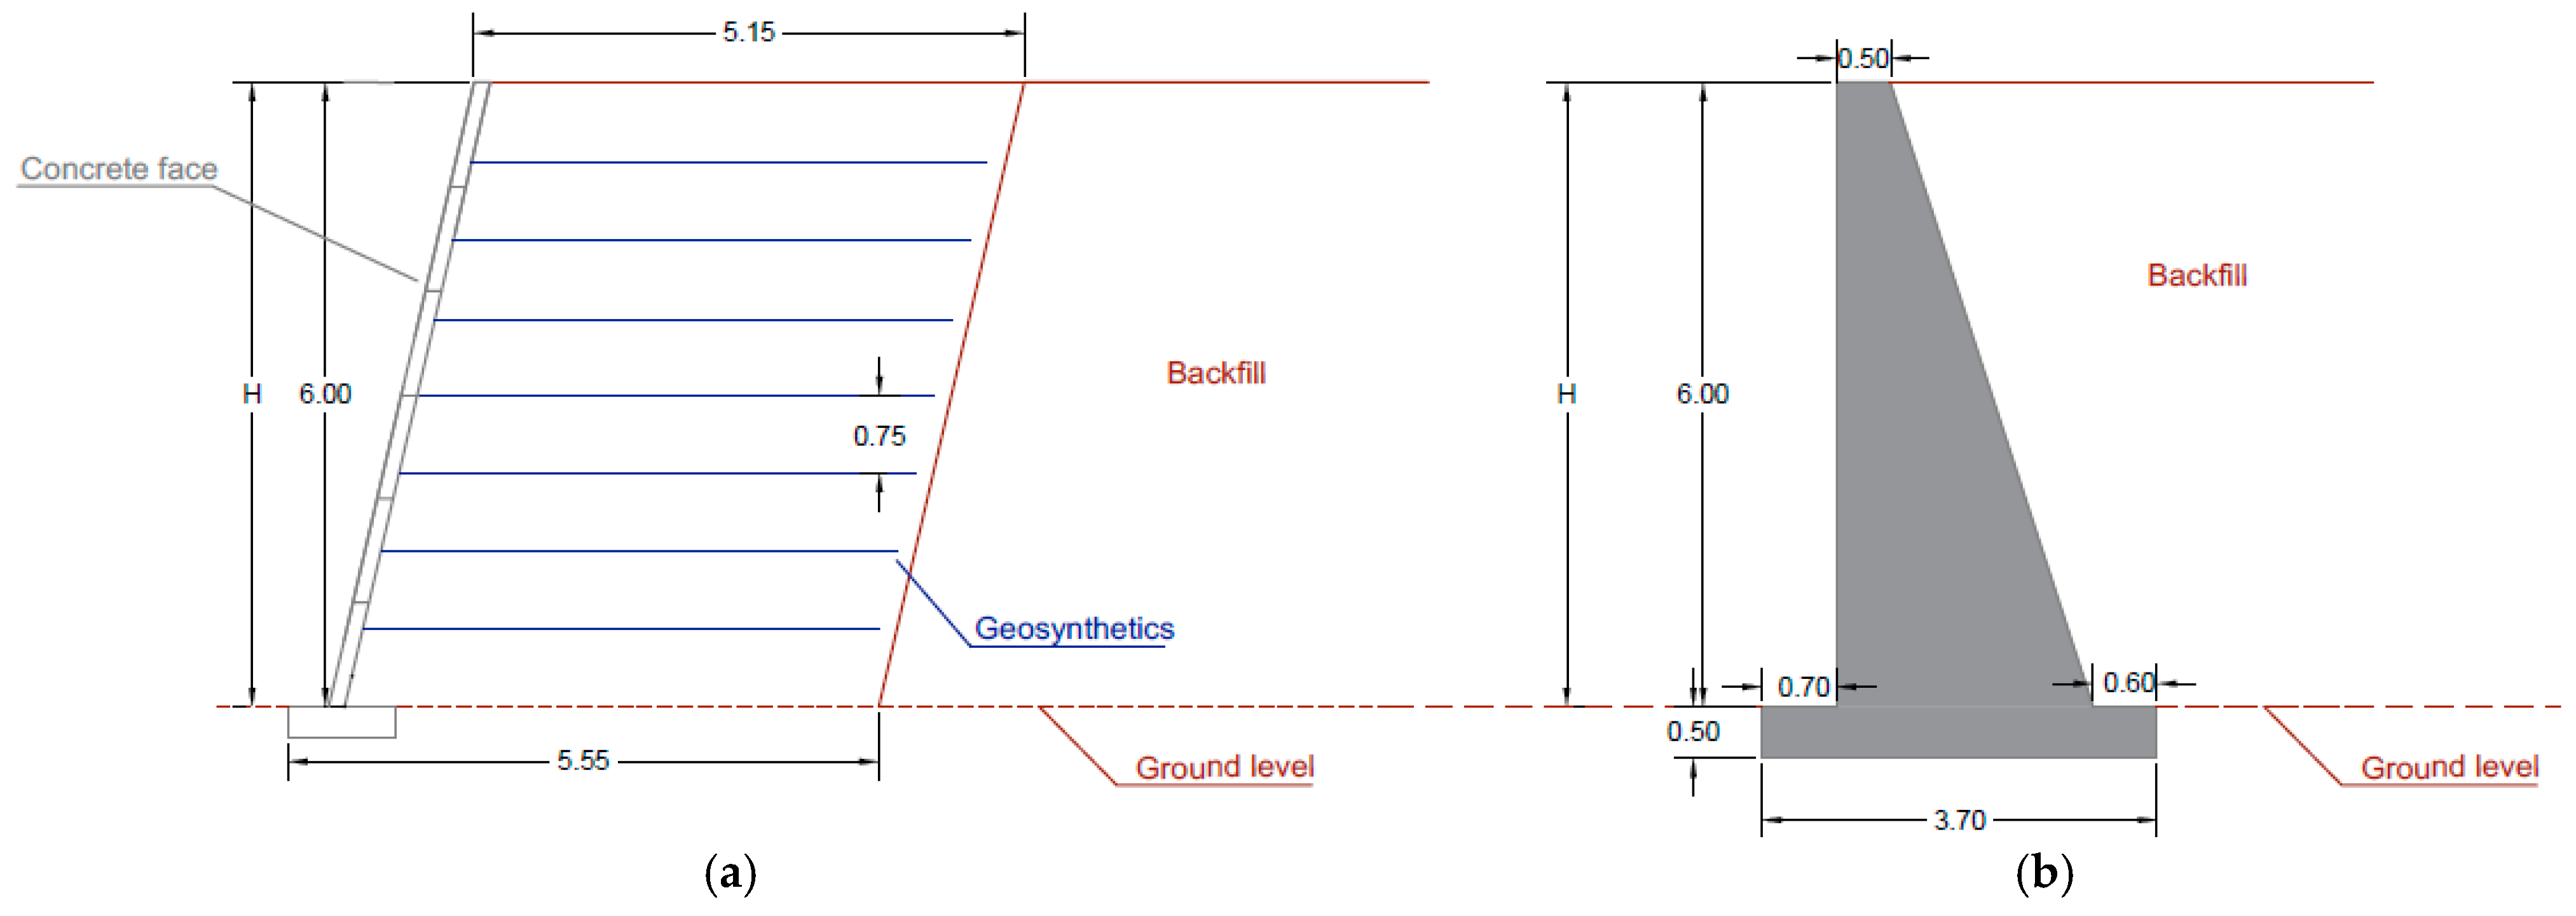
Our research studies the environmental performance of ERWs standing at a height of 6 m(H). A comparative analysis of the life cycles of two MSE walls incorporating geosynthetics (Figure 1a) and a concrete gravity ERW (Figure 1b) was conducted. In addition to the height, all other measurements of both structures were considered in meters (m).
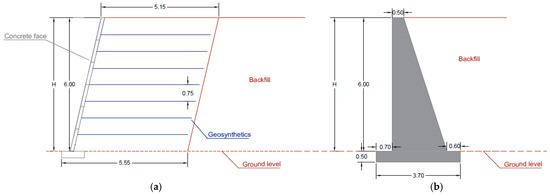
Figure 1.
Retaining walls of (a) soils with geosynthetics and (b) concrete.
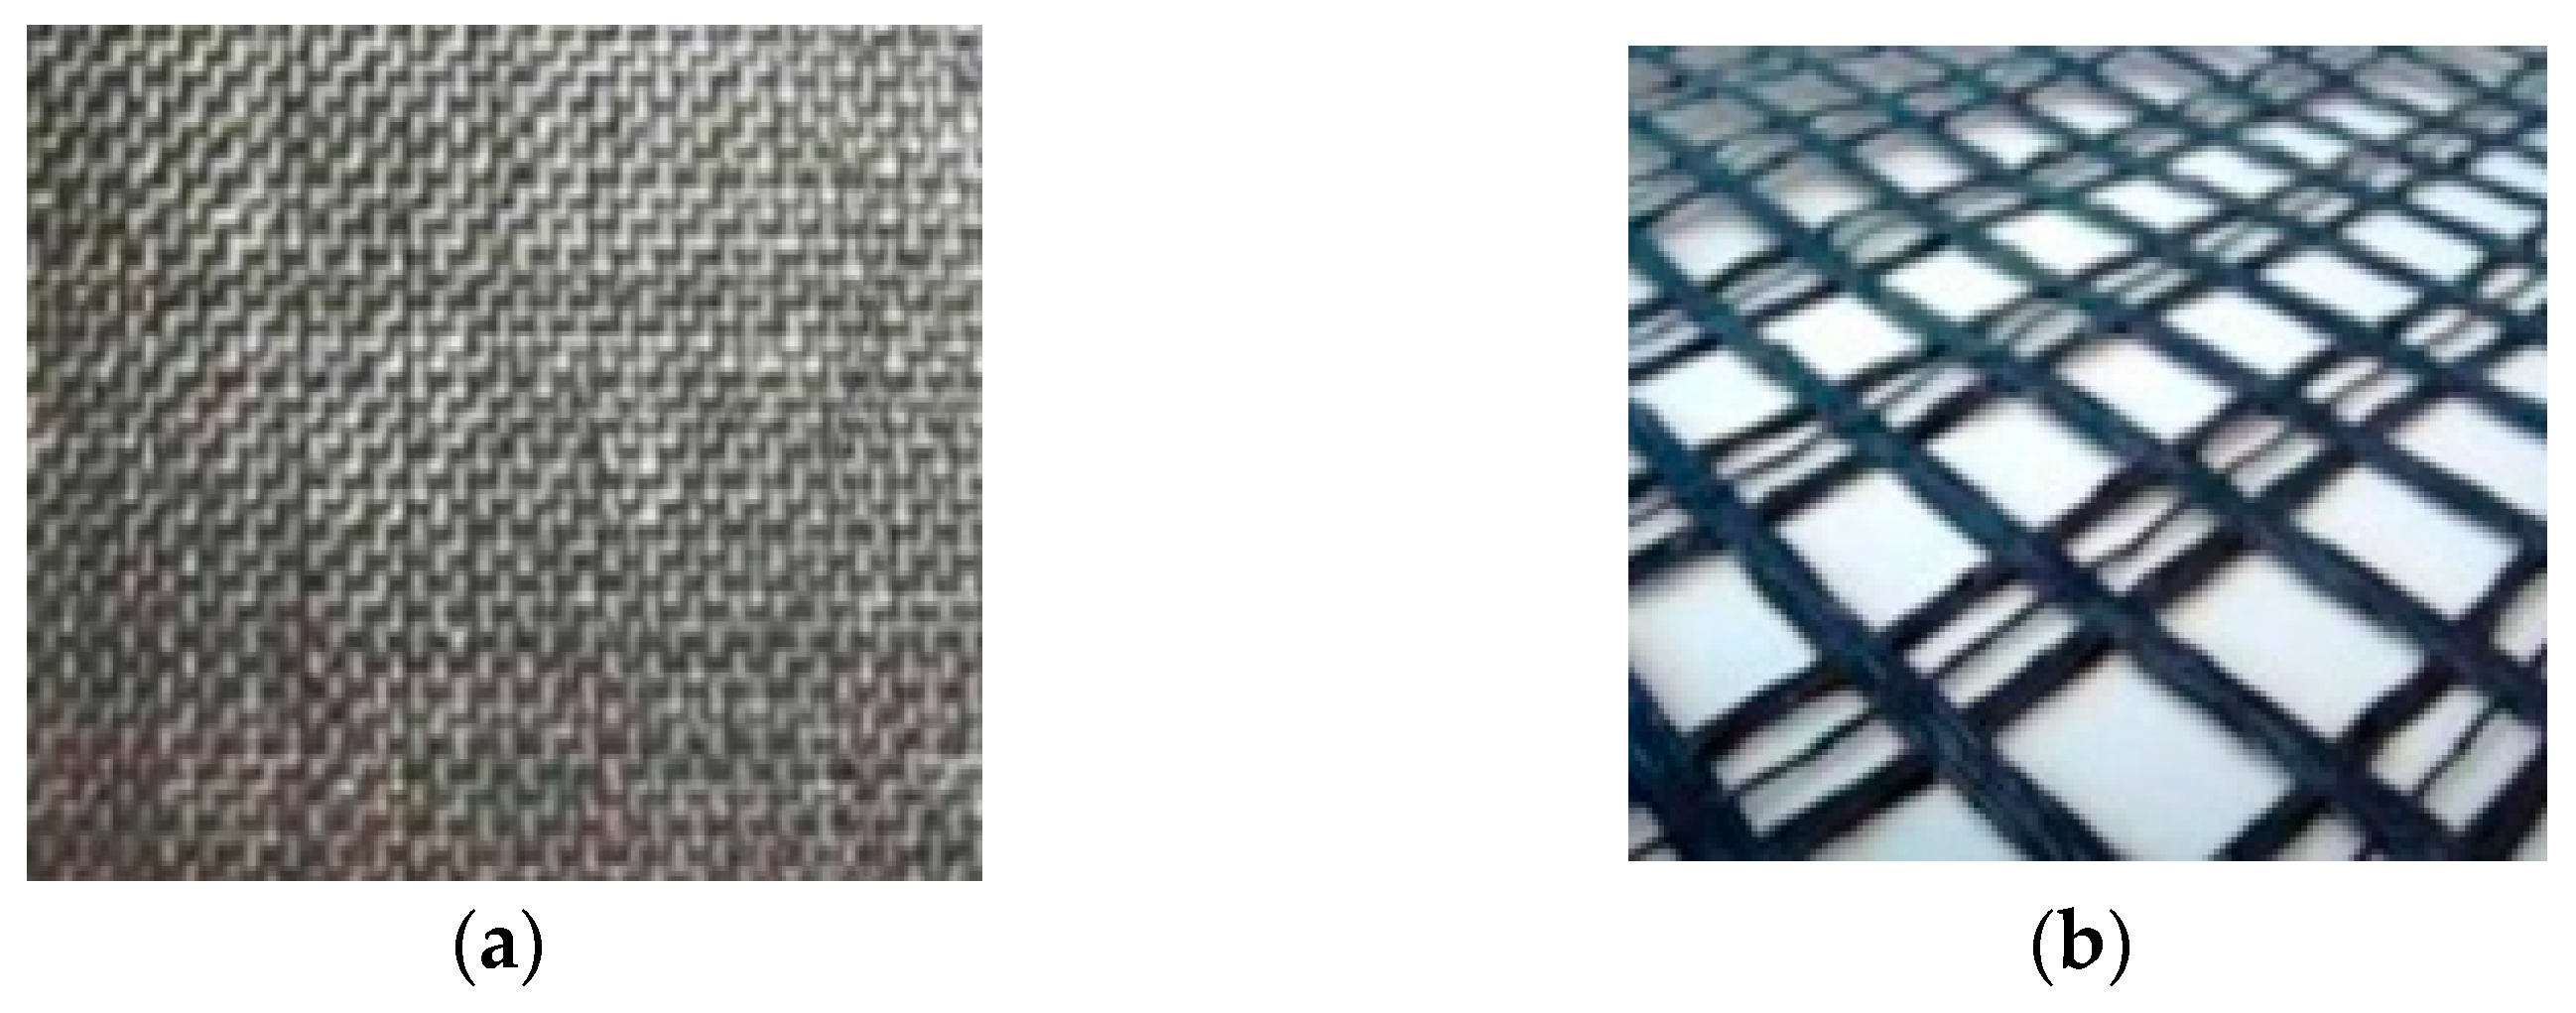
For MSE wall reinforcement, two types of geosynthetics were utilized: Woven Geotextile (Figure 2a) and Geogrid (Figure 2b). The longitudinal tensile strength of the Woven Geotextile and the Geogrid was 25 kN m−1, regarding the thickness of the elements the Woven Geotextile had 1.4 × 10⁻³ m and the Geogrid had 1.2 × 10⁻³ m [49].
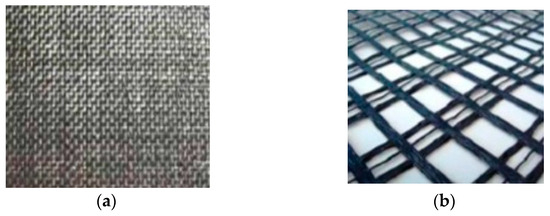
Figure 2.
The geosynthetics employees to reinforce soil structures were (a) woven geotextile; (b) geogrid [49].
Geosynthetics were selected to meet specific requirements regarding tensile strength.
2.2. Scope of the Study
The fundamental function of MSEs and ERWs structures is to prevent the displacement of soil masses, mitigating the forces acting on the slopes [50].
The product system refers to a comprehensive framework encompassing all operations involved in the life cycle of the product or service under examination. It involves defining each unit process comprising the life cycle [51].
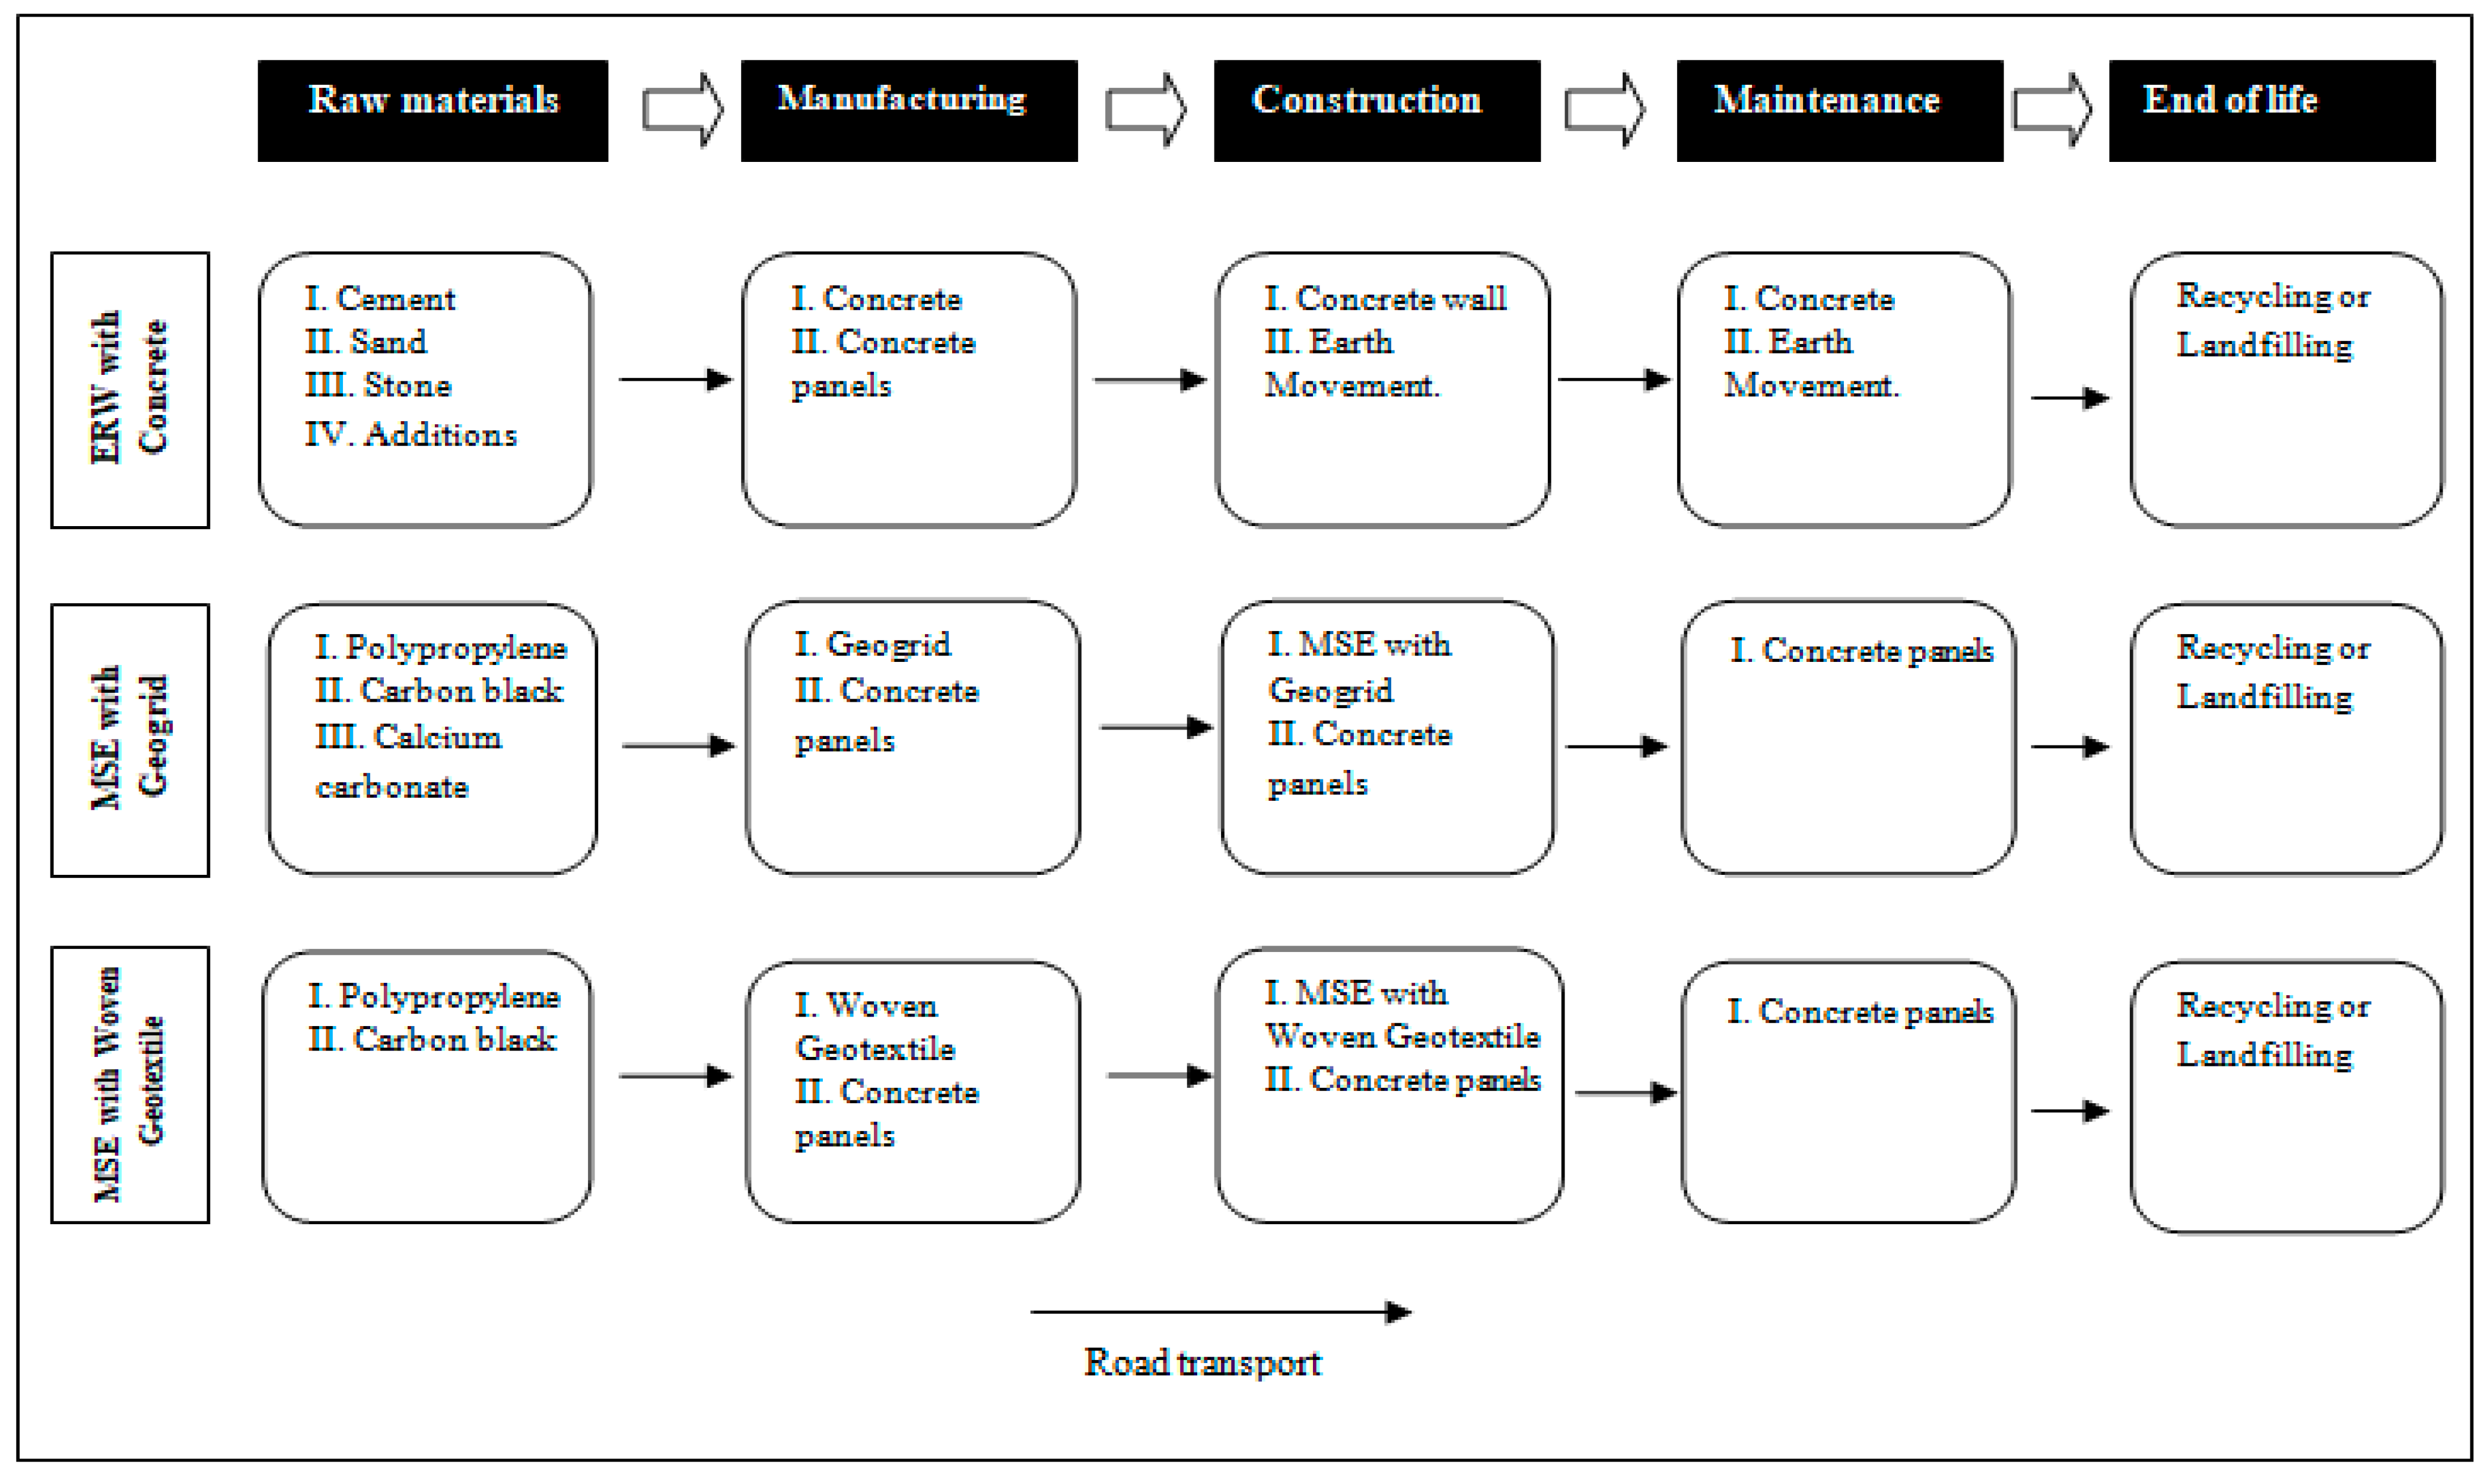
Our research proposes to carry out an analysis of the performance of environmental impacts through the LCA methodology from cradle-to-grave, analyzing the manufacturing, construction, maintenance, and end-of-life processes (Figure 3).
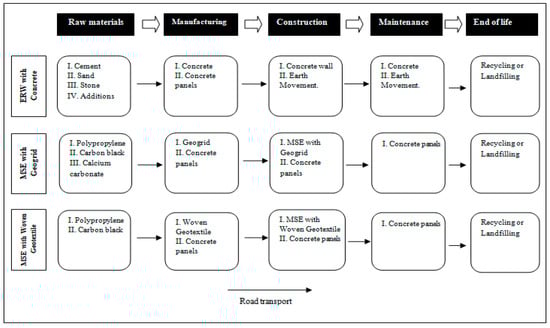
Figure 3.
Product system.
The minimum durability of ERWs with concrete is 50 years [52]. Thus, the same service life was adopted for both MSEs with geosynthetics. The functional unit adopted was 1.00 m3 for the analyzed structures in the city of São Carlos, state of São Paulo, Brazil. The objective of a functional unit is to ensure the comparability of results [53], through input and output reference flows [54].
2.3. Life Cycle Inventory
During the Life Cycle Inventory (LCI) phase, it is imperative to quantify the various unit processes previously defined within the boundaries of analysis. In the LCI stage, refining and quantifying the different matter and energy flows listed in the processes is critical to obtain a detailed and accurate representation of the LCA of the product or process in question [55].
In our study, data collection began with the collaboration of companies involved in the manufacturing and implementation of geosynthetic projects. In cases where information gaps were identified, the technical literature was used to complement the data. Regarding ERWs, all pertinent data were sourced exclusively from the technical literature [23,24,25,26,27,28,29,30,31,32]. For this present study, the Ecoinvent database was used.
2.3.1. Manufacture of Materials
For the manufacturing process of 1 kg of geosynthetics (Table 1), the analysis encompassed all materials provided by the manufacturer. The manufacturing process included all resources required to produce both the geogrid and the woven geotextile.

Table 1.
Materials selected to produce 1 kg of the primary resources used in containment structures.
Concerning the raw materials for geosynthetics, polyethylene, and polyester are regarded as fundamental materials. Thus, they are essential materials for the manufacture of geosynthetics. Nonetheless, there are some minor distinctions between the polymers utilized [56]. This implies that the selection between polyethylene and polyester may not significantly influence the choice of geosynthetic material.
To produce 1 kg of concrete (Table 1), the basic inputs used were stone, sand, cement, and water. The superplasticizer additive was also considered a material used to improve the workability of concrete, thus improving its resistance. The following quantities of raw material were considered: Polypropylene (95%) and Color Masterbatch—carbon black (5%) for the geogrid and polypropylene (96%); Color Masterbatch—carbon black (1%); and Filler Masterbatch—calcium carbonate (3%) for the woven geotextile. For the concrete, the following composition in kg mass was considered: 1:3:6 (cement–sand–stone), with a water quantity of 60% in relation to the quantity of cement. The characteristic strength of the concrete utilized for the traditional ERWs was 30 MPa.
In our study, diesel was the primary fuel used for vehicles transporting materials from structures to their factories, other machines ran on electricity.
It should be mentioned that Brazil’s electricity mix predominantly relies on renewable sources, with approximately 88% of the domestic electricity supply sourced from clean energy as of 2022. Hydroelectric generation is the primary contributor, comprising 64% of the total supply. Other renewable sources, such as wind (11.8%), solar (4.8%), and sugarcane bagasse (4.4%), also play significant roles. The energy panorama is further supplemented by black liquor or bleach, net imports, and other renewable sources. This diversified energy generation profile, underscored by a strong emphasis on renewables, reflects Brazil’s commitment to sustainability and energy security [57].
2.3.2. Implementation of Structures
Digging and compaction machines were required for the construction process, and diesel oil was the fuel used in these machines. Some situations required smaller hand compactors that also used diesel fuel.
For this present study, we did not consider the materials or processes that occur below the surface of each structure. The water table was assumed to be below the base and did not influence the analyses.
For the two MSEs and the ERW, a layer of stone was built, and pipes were installed to assist in the drainage of the three structures. A concrete ballast was executed for the MSEs reinforced with geosynthetics. The MSEs were compacted in layers with a thickness of 75 cm and horizontal installation of geosynthetics occurred in the main layers.
To facilitate the execution of MSEs with geosynthetics and the ERW with concrete, wooden panels were employed, which are reusable. Additionally, a waterproofing procedure was conducted to enhance the longevity of the structures. Regarding the steel used in the gravity structure, it had no structural function; therefore, it was not considered for the analysis of the potential impacts of our research. The woven geotextile has a grammage of 180 g/m2 and the geogrid features a grammage of 400 g/m2. Moreover, according to the geosynthetics manufacturer’s recommendations, 42 m2 of geogrid and 49 m2 of woven geotextile are required. All quantities of materials necessary for the construction of 1 cubic meter of the three structures are itemized in Table 2.
Table 2.
Materials needed to construct 1 m3 of retaining structures.
2.3.3. Maintenance of Structures
The construction of the structures required using identical machinery, and the materials utilized are detailed in Table 3.
Table 3.
Materials needed for the maintenance of 1 m3 of containment structures.
In general, the maintenance schedules for all three structures are determined by their overseeing management, who must balance the material’s longevity and its current condition. However, regular inspections are essential to prolong the structures’ service life. In order to increase the structures’ service life, routine inspections should be carried out annually, a special inspection every five years, and, when necessary, extraordinary inspections [58], both on concrete structures and on soil structures.
According to information from the construction company, the MSEs with geosynthetics were designed for their useful life without any significant intervention, as they are underground structures. Therefore, the main intervention in the MSEs was the recomposition of the concrete face covering.
2.3.4. End of Life
For the end-of-life calculations of the retaining structures, after the maintenance processes, the concrete was recycled at a rate of 90% [59]. According to experts, the recycling rate of concrete can be achieved if the material is previously separated before the recycling process [60]. The remaining concrete was sent to the landfill.
For the geosynthetics, recycling rates of 80% were adopted for both the geogrid and the woven geotextile. The remaining material was disposed of in landfills after use [61]. The final destination stage included transportation to the landfill, spanning a distance of 50 km, and machine operation, which consumed 3 L of diesel per m3.
2.4. Life Cycle Impact Assessment
Life Cycle Impact Assessment (LCIA) is an essential component of LCA, aimed at quantifying the potential environmental impacts of a product or service across its entire life cycle [62]. In LCIA, Life Cycle Inventory (LCI) data are linked with distinct impact categories to classify, characterize, and quantify environmental impacts [63].
In our study, LCIA was conducted using the ReCiPe method (2016), hierarchist version. This method was selected due to its ability to cover a wide range of impact categories, making it one of the most used methods among researchers investigating LCA. Among the studies related to MSEs with geosynthetics, approximately 40% used the method, making it the preferred choice among researchers in the field [33,34,35,36].
Although the ReCiPe method included 17 categories at a midpoint [64], the categories selected for this study are presented in Table 4. They were the same categories used in other research that studied LCA in soil structures reinforced with geosynthetics [33,34,35,36].
Table 4.
Impact categories.
The most recent version of the OpenLCA software (version 2022) was used to process the inventory data. All data collected, primary and technical literacy (secondary), were characterized by the ReCiPe method (2016), and the results achieved were analyzed, treated later, and transformed into graphs to help understand the potential environmental impacts. After the LCIA, the normalization factor proposed in Europe ReCiPe H, 2000 was applied, which represents the impact of Europe for 2000 [65,66]. The choice of these standards is justified, as there is no relevant regulation in Brazil. For this reason, the instructions from the European regulation were used, as they are more representative of the area.
According to [67], normalization is a process that aims to make the results of different impact category indicators in an LCA comparable. The normalization procedure is performed by dividing each category’s results by a predefined reference value, allowing a more comprehensive and objective analysis of environmental impacts [68]. The normalization factors used in our research are shown in Table 5 below:
Table 5.
Normalization factors.
2.5. Material Circularity Analysis
Circularity indicators were developed to assist organizations in assessing and communicating their progress in the context of the CE [69].
The Material Circularity Indicator (MCI) was primarily developed by combining four product characteristics: the quantity of virgin raw material (V) used during manufacturing; the volume of non-recoverable waste (W) attributed to the product; the linear flow indicator (LFI); and a utility factor (UF) that considers the product’s durability and usage intensity [66]. Below is the equation that describes the MCI:
MCI = 1 − LFI × UF
The MCI assigns a score between 0 and 1 to represent the circularity level of a material product. Values closer to 1 signify a heightened degree of product circularity. Due to its inclusion of parameters related to reuse, recycled materials, the recycling process’s efficiency, the product’s shelf life, and its end-of-life treatment, the MCI is considered a robust metric [69]. The results of the MCI for the traditional ERW were calculated considering its main input, which consisted of concrete. The main components of the other two MSEs were the geogrid and the woven geotextile. Materials with MCI values approaching 1 indicate high circularity, while those nearing 0 represent low circularity.
2.6. Proposed Scenarios
A scenario analysis was conducted. To achieve this goal, analyses related to altering the face of the soil structures were carried out. For our present study, environmental studies were carried out on the concrete face, but it is also very common to perform them on the grass planting face instead of the concrete face [70].
Therefore, scenario analysis studies were conducted, contrasting grass planting with the identical concrete-faced structures previously examined in this present study. Moreover, scenarios were proposed to evaluate the materials’ circularity.
Reusing concrete can yield considerable socio-economic and environmental advantages, in addition to technical advantages, such as the possibility of replacing up to 50% of traditional aggregates with recycled materials without compromising the mixture’s mechanical properties [59]. Thus, to compare the MCI of the concrete with those of the geogrid and the woven geotextile, environmental analyses were carried out with different increases in the content of recycled materials in relation to virgin materials (Table 6). The additions of recycled materials evaluated were 10%, 20%, 30%, 40%, and 50% replacing virgin materials. The purpose was to analyze the influence of the increase in these recycled materials on the MCI values of concrete, geogrid, and woven geotextile.
Table 6.
Percentages of waste were added to calculate the MCI.
3. Results
3.1. Analysis of the Potential Environmental Impacts of the Proposed Categories
The performance of the structures was analyzed, and the potential environmental impacts were calculated using the ReCiPe 2016 method, as described previously. The manufacturing, execution, maintenance, and end-of-life processes were considered. Furthermore, the seven categories specified in Table 4 were studied, which highlight the effects on human health and the ecosystem. The results were described in Table 7 for the three structures for the analyzed categories.
Table 7.
Non-normalized results.
The ReCiPe evaluation method was applied using the normalization factors proposed by this method, described in Table 5. The application of these factors allowed all results to be presented on the same scale. The final results were presented as normalized impact for the three structures in Table 8.
Table 8.
Normalized results.
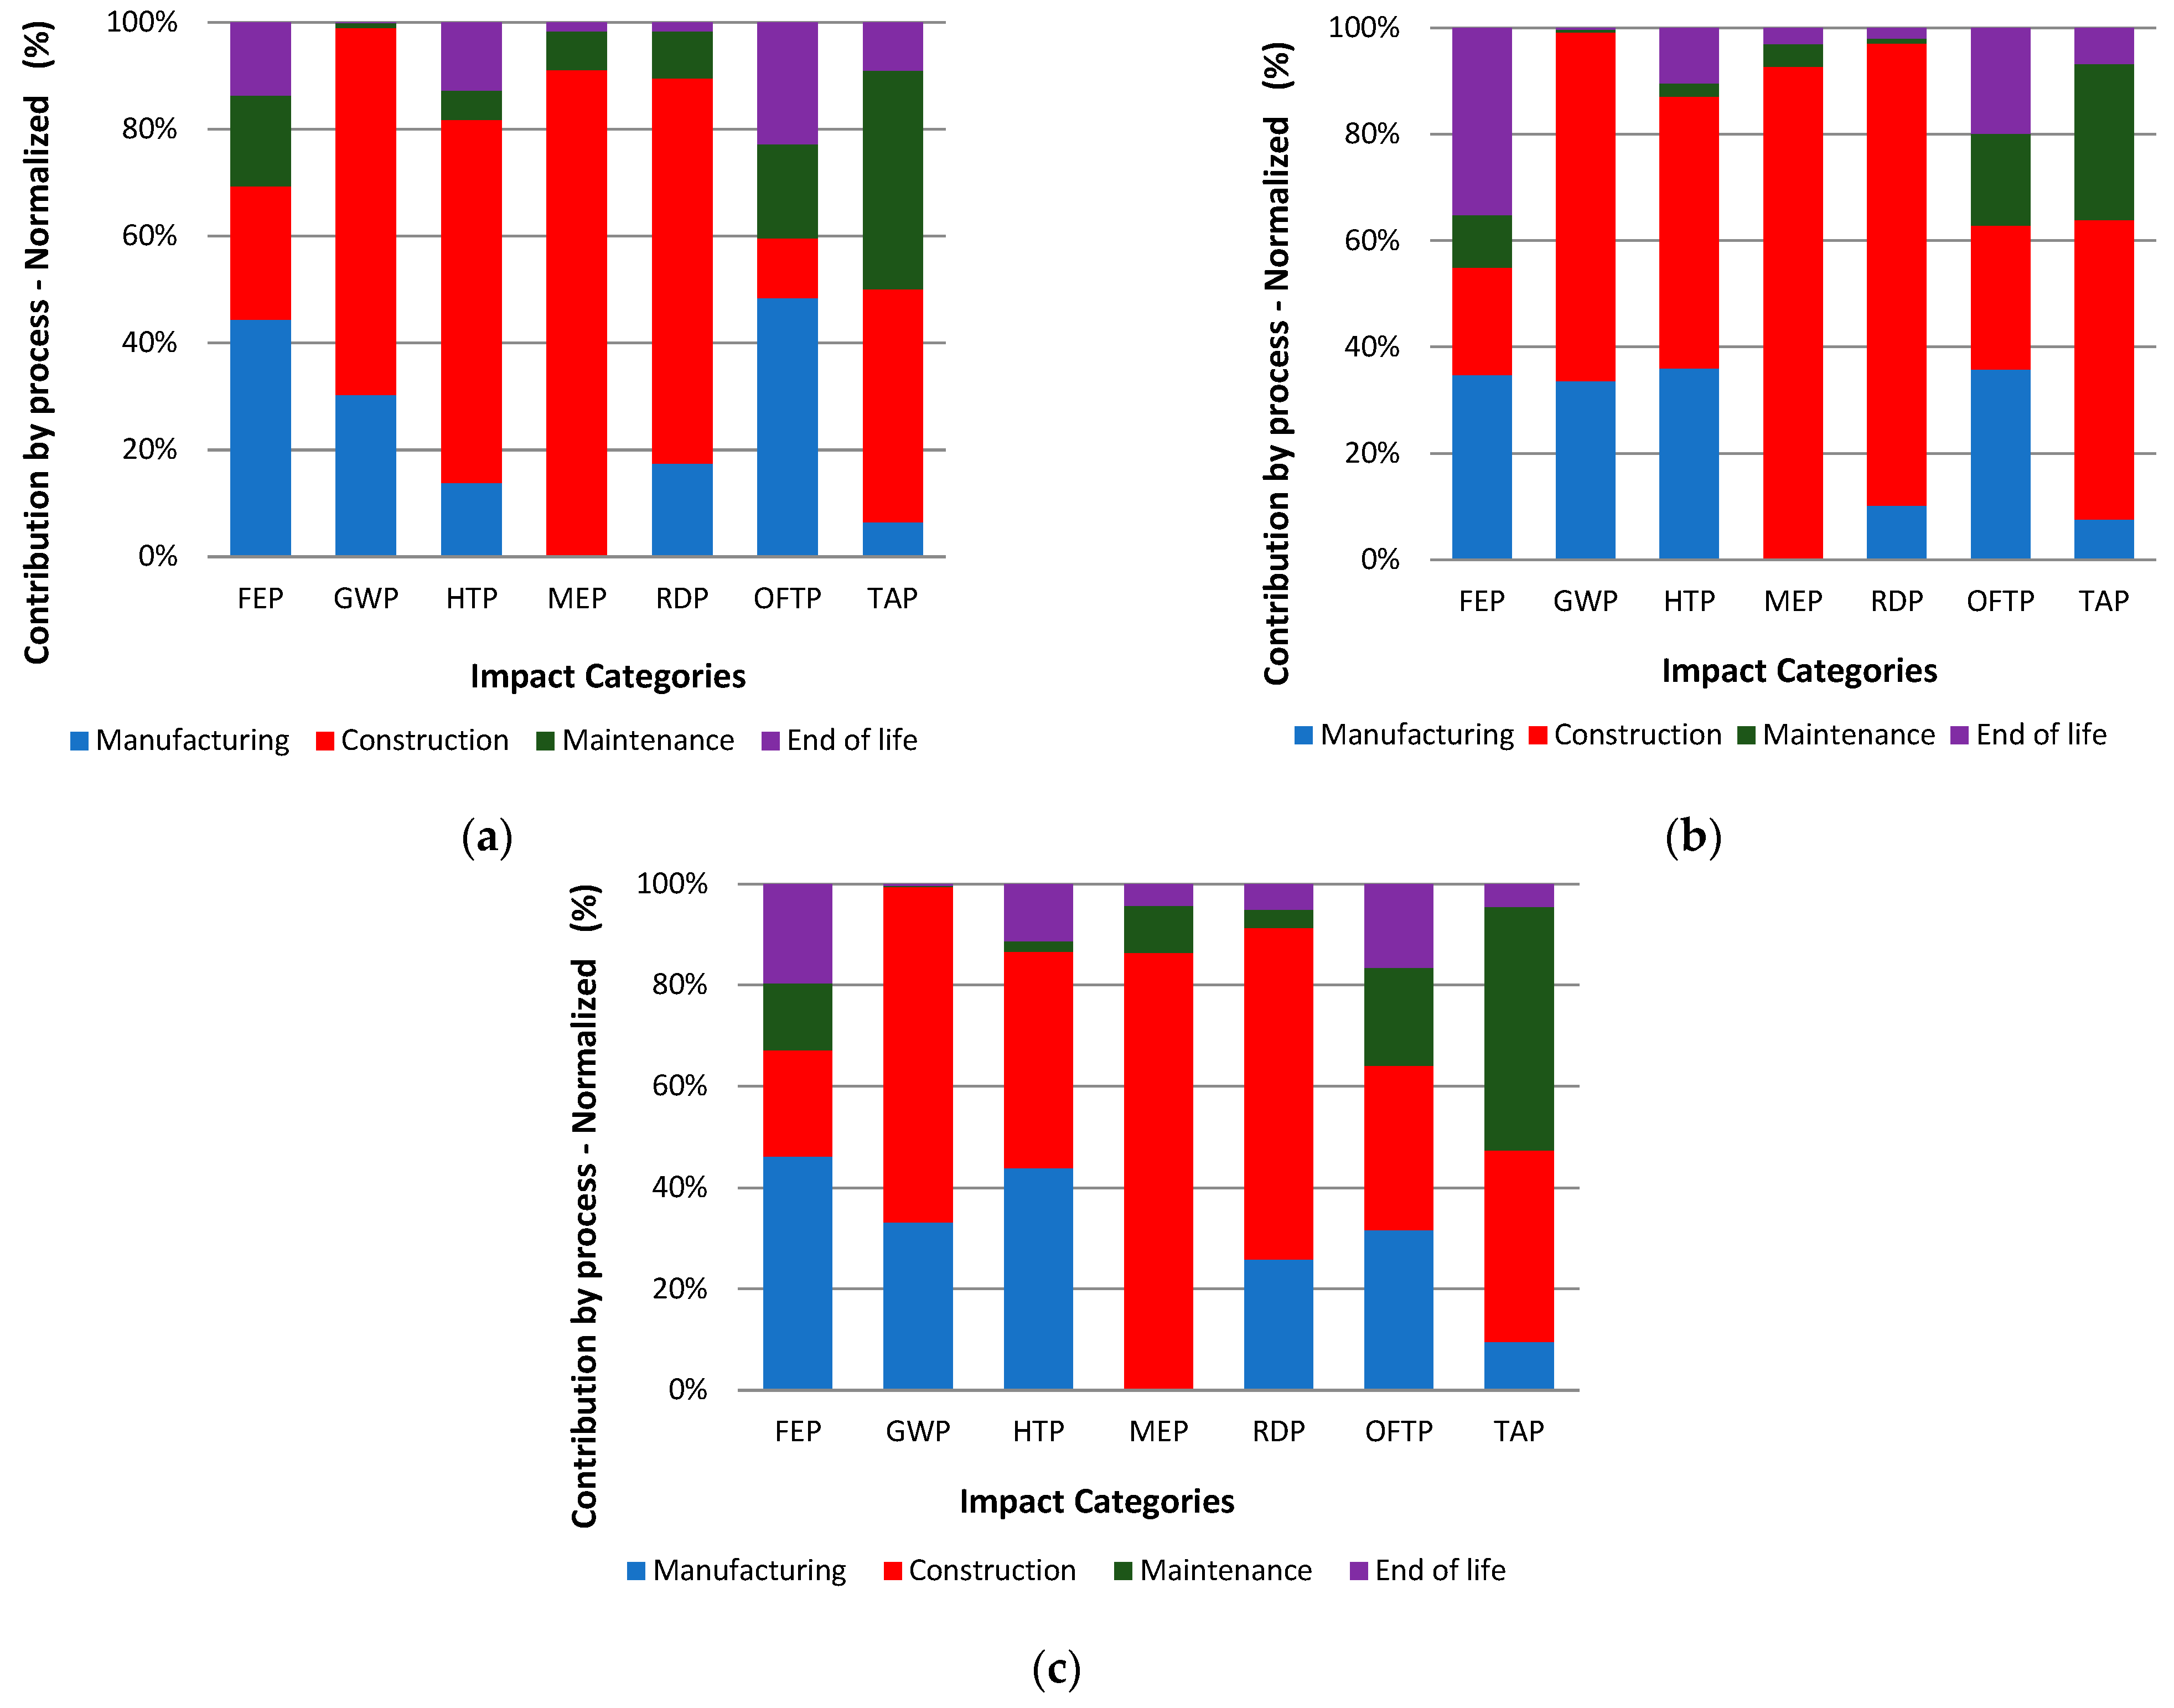
The results of the contributions of potential impacts normalized by the impact category in the manufacturing, construction, maintenance, and end of life processes are presented below (Figure 4a–c).
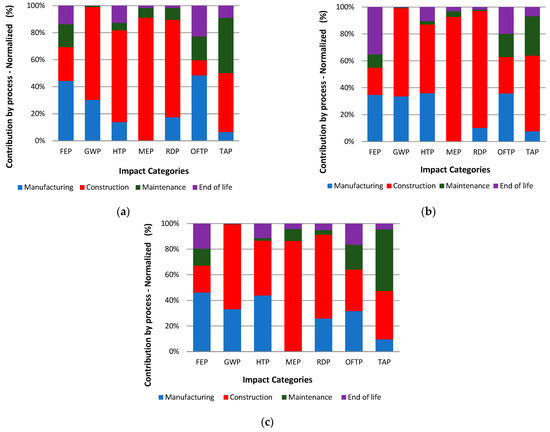
Figure 4.
Contribution of processes by impact category: (a) earth-retaining wall (ERW) in concrete; (b) mechanically stabilized earth (MSE) with geogrid; and (c) mechanically stabilized earth (MSE) with woven geotextile.
When examining which process exhibited the highest magnitude per category in the specific ERW (Figure 4a), it was observed that the construction process predominated in four out of the seven categories analyzed, in all these four categories GWP, HTP, MEP, and RDP, the contribution to the construction process was at least 60%. During the ERW construction stage, more than 90% of participation was attributed to the MEP category.
The second process with the highest recurrence was manufacturing, which had the highest magnitude in two of the seven categories. In the ERW manufacturing phase, the FEP category had more than 40%, and the OFTP category had approximately 50% of the manufacturing phase contribution. The TAP impact category had a similar contribution between the construction and maintenance phases, with a contribution of approximately 40% to both processes.
On the other hand, for MSE with geogrid (Figure 4b), this analysis followed the same trend as that of ERWs in concrete, in which the execution process participated in five of the seven categories, the contribution to the construction process was at least 50% in all five impact categories: GWP, HTP, MEP, RDP, and TAP. In the construction stage of MSE reinforced with geogrid, over 95% participation was observed in the MEP category, making it the most significant involvement during the execution phase. Additionally, similar to concrete ERW, manufacturing was the second process with the highest participation in the seven categories investigated. For the FEP impact category, the manufacturing and end-of-life phases had similar values, with almost 40% contributions each. The OFTP impact category had the manufacturing phase as the largest contributor, with almost 40%.
Similarly to the previous structures, the MSE utilizing woven geotextile (Figure 4c) demonstrated heightened engagement during the execution stage, contributing to three of the seven analyzed categories, participation for these three categories, GWP, MEP, and RDP, had contributions from approximately 60%. Similarly to the geogrid MSE, the MEP category had the most substantial participation during the construction phase, with more than 80% contribution. In the FEP and HTP impact categories, the manufacturing phases were the ones that contributed, with more than 40%. In the OFTP category, the construction and manufacturing phases were the ones that contributed the most, with constructions close to 30%. In the TAP category, the maintenance phase was the one that contributed the most.
The results (Figure 4a–c) show that, for the most part, the construction stage is the one that most contributes to the potential environmental impacts in the three structures under study. A plausible explanation was that during the execution phase, in all three structures, concrete played a prominent role; ERWs in concrete practically in its entirety and MSEs with geosynthetics on the faces of the structures. The second phase with the most contributions was manufacturing, a possible explanation could be due to the need to use diesel to burn machines and also due to the waste that diesel can cause in the soil and water.
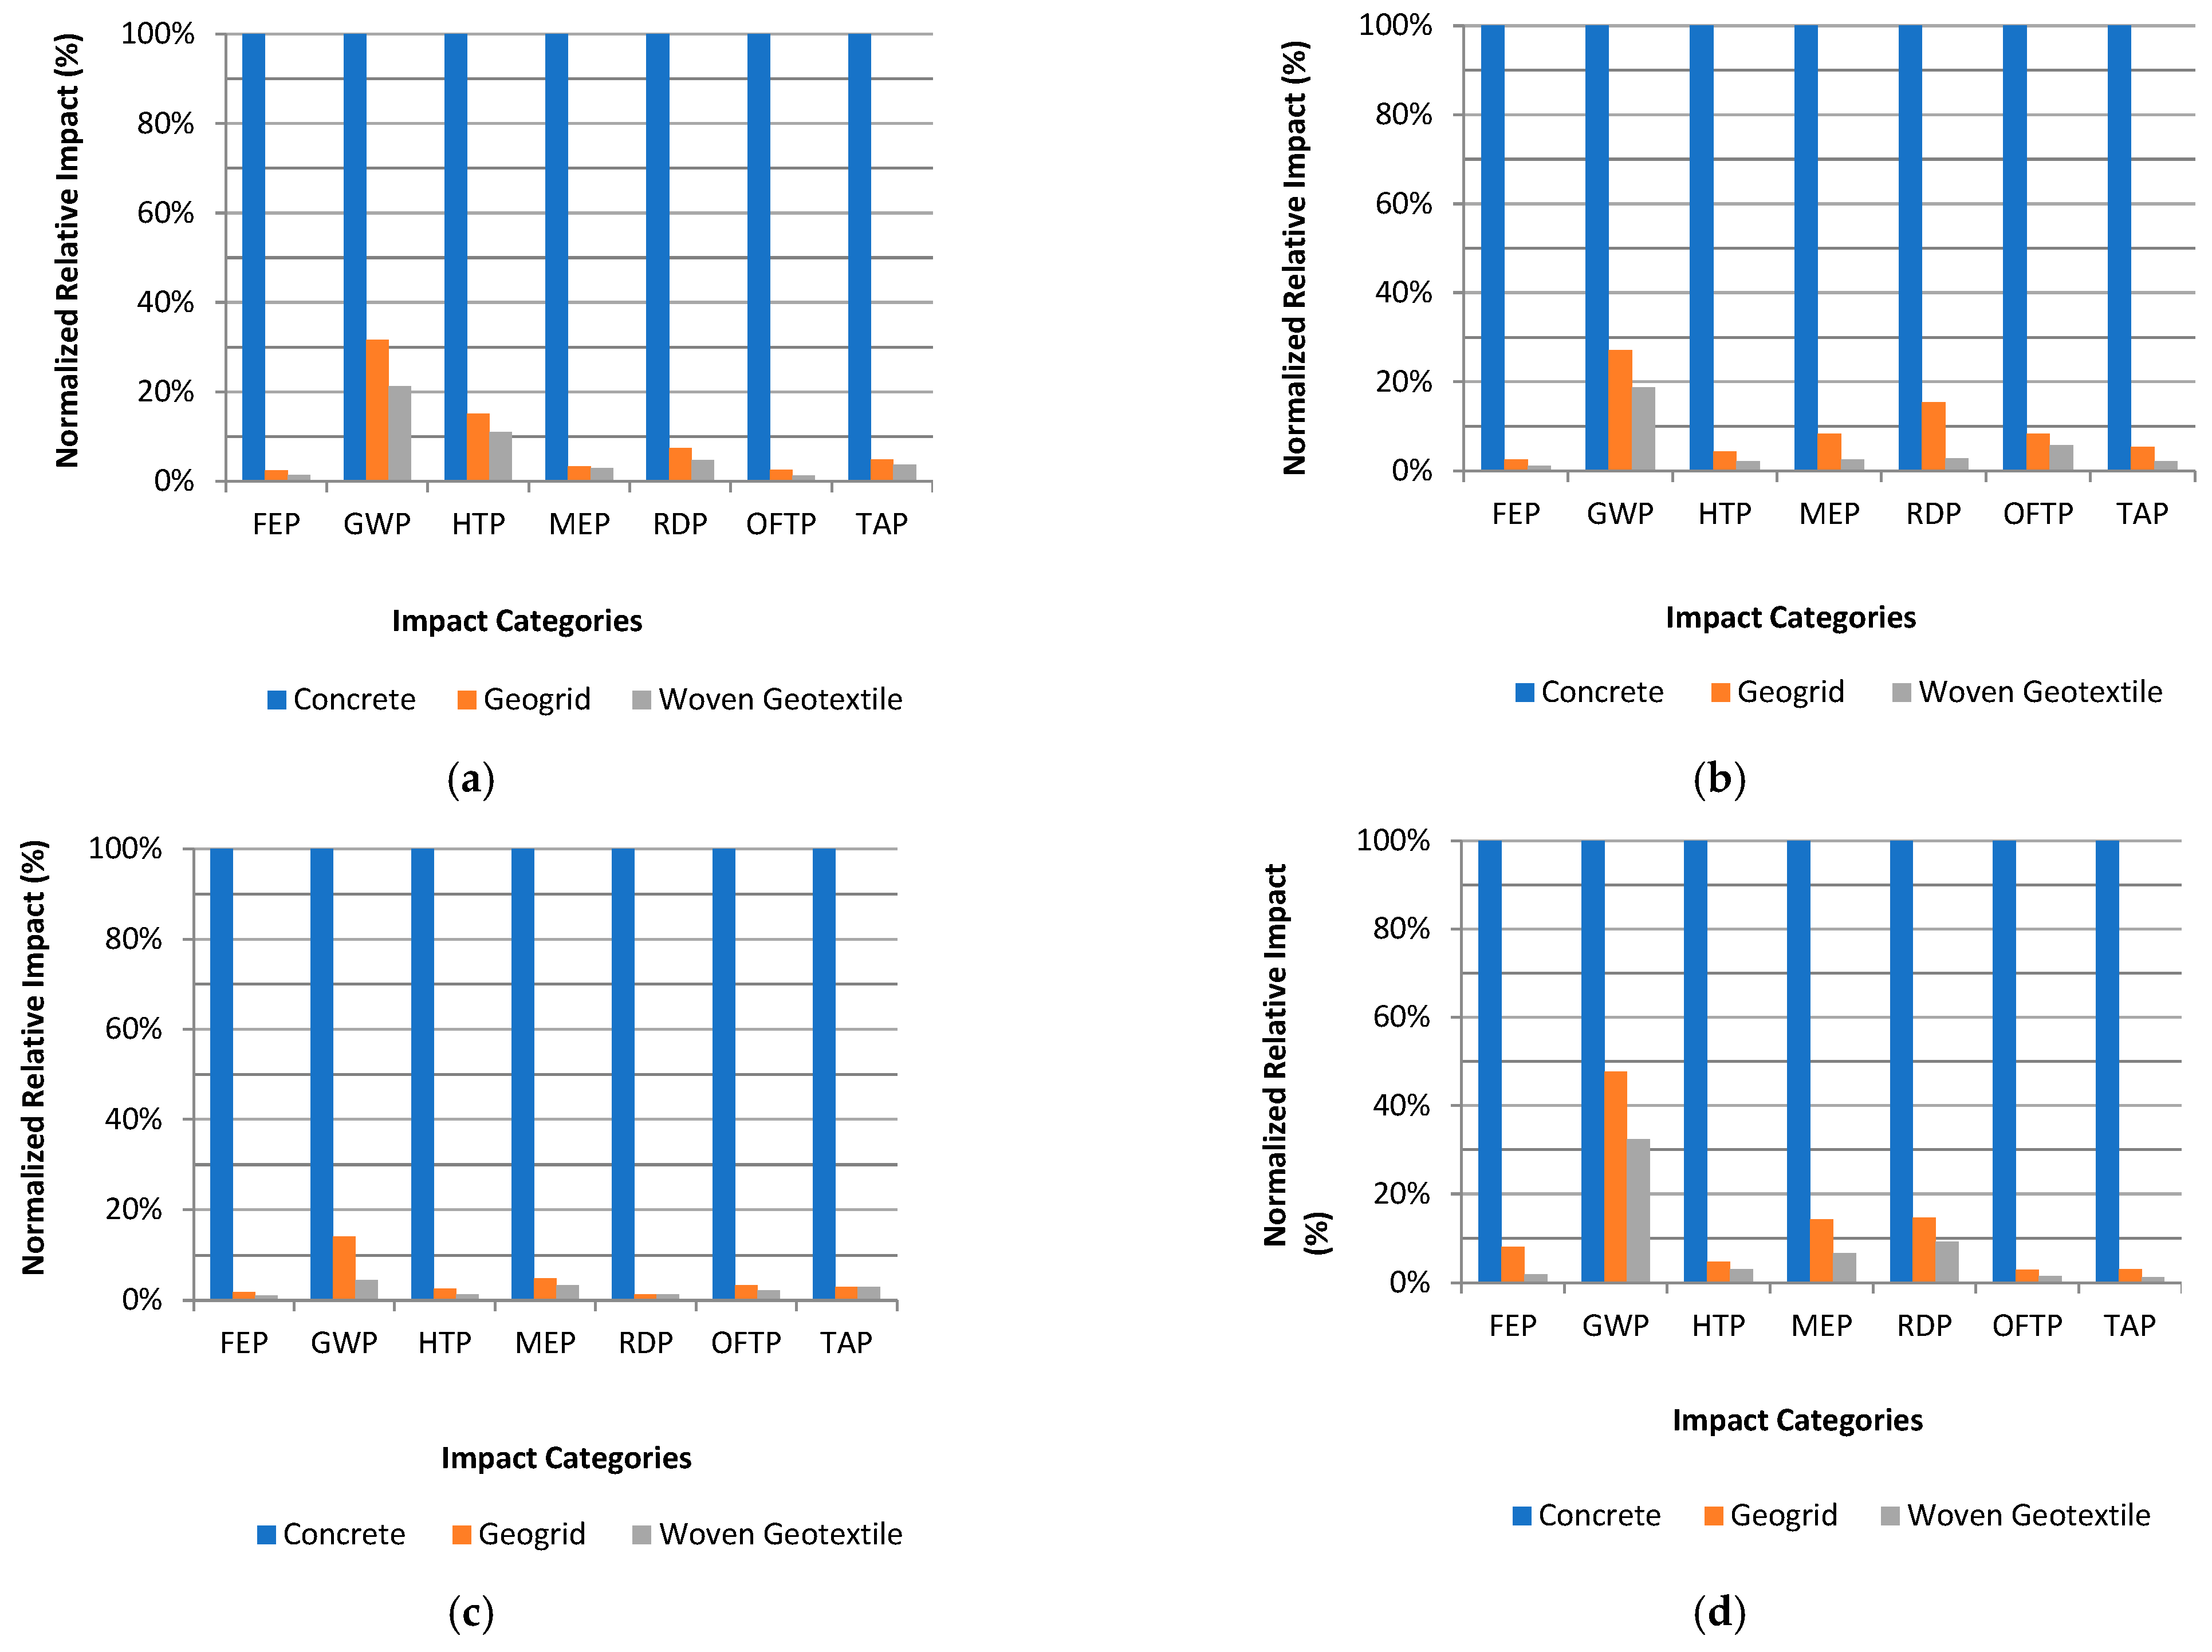
In the analyses of normalized relative impacts (Figure 5a–d), the concrete structure, which had the highest contribution of 100%, was selected as the baseline to explore the reduction in each impact category compared to other structures.
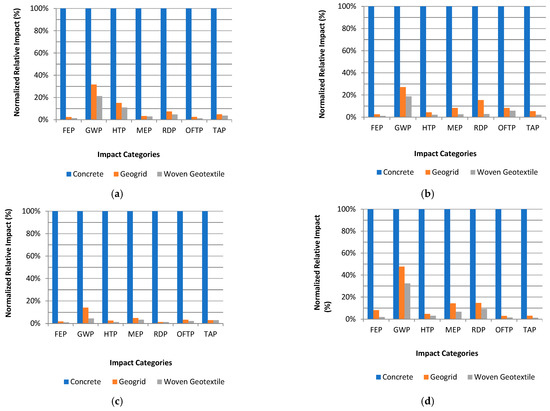
Figure 5.
Relative contribution of impacts to the processes of: (a) manufacturing, (b) construction, (c) maintenance, and (d) end-of-life.
When assessing the impact category responsible for the most substantial decrease in the manufacturing process (Figure 5a), it was observed that in the MSEs utilizing geogrid and woven geotextile, OFTP and TAP categories showed reductions of over 90%. The impact category with the smallest differences was GWP for the manufacturing process. The other categories, FEP, HTP, MEP, and RDP, had more than 90% reductions compared to traditional ERW. When examining the relative impacts of the construction process (Figure 5b), the most notable reductions, around 95%, were observed in the MSE with geogrid and woven geotextile. Notably, the FEP category experienced this decrease. The category with the smallest differences, similar to the manufacturing process, was GWP for the construction process; the other categories, HTP, MEP, RDP, OFTP, and TAP, saw reductions in more than 80%.
When analyzing the relative constraints to the maintenance process (Figure 5c), the decrease was quite significant, in the order of 98%, in two impact categories: FEP and RDP. Similarly to the manufacturing and construction processes, the category with the smallest reductions was the GWP for the maintenance process; the other impact categories, HTP, MEP, OFTP, and TAP, obtained more than 90% reductions. The decreases were also significant during the end-of-life process (Figure 5d), in the order of 95%, especially in two impact categories: OFTP and TAP. The category with the smallest reductions was GWP for the end-of-life process, as was the case for manufacturing, construction, and maintenance processes. The other impact categories, FEP, HTP, MEP, and RDP, had at least 85% reductions for both MSEs with geotextile and geogrid.
3.2. Analysis of the Proposed Scenarios in Relation to Potential Environmental Impacts
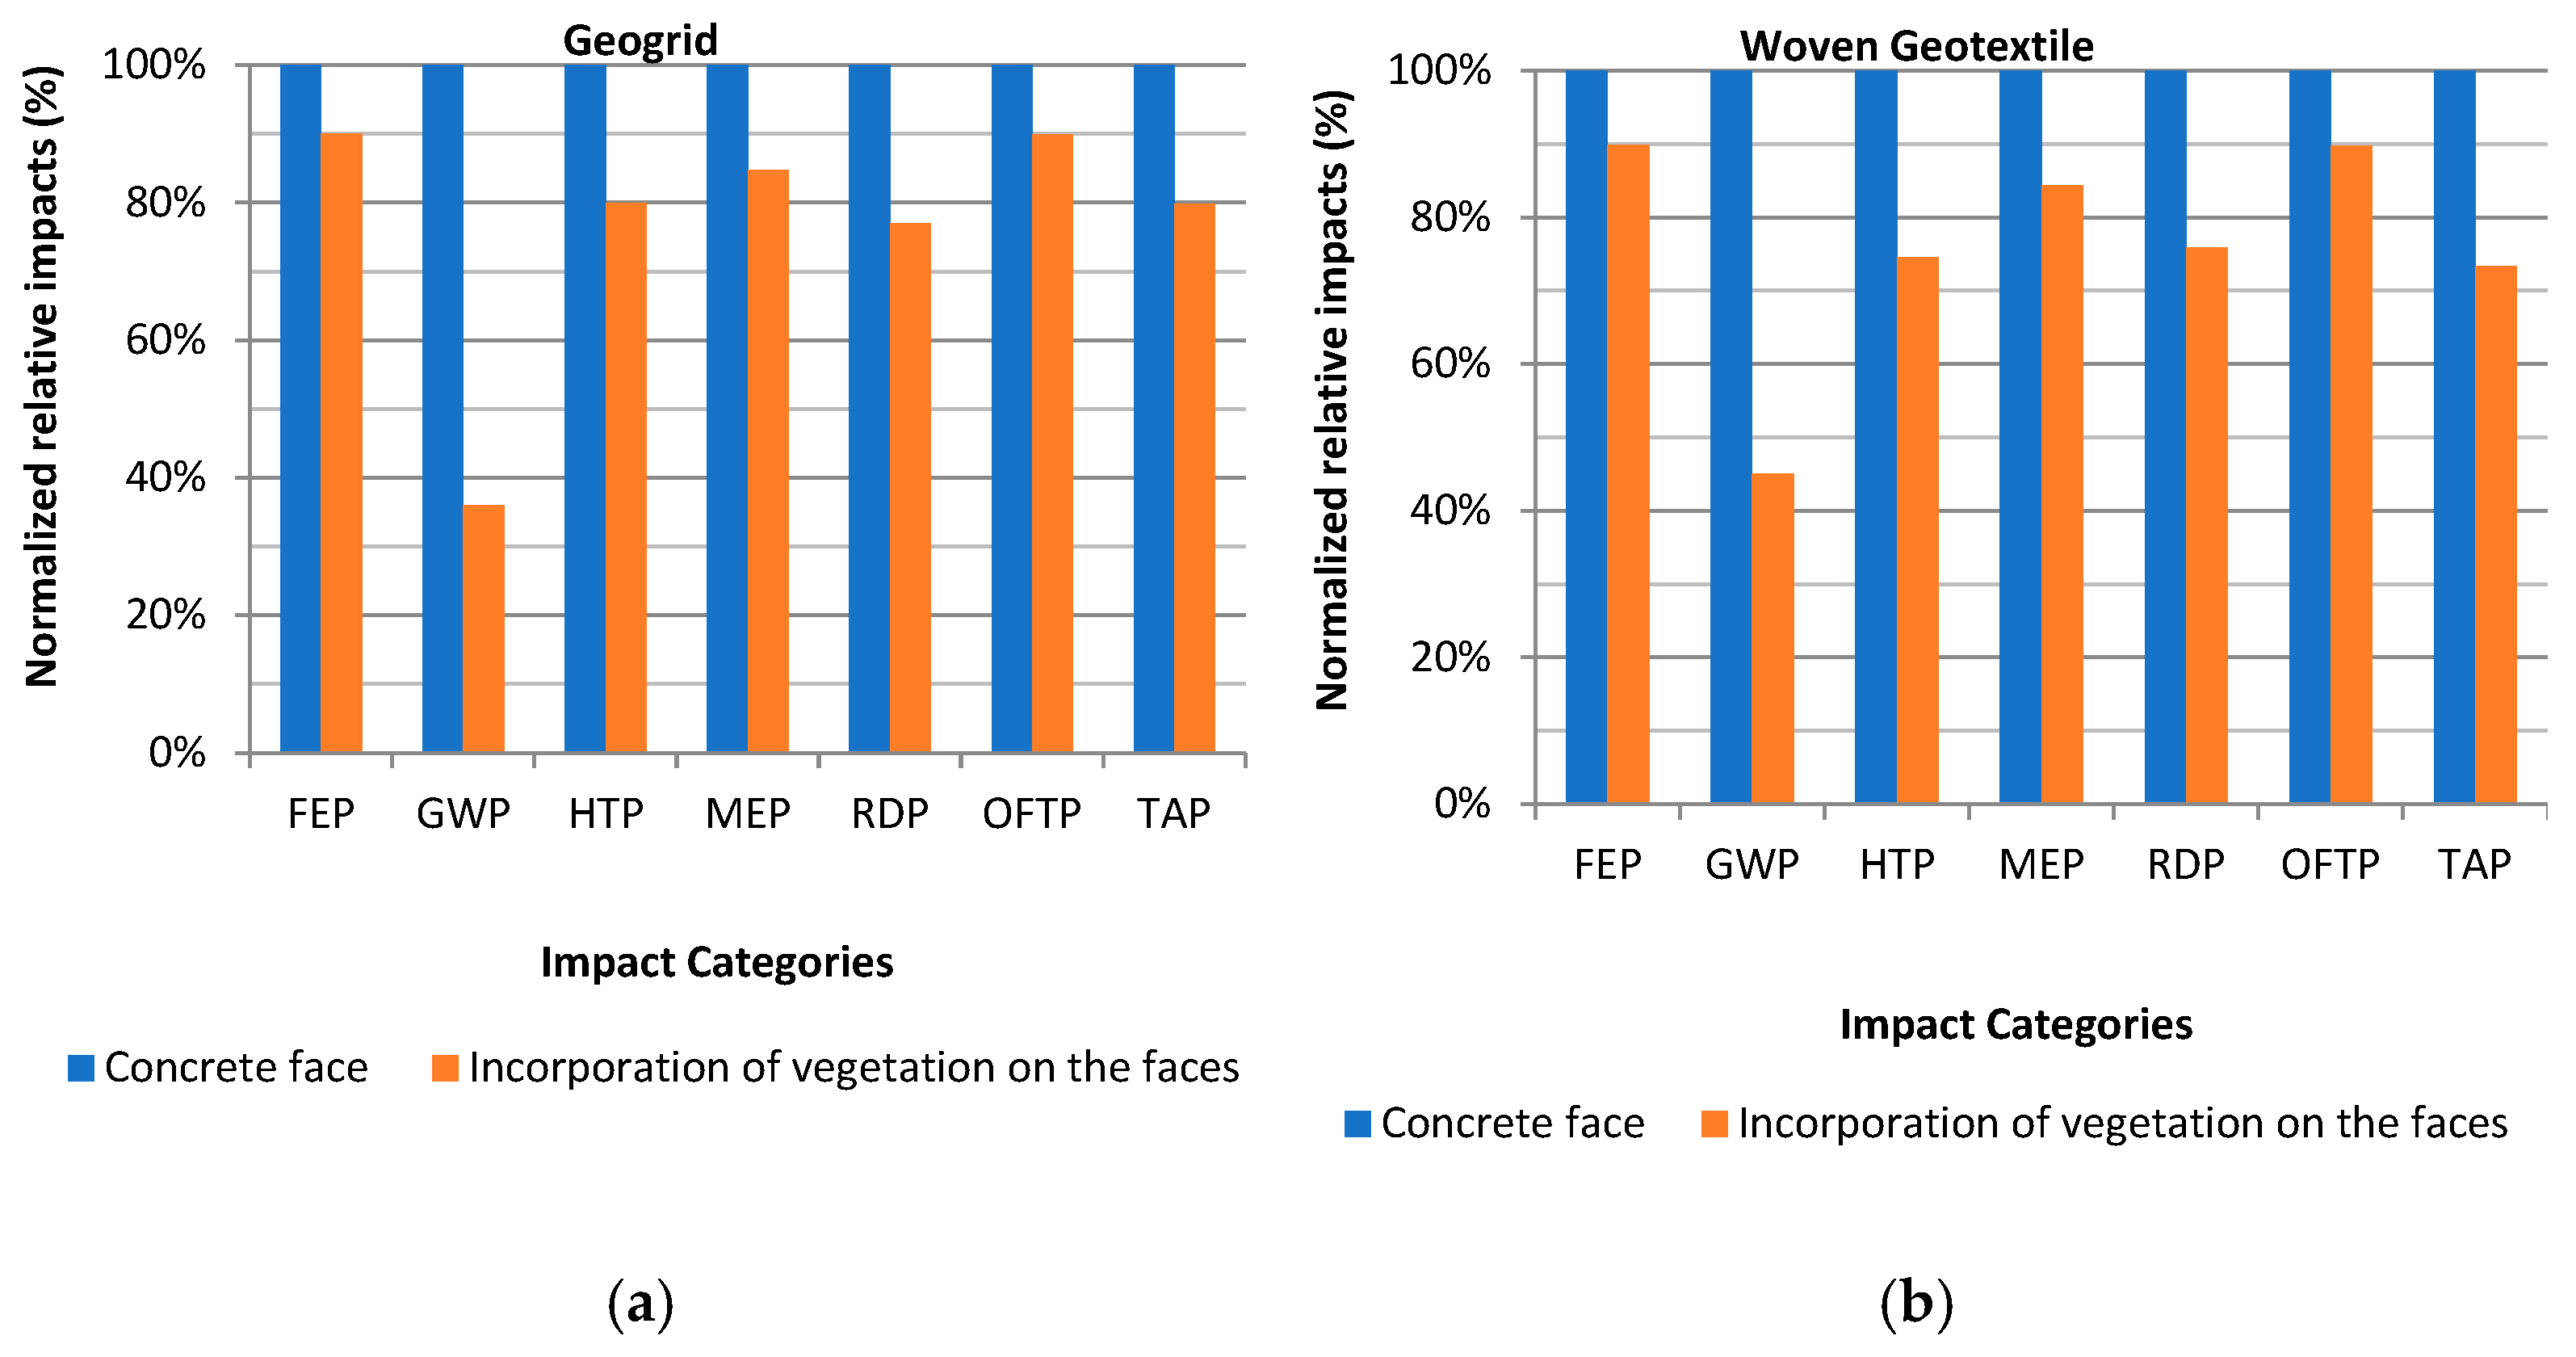
As outlined in the methodology section, analyses were conducted to assess the environmental advantages of incorporating vegetation on the face of MSEs utilizing geosynthetics. Consequently, scenario analyses were conducted on the MSEs, comparing scenarios with a concrete face (current study) to those with a vegetated face. These analyses examined the proposed scenarios in the execution, maintenance, and end-of-life stages.
Regarding the analysis of the proposed scenarios for the construction process (Figure 6), the relative results for both the geogrid-reinforced MSE (Figure 6a) and the geotextile-reinforced MSE (Figure 6b) indicated a trend when incorporating vegetation on the face compared to the concrete face. The impact category with the greatest reduction was Global Warming Potential (GWP), which decreased by approximately 60% in both the geogrid and woven geotextile MSEs. On the other hand, the categories in both MSEs that obtained the smallest decreases were the FEP and OFTP categories. The other categories had reductions between approximately 20% and 30% for MSEs with geogrid and woven geotextile.

Figure 6.
Analysis of scenario proposition of the construction process of the structures of: (a) geogrid; (b) woven geotextile.
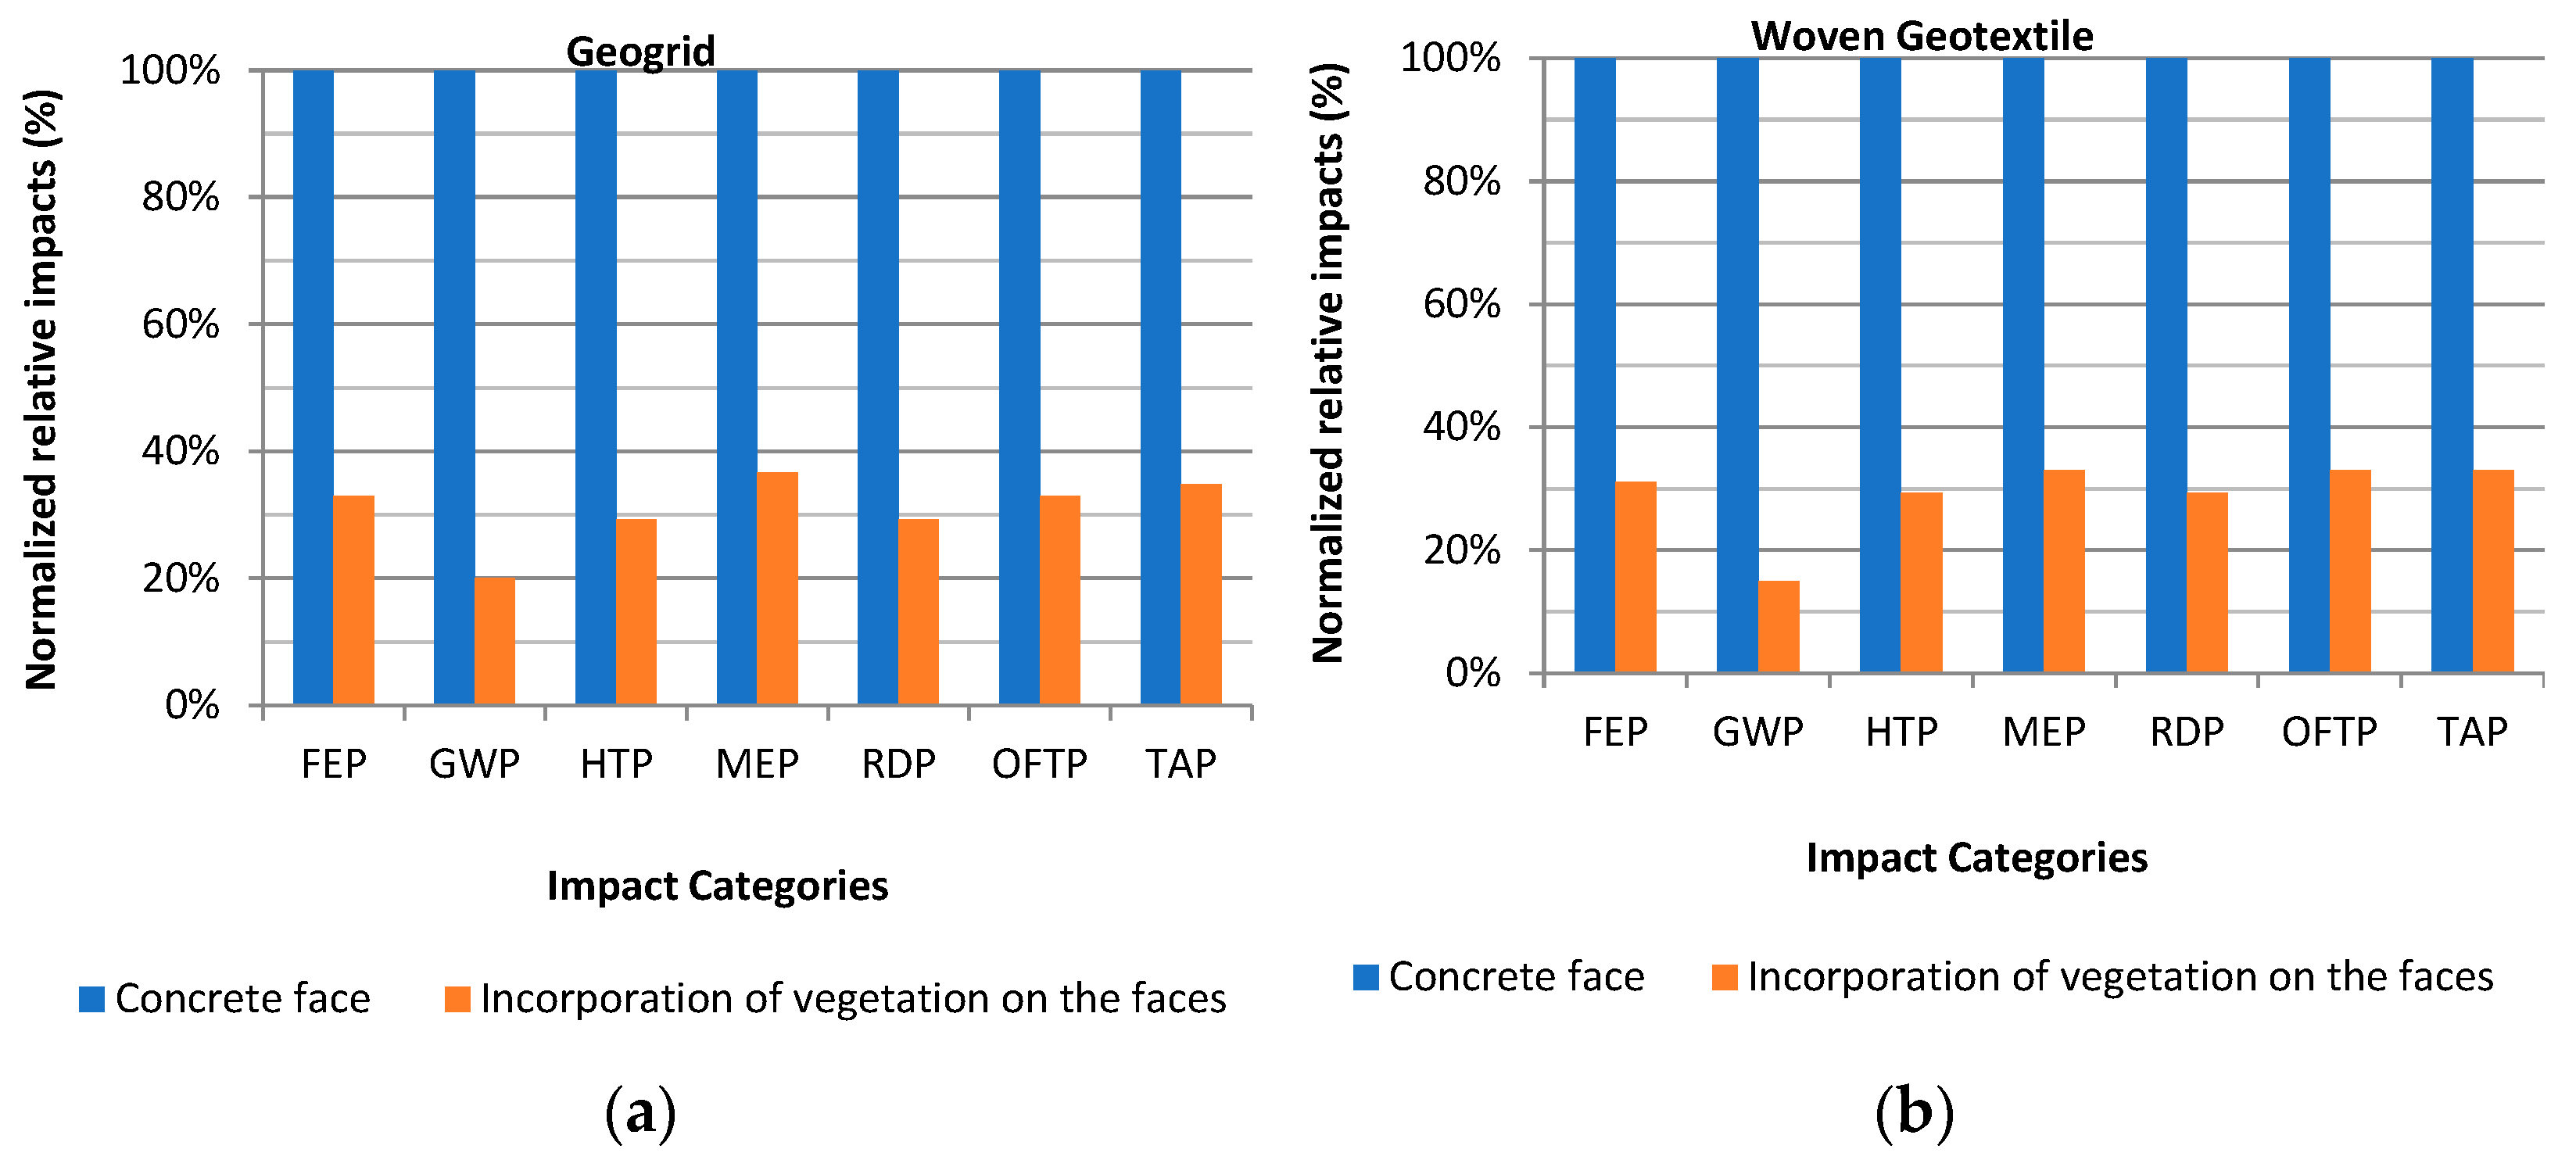
Moreover, in the scenario analyses referring to the maintenance process (Figure 7), similar to the construction process (Figure 6), both in the MSE with geogrid (Figure 7a) and MSE with woven geotextile (Figure 7b), the impact category with the most significant decrease was GWP. On the other hand, for the MSE with geogrid, the lowest decrease category was MEP, and for MSE with woven geotextile, there were several with similar results: FEP, MEP, OFTP, and TAP.
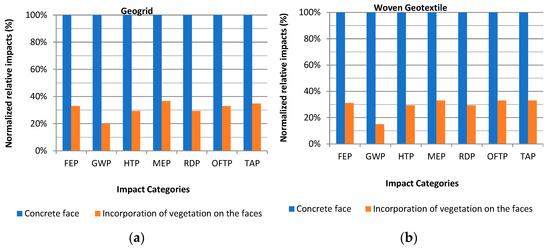
Figure 7.
Analysis of the proposed scenario of the maintenance process of the structures of: (a) geogrid; (b) woven geotextile.
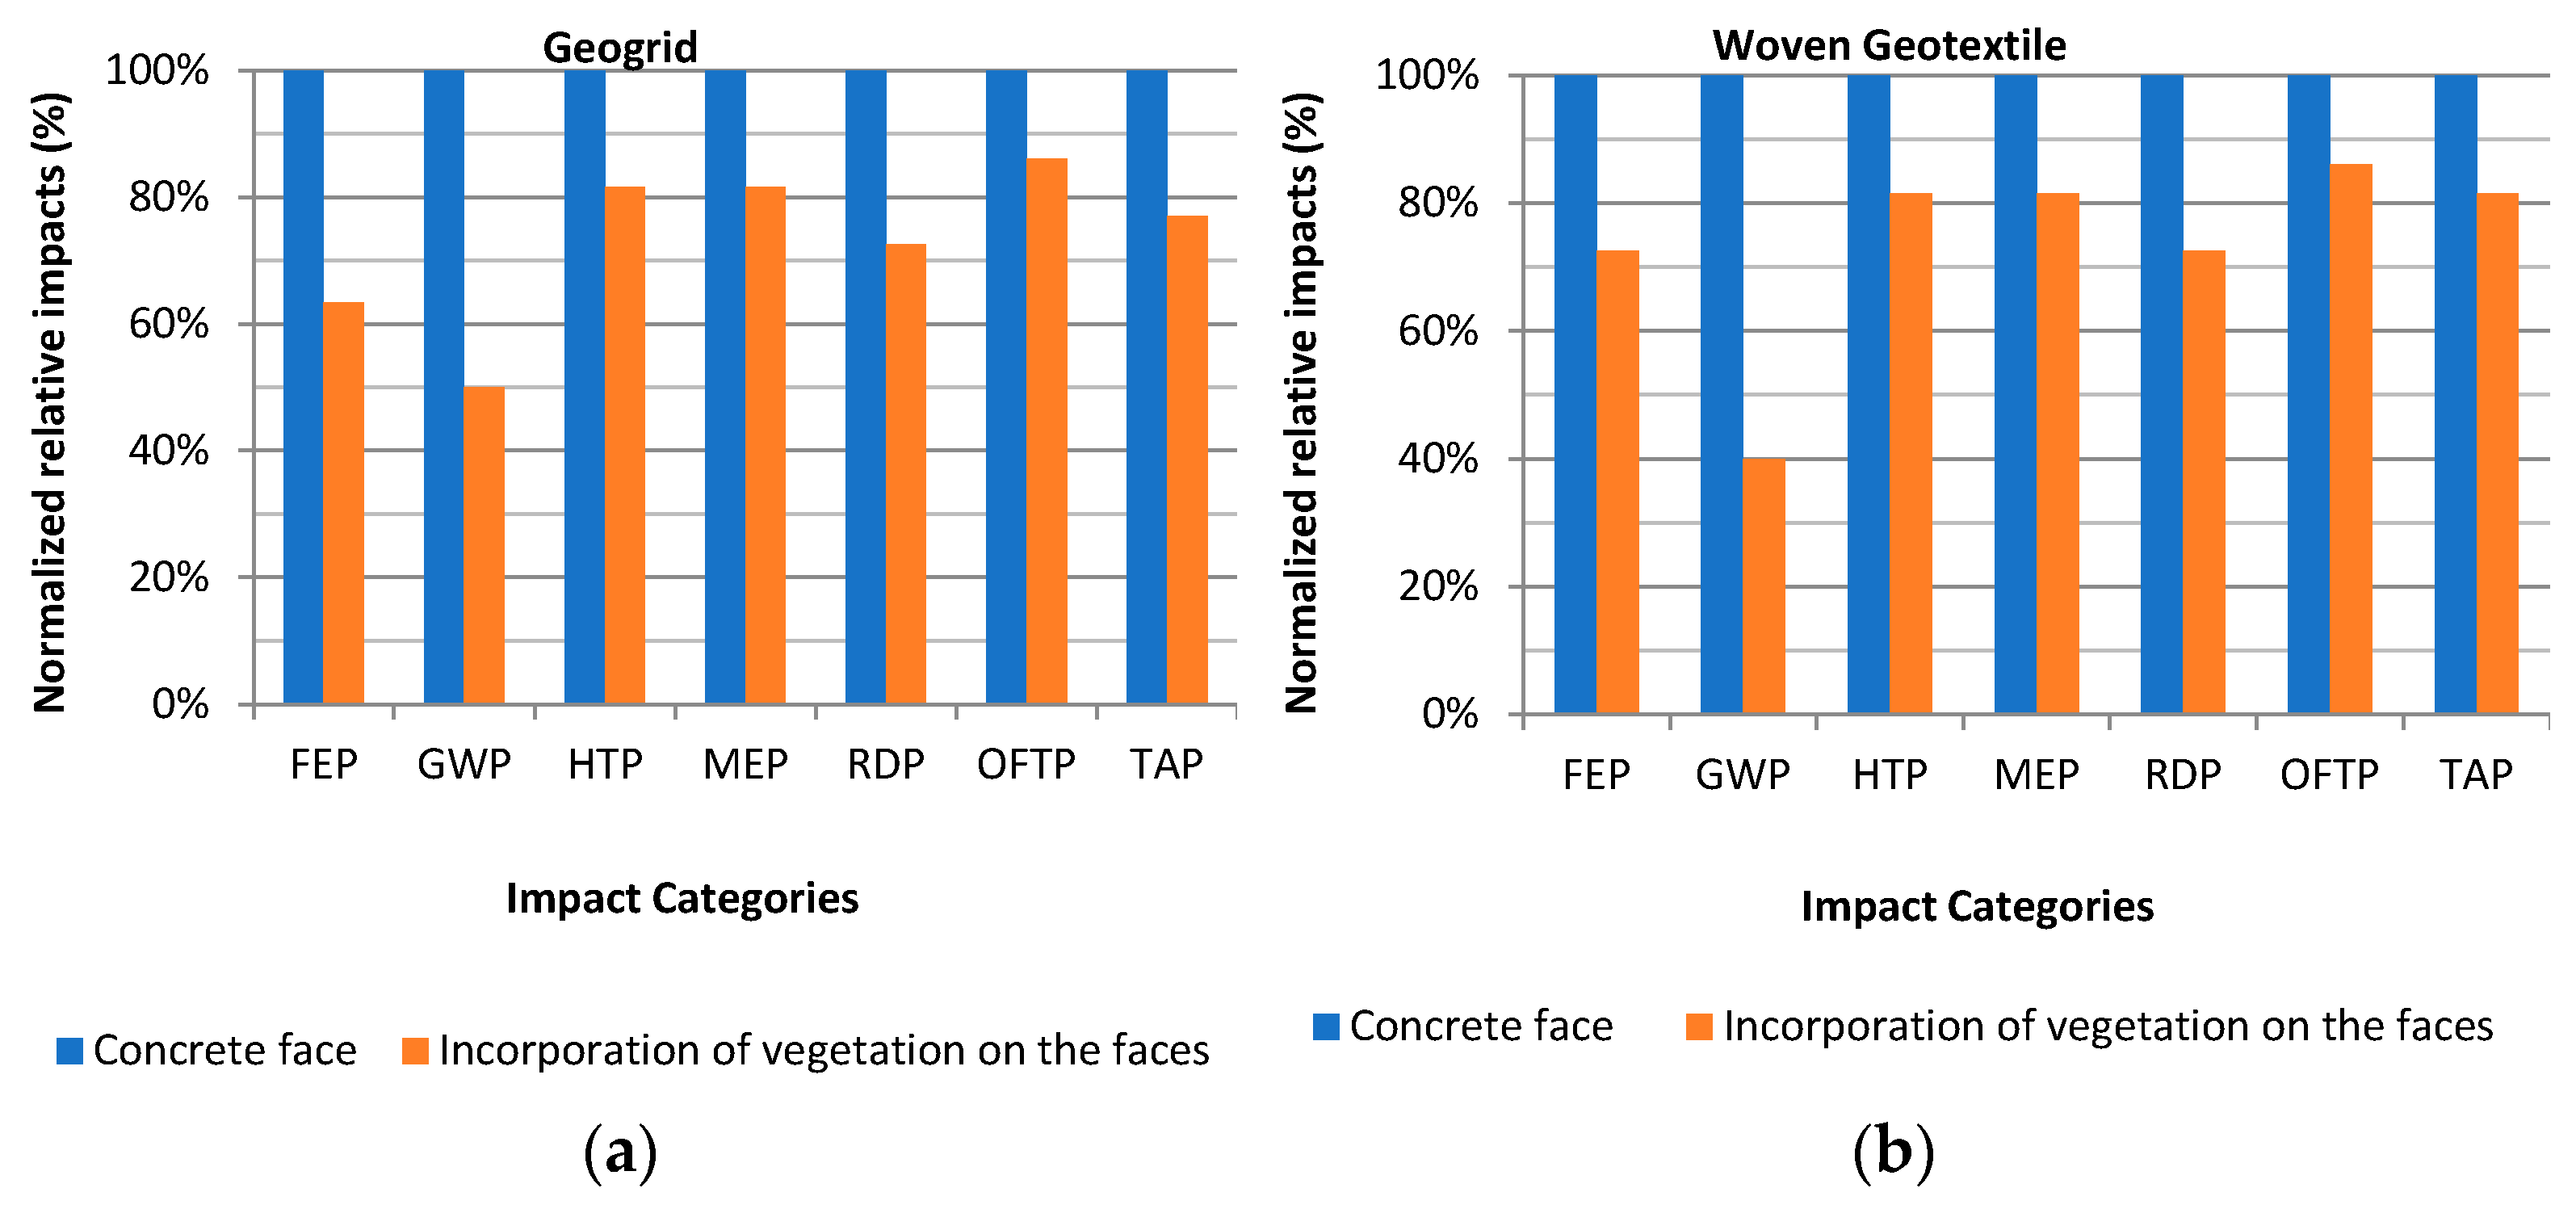
Finally, regarding the analysis of scenarios in the end-of-life process (Figure 8), a similar trend to the construction and maintenance processes was observed. The impact category that showed the most significant decrease was GWP (Figure 8a,b), which indicated a decrease of approximately 50% and 60% for MSE with geogrid and woven geotextile, respectively. On the other hand, when analyzing the category with the lowest relative decrease, the OFTP in both analyzed MSEs showed a decrease of more than 15%. When analyzing the other categories, the HTP, MEP, and TAP categories showed reductions of approximately 20% for both MSEs with geogrid and woven geotextile. However, the FEP category obtained at least 30% reductions for both MSEs.

Figure 8.
Analysis of scenario proposition of the end-of-life process of the structures of (a) geogrid and (b) woven geotextile.
3.3. Circularity Analysis with Different Recycling Rates
The results of the scenario analyses were proposed in which varying proportions of recycled materials—10%, 20%, 30%, 40%, and 50%—were replaced by virgin materials (Figure 9). The aim was to determine the response of the MCI to these increments while utilizing the MCI approach.
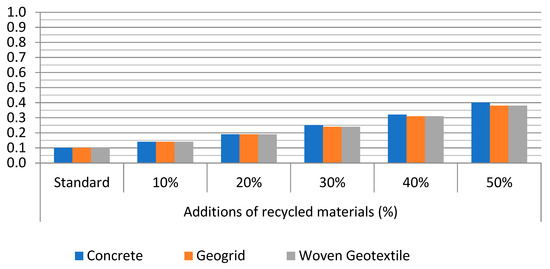
Figure 9.
Analysis of the increase in the recycling rate with MCI.
When the circularity of the structures was analyzed, without the addition of waste (recycled materials), it was observed that the results of the standard analyses showed that both the traditional ERW and the MSEs with geosynthetics yielded the same value of 0.1.
Posteriorly, it was observed that as the waste accretions occurred, the structures became more circular. The analysis of the residue additions showed that when 10% and 20% of the geosynthetics and concrete residues were added, the structures remained with the same MCI values. On the other hand, when the increments were between 30% and 50%, there was a small advantage of the traditional ERW compared to the MSEs with geosynthetics.
4. Discussion
Civil engineering, recognized for its profound implications for climate change, requires comprehensive environmental assessments to mitigate emissions and associated impacts. In this context, the application of an environmental assessment for this sector is of paramount importance. A comprehensive LCA on MSEs with geosynthetics versus traditional ERWs was conducted to assess their environmental impact using more pertinent midpoint categories.
In summary, the main activities of this study consisted of quantifying the environmental impacts of gravity MSE and ERW. The calculations were performed using the OpenLCA software, which allows for choosing the ReCiPe 2016 method and the desired impact categories, in addition to providing support for modeling the life cycle of the structures under analysis. The inventory data for MSE were obtained from local companies, while the traditional ERW data originated from the relevant technical literature. The analysis focused on seven midpoint impact categories. Additionally, analyses of the incorporation of vegetation as a replacement for concrete on the face of MSEs with geosynthetics were performed. In addition, analyses of the circularity of the geosynthetics and concrete were performed.
Our study’s values showed that construction was the most recurrent process, followed by manufacturing to analyze environmental impacts. Regarding the relative impacts, in all impact categories, MSEs with geosynthetics presented lower environmental impacts compared to ERWs with concrete. Regarding the results with the incorporation of vegetation on the face, the results indicated that the application of vegetation can reduce the potential in all categories analyzed. The present study’s results can infer that MSEs with geogrid and geotextile are more sustainable than traditional ERWs. In addition, the circularity analysis of the main constituents of the three structures showed that, as recycled materials were added to replace virgin materials, the MCI increased, showing advantages in the material recycling operation.
The research conducted by [71] provides additional support to the results found in the present study, strengthening the suggestion that MSEs may be more environmentally sustainable. The researchers observed that the construction of gravity ERWs requires large amounts of concrete, which emits a significant amount of CO2. In addition, according to the same authors, an MSE with a geogrid may emit less CO2 because it requires less concrete and more soil for its design.
Additionally, the study proposed by [72,73] reinforced the analyses observed in the present study, showing that MSEs can have less impact on the environment. The researchers conducted a comparative study with two MSEs, one with geogrid and the other with steel strips, comparing these two MSEs with a conventional ERW. The authors investigated the influence of different heights, and all indicators increased as the height of the structures increased. However, the results cannot be extrapolated, as they may not accurately represent the results of the local country.
In the study proposed by [74], the researchers carried out a comparative study between MSEs with steel strips or geogrids, compared with two different ERWs in concrete, in which the authors questioned whether MSEs are more environmentally sustainable when compared with traditional ERWs and the results suggested that MSEs cause fewer potential impacts. These data corroborate the present study that showed that MSEs with geosynthetics had lower environmental impacts in all categories of environmental impacts when compared with gravity ERWs in concrete. Despite the environmental benefits of MSEs, the same authors highlighted that some factors, such as soil types, design parameters, transportation distances, and properties of the reinforcement material, can influence the potential environmental impacts.
Regarding the circularity analysis, in the research carried out by [75], the authors analyzed the integration of the LCA methodology with the MCI with the objective of verifying the circularity of concrete. The results found a high circularity rate, mainly due to the use of recycled materials and the potential for the material to be recycled again in the future. The results complement those of the present research, which demonstrated that there was an increase in the circularity of materials, as there is an increase in recycled materials replacing virgin materials. Another study that corroborates the values found in the present study was carried out by [76], the researchers found that the use of recycled concrete aggregates can significantly reduce the environmental impact of concrete.
According to research conducted by [34], MSE employing geosynthetics demonstrated a reduction in energy demand of approximately 30%. Additionally, the associated CO2 emissions were approximately 18% lower than conventional ERWs employing vertical gravity systems. As the structural heights of MSE and ERWs were increased and alternative materials were applied to replace steel reinforcements, the energy demand for MSE with geosynthetics decreased by approximately 3.5 times. The CO2 emissions from MSE were approximately 5.4 times lower than those generated by the traditional construction methodology involving vertical gravity retaining walls.
The investigation by [77] examined the production methodology of two types of mechanically stabilized earth (MSE) inclusions, specifically steel tapes and geogrids, through the lens of total energy consumption. The researchers reported findings indicating a reduction of approximately 20% in energy demand for geogrids compared to steel tapes. Furthermore, the same researchers evaluated four impact categories, identifying Global Warming Potential (GWP) as the most significant. This assessment noted that MSE utilizing geogrids produces reduced emissions by up to 99% in contrast to MSE employing steel tapes. Although these findings surpass those presented in the current investigation, they underscore the ecological advantages associated with using geosynthetics.
In addition to the results, the investigation conducted by [36] demonstrated that MSEs with geosynthetics exhibit remarkable efficiency regarding their environmental ramifications. Furthermore, the researchers emphasized that replacing the MSE reinforcements with more sustainable or recyclable materials would further increase the ecological sustainability of MSE wall solutions.
According to the results of [29], for Cantilever Walls, concrete emerges as the predominant factor (56.7%) in the evaluation of environmental impacts, subsequently followed by reinforcing steel (37.4%). In the scenario of MSE, reinforcing steel constituted the primary contributor (63.2%), trailed by granular backfill material (21.1%), wherein steel strips were employed as reinforcement in this MSE context. A comparative analysis between traditional Earth-Retaining Walls (ERWs) and MSE reveals that, across all assessed impact categories, cantilever walls inflicted a greater degree of detriment to both the environment and human health than MSE.
The research by [36], in contrast to previous research, suggests that gravity ERWs may be more environmentally effective. However, gravity ERWs may have less impact on the environment than ERWs, which employs steel as a structural component in its design. The result demonstrates the importance of attention to the use of steel when the study is related only to environmental impacts.
Additionally, the investigation conducted by [27] illustrates that steel significantly affects the climate change impact category, and that the significance of steel within each impact category is twice as pronounced for the taller ERWs. Consequently, when endeavoring to minimize steel usage, it is imperative to adjust the quantity of steel in a design as the wall dimensions expand, ensuring that the modifications are of greater relevance.
In accordance with the above, the results of our study indicate that MSEs can be more environmentally sustainable. However, it is important to emphasize that this study is limited to only three types of structure, in addition to being able to more effectively portray the reality of the country where this study was applied. Additionally, there are a limited number of companies that manufacture geosynthetics and companies that perform MSEs with geosynthetics. In this sense, the results of our research cannot be generalized. Likewise, although the study by [72,73] involved a series of MSEs and ERWs with different heights, they cannot be extrapolated, as they may be specific to the location where the study was applied. After all, other factors can influence the results, such as soil type, type of reinforcement for MSE, design parameters, transportation distance, energy matrix, and material transportation mode, which was highlighted by [74], the researchers, despite mentioning these other factors, did not analyze all these parameters in depth. Therefore, caution is needed when extrapolating the results to other locations.
The limitations described open new gaps that need to be investigated in future studies. In this context, an important question is the investigation of the various factors that may influence the potential impacts of MSEs when compared with conventional ERW, as well as how to expand these results to other locations. The present study and other studies [32,33,34,35,71,72,73,74] have focused on quantitative and qualitative analyses of the potential impacts, mainly in European and North American countries. However, further research and reflections on expanding the results to other locations are needed.
Therefore, understanding the underlying factors that may influence the mitigation of potential impacts of MSEs could provide valuable insights for reducing emissions from both MSEs and ERWs. Furthermore, exploring effective recycling and recovery strategies for geosynthetics in combination with LCA studies of MSEs could be promising areas for future research.
This research confirms the hypothesis that MSEs with geosynthetics are more environmentally sustainable than gravity ERWs. Despite the different magnitudes of potential environmental impacts, as highlighted in previous studies, all studies corroborate the same hypothesis. However, when comparing a gravity ERW and a cantilever ERW in reinforced concrete, the gravity ERW may cause fewer potential impacts despite the high demand for concrete. In comparison, the cantilever ERW causes more potential impacts due to the steel required for the stability of the structure.
Recycling concrete and geosynthetics has the potential to significantly reduce environmental impacts, thus extending the useful life of these materials. This consideration is crucial during the structure’s end-of-life phase and presents benefits that may make it a better procedure than simply demolishing and disposing of it in a landfill.
Concrete has the highest emissions, and in addition to recycling procedures, ways of changing the dosage of materials, especially cement, can also be considered, thus reducing emissions. In contrast to gravity ERWs, the contributions of MSEs can be greatly influenced by machines, as they use diesel mainly for compacting layers and backfilling.
5. Conclusions
The LCA methodology used in our study allowed a quantitative and qualitative analysis of the environmental impacts of the different retaining wall solutions. Thus, this study demonstrated that the construction of MSE with geosynthetics required significantly less concrete and more soil than the construction of a concrete ERW. This highlights the environmental benefit derived from prioritizing soil as the primary component over concrete. Furthermore, the circularity analysis demonstrated the importance of replacing virgin materials with recycled materials.
Through the Life Cycle Assessment analyses together with the circularity analysis, it was possible to observe the following:
- Among the four processes, the one that contributed the most was the construction process, followed by the manufacturing process, both in ERWs and in the two MSEs with geosynthetics.
- When comparing traditional ERWs with MSEs with geosynthetics, there were significant decreases in all categories. Except for the GWP category, which decreased between 50% and 85%, the FEP, HTP, MEP, RDP, OFTP, and TAP categories registered at least 80% losses in the four processes for the four processes.
- The incorporation of vegetation to replace concrete on the face of the two MSEs with geosynthetics showed decreases in all impact categories, with the GWP category standing out, which had a loss of at least 50%. The FEP, HTP, MEP, RDP, OFTP, and TAP categories had losses of 10% to 70%. The maintenance process experienced the most significant decrease.
- The MCI analysis showed an increase of 250% for two MSEs with geosynthetics and 300% for ERWs with concrete.
Regarding qualitative assessments, several chemical agents can be released into the air due to the manufacturing and execution process, mainly of cement and concrete, and to a much lesser extent of geosynthetics. For example, carbon dioxide, sulfur dioxide, and nitrous oxides can be emitted into the atmosphere during manufacturing and execution processes, especially in ERW concrete. The same emissions can occur in the maintenance and finishing process; however, they can occur on a smaller scale.
Therefore, this study concluded that the design of alternative structures, such as MSEs with geosynthetics, can mitigate the potential environmental impacts of the construction sector, which is one of the sectors that consumes the most natural resources and causes large emissions of polluting gasses. In addition, this present study may help managers and builders of locations with characteristics similar to those where this study was applied, especially in the geotechnical area, to opt for more environmentally sustainable structures.
Author Contributions
The authors contributed to this research by carrying out the following activities: conceptualization, methodology, formal analysis, preparation of the original draft, investigation and data curation, writing—review and editing carried out by L.P.V.d.A.J.; supervision, methodology, conceptualization, writing—review and editing carried out by C.B.; validation, formal analysis, writing—review and editing carried out by J.L.d.S. All authors have read and agreed to the published version of the manuscript.
Funding
This research received no external funding.
Institutional Review Board Statement
Not applicable.
Informed Consent Statement
Not applicable.
Data Availability Statement
The original contributions presented in this study are included in the article. Further inquiries can be directed to the corresponding author.
Acknowledgments
The authors would like to thank the Federal University of São Carlos and the Postgraduate Program in Civil Engineering.
Conflicts of Interest
The authors declare no conflicts of interest.
References
- IEA. Global Status Report for Buildings and Construction 2019; IEA: Paris, France, 2019; Available online: https://www.iea.org/reports/global-status-report-for-buildings-and-construction-2019 (accessed on 5 December 2023).
- Chen, C.X.; Pierobon, F.; Jones, S.; Maples, I.; Gong, Y.; Ganguly, I. Comparative Life Cycle Assessment of Mass Timber and Concrete Residential Buildings: A Case Study in China. Sustainability 2022, 14, 144. [Google Scholar] [CrossRef]
- Reis, D. Material Flow and Resource Efficiencyin the Construction Industry. Ph.D. Thesis, Polytechnic School of the University of São Paulo, Department of Building and Construction Engineering, São Paulo, Brazil, 2020. (In Portuguese). [Google Scholar]
- Bento, R.R. Analysis of the Environmental Performance of Reinforced Concrete Structures: Use of Life Cycle Assessment (LCA) in the Design Decision-Making Process. Ph.D. Thesis, University of São Paulo, Graduate Program in Architecture and Urbanism, São Paulo, Brazil, 2016. (In Portuguese). [Google Scholar]
- Santos, M.G.C.; Silva, J.L.; Beck, A.T. Reliability-based design optimization of geosynthetic-reinforced soil walls. Geosynth. Int. 2018, 25, 442–455. [Google Scholar] [CrossRef]
- Pant, A.; Ramana, G.V.; Datta, M.; Gupta, S.K. Coal combustion residue as structural fill material for reinforced soil structures. J. Clean. Prod. 2019, 232, 417–426. [Google Scholar]
- Koerner, J.; Soong, T.-Y.; Koerner, R.M. Retaining Wall Costs in the USA; GRI Report No. 20; Geosynthetic Institute: Folsom, PA, USA, 1998; p. 38. [Google Scholar]
- Dąbrowska, J.; Kiersnowska, A.; Zięba, Z.; Trach, Y. Sustainability of Geosynthetics-Based Solutions. Environments 2023, 10, 64. [Google Scholar] [CrossRef]
- Palmeira, E.; Araújo, G.; Santos, E. Sustainable Solutions with Geosynthetics and Alternative Construction Materials—A Review. Sustainability 2021, 13, 12756. [Google Scholar] [CrossRef]
- ISO 14040:2006a; Environmental Management—Life Cycle Assessment—Principles and Framework. International Organization for Standardization (ISO): Geneva, Switzerland, 2006. Available online: https://www.iso.org/standard/37456.html (accessed on 10 January 2024).
- ISO 14044:2006b; Environmental Management—Life Cycle Assessment—Requirements and Guidelines. International Organization for Standardization (ISO): Geneva, Switzerland, 2006. Available online: https://www.iso.org/standard/38498.html (accessed on 12 January 2024).
- Strauss, A.; Frangopol, D.; Bergmeister, K. (Eds.) Life-Cycle and Sustainability of Civil Infrastructure Systems, Proceedings of the Third International Symposium on Life-Cycle Civil Engineering (IALCCE’12), Vienna, Austria, 3–6 October 2012, 1st ed.; CRC Press: Boca Raton, FL, USA, 2012. [Google Scholar] [CrossRef]
- Dixon, N.; Fowmes, G.; Frost, M. Global challenges, geosynthetic solutions and counting carbon. Geosynth. Int. 2017, 24, 451–464. [Google Scholar] [CrossRef]
- Bizjak, K.F.; Lenart, S. Life cycle assessment of a geosynthetic-reinforced soil bridge system—A case study. Geotext. Geomembr. 2018, 46, 543–558. [Google Scholar] [CrossRef]
- Valentin, C.A.; Silva, J.L.; Kobelnik, M.; Ribeiro, C.A. Thermoanalytical and dynamic mechanical analysis of commercial geomembranes used for fluid retention of leaching in sanitary landfills. J. Therm. Anal. Calorim. 2019, 136, 471–481. [Google Scholar] [CrossRef]
- Domiciano, M.L.; Santos, E.C.G.; da Silva, J.L. Geogrid mechanical damage caused by Recycled Construction and Demolition Waste (RCDW): Influence of grain size distribution. Soils Rocks 2020, 43, 231–246. [Google Scholar] [CrossRef]
- Sadat, M.R.; Huang, J.; Bin-Shafique, S.; Rezaeimalek, S. Study of the behavior of mechanically stabilized earth (MSE) walls subjected to differential settlements. Geotext. Geomembr. 2018, 46, 77–90. [Google Scholar] [CrossRef]
- Pedroso, G.O.M.; Ramos, G.; Da Silva, J.L. Evaluating geosynthetic base stabilization on lateritic gravel and granular material under cyclic moving wheel loads. Case Stud. Constr. Mater. 2022, 16, e00880. [Google Scholar] [CrossRef]
- Satyal, S.R.; Leshchinsky, B.; Han, J.; Neupane, M. Use of cellular confinement for improved railway performance on soft subgrades. Geotext. Geomembr. 2018, 46, 190–205. [Google Scholar] [CrossRef]
- Lee, H.; Calvin, K.; Dasgupta, D.; Krinner, G.; Mukherji, A.; Thorne, P.W.; Trisos, C.H.; Romero, J.; Aldunce, P.; Barrett, K.; et al. Climate Change 2023: Synthesis Report. Contribution of Working Groups I, II and III to the Sixth Assessment Report of the Intergovernmental Panel on Climate Change; Lee, H., Romero, J., Eds.; IPCC: Geneva, Switzerland, 2023. [Google Scholar]
- UNOPS; UNEP; University of Oxford. Infrastructure for Climate Action; University of Oxford: Oxford, UK, 2021. [Google Scholar]
- Bilgili, L.; Kuzu, S.L.; Çetinkaya, A.Y.; Kumar, P. Evaluation of railway versus highway emissions using LCA approach between the two cities of Middle Anatolia. Sustain. Cities Soc. 2019, 49, 101635. [Google Scholar] [CrossRef]
- Yepes, V.; Martí, J.V.; García-Segura, T. Cost and CO2 emission optimization of precast–prestressed concrete U-beam road bridges by a hybrid glowworm swarm algorithm. Autom. Constr. 2015, 49, 123–134. [Google Scholar] [CrossRef]
- Tait, M.W.; Cheung, W.M. A comparative cradle-to-gate life cycle assessment of three concrete mix designs. Int. J. Life Cycle Assess. 2016, 21, 847–860. [Google Scholar] [CrossRef]
- Balasbaneh, A.T.; Yeoh, D.; Juki, M.I.; Ibrahim, M.H.W.; Abidin, A.R.Z. Assessing the life cycle study of alternative earth-retaining walls from an environmental and economic viewpoint. Environ. Sci. Pollut. Res. 2021, 28, 37387–37399. [Google Scholar] [CrossRef]
- Villalba, P.; Alcalá, J.; Yepes, V.; González-Vidosa, F. CO2 optimization of reinforced concrete cantilever retaining walls. In Proceedings of the 2nd International Conference on Engineering Optimization, Lisboa, Portugal, 6–9 September 2010. [Google Scholar]
- Zastrow, P.; Molina-Moreno, F.; García-Segura, T.; Martí, J.V.; Yepes, V. Life cycle assessment of cost-optimized buttress earth-retaining walls: A parametric study. J. Clean. Prod. 2017, 140, 1037–1048. [Google Scholar] [CrossRef]
- Molina-Moreno, F.; García-Segura, T.; Martí, J.V.; Yepes, V. Optimization of buttressed earth-retaining walls using hybrid harmony search algorithms. Eng. Struct. 2017, 134, 205–216. [Google Scholar] [CrossRef]
- Giri, R.K.; Reddy, K.R. Sustainability assessment of two alternate earth-retaining structures. Geotechnics 2015, 256, 2836–2845. [Google Scholar] [CrossRef]
- Hischier, R.; Weidema, B.; Althaus, H.; Bauer, C.; Doka, G.; Dones, R.; Frischknecht, R.; Hellweg, S.; Humbert, S.; Jungbluth, N.; et al. Implementation of Life Cycle Impact Assessment Methods. Am. Midl. Nat. 2010, 2, 1–151. [Google Scholar]
- Balasbaneh, A.T.; Bin Marsono, A.K. Applying multi-criteria decision-making on alternatives for earth-retaining walls: LCA, LCC, and S-LCA. Int. J. Life Cycle Assess. 2020, 25, 2140–2153. [Google Scholar] [CrossRef]
- Pons, J.J.; Penadés-Plà, V.; Yepes, V.; Martí, J.V. Life cycle assessment of earth-retaining walls: An environmental comparison. J. Clean. Prod. 2018, 192, 411–420. [Google Scholar] [CrossRef]
- Jones, C.J.F.P. Guide to Reinforced Fill Structure and Slope Design (Geoguide 6); Geotechnical Engineering Office, Civil Engineering Department: Hong Kong, China, 2002.
- Heerten, G. Reduction of climate-damaging gases in geotechnical engineering practice using geosynthetics. Geotext. Geomembr. 2012, 30, 43–49. [Google Scholar] [CrossRef]
- Stucki, M.; Büsser, S.; Itten, R.; Frischknecht, R.; Wallbaum, H. Comparative Life Cycle Assessment of Geosynthetics versus Conventional Construction Materials. ESU Services Ltd. Commissioned by European Association for Geosynthetic Manufacturers (EAGM), Usterand Zürich, CH. 2012. Available online: http://esu-services.ch/fileadmin/download/fraser-2012-paper-4-EUROGEO-5-EAGM-LCA-Study-Case-4.pdf (accessed on 10 February 2024).
- Rafalko, S.D.; Sankey, J.E.; Freitag, N. Sustainability Measures for MSE Walls and Baseline Environmental Impact Evaluations. In Proceedings of the Earth Retention Conference 3, Washington, DC, USA, 1–4 August 2010. [Google Scholar] [CrossRef]
- Tazi, N.; Idir, R.; Ben Fraj, A. Towards achieving circularity in residential building materials: Potential stock, locks and opportunities. J. Clean. Prod. 2021, 281, 124489. [Google Scholar] [CrossRef]
- Murray, A.; Skene, K.; Haynes, K. An Interdisciplinary Exploration of the Concept and Application in a Global Context. Journal of Business Ethics. J. Bus. Ethics 2017, 140, 369–380. [Google Scholar] [CrossRef]
- Geissdoerfer, M.; Savaget, P.; Bocken, N.M.P.; Hultink, E.J. The Circular Economy—A new sustainability paradigm? J. Clean. Prod. 2017, 143, 757–768. [Google Scholar] [CrossRef]
- Brändström, J.; Saidani, M. Comparison between circularity metrics and LCA: A case study on circular economy strategies. J. Clean. Prod. 2022, 371, 133537. [Google Scholar] [CrossRef]
- Glogic, E.; Sonnemann, G.; Young, S. Environmental Trade-Offs of Down cycling in Circular Economy: Combining Life Cycle Assessment and Material Circularity Indicator to Inform Circularity Strategies for Alkaline Batteries. Sustainability 2021, 13, 1040. [Google Scholar] [CrossRef]
- Lam, W.; Claes, S.; Ritzen, M. Exploring the Missing Link between Life Cycle Assessment and Circularity Assessment in the Built Environment. Buildings 2022, 12, 2152. [Google Scholar] [CrossRef]
- Miyata, Y. Geosynthetic MSE walls research and practice: Past, present, and future (2023 IGS Bathurst Lecture). Geosynth. Int. 2025, 32, 62–81. [Google Scholar] [CrossRef]
- Pan, N. Research Progress on Green Building Materials in Civil Engineering. Sci. Technol. Eng. Chem. Environ. Prot. 2024, 1, 10. [Google Scholar] [CrossRef]
- Deus, R.M.; Battistelle, R.A.G.; Silva, G.H.R. Solid waste in Brazil: Context, gaps and trends. Eng. Sanit. E Ambient. 2015, 20, 685–698. [Google Scholar] [CrossRef]
- Rigamonti, L.; Mancini, E. Life cycle assessment and circularity indicators. Int. J. Life Cycle Assess. 2021, 26, 1937–1942. [Google Scholar] [CrossRef]
- Gerscovich, D.M.S. Slope Stability, 1st ed.; Oficina de Texto: São Paulo, Brazil, 2012; Volume 1, p. 158. (In Portuguese) [Google Scholar]
- Cavalcanti, T.M.D.; Oliveira, J.C.A.N.; De Paula Ribeiro, M.I. Slope Stabilization Through the Use of Retaining Walls. Rev. Tecnológica Univ. Santa Úrsula 2021, 4, 45–62. (In Portuguese) [Google Scholar]
- Oliveira, L.A.; Viana, P.M.F.; Santos, D.C.R.; Reis, E.F. Uso de geossintéticos como reforço em estradas não pavimentadas. Eng. Agricola 2016, 36, 546–557. [Google Scholar] [CrossRef]
- Franco, Y.B.; Utili, S.; Lins Da Silva, J. Design of reinforced cohesive soil walls accounting for wall facing contribution to stability. Geotechnique 2023, 73, 667–688. [Google Scholar] [CrossRef]
- Larsen, V.G.; Tollin, N.; Sattrup, P.A.; Birkved, M.; Holmboe, T. What are the challenges in assessing circular economy for the built environment? A literature review on integrating LCA, LCC and S-LCA in life cycle sustainability assessment, LCSA. J. Build. Eng. 2022, 50, 104203. [Google Scholar]
- NBR 6118; Design of Concrete Structures—Procedure. ABNT—Brazilian Association of Technical Standards: Rio de Janeiro, Brazil, 2014. (In Portuguese)
- Llatas, C.; Soust-Verdaguer, B.; Passer, A. Implementing Life Cycle Sustainability Assessment during design stages in Building Information Modelling: From systematic literature review to a methodological approach. Build. Environ. 2020, 182, 107164. [Google Scholar] [CrossRef]
- Mesa, J.; Fúquene-Retamoso, C.; Maury-Ramírez, A. Life Cycle Assessment on Construction and Demolition Waste: A Systematic Literature Review. Sustainability 2021, 13, 7676. [Google Scholar] [CrossRef]
- Silva, F.; Reis, D.; Mack-Vergara, Y.; Pessoto, L.; Feng, H.; Pacca, S.; Lasvaux, S.; Habert, G.; John, V. Primary data priorities for the life cycle inventory of construction products: Focus on foreground processes. Int. J. Life Cycle Assess. 2020, 25, 980–997. [Google Scholar] [CrossRef]
- Raja, J.; Dixon, N.; Fowmes, G.; Frost, M.; Assinder, P. Comparison of carbon dioxide emissions for two landfill capping layers. Proc. ICE—Eng. Sustain. 2014, 167, 197–207. [Google Scholar] [CrossRef]
- Ministry of Mines and Energy (MME). Balance Energy National 2023. Brasilia: MME. Available online: https://www.epe.gov.br/pt/publicacoes-dados-abertos/publicacoes/balanco-energetico-nacional-2023 (accessed on 20 February 2024).
- NBR 9452; Inspection of Bridges, Viaducts and Concrete Walk ways—Procedure. ABNT—Brazilian Association of Technical Standards: Rio de Janeiro, Brazil, 2023. (In Portuguese)
- Santos, D.V. Technical and Financial Analysis of Construction Waste Recycling: A Case Study. Master’s Thesis, University in Fortaleza, Fortaleza, Brazil, 2018. (In Portuguese). [Google Scholar]
- Honic, M.; Kovacic, I.; Aschenbrenner, P.; Ragossnig, A. Material Passports for the end-of-life stage of buildings: Challenges and potentials. J. Clean. Prod. 2021, 319, 128702. [Google Scholar] [CrossRef]
- Bizjak, K.F.; Knez, F.; Lenart, S.; Slanc, K. Life-cycle assessment and repair of the railway transition zones of an existing bridge using geocomposite materials. Struct. Infrastruct. Eng. 2016, 13, 331–344. [Google Scholar] [CrossRef]
- Pilz, T.; Maceno, M. Life Cycle Assessment and Civil Construction: A Review of the Literature on the Evaluation of Single-Family Houses. JCEC 2020, 6, 0049–0055. [Google Scholar] [CrossRef]
- Kaewunruen, S.; Martin, V. Life Cycle Assessment of Railway Ground-Borne Noise and Vibration Mitigation Methods Using Geosynthetics, Metamaterials and Ground Improvement. Sustainability 2018, 10, 3753. [Google Scholar] [CrossRef]
- Huijbregts, M.; Steinmann, Z.; Elshout, P.; Stam, G.; Verones, F.; Vieira, M.; Zijp, M.; Hollander, A.; Zelm, R. Correction to: ReCiPe2016: A harmonised life cycle impact assessment method at midpoint and endpoint level. Int. J. Life Cycle Assess. 2020, 25, 1635. [Google Scholar] [CrossRef]
- Sleeswijk, A.W.; Van Oers, L.F.; Guinée, J.B.; Struijs, J.; Huijbregts, M.A. Normalization in product life cycle assessment: An LCA of the global and European economic systems in the year 2000. Sci. Total Environ. 2008, 390, 227–240. [Google Scholar]
- Aymard, V.; Botta-Genoulaz, V. Normalisation in life-cycle assessment: Consequences of new European factors on decision-making. Supply Chain. Forum Int. J. 2017, 18, 76–83. [Google Scholar] [CrossRef]
- Hélias, A.; Esnouf, A.; Finkbeiner, M. Consistent normalization approach for Life Cycle Assessment based on inventory databases. Sci. Total Environ. 2019, 703, 134583. [Google Scholar] [CrossRef]
- Huddlestone, L.; Turner, J.; Eborall, H.; Hudson, N.; Davies, M.; Martin, G. Application of normalisation process theory in understanding implementation processes in primary care settings in the UK: A systematic review. BMC Fam. Pract. 2020, 21, 52. [Google Scholar] [CrossRef]
- Ellen Macarthur Foundation. Circularity Indicators—An Approach to Measuring Circularity—Methodology. 2019. Available online: https://www.ellenmacarthurfoundation.org/material-circularity-indicator (accessed on 18 September 2023).
- Han, J.; Guo, J. Geosynthetic-Stabilized Vegetated Earth Surfaces for Environmental Sustainability in Civil Engineering. In Proceedings of the American Society of Civil Engineers International Symposium on Systematic Approaches to Environmental Sustainability in Transportation, Fairbanks, AK, USA, 2–5 August 2015; pp. 276–285. [Google Scholar] [CrossRef]
- Morsy, K.M.; Thakeb, H. Comparative evaluation of the environmental impacts of geosynthetic Mechanically Stabilized Earth walls. J. Clean. Prod. 2022, 374, 133912. [Google Scholar] [CrossRef]
- Damians, I.P.; Bathurst, R.J.; Adroguer, E.G.; Josa, A.; Lloret, A. Environmental assessment of earth retaining wall structures. Environ. Geotech. 2015, 4, 415–431. [Google Scholar] [CrossRef]
- Damians, I.P.; Bathurst, R.J.; Adroguer, E.G.; Josa, A.; Lloret, A. Sustainability assessment of earth-retaining wall structures. Environ. Geotech. 2016, 5, 187–203. [Google Scholar] [CrossRef]
- Lee, M.; Basu, D. Environmental impacts of mechanically stabilised earth walls. Geosynth. Int. 2025, 1, 1–20. [Google Scholar] [CrossRef]
- Luthin, A.; Crawford, R.H.; Traverso, M. Demonstrating circular life cycle sustainability assessment–a case study of recycled carbon concrete. J. Clean. Prod. 2023, 433, 139853. [Google Scholar]
- Kadawo, A.; Sadagopan, M.; During, O.; Bolton, K.; Nagy, A. Combination of LCA and circularity index for assessment of environmental impact of recycled aggregate concrete. J. Sustain. Cem.-Based Mater. 2023, 12, 1–12. [Google Scholar]
- Lee, M.; Basu, D. Sustainability assessment of mechanically stabilized earth walls. In from Fundamentals to Applications in Geotechnics; IOS Press: Amsterdam, The Netherlands, 2015. [Google Scholar]

Disclaimer/Publisher’s Note: The statements, opinions and data contained in all publications are solely those of the individual author(s) and contributor(s) and not of MDPI and/or the editor(s). MDPI and/or the editor(s) disclaim responsibility for any injury to people or property resulting from any ideas, methods, instructions or products referred to in the content. |
© 2025 by the authors. Licensee MDPI, Basel, Switzerland. This article is an open access article distributed under the terms and conditions of the Creative Commons Attribution (CC BY) license (https://creativecommons.org/licenses/by/4.0/).