Abstract
The increasing risks posed by climate change have turned CO2 emissions into a pressing global issue, prompting the widespread adoption of sustainable development policies. This study investigates the empirical drivers of CO2 emissions across 15 of the world’s highest carbon-emitting countries from 2000 to 2021, using a range of advanced panel data techniques. The core explanatory variables include green energy transition (GET), fossil fuel consumption (FFC), financial development (FD), mineral resource consumption (MRC), energy intensity (EI), and information and communication technology (ICT). By employing cross-sectional dependence tests, CIPS and CADF unit root tests, cointegration techniques (Westerlund and Dickey-Fuller), and Driscoll-Kraay standard error (DKSE) estimators, the study ensures robust and reliable inference. The findings reveal that a 1% increase in GET and FD leads to a 1.59% and 4.51% decrease in CO2 emissions, respectively, while higher energy efficiency (EI) also significantly reduces emissions. In contrast, greater use of fossil fuels, mineral resources, and ICT expansion contributes positively to emissions. These results demonstrate the critical role of financial systems, clean energy investments, and energy efficiency in mitigating environmental degradation. The study offers targeted policy insights for countries aiming to balance economic growth with climate goals and highlights the need for enhanced technology transfer and financing mechanisms in low- and middle-income countries.
1. Introduction
Climate change and environmental degradation have emerged as defining global challenges of the 21st century. CO2 emissions, largely driven by industrial activity and fossil fuel-based energy consumption, remain a central concern for policymakers worldwide [1,2]. In response, international frameworks such as the Paris Agreement and the UN Sustainable Development Goals (SDGs) have emphasized the urgency of transitioning to sustainable energy sources and reducing emissions while maintaining economic growth [3]. Despite these global efforts, the world’s top carbon-emitting countries—such as China, the United States, and India—continue to account for the majority of global emissions [4].
This study investigates six key determinants of CO2 emissions: green energy transition (GET), fossil fuel consumption (FFC), financial development (FD), mineral resource consumption (MRC), energy intensity (EI), and information and communication technology (ICT). Prior research has often focused on single-country studies or limited regional samples [5,6,7]. Furthermore, few studies have jointly examined these six variables within a unified econometric framework applied to high-emitting economies [8,9]. To address this gap, we analyze a panel of 15 high-emitting countries: Brazil, Canada, China, Germany, India, Indonesia, Iran, Japan, Mexico, Russia, Saudi Arabia, South Africa, South Korea, Turkey, and the United States from 2000 to 2021. Methodologically, the paper applies panel data estimations using cross-sectional dependence tests, stationarity checks (CIPS and CADF), Westerlund and Dickey-Fuller cointegration, and Driscoll-Kraay standard errors to ensure robust findings. The study contributes by bridging the knowledge gap across empirical dimensions of finance, technology, and sustainability transitions in top-emitting economies.
Our objective is to provide evidence-based insights into how transitions in energy systems, financial markets, and technological development affect environmental outcomes across diverse national contexts. The key contributions of this study are threefold. First, we provide a comprehensive empirical model that captures multiple dimensions of sustainability, including energy structure, financial depth, industrial activity, and digital infrastructure, allowing for a holistic understanding of emissions dynamics. Second, we assess the roles of financial development and ICT in shaping CO2 emissions, two dimensions that remain relatively underexplored in cross-national emission studies, particularly in the context of highly polluting countries [10,11]. Third, by analyzing both developed and developing economies, we deliver targeted policy implications that account for income-level heterogeneity, institutional capacities, and development priorities.
Ultimately, the study aims to guide the formulation of integrated climate and development strategies that are both data-driven and policy-relevant. By identifying the most influential drivers of emissions in the world’s most carbon-intensive economies, this research provides an empirical foundation for future climate policy interventions, investment strategies, and sustainable development planning. The rest of the paper is structured as follows: Section 2 reviews the literature, Section 3 describes the dataset and methodology, Section 4 presents empirical findings, Section 5 discusses conclusion and policy implications.
2. Literature Review
Climate change, promoted predominantly by anthropogenic greenhouse gas emissions, is among the most critical global problems of the 21st century. Carbon dioxide (CO2) emissions, being one of the major drivers of climate change, are exposed to an interwoven complex of economic, technological, and environmental drivers. This literature review discusses the relationship between CO2 emissions and its determinants, and six independent variables are the point of focus: green energy transition (GET), fossil fuel consumption (FFC), financial development (FD), mineral resource consumption (MRC), energy intensity (EI), and information and communication technology (ICT). Combining research already performed, this section tries to provide a detailed explanation of how these variables affect climate change dynamics.
2.1. Green Energy Transition (GET)
Numerous empirical studies have explored the relationship between renewable energy use and environmental outcomes. Among them, eight out of ten recent peer-reviewed studies confirm that transitioning to renewable energy significantly reduces CO2 emissions across varying contexts. For example, ref. [6] investigated Latin American and Caribbean countries and reported a robust negative association between renewable energy consumption and CO2 emissions. Ref. [12] using a panel of top green economies, showed that green productivity, largely driven by renewable energy and technological innovation, leads to substantial emission reductions. Similarly, ref. [13] analyzed a global panel dataset and confirmed that renewable energy deployment lowers emission intensity. Ref. [14] highlighted the complementary role of financial development in facilitating clean energy investments, while ref. [10] extended the literature by examining the regional effects of renewables in Asia-Pacific countries. However, not all studies report uniform outcomes. Ref. [7], for instance, emphasized that the growing material demands of renewable technologies—particularly critical minerals—may offset some of their environmental benefits. These mixed findings suggest that while renewable energy transitions are generally effective in reducing emissions, their success depends on national context, energy mix, technological readiness, and institutional support. Our study contributes to this debate by examining the combined effect of green energy transition and other sustainability indicators across 15 of the world’s most carbon-intensive countries. Similarly, ref. [7,8,15] document negative relationships between the development of renewable energy and CO2 emissions, albeit [16] notice that the effects vary by power source. Geothermal and hydropower emit less, yet solar, wind, and bioenergy have both positive and negative effects.
Fossil fuel displacement by renewable energy has been widely debated as a crucial step in mitigating climate change. Studies have documented that increased penetration of renewables in the energy mix significantly lowers CO2 emissions [17,18]. GET involves the application of solar, wind, hydro, and other renewable energy technologies, which not only reduce carbon-based energy sources but also promote sustainable development. However, the pace and level of this transition vary among nations depending on policy frameworks, technological advancements, and economic incentives [19]. While the GET is naturally associated with fewer emissions, it is based on incorporating renewable energy into existing energy infrastructure and the phasing out of fossil fuel subsidies [20].
2.2. Fossil Fuel Consumption (FFC)
The consumption of fossil fuels remains the largest source of CO2 emissions worldwide and accounts for approximately 75% of total greenhouse gas emissions [2]. The burning of coal, oil, and natural gas in the production of energy, transportation, and industrial applications releases a significant amount of CO2 into the atmosphere. Empirical evidence has established a direct association between FFC and CO2 emissions [21,22]. Despite global attempts at decoupling fossil fuel dependence, most economies continue to be dependent on them due to their being inexpensive, readily available, and having a well-established infrastructure. The challenge lies with the balance between energy security and economic growth and the urgency of decarbonizing energy systems [23].
The burning of fossil fuels is the source of CO2 everywhere. Ref. [24] recognizes 90% of global CO2 emissions as resulting from fossil fuels. Refs. [25,26] report a steady rise in global emissions, with higher levels at high northern latitudes and in cities. In Ecuador, [27] find transport contributes 33% of emissions, 63% of which come from road transport, while [28] find higher CO2 intensities in the U.S. Southeast and Texas Gulf coast than elsewhere in the country. Ref. [29] finds urban per capita emissions in developing countries at 2.08 Mg C/(capita·yr) and 0.598 Mg C/(capita·yr) for rural areas. Ref. [30] observes a 7.8% decrease in emissions in the earlier COVID-19 phase, followed by a post-pandemic rebound documented by [24]. Collectively, these studies show that greater use of fossil fuels is associated with higher levels of CO2 emissions, differing in magnitude and dynamics by region, sector, and economic situation.
Fossil fuel consumption remains the dominant source of global CO2 emissions, accounting for over 75% of total emissions according to the IEA and IPCC. Numerous empirical studies have documented the long-run elasticity of CO2 emissions with respect to fossil fuel use across various economies [16,22]. In the context of our study, the 15 countries examined—China, the United States, India, Russia, Japan, Germany, South Korea, Iran, Canada, Saudi Arabia, Indonesia, Brazil, Mexico, Turkey, and South Africa—are collectively responsible for nearly 70–75% of global fossil fuel combustion. Among these, China and the United States are the largest coal and oil consumers, respectively, while countries like Saudi Arabia and Russia are major producers and exporters of fossil fuels. India, South Africa, and Indonesia also rely heavily on coal for electricity generation, which significantly contributes to their national emissions profiles. Conversely, countries such as Germany and Canada have implemented policies to diversify their energy mix, though fossil fuels still represent a substantial share of their total energy consumption. These variations highlight the heterogeneity in fossil fuel dependence, which our empirical model captures through a panel framework that allows for cross-sectional variation. The inclusion of these countries provides a broad and policy-relevant picture of the global fossil fuel landscape and its environmental implications [31,32,33].
2.3. Financial Development (FD)
Recent studies investigated the complex relationship between financial development and CO2 emissions. Although some evidence suggests that financial development can finance investments in clean technology and renewable energy initiatives, thereby reducing environmental degradation in high-income countries [14,34], it can increase emissions in middle-income economies [14]. On the negative side, FD can also fuel economic activity that increases energy consumption and emissions, particularly in fossil fuel-based industries [35]. The relationship between FD and CO2 emissions, in turn, is dependent on context and varies with the level of economic development and regulatory framework, giving prominence to environmental sustainability in financial policy [10]. More notably, spatial econometric analysis illustrates that a country’s CO2 emissions could be influenced by the financial development of neighboring countries, with a significant negative spillover effect [36]. Also, carbon pricing policy in developed economies can help to attract climate-friendly foreign direct investment [37]. These findings refer to the importance of taking note of both domestic and international financial development in environmental policymaking and the potential for benefits from regional cooperation in tackling climate change.
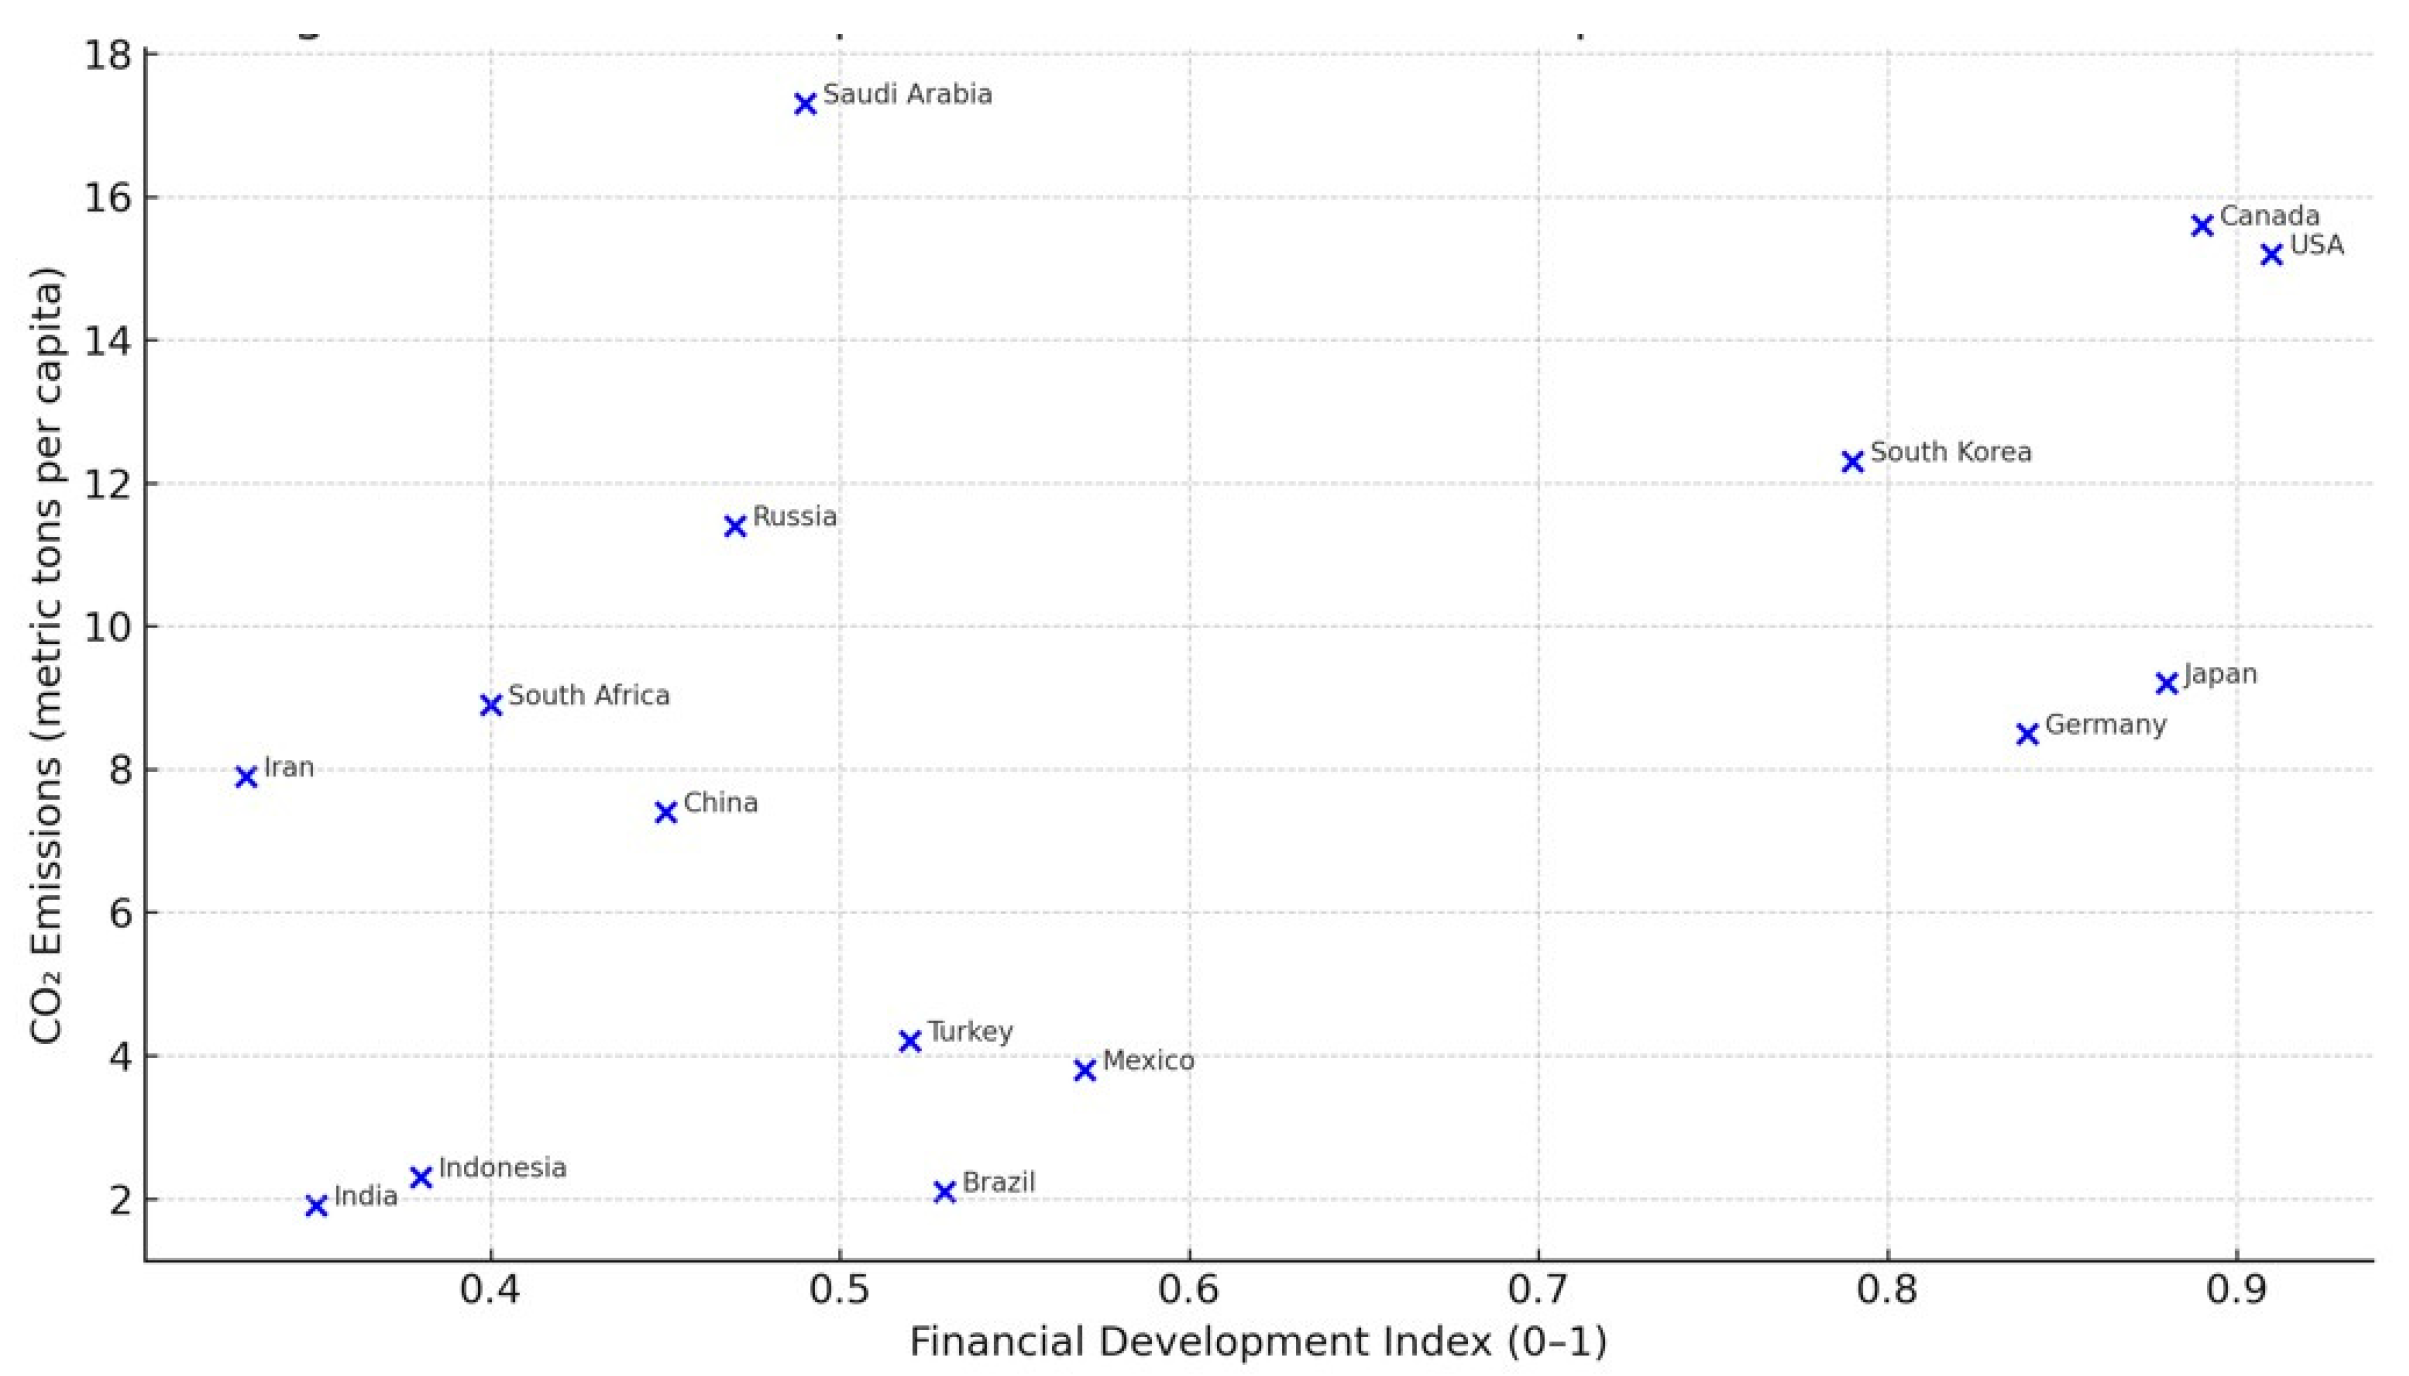
Empirical evidence suggests that the relationship between financial development (FD) and CO2 emissions is highly dependent on a country’s level of economic development. In low- and middle-income economies, where financial systems are still maturing, FD tends to fuel emissions due to its association with energy-intensive infrastructure and industrial expansion. In contrast, in high-income economies, more developed financial systems often support investment in cleaner technologies and renewable energy, leading to emission reductions. Indicators such as GDP per capita, the share of services in GDP, and governance quality can significantly influence this relationship. As illustrated in Figure 1, countries with high financial development, such as the United States, Germany, and Canada, exhibit relatively high CO2 emissions, yet with evidence of plateauing or decline due to green financing policies. Conversely, countries like India and Indonesia show lower FD levels but rising emissions. This non-linear pattern underscores the context-specific nature of the FD-emissions link and motivates our panel-based approach, which accommodates economic diversity among the 15 countries analyzed.
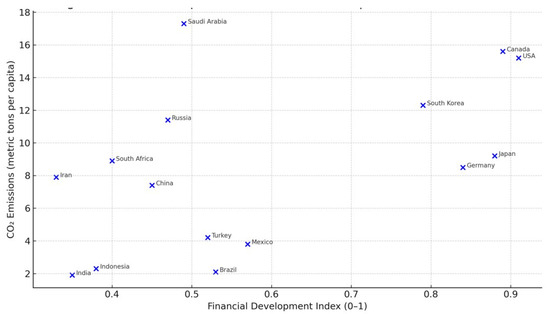
Figure 1.
Relationship between Financial Development and CO2 Emission.
2.4. Mineral Resource Consumption (MRC)
Empirical studies reveal that the consumption of mineral resources plays a pivotal role in contributing to CO2 emissions. Empirical research in G-20 and OECD countries highlights that there exists a strong relationship between natural resource utilization and environmental degradation [38,39]. Processing and extraction of mineral resources are significant sources of anthropogenic CO2 emissions, and chemical conversions and energy demands are of principal importance [40]. Geopolitical danger expands these effects by inhibiting the development of energy frameworks and motivating the importation of fuel [41]. With more emissions resulting from economic development, the scenario can be complex, differing in accordance with the utilized energy resources [41]. To address such challenges, solutions include restraining mass consumption of resources in G-20 economies [40], enabling decarbonization for key mineral industries [40], and implementing policies favoring energy efficiency and green resource consumption [41].
Also, mineral resource use and extraction, such as metals and rare earth elements, constitute industrial manufacturing and technological advancement. These processes are, however, energy-intensive and are likely to be associated with high CO2 emissions [42]. The growing demand for minerals, driven by the expansion of renewable energy technologies and digital infrastructure, has raised concerns regarding the environmental footprint of MRC [43]. Though recycling and sustainable mining can minimize some of these effects, the overall effect of MRC on CO2 emissions is still significant, particularly for economies based on resources [44].
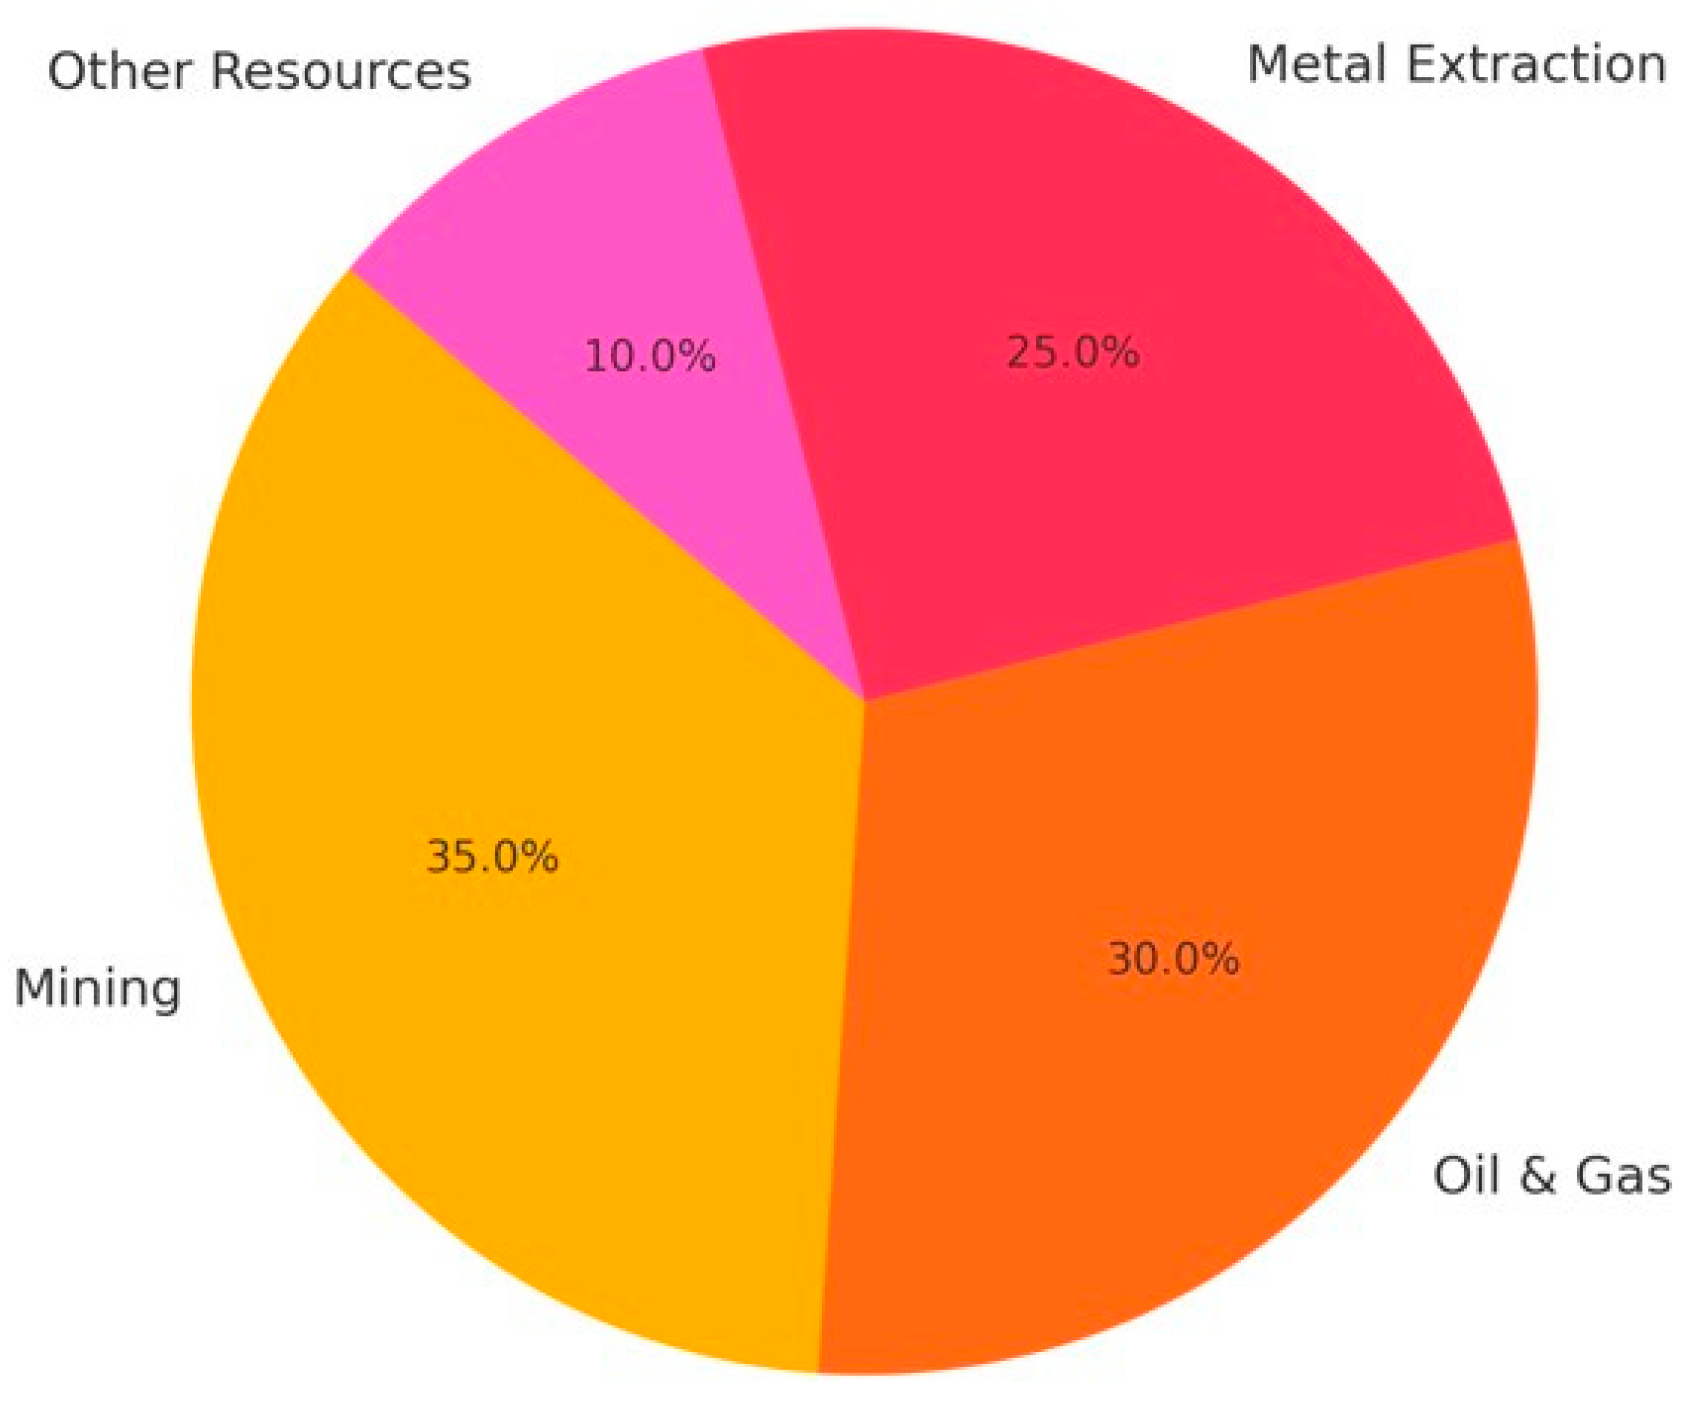
Additionally, Figure 2 illustrates the relative share of sectors such as mining, oil and gas, and metals in overall mineral consumption across selected countries. This sectoral differentiation provides important context for understanding emission patterns linked to resource reliance.
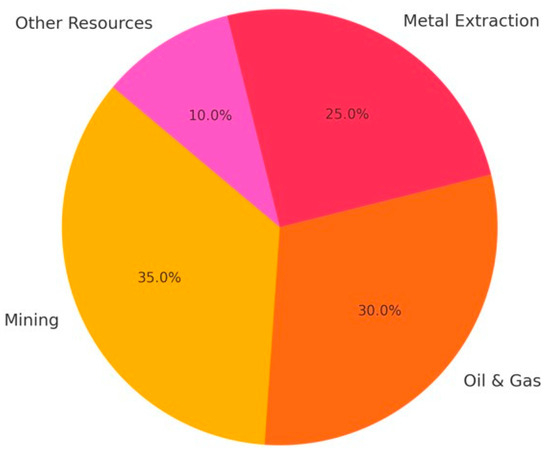
Figure 2.
Mineral Resource Consumption by Sector.
2.5. Energy Intensity (EI)
Recent studies have investigated the relationships between energy intensity, CO2 emissions, and economic factors. Energy intensity has been found to increase CO2 emissions both in the short and long run [45,46]. Economic policy uncertainty can complement this impact, solidifying the negative impact of energy intensity on emissions [13]. However, renewable energy consumption has been discovered to have the capability to curb CO2 emissions [45]. The Environmental Kuznets Curve hypothesis, which holds that environmental impact reduces at later phases of economic progress, has been supported in some environments [45,46]. Both structural and technological changes in economies can induce lower energy intensity and CO2 emissions, with structural changes acting as a catalyst for green innovation [47]. All these findings refer to the complexity of the relationship between energy consumption, economic policies, and environmental outcomes.
Energy intensity, the amount of energy consumed per unit of GDP, is a critical indicator of energy efficiency. Lower EI corresponds to lower CO2 emissions, which is a more efficient use of energy as well as new technology [48]. It is the high EI countries that have been shown to report higher emissions due to inefficient energy consumption systems and reliance on carbon-intensive technologies [49]. Policies to encourage energy efficiency, such as energy-efficient technology and increased energy standards, have been shown to be effective in reducing EI and, hence, CO2 emissions [31]. However, the rebound effect, whereby efficiency gains boost energy use, can, to some degree, offset these benefits [50].
Also, our sample data show marked differences in EI across countries, with nations like Germany and Japan exhibiting relatively low EI compared to high-emitting countries such as Russia and South Africa. Figure 3 provides a visual comparison of energy intensity for selected countries in our study. This variation in EI reinforces the need to account for structural and policy-based heterogeneity in emission models.
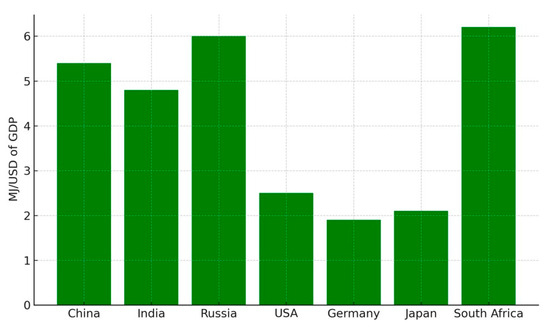
Figure 3.
Energy Intensity Across Selected Countries.
2.6. Information and Communication Technology (ICT)
Existing studies examine the complex relationship between Information and Communication Technology (ICT) and CO2 emissions. There is a U-shaped relationship globally, with developed countries past the inflection point where ICT reduces emissions [51]. The relationship is different regarding openness to trade and financial development, and the effects are heterogeneous across income levels [11]. ICT is found to reduce CO2 emissions in middle- and high-income nations but increases emissions in low-income nations [13]. Transport provides ICT opportunities to reduce the damage to the environment, as different technologies exhibit different levels of effectiveness across transport modes [52]. These findings indicate the potential of ICT in promoting environmental sustainability, particularly in developed economies, but emphasize the need for targeted strategies in developing countries to capitalize on ICT’s benefits for emissions reduction.
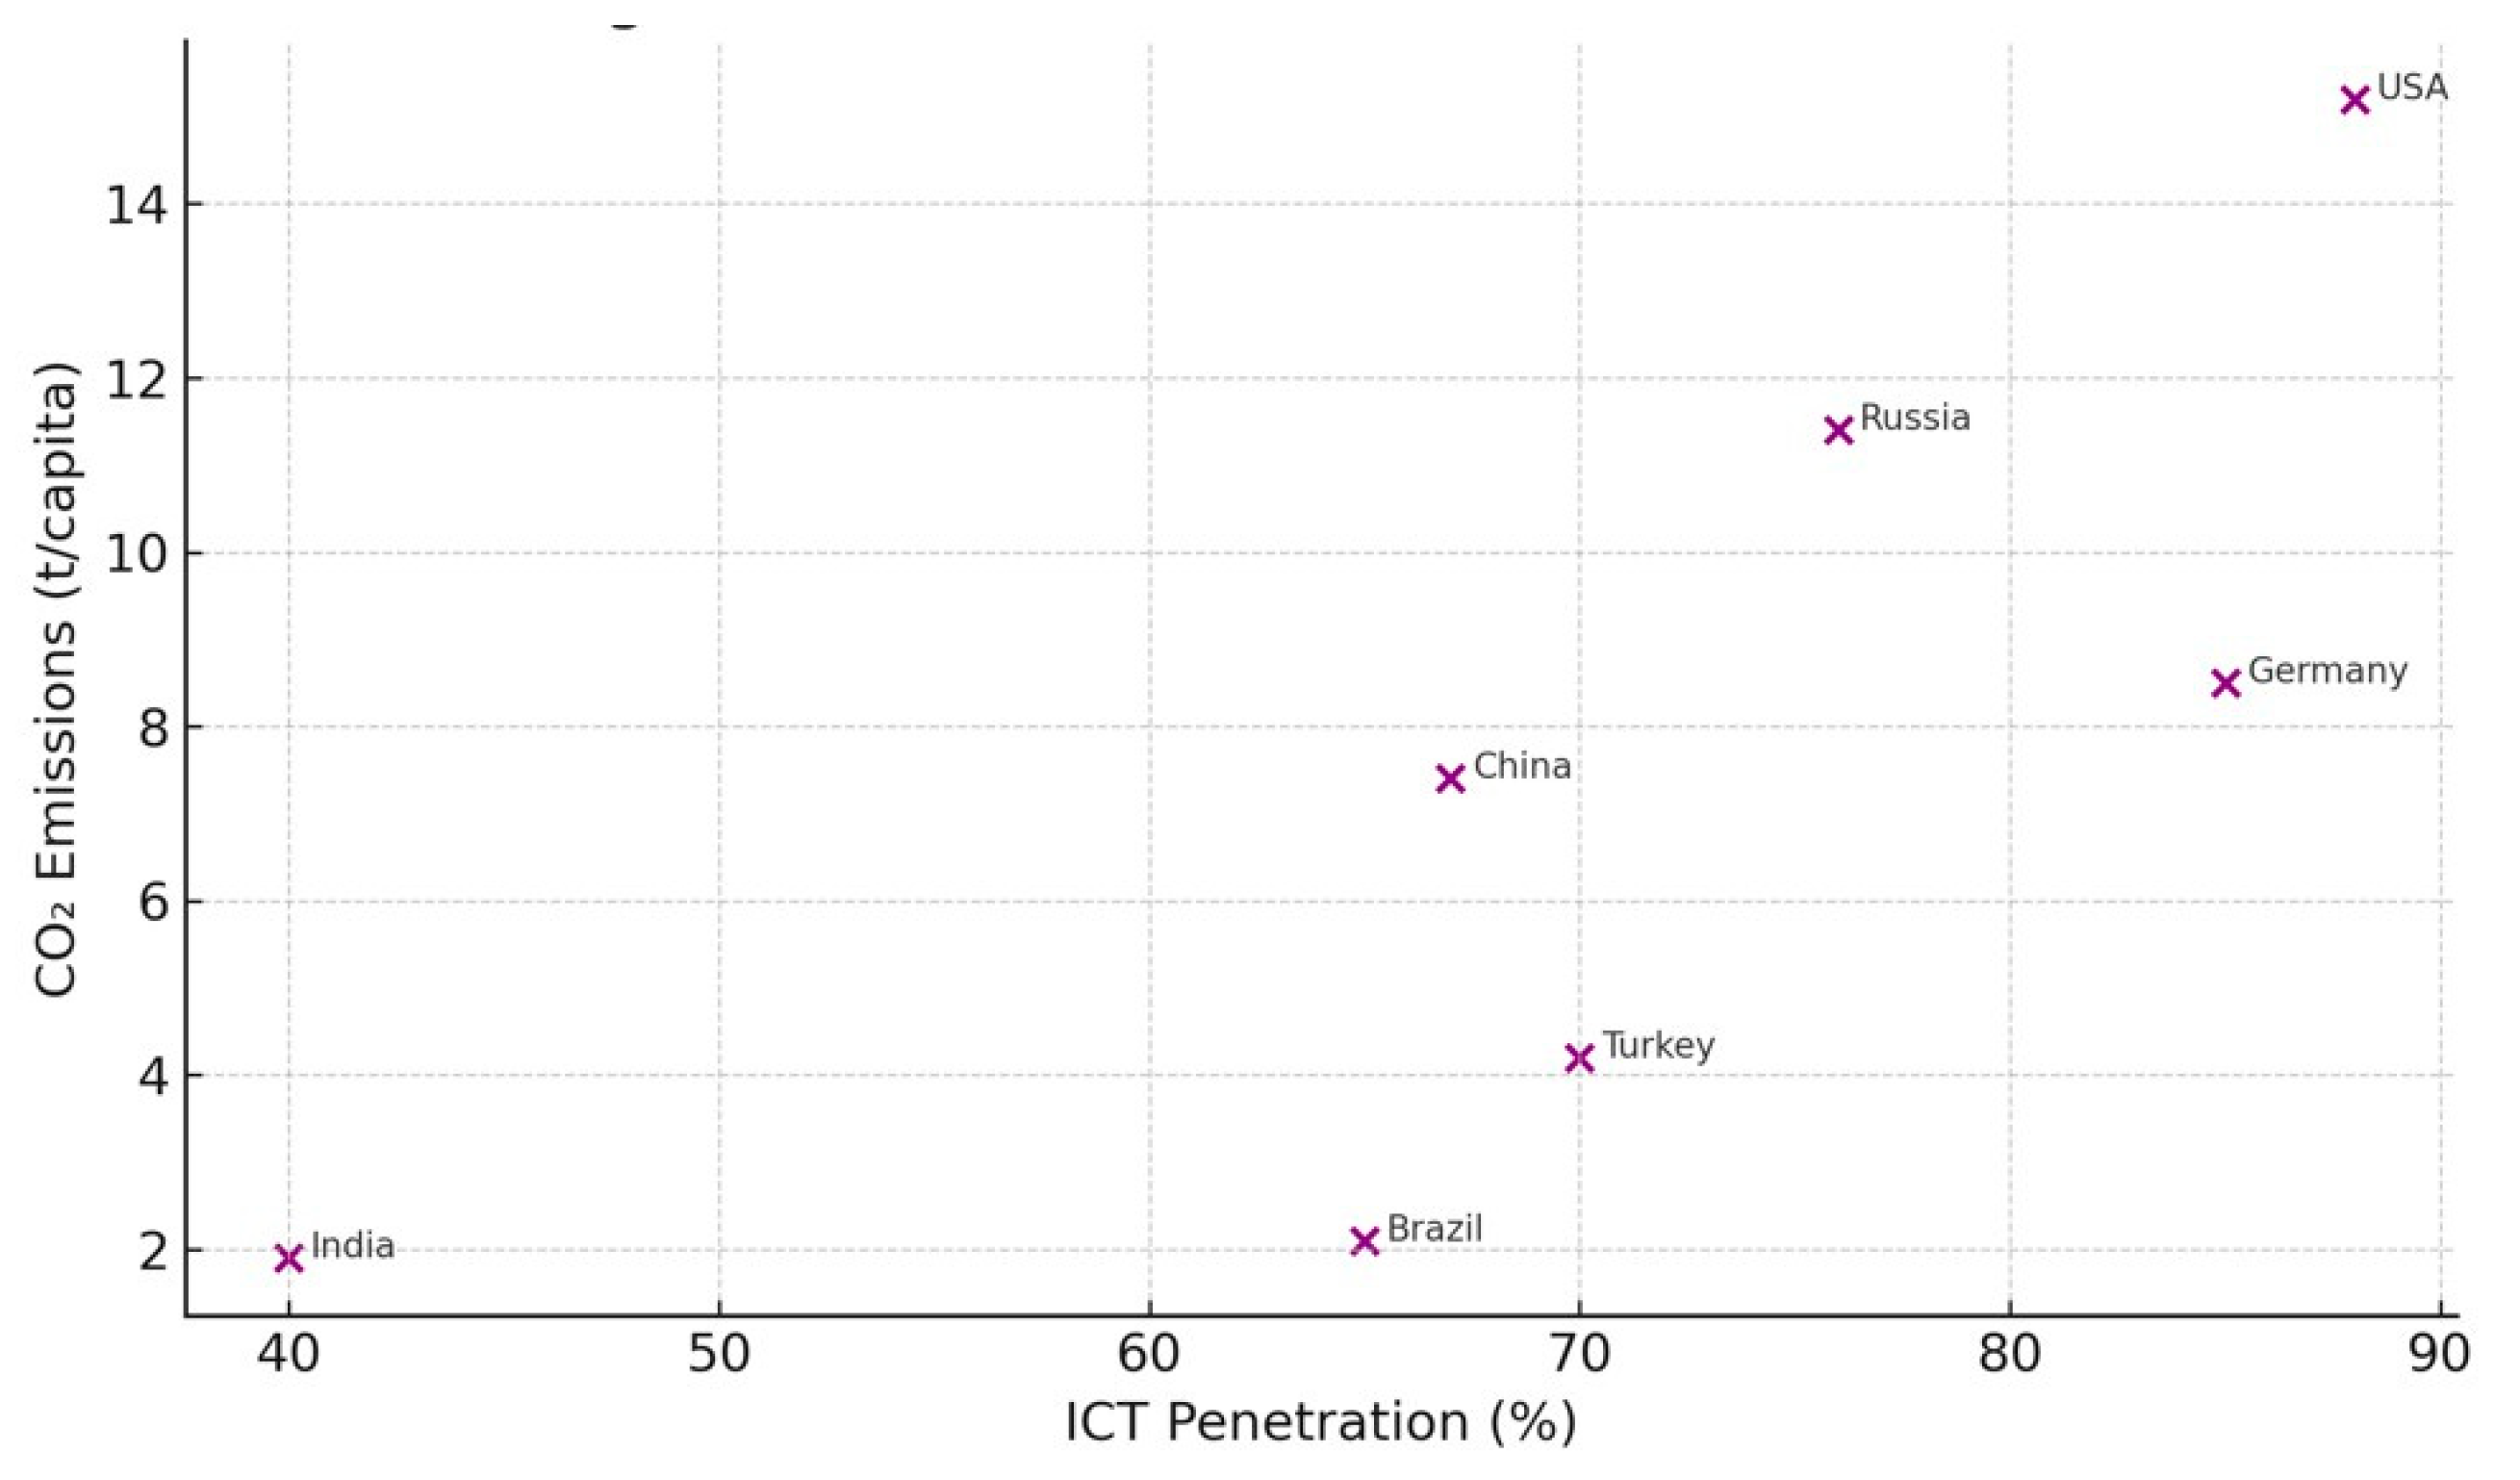
The role of ICT in climate change is multifaceted. ICT, to some extent, can help to cause emissions in the form of energy usage in data centers, networks, and devices [53]. To the extent that ICT provides support for smart grids, energy-efficient buildings, and remote working, which reduce emissions [54]. Its net contribution to CO2 emissions lies in the extent to which energy use by ICT is balanced against its potential for driving energy efficiency and decarbonization [55]. Driving the digital economy transformation targets sustainable ICT behavior and policy measures that offset the highest climate potential [56]. Figure 4 plots ICT penetration rates against per capita CO2 emissions across selected countries. The pattern confirms the dual effect of ICT adoption, justifying its inclusion in our empirical framework as both a potential driver and mitigator of emissions.
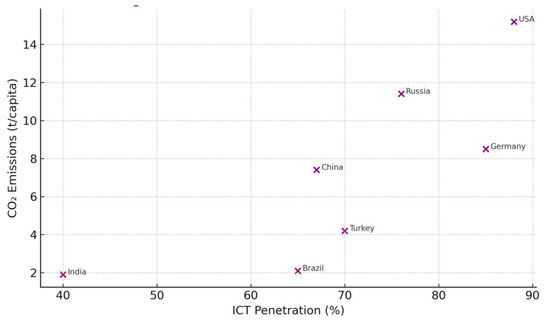
Figure 4.
ICT Penetration vs. CO2 Emissions.
Overall, CO2 drivers are associated with and controlled by many economic, technological, and policy factors. While the shift to green energy and rising energy intensity opens encouraging paths for emission reduction, the continued dependence on fossil fuels and the extraction of mineral resources pose severe challenges. Economic development and ICT also present risks as well as opportunities, necessitating integrated strategies that balance economic progress and environmental sustainability. This review points to the complexity of addressing climate change and the necessity of integrated strategies that consider the multi-faceted drivers of CO2 emissions. The future research must explore the synergies and trade-offs among these drivers in a bid to develop effective climate policy and sustainable development strategies.
2.7. Research Gaps and Contributions
The review of the existing literature reveals several important gaps that this study aims to address. First, while numerous studies have explored the effects of individual variables, such as renewable energy consumption or fossil fuel use, on CO2 emissions, relatively few have adopted an integrated approach that simultaneously examines a broader set of environmental, financial, and technological drivers. In particular, variables such as financial development and ICT expansion remain underexplored in the context of large-scale, cross-country emission models.
Second, many prior works have been limited to specific regions or income groups, such as OECD or BRICS countries, thereby neglecting broader comparisons across top carbon-emitting nations. This limits the generalizability of policy implications and reduces the ability to identify global patterns in emissions behavior. Third, methodological gaps persist, with a lack of studies using robust panel econometric techniques that control for cross-sectional dependence, heterogeneous dynamics, and long-run equilibrium relationships.
To address these limitations, our study contributes to the literature in three key ways. First, it presents a unified empirical model that incorporates six critical explanatory variables—green energy transition (GET), fossil fuel consumption (FFC), financial development (FD), mineral resource consumption (MRC), energy intensity (EI), and information and communication technology (ICT)—into a single framework. Second, the study analyzes a balanced panel of 15 of the world’s highest carbon-emitting countries over a 22-year period (2000–2021), enhancing the policy relevance of the results. Third, the application of second-generation econometric methods (e.g., CIPS, CADF, Westerlund cointegration, Driscoll-Kraay standard errors) strengthens the robustness and reliability of the findings. In addition, Table A1 in the Appendix A summarizes key prior studies, their limitations, and how our research contributes to filling these knowledge gaps.
3. Data and Methodology
3.1. Data Description
This study investigates the determinants of climate change, in terms of carbon dioxide (CO2) emissions, using panel data for 15 of the most carbon-emitting nations. The nations included in the sample are Brazil, Canada, China, Germany, India, Indonesia, Iran, Japan, Mexico, Russia, Saudi Arabia, South Africa, South Korea, Turkey, and the United States (Figure 5). The time frame of the data is 2000 to 2021, and all data except for financial development were collected from the World Development Indicators (WDI) database. Data for financial development was collected from the IMF dataset (Table 1).
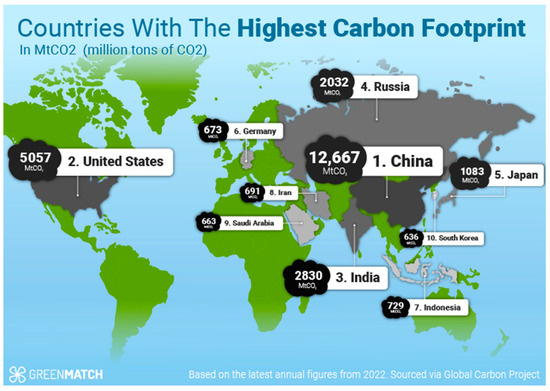
Figure 5.
Countries With The Highest Carbon Footprint. Source: https://www.greenmatch.co.uk/blog/countries-with-the-highest-carbon-footprint (accessed on 27 August 2024).

Table 1.
Description of Variables and Data Sources.
The dependent variable of this research is climate change (CO2), which is measured in terms of CO2 emissions per capita (metric tons per capita). This variable captures the level of greenhouse gas emissions produced by each country, which is a quintessential measure of climate change.
Green energy transition (GET) shows the renewable energy consumption as a percentage of total energy consumption (%). The indicator reflects the shift from fossil fuel-based energy resources to renewable resources such as wind, solar, hydro, and biomass. As the GET value increases, it reflects advancement in sustainability along with reduced carbon emissions. Also, fossil fuel consumption (FFC) is the percentage of fossil fuels in total energy consumption (%). This measure reflects the dependence on non-renewable energy sources like coal, oil, and natural gas. Increased values of FFC suggest higher carbon emissions from the combustion of fossil fuels.
Additionally, financial development (FD) is the Financial Development Index with variables such as credit access, stock market capitalization, and financial intermediation. Financial development impacts environmental performance by directing resources into green investment, but it can also facilitate industrial development, resulting in carbon emissions. Mineral resource consumption (MRC) presents the total mineral resources consumed (metric tons). This indicator captures the intensity of resource use, as mining and mineral processing are accountable for environmental degradation, deforestation, and increased energy consumption.
Finally, energy intensity (EI) refers to energy consumption per unit of GDP (megajoules per dollar of GDP). The higher the EI, the more wasteful is the energy consumption, implying that a country requires greater energy input to generate economic output, generally leading to increased emissions. Information and communication technology (ICT) includes two indicators, ICT investment as a percentage of GDP, and internet penetration as a percentage of the population. ICT technological advancement can benefit energy efficiency, industrial process optimization, and green technologies empowerment, hence influencing emissions dynamics.
3.2. Methodology
To examine the long-run and short-run determinants of CO2 emissions across high-emitting countries, we adopt a multi-step panel econometric approach that accounts for cross-sectional dependence (CSD), slope heterogeneity, and non-stationarity. We begin by testing for cross-sectional dependence using Pesaran’s (2004) CD test [57] and slope heterogeneity using Pesaran and Yamagata’s (2008) delta test [58]. To assess the stationarity of the series, we use second-generation unit root tests including the Cross-sectionally Augmented Dickey-Fuller (CADF) [59] and the Cross-sectionally Im, Pesaran and Shin (CIPS) tests [59], which are suitable in the presence of CSD. Next, we examine cointegration using the Westerlund (2007) error-correction-based test [60] and the traditional panel Dickey-Fuller method. For parameter estimation, we use the Driscoll-Kraay standard error (DKSE) approach [61], which is robust to heteroscedasticity, autocorrelation, and cross-sectional dependence. All variables are used in their log-linear form except for indices and rates. Diagnostic tests are reported to ensure robustness, and country-specific insights are discussed where relevant.
Prior to conducting panel unit root tests and cointegration tests, cross-sectional dependence among countries must be tested for in accordance with economic and environmental interdependencies. The following are used:
Pesaran CD Test: Tests for cross-sectional dependence in panel data using the following formula:
where is the pair country i and j residuals correlation.
Also, Fisher’s test uses aggregate p-values from single cross-section tests, and the Frees test uses a rank-based statistic to detect cross-sectional dependence.
To check the stationarity of the panel data, the following unit root tests are conducted:
Cross-sectionally Augmented Im, Pesaran, and Shin (CIPS) Test:
where ti shows the ADF t-statistics for cross-section i.
CADF (Cross-sectionally Augmented Dickey-Fuller) Test:
where presents the cross-sectional mean.
To examine long-run relationships among variables, the following cointegration tests are applied:
Westerlund Cointegration Test: Based on error correction models.
Dickey-Fuller Cointegration Test:
Augmented Dickey-Fuller (ADF) and Modified Dickey-Fuller Tests:
where shows the panel variables.
Homogeneity Slope Test
Pesaran and Yamagata Slope Homogeneity Test:
where presents the mean coefficient estimate and σ shows the standard deviation.
The Driscoll-Kraay Standard Errors (DKSE) technique is used to correct for heteroskedasticity, autocorrelation, and cross-sectional dependence when estimating panel data. The DKSE technique offers consistent standard errors that eliminate such problems, making inference more accurate.
Advantages of DKSE
- -
- Corrects for Heteroskedasticity: It offers robust standard errors even under non-constant variance across observations.
- -
- Corrects for Autocorrelation: It corrects for serial correlation in panel data.
- -
- Handles Cross-Sectional Dependence: Unlike regular panel models, DKSE deals with correlations across cross-sections.
- -
- It can be Used in Small Samples: Unlike some panel estimation methods that require large samples, DKSE is stable with moderate sample sizes.
No Need for Strong Assumptions: Unlike Generalized Least Squares (GLS), DKSE does not impose specific distribution forms. The DKSE model is estimated using:
where X is the matrix of independent variables, Y is the dependent variable, and are the estimated coefficients corrected for heteroskedasticity and cross-sectional dependence.
The following econometric model is estimated:
where CO2it represents the carbon emissions of country i at time t. GETit, FFCit, FDit, MRCit, EIit, and ICTit are the independent variables. εit is the stochastic error term.
4. Empirical Results and Discussion
The Cross-Sectional Dependency (CSD) Tests in Table 2 test whether the panel dataset is cross-sectionally dependent. The results are to be interpreted as: The Pesaran CD test provides for cross-sectional dependence by testing country-to-country correlation of residuals. A very large test statistic value of 34.17 with a p-value of 0.00 shows statistically at a significance level of 1% that there is cross-sectional dependence (***), which represents statistical significance at a 1% significance level. The Fisher test pools single cross-sectional tests to measure dependence. A large Fisher statistic (215.90) with a p-value of 0.00 suggests strong cross-sectional dependence across the countries. The Frees test is a non-parametric way of checking cross-sectional dependence. The test statistic (9.93) is many times greater than all mentioned critical values (0.17 at 10%, 0.23 at 5%, and 0.34 at 1%), suggesting strong cross-sectional dependence at every level of significance.
Table 2.
Cross-sectional Dependency Tests.
Since all three tests reject the null hypothesis of cross-sectional independence, the dataset exhibits significant cross-sectional dependence. That is, economic or environmental factors in one country are pushing CO2 emissions in other countries due to global trade, economic interdependencies, environmental spillovers, or technological diffusion. According to this result, conventional panel estimation approaches (e.g., pooled OLS or fixed effects) may be unsuitable. Instead, methods to correct cross-sectional dependence, i.e., Driscoll-Kraay standard errors (DKSE), Common Correlated Effects (CCE), or Cross-Sectionally Augmented models (CIPS/CADF unit root tests) need to be employed.
Table 3 presents the Cross-sectionally Augmented Im, Pesaran, and Shin (CIPS) test result and the Cross-sectionally Augmented Dickey-Fuller (CADF) test result, which both are used to test for stationarity of the panel data variables. Both tests are cross-sectionally robust. The null hypothesis (H0) for both tests is that the variable has a unit root (i.e., is non-stationary).
Table 3.
Unit Root Test.
While CO2 emissions and green energy transition (GET) do not have a unit root, the CIPS test for FFC suggests non-stationarity, but the CADF test suggests stationarity. First-difference transformation (ΔFFC) was also checked, with CIPS = −3.39, which suggests stationarity after first differencing. Therefore, FFC is not fixed at the level but fixed in first difference, i.e., it is an integrated process of order 1 (I(1)).
Also, FD is mean-reverting at level (I(0)) as it reverts to its mean in the long run. The use of mineral resources means reverting over time with no long-run persistence of shocks. Energy intensity is not a unit root process, i.e., policy or economic changes for energy consumption will not have lasting effects. Finally, ICT has stabilized at this level.
The Heterogeneity Slope Test, often associated with ref. [58] identifies whether or not slope coefficients vary across countries in a panel dataset. Based on Table 4, the Δ test rejects the null hypothesis of homogeneous slope coefficients at the 5% significance level, and it suggests that the impact of independent variables (e.g., green energy transition, fossil fuel consumption, financial development, etc.) varies country by country. The continuity-corrected test statistic is still more negative, and the p-value (0.00) also indicates strongly significant heterogeneity at the 1% level. What it suggests is that the relationship of CO2 emissions to independent variables varies significantly across nations due to variation in the structure of the economy, energy policies, and technologies.
Table 4.
Heterogeneity slope test.
Table 5 presents the results of various panel cointegration tests, which test for long-run equilibrium between the determinants and CO2 emissions in your model. Long-run equilibrium means that although there are short-term fluctuations, there are forces pushing the independent variables and CO2 emissions together in the long run.
Table 5.
Cointegration Tests.
The Westerlund test checks for a long-run relationship according to an error correction model approach. Since the test statistic (3.23) is at 5% significance (p-value = 0.04), we reject the null hypothesis of no cointegration. This confirms that at least some variables do have a long-run equilibrium relationship with CO2 emissions.
Both the Dickey-Fuller and augmented Dickey-Fuller tests for a unit root in the residuals of the long-run equation are estimated. The highly negative values (−14.26 and −12.05) with p-values of 0.00 strongly reject the null hypothesis. Also, the Augmented Dickey-Fuller (ADF) test is the superior form of the Dickey-Fuller test, controlling for lag structure. With a highly negative test statistic (−9.80) and p-value = 0.00, the null hypothesis is again rejected. This strengthens the existence of a long-run equilibrium relationship. Additionally, the unadjusted tests also confirm strong stationarity of residuals, strengthening the finding of cointegration.
Table 6 provides the Driscoll-Kraay standard errors (DKSE) regression that estimates the impact of various independent variables on LnCO2 emissions. The DKSE method eliminates heteroskedasticity, autocorrelation, and cross-sectional dependence, and hence the estimates are robust and reliable for policy purposes.
Table 6.
DKSE (Driscoll Kraay standard errors) method (Dependent Variable: LnCO2).
A rise in GET by 1% reduces CO2 emissions by 1.59%. This accords with the fact that transitioning to green energy reduces emissions significantly. A 1% increase in the consumption of fossil fuels raises CO2 emissions by 1.65%, suggesting a direct positive correlation between the consumption of fossil fuels and environmental degradation. Financial development reduces CO2 emissions by 4.51% when it rises by 1%, indicating that a well-developed financial sector stimulates green investments and reduces emissions. A 1% increase in the use of mineral resources moderately increases CO2 emissions by 0.09%. This has a weak impact, suggesting that extractive industries are behind in environmental degradation. An increase in energy intensity by 1% reduces CO2 emissions by 2.39%, suggesting that greater energy efficiency leads to declining emissions, presumably as a result of technological advances in energy-saving. An increase in the application of ICT by 1% increases CO2 emissions by 0.07%. This suggests that ICT development modestly increases emissions, such as through data centers and digital infrastructure, and electricity consumption.
Discussion
The panel-based empirical results offer valuable insights into the long-run and short-run dynamics between CO2 emissions and their key explanatory variables. However, it is important to acknowledge the significant heterogeneity among the 15 countries analyzed. These countries differ markedly in terms of their energy mix, industrial composition, technological infrastructure, and environmental policies. For example, China and India rely heavily on coal for electricity generation, while countries like Germany and Canada have made significant progress in transitioning to renewable energy sources. Similarly, financial systems vary widely across the sample, influencing the pace and direction of green investments.
The findings reveal that green energy transition (GET), financial development (FD), and energy intensity (EI) significantly reduce CO2 emissions. Conversely, fossil fuel consumption (FFC), mineral resource use (MRC), and ICT expansion are associated with rising emissions, especially in emerging economies. These outcomes are consistent with prior studies that emphasize the asymmetric role of financial systems and technology in environmental performance. Post-estimation diagnostics confirmed model robustness through VIF and heteroscedasticity controls.
Green Energy Transition (GET) and Financial Development (FD) are crucial in the abatement of CO2 emissions. Renewable energy policy and financial deepening can reduce emissions. Ref. [62] examined 102 countries from 2004 to 2020 and found an N-shaped relationship between CO2 emissions and financial inclusion, suggesting that financial development, initially, increases emissions but eventually leads to reducing emissions as financial systems become more mature and support cleaner investments. Ref. [63] study of the Next-11 countries confirmed that financial development increases the role of renewable energy consumption in reducing CO2 emissions, highlighting the complementary role of the financial system in promoting green energy initiatives.
Ref. [64] endeavored to evaluate the effect of energy intensity on carbon emissions and came to the conclusion that it is a nice method to decouple economic development from energy consumption, which can be an ideal method for green development. Ref. [65] studies confirmed that Morocco’s energy-related CO2 emissions indicate that lower carbon emissions occur with lower energy intensity, and the importance of energy efficiency towards sustainable development could not be stressed enough.
Fossil Fuel Consumption (FFC) and Mineral Resource Consumption (MRC) increase emissions. Reducing fossil fuel dependence and encouraging green mining methods are needed. Ref. [66] opined that High-resolution data, such as the Global Gridded Daily CO2 Emissions (GRACED), capture daily CO2 emissions due to fossil fuel and cement consumption and reveal temporal dynamics of emissions by sector. The manufacture of cement is a significant industrial source of CO2 emissions, primarily due to the calcination of limestone and the combustion of fossil fuels in the production process. Cement manufacture accounted for around 1.42 Gt of CO2 emissions globally in 2019 [5].
Energy Efficiency (EI) is important for emission reduction. Energy intensity (EI) is an indicator of the energy efficiency of a country’s economy, measured as the amount of energy used per unit of gross domestic product (GDP). Investment in energy-efficient technology must be prioritized. Studies by [67] recommended reducing reliance on inefficient, carbon-generating power plants by maximizing distributed energy storage scheduling. By coordinating energy storage activities with periods of peak renewable energy availability, the approach achieved a 23.3% yearly decrease in carbon emissions, recognizing the potential of strategic energy management to enhance efficiency and minimize emissions. Ref. [68] also studied the European energy system and determined that early and ongoing decarbonization measures, prioritizing energy efficiency and renewable energy integration, are cheaper than delayed action. It suggests that increasing energy efficiency is extremely critical in achieving timely and affordable emission reductions.
ICT has a minimal effect on CO2 emissions. With ICT enhancing efficiency, its impact on the environment also has to be monitored, specifically in terms of electricity demand. Ref. [69] created the Belt and Road Initiative (BRI) countries, such as South Africa, Brazil, China, Russia, and India, which found ICT development results in lower CO2 emissions, which suggests ICT innovation has the ability to improve ecological circumstances by reducing carbon emissions. On the contrary, ref. [70] projects that the ICT industry has a large carbon footprint, and based on estimates, it is reckoned to provide 1.4% of total global emissions. This only serves to establish that ICT, while it may influence efficiencies, also impacts emissions.
While the panel-based estimation provides a comprehensive overview of the determinants of CO2 emissions across high-emitting countries, it is important to recognize that each country exhibits distinct structural characteristics, policy frameworks, and technological capacities. As such, the relationships observed at the aggregate level may differ in magnitude or even direction when examined individually. For instance, the role of financial development or ICT in shaping emissions may vary depending on institutional maturity or industrial composition. Although this study does not include separate country-level estimations due to methodological and space constraints, we acknowledge the importance of capturing these national differences. To address this, we provide comparative visual analysis of select variables to identify notable divergences across countries. We also note that future research should employ country-specific models, such as ARDL or FMOLS, to provide more tailored policy insights and validate the robustness of panel-level findings within distinct national contexts.
5. Conclusions and Policy Implications
This article discusses the determinants of CO2 emissions using 15 high-carbon-emitting countries’ panel data from the years 2000–2021. In this research, cross-sectional dependency tests, unit root tests, cointegration tests, and the Driscoll-Kraay standard errors (DKSE) method were used to conclude that energy policy, technology, and financial development are the determinants with noteworthy impacts on environmental sustainability. The findings of this study provide valuable contributions to knowledge about how interconnectedness between energy policy, financial markets, and industrial production supports sustainability goals. By identifying determinants of CO2 emissions, the study informs the broader discourse about climate change mitigation and pursuing energy transition policies. Understanding the roles of green energy implementation, energy efficiency improvements, and economic development ensures policymakers formulate evidence-led policy for economic growth without exacerbating environmental degradation. Moreover, the inclusion of sustainable resource management methods ensures long-term environmental balance. This study affirms the necessity for continuous research and policy formulation in order to meet the global commitments under the Paris Agreement and the United Nations Sustainable Development Goals (SDGs), notably Goal 7 (Affordable and Clean Energy) and Goal 13 (Climate Action).
To advance environmental sustainability and curb CO2 emissions, a multi-pronged policy framework is essential. First, accelerating the green energy transition requires substantial public and private investment in renewable energy sources such as wind, solar, and hydro power. Governments should provide incentives, such as tax credits, subsidies, and concessional financing, while simultaneously strengthening regulatory frameworks that mandate greater integration of renewables into national and international energy networks. Enhanced investment in research and development (R&D) is also necessary to improve the efficiency and affordability of clean energy technologies. Concurrently, reducing fossil fuel dependency is critical. This can be achieved by gradually phasing out fossil fuel subsidies and reallocating these funds to support clean energy infrastructure. Implementing carbon pricing mechanisms, including carbon taxes and emissions trading systems, will help internalize environmental costs and encourage efficient energy use. In parallel, governments should promote transitional fuels like natural gas, alongside the development of alternative energy sources such as bioenergy and green hydrogen.
Equally important is the mobilization of financial resources to support the green transition. This involves expanding green finance initiatives, including the issuance of green bonds and the creation of sustainable investment portfolios. Financial inclusion must also be encouraged by incentivizing lending to environmentally responsible firms and start-ups. Furthermore, governments should foster sustainable infrastructure projects through public-private partnerships that are backed by capital markets. Improving energy efficiency and innovation also offers a cost-effective pathway to emissions reduction. Enforcing mandatory efficiency standards across buildings and industries, adopting smart grid technologies, and promoting circular economy principles (such as recycling and energy recovery) can significantly reduce energy waste. In the industrial sector, the sustainable use of mineral resources must be prioritized. Policies should mandate environmentally sound mining practices, resource efficiency through recycling, and the integration of low-emission technologies via corporate social responsibility (CSR) programs. Finally, as ICT use continues to grow, managing its environmental footprint is vital. Policymakers should support the deployment of energy-efficient ICT infrastructure, encourage intelligent digital applications that minimize energy usage across sectors, and enforce sustainability reporting standards for major ICT stakeholders to monitor and reduce their carbon impact.
The empirical results presented in this study are relevant to both short-term and long-term policy. While some relationships, such as the impact of fossil fuel consumption and energy intensity on emissions, show immediate effects due to their direct operational nature, others, like financial development, ICT penetration, and the green energy transition, tend to influence emissions trajectories more gradually over time. The cointegration analysis confirms the existence of long-run equilibrium relationships among the variables, indicating that sustained policy interventions are necessary to achieve meaningful environmental improvements. For instance, promoting renewable energy adoption and green finance may not yield substantial results within a single fiscal cycle, but they are crucial for long-term decarbonization strategies. Therefore, policymakers should design integrated policy frameworks that account for both immediate emission control measures and systemic, forward-looking reforms capable of shaping long-run environmental outcomes.
While the paper provides comprehensive recommendations emphasizing renewable energy, financial mobilization, and energy efficiency, their successful implementation, particularly in low- and middle-income countries (LMICs), requires a pragmatic and context-sensitive approach. In many LMICs, fiscal constraints, institutional weaknesses, and limited technological capacity hinder direct adoption of advanced climate strategies. Therefore, realistic implementation should begin with the creation of enabling policy environments supported by international development institutions. Governments in LMICs can initiate renewable energy transitions through targeted public investment in solar mini-grids and off-grid renewable systems, particularly in rural and underserved regions. Multilateral support, such as concessional finance and technical assistance from organizations like the World Bank, UNDP, or the Green Climate Fund, can play a catalytic role in de-risking private sector participation in clean energy markets. Furthermore, establishing clear, long-term energy policies and regulatory frameworks will be essential to attract foreign direct investment (FDI) into renewable sectors.
For financial market development, LMICs should focus on building the institutional capacity to issue and regulate green financial instruments. This can include launching sovereign green bonds, developing taxonomies for sustainable finance, and creating credit enhancement mechanisms to support environmentally friendly small and medium-sized enterprises (SMEs). Financial literacy programs, central bank-led sustainable finance guidelines, and incentives for commercial banks to offer green credit lines can gradually build a green finance ecosystem. Simultaneously, enhancing energy efficiency must begin with affordable and enforceable standards for household appliances, lighting, and construction. Donor-backed programs can help train local firms in energy auditing and support the dissemination of efficient technologies through subsidies and awareness campaigns. Public-private partnerships (PPPs) for retrofitting public infrastructure, such as hospitals, schools, and transport systems, also represent cost-effective entry points. Ultimately, the success of these initiatives depends on strong governance, stakeholder engagement, and sustained international cooperation tailored to local socioeconomic and institutional contexts.
Author Contributions
Conceptualization, M.S. and F.T.S.; methodology, M.S.; software M.S.; validation, M.S. and F.T.S.; formal analysis, M.S.; investigation, M.S.; resources, M.S.; data curation, F.T.S.; writing—original draft preparation, M.S.; writing—review and editing, M.S.; visualization, M.S. All authors have read and agreed to the published version of the manuscript.
Funding
This research received no external funding.
Institutional Review Board Statement
Not applicable.
Informed Consent Statement
Not applicable.
Data Availability Statement
All data collected from the World Development Indicators (WDI) database: https://databank.worldbank.org/source/world-development-indicators (accessed on 20 September 2023).
Conflicts of Interest
The authors declare no conflicts of interest.
Abbreviations
The following abbreviations are used in this manuscript:
| GET | Green Energy Transition |
| FFC | Fossil Fuels Consumption |
| FD | Financial Development |
| MRC | Mineral Resources Consumption |
| EI | Energy Intensity |
| ICT | Information And Communication Technology |
| DKSE | Driscoll-Kraay standard errors |
| ADF | Augmented Dickey-Fuller |
| CADF | Cross-sectionally Augmented Dickey-Fuller |
| CIPS | Cross-sectionally Augmented Im, Pesaran, and Shin |
Appendix A
Table A1.
Summarizes Key Existing Studies.
Table A1.
Summarizes Key Existing Studies.
| Study | Region/Scope | Main Variables | Findings | Limitation | Our Contribution |
|---|---|---|---|---|---|
| [6] | Latin America and Caribbean | Renewable Energy, CO2 | Renewables reduce emissions | Limited country scope | Broader sample (15 countries) |
| [12] | Top 10 green economies | Green productivity, CO2 | Green growth lowers emissions | Focuses on top performers | Panel data from top emitters |
| [7] | Global (renewables and metals) | Renewables, Mineral demand, CO2 | Material needs offset benefits | Ignores regional dynamics | Incorporates minerals and technology |
| [14] | BRIC countries | FD, CO2 | FD initially increases CO2, later reduces | Applies only to BRIC | Explores FD effects in global panel |
| [10] | Asia-Pacific | FD, Globalization, CO2 | FD shows regional heterogeneity | No sector-specific analysis | Tests FD in carbon-intensive economies |
| [13] | Global (efficiency and emissions) | Energy Intensity, Emissions | Efficiency lowers CO2 | Macro-level focus only | Includes EI across 15 countries |
| [51] | Europe (ICT development) | ICT development, CO2 | ICT has mixed impact on CO2 | Single-region sample | ICT dual impact in all economies |
| [11] | Global panel of ICT and emissions | ICT, FD, Emissions | U-shaped ICT–CO2 relationship | Limited country depth | Captures asymmetries in ICT-CO2 link |
References
- Allan, R.P.; Arias, P.A.; Berger, S.; Canadell, J.G.; Cassou, C.; Chen, D.; Cherchi, A.; Connors, S.L.; Coppola, E.; Intergovernmental Panel on Climate Change (IPCC); et al. Summary for policymakers. In Climate Change 2021: The Physical Science Basis. Contribution of Working Group I to the Sixth Assessment Report of the Intergovernmental Panel on Climate Change; Cambridge University Press: Cambridge, UK, 2023; pp. 3–32. [Google Scholar]
- Dhakal, S.; Minx, J.C.; Toth, F.; Abdel-Aziz, A.; Figueroa Meza, M.J.; Hubacek, K.; Jonckheere, I.G.; Kim, Y.G.; Nemet, G.F.; Pachauri, S.; et al. Emissions Trends and Drivers (Chapter 2); Cambridge University Press: Cambridge, UK, 2022; pp. 215–294. [Google Scholar]
- United Nations. The Paris Agreement | United Nations. 2015. Available online: https://unfccc.int/process-and-meetings/the-paris-agreement/the-paris-agreement (accessed on 4 November 2016).
- Ileana, C.; International Energy Agency—IEA. The Europa Directory of International Organizations; Routledge: London, UK, 2022; pp. 701–702. [Google Scholar]
- Pierre, F.; O’sullivan, M.; Jones, M.W.; Andrew, R.M.; Hauck, J.; Landschützer, P.; Le Quéré, C.; Li, H.; Luijkx, I.T.; Olsen, A.; et al. Global carbon budget 2024. Earth Syst. Sci. Data Discuss. 2024, 2024, 1–133. [Google Scholar]
- Koengkan, M.; Fuinhas, J.A. Exploring the effect of the renewable energy transition on CO2 emissions of Latin American & Caribbean countries. Int. J. Sustain. Energy 2020, 39, 515–538. [Google Scholar]
- Wang, J.; Shahbaz, M.; Dong, K.; Dong, X. Renewable energy transition in global carbon mitigation: Does the use of metallic minerals matter? Renew. Sustain. Energy Rev. 2023, 181, 113320. [Google Scholar] [CrossRef]
- Ren, X.; Cheng, C.; Wang, Z.; Yan, C. Spillover and dynamic effects of energy transition and economic growth on carbon dioxide emissions for the European Union: A dynamic spatial panel model. Sustain. Dev. 2021, 29, 228–242. [Google Scholar] [CrossRef]
- Guo, J.; Zhou, Y.; Ali, S.; Shahzad, U.; Cui, L. Exploring the role of green innovation and investment in energy for environmental quality: An empirical appraisal from provincial data of China. J. Environ. Manag. 2021, 292, 112779. [Google Scholar] [CrossRef]
- Zaidi, S.A.H.; Zafar, M.W.; Shahbaz, M.; Hou, F. Dynamic linkages between globalization, financial development and carbon emissions: Evidence from Asia Pacific Economic Cooperation countries. J. Clean. Prod. 2019, 228, 533–543. [Google Scholar] [CrossRef]
- Wang, Q.; Hu, S.; Li, R. Could information and communication technology (ICT) reduce carbon emissions? The role of trade openness and financial development. Telecommun. Policy 2024, 48, 102699. [Google Scholar] [CrossRef]
- Awosusi, A.A.; Ozdeser, H.; Seraj, M.; Abbas, S. Can green resource productivity, renewable energy, and economic globalization drive the pursuit of carbon neutrality in the top energy transition economies? Int. J. Sustain. Dev. World Ecol. 2023, 30, 745–759. [Google Scholar] [CrossRef]
- Danish, R.U.; Khan, S.U.D. Relationship between energy intensity and CO2 emissions: Does economic policy matter? Sustain. Dev. 2020, 28, 1457–1464. [Google Scholar] [CrossRef]
- Tamazian, A.; Chousa, J.P.; Vadlamannati, K.C. Does higher economic and financial development lead to environmental deg-radation: Evidence from BRIC countries. Energy Policy 2009, 37, 246–253. [Google Scholar] [CrossRef]
- Chen, Y.; Shao, S.; Fan, M.; Tian, Z.; Yang, L. One man’s loss is another’s gain: Does clean energy development reduce CO2 emissions in China? Evidence based on the spatial Durbin model. Energy Econ. 2022, 107, 105852. [Google Scholar] [CrossRef]
- Wang, J.-H.; Mamkhezri, J.; Khezri, M.; Karimi, M.S.; Khan, Y.A. Insights from European nations on the spatial impacts of renewable energy sources on CO2 emissions. Energy Rep. 2022, 8, 5620–5630. [Google Scholar] [CrossRef]
- Apergis, N.; Payne, J.E. Renewable energy consumption and economic growth: Evidence from a panel of OECD countries. Energy Policy 2010, 38, 656–660. [Google Scholar] [CrossRef]
- Dogan, E.; Seker, F. Determinants of CO2 emissions in the European Union: The role of renewable and non-renewable energy. Renew. Energy 2016, 94, 429–439. [Google Scholar] [CrossRef]
- IRENA. Green Hydrogen Cost Reduction: Scaling up electrolysers to meet the 1.5 C climate goal; International Renewable Energy Agency: Abu Dhabi, United Arab Emirates, 2020. [Google Scholar]
- Sovacool, B.K. Contestation, contingency, and justice in the Nordic low-carbon energy transition. Energy Policy 2017, 102, 569–582. [Google Scholar] [CrossRef]
- Wang, X.; Yan, L. Driving factors and decoupling analysis of fossil fuel related-carbon dioxide emissions in China. Fuel 2022, 314, 122869. [Google Scholar] [CrossRef]
- Al-Mulali, U.; Saboori, B.; Ozturk, I. Investigating the environmental Kuznets curve hypothesis in Vietnam. Energy Policy 2015, 76, 123–131. [Google Scholar] [CrossRef]
- Lyu, L.; Fang, L. A study on EC translation of BP statistical review of world energy 2022 from the perspective of schema theory. J. Linguist. Commun. Stud. 2023, 2, 10–14. [Google Scholar] [CrossRef]
- Oliver, C.D.; Nassar, N.T.; Lippke, B.R.; McCarter, J.B. Carbon, fossil fuel, and biodiversity mitigation with wood and forests. J. Sustain. For. 2014, 33, 248–275. [Google Scholar] [CrossRef]
- Andres, R.J.; Gregg, J.S.; Losey, L.; Marland, G.; Boden, T.A. Monthly, global emissions of carbon dioxide from fossil fuel consumption. Tellus B Chem. Phys. Meteorol. 2011, 63, 309–327. [Google Scholar] [CrossRef]
- Asefi-Najafabady, S.; Rayner, P.J.; Gurney, K.R.; McRobert, A.; Song, Y.; Coltin, K.; Huang, J.; Elvidge, C.; Baugh, K. A multiyear, global gridded fossil fuel CO2 emission data product: Evaluation and analysis of results. J. Geophys. Res. Atmos. 2014, 119, 10213–10231. [Google Scholar] [CrossRef]
- Tubiello, F.N.; Salvatore, M.; Rossi, S.; Ferrara, A.; Fitton, N.; Smith, P. The FAOSTAT database of greenhouse gas emissions from agriculture. Environ. Res. Lett. 2013, 8, 015009. [Google Scholar] [CrossRef]
- Gurney, K.R.; Mendoza, D.L.; Zhou, Y.; Fischer, M.L.; Miller, C.C.; Geethakumar, S.; de la Rue du Can, S. High resolution fossil fuel combustion CO2 emission fluxes for the United States. Environ. Sci. Technol. 2009, 43, 5535–5541. [Google Scholar] [CrossRef]
- Wang, Z.; Yang, L. Indirect carbon emissions in household consumption: Evidence from the urban and rural area in China. J. Clean. Prod. 2014, 78, 94–103. [Google Scholar] [CrossRef]
- Liu, Z.; Ciais, P.; Deng, Z.; Lei, R.; Davis, S.J.; Feng, S.; Zheng, B.; Cui, D.; Dou, X.; He, P.; et al. COVID-19 causes record decline in global CO2 emissions. arXiv 2020, arXiv:2004.13614. [Google Scholar]
- IEA. Energy Efficiency 2021; International Energy Agency, Singapore: 2021. Available online: https://www.iea.org/reports/energy-efficiency-2021 (accessed on 1 November 2021).
- Fossil Fuels Accounted for 82% of Global Energy Mix in 2023 Amid Record Consumption: Report. Available online: https://earth.org/fossil-fuel-accounted-for-82-of-global-energy-mix-in-2023-amid-record-consumption-report/?utm_source=chatgpt.com (accessed on 26 June 2024).
- China and the, U.S. Are Responsible for Almost Half of Global Fossil Fuel Consumption. Available online: https://www.voronoiapp.com/energy/China-and-the-US-Are-Responsible-for-Almost-Half-of-Global-Fossil-Fuel-Consumption-1798?utm_source=chatgpt.com (accessed on 26 July 2024).
- Nazir, M.R.; Hashmi, S.H.; Fareed, Z. Financial development, income, trade, and urbanization on CO2 emissions: New evidence from Kyoto annex countries. J. Innov. Sustain. RISUS 2018, 9, 17–37. [Google Scholar] [CrossRef]
- Sadorsky, P. The impact of financial development on energy consumption in emerging economies. Energy Policy 2010, 38, 2528–2535. [Google Scholar] [CrossRef]
- Lv, Z.; Li, S.S. How financial development affects CO2 emissions: A spatial econometric analysis. J. Environ. Manag. 2021, 277, 111397. [Google Scholar] [CrossRef]
- Yu, X.; Kuruppuarachchi, D.; Kumarasinghe, S. Financial development, FDI, and CO2 emissions: Does carbon pricing matter? Appl. Econ. 2024, 56, 2959–2974. [Google Scholar] [CrossRef]
- Lei, X.; Yang, Y.; Alharthi, M.; Rasul, F.; Raza, S.M.F. Immense reliance on natural resources and environmental challenges in G-20 economies through the lens of COP-26 targets. Resour. Policy 2022, 79, 103101. [Google Scholar] [CrossRef]
- Ding, T.; Li, H.; Tan, R.; Zhao, X. How does geopolitical risk affect carbon emissions?: An empirical study from the perspective of mineral resources extraction in OECD countries. Resour. Policy 2023, 85, 103983. [Google Scholar] [CrossRef]
- Kane, S.; Miller, S.A. Mass, enthalpy, and chemical-derived emission flows in mineral processing. J. Ind. Ecol. 2024, 28, 469–481. [Google Scholar] [CrossRef]
- Huang, Z.; Ren, X. Impact of natural resources, resilient economic growth, and energy consumption on CO2 emissions. Resour. Policy 2024, 90, 104714. [Google Scholar] [CrossRef]
- Ali, S.H.; Giurco, D.; Arndt, N.; Nickless, E.; Brown, G.; Demetriades, A.; Durrheim, R.; Enriquez, M.A.; Kinnaird, J.; Littleboy, A.; et al. Mineral supply for sustainable development requires resource governance. Nature 2017, 543, 367–372. [Google Scholar] [CrossRef]
- Hund, K.; La Porta, D.; Fabregas, T.P.; Laing, T.; Drexhage, J. Minerals for Climate Action; World Bank: Washington, DC, USA, 2020. [Google Scholar]
- Hilson, G.; Basu, A.J. Devising indicators of sustainable development for the mining and minerals industry: An analysis of critical background issues. Int. J. Sustain. Dev. World Ecol. 2003, 10, 319–331. [Google Scholar] [CrossRef]
- Dogan, N.; Karay, M. The impact of renewable energy consumption and energy intensity on CO2 emissions from fuel combustions for the case of Turkey: A cointegration analyses. BİLTÜRK J. Econ. Relat. Stud. 2019, 1, 169–187. [Google Scholar]
- Yazdi, S.K.; Mastorakis, N. The dynamic links between economic growth, energy intensity and CO2 emissions in Iran. Recent Adv. Appl. Econ. 2014, 10, 140–146. [Google Scholar]
- Marra, A.; Colantonio, E.; Cucculelli, M.; Nissi, E. The ‘complex’transition: Energy intensity and CO2 emissions amidst technological and structural shifts. Evidence from OECD countries. Energy Econ. 2024, 136, 107702. [Google Scholar] [CrossRef]
- Ang, J.B. CO2 emissions, research and technology transfer in China. Ecol. Econ. 2009, 68, 2658–2665. [Google Scholar] [CrossRef]
- Zhang, X.-P.; Cheng, X.-M. Energy consumption, carbon emissions, and economic growth in China. Ecol. Econ. 2009, 68, 2706–2712. [Google Scholar] [CrossRef]
- Sorrell, S.; Dimitropoulos, J.; Sommerville, M. Empirical estimates of the direct rebound effect: A review. Energy Policy 2009, 37, 1356–1371. [Google Scholar] [CrossRef]
- Higón, D.A.; Gholami, R.; Shirazi, F. ICT and environmental sustainability: A global perspective. Telemat. Inform. 2017, 34, 85–95. [Google Scholar] [CrossRef]
- Chatti, W. Moving towards environmental sustainability: Information and communication technology (ICT), freight transport, and CO2 emissions. Heliyon 2021, 7, e08190. [Google Scholar] [CrossRef] [PubMed]
- Belkhir, L.; Elmeligi, A. Assessing ICT global emissions footprint: Trends to 2040 & recommendations. J. Clean. Prod. 2018, 177, 448–463. [Google Scholar]
- Houghton, J.W. ICT and the environment in developing countries: A review of opportunities and developments. In Proceedings of the IFIP International Conference on Human Choice and Computers, Brisbane, Australia, 20–23 September 2010; Springer: Berlin/Heidelberg, Germany, 2010. [Google Scholar]
- Aslan, J.; Mayers, K.; Koomey, J.G.; France, C. Electricity intensity of internet data transmission: Untangling the estimates. J. Ind. Ecol. 2018, 22, 785–798. [Google Scholar] [CrossRef]
- GeSI. Mobile Carbon Impact: How Mobile Communications Technology is Enabling Carbon Emissions Reduction. 2015. Available online: https://www.gesi.org/exclusive-previews/mobile-carbon-impact-how-mobile-communications-technology-is-enabling-carbon-emissions-reduction/ (accessed on 17 December 2015).
- Pesaran, M.H.; Xie, Y. How to Detect Network Dependence in Latent Factor Models? A Bias-Corrected CD Test. No. 11470; CESifo Working Paper, ECONSTORE; 2024.
- Pesaran, M.H.; Yamagata, T. Testing slope homogeneity in large panels. J. Econom. 2008, 142, 50–93. [Google Scholar] [CrossRef]
- Pesaran, M.H. A simple panel unit root test in the presence of cross-section dependence. J. Appl. Econom. 2007, 22, 265–312. [Google Scholar] [CrossRef]
- Westerlund, J. Panel cointegration tests of the Fisher effect. J. Appl. Econom. 2008, 23, 193–233. [Google Scholar] [CrossRef]
- Driscoll, J.C.; Kraay, A.C. Consistent Covariance Matrix Estimation with Spatially Dependent Panel Data. Rev. Econ. Stat. 1998, 80, 549–560. [Google Scholar] [CrossRef]
- Hussain, S.; Akbar, M.; Gul, R.; Shahzad, S.J.H.; Naifar, N. Relationship between financial inclusion and carbon emissions: International evidence. Heliyon 2023, 9, e16472. [Google Scholar] [CrossRef]
- Wang, Z.; Pham, T.L.H.; Sun, K.; Wang, B.; Bui, Q.; Hashemizadeh, A. The moderating role of financial development in the renewable energy consumption-CO2 emissions linkage: The case study of Next-11 countries. Energy 2022, 254, 124386. [Google Scholar] [CrossRef]
- Li, G.; Zeng, S.; Li, T.; Peng, Q.; Irfan, M. Analysing the effect of energy intensity on carbon emission reduction in Beijing. Int. J. Environ. Res. Public Health 2023, 20, 1379. [Google Scholar] [CrossRef] [PubMed]
- Zhang, X.; Shi, X.; Khan, Y.; Khan, M.; Naz, S.; Hassan, T.; Wu, C.; Rahman, T. The impact of energy intensity, energy productivity and natural resource rents on carbon emissions in Morocco. Sustainability 2023, 15, 6720. [Google Scholar] [CrossRef]
- Dou, X.; Wang, Y.; Ciais, P.; Chevallier, F.; Davis, S.J.; Crippa, M.; Janssens-Maenhout, G.; Guizzardi, D.; Solazzo, E.; Yan, F.; et al. Near-real-time global gridded daily CO2 emissions. Innovation 2022, 3, 100182. [Google Scholar] [CrossRef]
- Jha, R.; Lee, S.; Iyengar, S.; Hajiesmaili, M.H.; Irwin, D.; Shenoy, P. Emission-aware energy storage scheduling for a greener grid. In Proceedings of the Eleventh ACM International Conference on Future Energy Systems, Virtual Event, Australia, 22–26 June 2020. [Google Scholar]
- Victoria, M.; Zhu, K.; Brown, T.; Andresen, G.B.; Greiner, M. Early decarbonisation of the European energy system pays off. Nat. Commun. 2020, 11, 6223. [Google Scholar] [CrossRef]
- You, Z.; Li, L.; Waqas, M. How do information and communication technology, human capital and renewable energy affect CO2 emission; new insights from BRI countries. Heliyon 2024, 10, e26481. [Google Scholar] [CrossRef]
- Malmodin, J.; Lundén, D. The energy and carbon footprint of the global ICT and E&M sectors 2010–2015. Sustainability 2018, 10, 3027. [Google Scholar] [CrossRef]


Disclaimer/Publisher’s Note: The statements, opinions and data contained in all publications are solely those of the individual author(s) and contributor(s) and not of MDPI and/or the editor(s). MDPI and/or the editor(s) disclaim responsibility for any injury to people or property resulting from any ideas, methods, instructions or products referred to in the content. |
© 2025 by the authors. Licensee MDPI, Basel, Switzerland. This article is an open access article distributed under the terms and conditions of the Creative Commons Attribution (CC BY) license (https://creativecommons.org/licenses/by/4.0/).