Article

Energy and Environmental Valorisation of Residual Wood Pellet by Small Size Residential Heating Systems

by
Valentina Coccia
1,2,*,
Ramoon Barros Lovate Temporim
1,
Alessandro Paglianti
3,
Alessia Di Giuseppe
1,
Franco Cotana
1,2 and
Andrea Nicolini
1,2
1
CIRIAF—Interuniversity Research Centre on Pollution and the Environment “Mauro Felli”, Via G. Duranti, 67, 06125 Perugia, Italy
2
Engineering Department, UNIPG—University of Perugia, Via G. Duranti, 93, 06125 Perugia, Italy
3
Dipartimento di Chimica Industriale “Toso Montanari”, UNIBO—Università di Bologna, Via Zamboni, 33, 40126 Bologna, Italy
*
Author to whom correspondence should be addressed.
Sustainability 2025, 17(9), 3814; https://doi.org/10.3390/su17093814
Submission received: 25 February 2025 / Revised: 15 April 2025 / Accepted: 22 April 2025 / Published: 23 April 2025
(This article belongs to the Section Environmental Sustainability and Applications)

Abstract

:
Particulate matter (PM) emissions from combustion-based heating systems have been identified as a major contributor to environmental issues and human health risks. Particularly, small-scale residential combustion was responsible for 58% of the total PM2.5 emissions in Europe in 2020, with domestic heating using wood-based fuels accounting for around 56% of soot emissions. Reducing PM2.5 emissions has become a major goal of European environmental policies, which have included it among the key targets of the Zero Pollution Action Plan. In this framework, this study presents a performance analysis of a newly developed PM abatement system consisting of a passive cyclone abatement system (PCAS) specifically designed for small residential pellet stoves. The system was tested under steady-state and non-steady-state operating conditions. The experimental results showed that the PCAS abatement system effectively captured PM at a rate of 10.64 mg/MJ, with great efficiency in capturing particles ≥ 10 µm. The heavy metal content in the captured material was below the limit values for agricultural application-destined soil. A Life Cycle Assessment showed that the PCAS could achieve net-zero PM emissions in 1 year and 8 months. Finally, the economic analysis revealed that the PCAS is significantly more cost-effective: over a 10-year period, it could save up to €4000 in installation, maintenance, and energy costs compared to conventional active systems. These findings highlight the effectiveness of this design of PCAS as in reducing PM emissions from residential heating systems and provide valuable insights for the development of future abatement systems.

1. Introduction

The world is currently facing an unprecedented energy crisis, making the need for sustainable energy sources more critical than ever. Lignocellulosic biomass has garnered significant attention in recent years due to its potential as a renewable and sustainable resource for energy production. Biomass is considered carbon-neutral, as it does not contribute to net carbon dioxide emissions in the environment. Residual lignocellulosic biomass can be utilized in various ways, such as producing biofuels, biochemicals, and thermal or electrical energy [1,2]. Pelletizing the fuel material is an effective method that enhances energy conversion efficiency, simplifies handling and storage, and reduces air pollutant emissions compared to the direct combustion of unprocessed biomass [3,4,5,6]. The production of pellets is regulated by the International Organization for Standardization (ISO) 17225-series [7]. The use of pellets as fuel has enabled the development of automated furnaces that are easier to operate and offer higher precision in fuel distribution compared to other wood fuel materials such as wood chips. Pelletized fuel is also highly adaptable and can be utilized in various systems, ranging from small-scale furnaces with capacities of up to 100 kW to large-scale furnaces exceeding 1000 kW. Global pellet production has risen by around 14%, with Europe and North America accounting for the majority of both production and consumption [8,9,10]. A record amount of 23.1 million tonnes of pellets was produced by the European Union (EU) in 2021, primarily for co-firing with wood and coal in Germany and the Netherlands. As a result of the energy crisis triggered by the war in Ukraine and the significant surge in fuel prices in 2022, governments such as those of Germany and France have been encouraging the use of boilers and other residential thermal systems fuelled by pellets. It is expected that the demand for pellets will rise from the current actual requirement of 24.5 million tonnes [11]. Even if it is still considered a profitable way of valorisation, combustion of biomass, pellets, as well as fossil fuels produces various chemical species depending on the combustion fuel such as CO2, NOX, Volatile Organic Compounds (VOCs), Polycyclic Aromatic Hydrocarbons (PAHs), ashes and Particulate Matter (PM) that are harmful for the ecosystem and human health. When compared to fossil fuels, the combustion of lignocellulosic biomass emits lower amounts of pollutant species in all cases except for PM content, which can be equal to or higher than that of fossil fuels [12,13,14,15,16]. The situation is different for pellet stoves, which have a significantly lower PM emission. Wood stoves, for instance, have a PM emission range of 20 to 1, mg/MJ, while pellet-fuelled stoves perform better, with a PM emission ranging from 3 to 140 mg/MJ [17]. However, despite their better performance, the widespread use of pellet systems in urban areas may exceed PM emission limits, posing a risk to human health. Recent studies have highlighted both the growing diffusion and persistent critical issues of biomass pellet residential heating systems, including issues related to PM emissions, operational efficiency, and maintenance practices by users [18,19]. PM is a major contributor to the health risks associated with air pollution, as it has been linked to various health problems, including cardiovascular and respiratory diseases [20], asthma and other allergy-related conditions [21], skin disorders [22], reduced lung function [23], and increased blood pressure [24]. The following subsections describe the legislative and technological contexts of this research.

1.1. Legislative Aspects of Air Quality and Emission Reduction Issues

PM pollution continues to be a major environmental and health concern in Europe, with limits set by the EU Directive 2008/50/EC [25]. However, these limits are frequently exceeded in the suburban areas of 22 European member countries [17]. It is estimated that small-scale residential combustion was responsible for 58% of the total PM2.5 emissions in Europe in 2020 [26], with domestic heating (primarily using wood materials) accounting for around 56% of soot emissions [6,27]. Biomass combustion for residential heating is a significant source of atmospheric pollutants, including PM emissions, in many countries worldwide [17,28,29,30,31,32,33,34]. The 2017 “Air Quality in Europe” report revealed that PM10 levels surpassed the daily limit value (50 μg/m3) for 17% of the urban population in the EU-28. This percentage increased to 44% when considering the World Health Organization (WHO) Air Quality Guidelines (AQG) threshold of 20 μg/m3. Furthermore, 8% of the EU-28 population was exposed to PM10 concentrations exceeding the annual limit value (25 μg/m3), and around 77% were exposed to PM2.5 levels surpassing the WHO AQG limit of 10 μg/m3. Domestic fuel burning is also a significant source of PM emissions in other regions, including the Americas (25%), Africa (34%), Northwestern Europe (22%), Southern China (21%), Southeastern Asia (19%), and India (16%) [17]. PM is classified into two categories: primary and secondary particles. Primary particles are defined as solid or liquid materials directly emitted into the atmosphere, while secondary particles are chemical species that transform into pollutants through in-air chemical reactions [35]. The PM emissions from pellets are strongly affected by their ash content, which can accumulate on the burner and reduce the combustion efficiency [36,37]. In addition, the accumulation of inorganic materials such as alkaline metals can increase PM emissions [3,36,37,38,39]. The physical characteristics of pellets, such as length, diameter, fine content, and particle density, can significantly impact particulate emissions because they affect the fuel supply to the burner and the combustion behavior. PM mainly consists of organic debris, elemental carbon (e.g., soot), and fine ash (e.g., inorganic compounds). Incomplete combustion results in organic matter and soot, while inorganic materials in fuel ashes lead to the production of fine ash particles [37]. PM10 contains high metal concentrations that are widespread in the environment, with copper, cadmium, nickel, zinc, and lead being the typical metal content [40,41]. The PM2.5 fraction can also contain metals such as arsenic, antimony, lead, cadmium, and mercury, depending on the wood material used. The European Union Air Quality Directives 2004/107/CE and 2008/50/EC have set air quality objectives, including annual limit values for As (6 ng/m3), Cd (5 ng/m3), Ni (6 ng/m3), and Pb (0.5 μg/m3) [25,42].

1.2. Literary of the Technologies for Reducing Solid Emissions

Various strategies have been explored in the literature to reduce PM emissions in the atmosphere, including direct measures aimed at optimizing the combustion process and improving fuel quality. These measures include adjusting air supply design, pre-heating primary combustion air, modifying household behavior, and using alkali compounds [43,44,45,46]. Several indirect PM abatement strategies have been largely investigated in recent decades. These include flue gas cleaning technologies such as electrostatic precipitators, condensing scrubbers, catalytic converters, bag filters, and cyclone separators [16]. Although each of these systems has advantages in terms of removal efficiency, they also have some limitations, such as high operating costs, complex maintenance, or reduced treatment efficiency. In addition, these systems have been found to be cost-effective only when applied on a large scale. While efforts have been made to adapt electrostatic precipitators for small-scale boilers (around 30 kW), they are not yet cost-effective for smaller systems. Therefore, there is a need for systems specifically designed to reduce emissions that are both viable and easy to implement in small-scale pellet stoves [16,17]. Cyclones, characterized by their simple design, low capital cost, reduced maintenance cost, and high adaptability, are a suitable option for residential environments. In a cyclone system, PM separation is achieved through the centrifugal force generated by the rotating gas stream, which pushes the particles out of the cyclone wall [47]. Therefore, to address the high PM emissions associated with small pellet stoves installed in residential environments, this study proposes a prototype system developed and tested to minimize PM emissions in the atmosphere. The system is a passive cyclone abatement system (PCAS) that focuses on minimizing primary particulate emissions. The novelty of this research lies in the study of a new device that can function without energy requirements and can be applied to small-sized applications. It is a reverse-flow, small-scale cyclone with a passive tangential inlet that eliminates the need for complex installations, such as electrical structures. The PCAS was designed to be coupled to the gas exhaust system in residential buildings with limited physical space available for modifications. A performance analysis of the PCAS prototype for reducing PM in small-scale heating systems is also presented in this paper. along with a Life Cycle Assessment (LCA) methodology, which was used to measure the PM emissions from the cyclone’s manufacturing process and to calculate the point at which net-zero emissions could be achieved, thus supporting the sustainability of this new system.

2. Materials

2.1. Pellets

To establish a quality standard for the fuel material, a commercially certified Din Plus pellet was used. The composition of the pellets was declared as made of resinous wood material, with a diameter of 6 mm and a length of 10–30 mm, moisture content of 8%, low calorific value of 5.2 kWh/kg, and ash content < 0.6%. The fuel material was characterized in terms of ash content and humidity using a thermogravimetric analyser (LECO TGA 701) [48]. The Higher Heat Value (HHV) was determined through a calorimeter (LECO AC-350) [49]. the Lower Heat Value (LHV) was calculated based on the methodology for Energy Input Calculations defined by the Environmental Protection Agency (EPA) [50].

2.2. Layout and Operations of the PCAS

The system that was tested consisted of two main components: a small-scale heating system (a pellet residential scale stove) and the PCAS that was coupled to it. This section provides a description of the system’s features and how they operate.

2.2.1. Pellet Stove

The experiment was conducted on a pellet stove (SOFIA, Last Calor, San Bonifacio-VR, Italy) [51], with a power output of 6.73 kW and a yield of 90.98%. The pellet stove is shown in Figure 1. Figure 1a shows the SOFIA pellet stove by Last Calor installed on site, positioned on a weighing platform to monitor pellet consumption. Figure 1b provides an overview of the flue gas outlet and PCAS, with the detailed components of the PCAS shown in Figure 1c. Finally, the design specifications of the PCAS are illustrated in Figure 1d, where ϕ indicates the pipe diameter, β the cone angle, and the arrows the flux direction.

2.2.2. PCAS Characteristics and Innovative Aspects

The PCAS PM reduction system was intended to be connected in line with the output flow from the combustion process. The dimensions and appearance are shown in Figure 1b–d, according to the design specifications. The cyclone body, which is made of stainless steel, can be easily connected to an existing exhaust pipe structure. The dimensions of the structural components are listed in Table 1. The PCAS is designed with a passive tangential inlet, which eliminates the need for complex electrical components, making it more suitable for residential applications, where space and cost constraints are significant. In contrast, traditional cyclone systems require more intricate setups and additional power input. Furthermore, the PCAS is optimized for smaller-scale residential heating systems, unlike conventional systems that are typically designed for larger industrial applications. A thermocouple was placed at the upper part of the cyclone body to measure the temperature of the smoke downstream, i.e., after passing through the abatement system. The PM was collected in a container located at point 3 in Figure 1d, which is at the bottom of the cyclone body.
Table 1 lists the PCAS structure components and their dimensions. All data are reported in millimetres (mm). The diameter is referred to as the nominal diameter. The cyclone system was engineered, taking into consideration the established standard geometric proportions of the Lapple and Swift designs [52], with a cone angle β of 75° (Figure 1d). To ensure optimal performance and coupling in small-scale residential chimney systems, a diameter of around 300 mm was considered. Therefore, the dimensions were meticulously determined based on a cyclone body diameter of 220 mm. The proportions used in this design varied from 91% to 130% when compared to the standard dimensions documented in the literature. These thoughtful adjustments enabled seamless integration with the specific requirements of smaller residential-exhaust systems. The theoretical efficiency of the PCAS system was determined using the cut-point method (dpc), specifically the Lapple model for the cut-point, which is related to the aerodynamic equivalent diameter of the particle collected with 50% efficiency. The Lapple model for the cut-point is calculated using Equation (1).
d p c = 9 μ W 2 π N e V i 1 2
where μ is the gas viscosity (kg/m/s), W is the width of the cyclone inlet duct (m), Ne is the number of effective turns, and Vi is the gas inlet velocity (m/s).
The number of effective turns (Ne) was calculated using Equation (2):
N e = 1 H c L c + Z c 2
where Hc is the height of the cyclone inlet duct (m), Lc is the length of the cyclone body (m), and Zc is the length of the cyclone cone (m).

3. Methods

The performance testing of the PCAS to reduce PM was conducted in two stages. Firstly, a steady-state run condition lasting 283 min (4 h and 43 min) was carried out, with approximately 4 h of effective steady-state operation. Secondly, a non-steady-state test was performed, in which the system alternated in a 4-stage cycle. Each stage ran for 120 min, followed by 40-min intervals for cooling down and performing a brief cleaning step on the grate to remove ashes and prevent the lighter ash fraction from being carried away with the gas flow. The pellet mass flow was adjusted to achieve a maximum power output of 6.73 kW within a temperature range of 130–140 °C. Throughout each operation, the temperature, time, quantity of pellets consumed, and mass of the captured PM were monitored. K-type thermocouples (Watlow 50-1300—Watlow Italy, s.r.l. Manufactures, Via Meucci 14 20094 Corsico Milano, Italy 20135) [53] were employed to measure the temperature at the upper section of the cyclone system, while a weight bridge (Avery Weight-Tronix-E1005—Avery Weigh-Tronix, Foundry Lane, Smethwick, West Midlands B66 2LP England) [54] was used to measure the pellet consumption during stove operation. The steps for both regimes are shown in Figure 2.

3.1. PM and Combustion Residues: Granulometry, Heavy Metal and Efficiency Analysis

The PM mass captured by the PCAS was quantified using a precision balance (Scout Pro, Sartorius Sartorius Campus|Headquarters Otto-Brenner-Str. 20, Göttingen, Germany) [55]. The metal element content of the PM samples and residual ashes was analyzed using an optical emission spectroscopy analyzer (PerkinElmer Optima 8000 ICP-OES Spectrometer PerkinElmer, Inc. 940 Winter Street Waltham, MA, USA) equipped with a PerkinElmer S10 Autosampler [56], in accordance with the EN 15359:2011 standard [57]. These analyses were conducted in triplicate to determine the content of environmentally harmful compounds, such as arsenic (As), cadmium (Cd), chromium (Cr), copper (Cu), lead (Pb), mercury (Hg), nickel (Ni), and zinc (Zn). Granulometry measurements were performed using a Spraytec laser diffraction system (Malvern Panalytical, Malvern, UK) [58]. The laser granulometer enables the evaluation of the volumetric and numerical distribution of PM, as well as the determination of the Sauter diameter (d32) and the De Brouckere diameter (d43). The Sauter diameter represents the surface-volume mean diameter, which maintains the same ratio of volume to surface area for the entire particle ensemble. The De Brouckere diameter corresponds to the volume-weighted mean diameter, which is calculated by averaging the particle size distribution weighted by the volume. The arithmetic average diameter (d10), Sauter diameter, and De Brouckere diameter were determined using Equations (3)–(5), respectively.
d 10 = i = 1 N x i d i i = 1 N x i
d 32 = i = 1 N x i d i 3 i = 1 N x i d i 2
d 43 = i = 1 N x i d i 4 i = 1 N x i d i 3
where xi is the fraction of the total particle number associated with diameter di, and N is the number of discrete size classes used.

3.2. Life Cycle Assessment

To assess the environmental impacts associated with the life cycle of the cyclone system, the LCA methodology was implemented following the guidelines of ISO 14040 and 14044, using the commercial software SimaPro V9.3.0.2 [59,60,61]. The objective of this study was to estimate PM emissions throughout the life cycle of a cyclone system and determine the point at which net-zero PM emissions could be achieved through its implementation. The functional unit chosen was the abatement system itself, allocating the impacts to one unit of the system. The system boundaries encompassed all materials, processes, and energy associated with the manufacturing, installation, and end-of-life stages of the cyclone, following a cradle-to-grave approach. The Life Cycle Inventory was developed based on material flows and processes using the Ecoinvent V3.8 database [62]. The Life Cycle Impact Assessment was calculated based on the methods ReCiPe V1.1 [63] at the midpoint level, Individualistic perspective, which is based on the short-term interest, since was measured the PM emission at the moment of the manufacturing process, i.e., the primary aerosols; and Environmental Prices V1.02/European Environmental Prices were utilized for the assessment. The ReCiPe Life Cycle Assessment (LCA) method is a widely used approach for evaluating the environmental impact of a product or system across its entire life cycle, from production to disposal. One key reason for using the ReCiPe LCA method in your study is its ability to provide a comprehensive analysis of the environmental performance of the Passive Cyclone Abatement System (PCAS), particularly in terms of its sustainability

4. Results and Discussion

4.1. Pellet Characterisation

Proximate analysis is a method used to determine the basic composition of a fuel, typically assessing four key components: humidity, ashes, volatile matter, and fixed carbon. The analysis showed that the pellets had an average moisture content of 5.50 ± 0.10%, which is lower than the supplier-reported value of 8% and below the maximum 10% limit set by the quality standards. Additionally, this value is within the 7.6–10.1% range found for other pellet types [39]. Moisture content is crucial for the storage, net calorific value, combustion temperature, and efficiency. The average ash content was 0.42 ± 0.02%, which was below the stated maximum of 0.6%. The ash content in various pellets ranges from 0.8% to 5.5%, and its impact on PM emissions is significant. Lower ash content reduces the frequency of residue removal from the combustor bed, preventing airflow disruption and minimizing particulate release through flue gas [39]. The average higher heating value of the pellets was 20.20 MJ/kg, which is consistent with values reported in the literature [39,64].

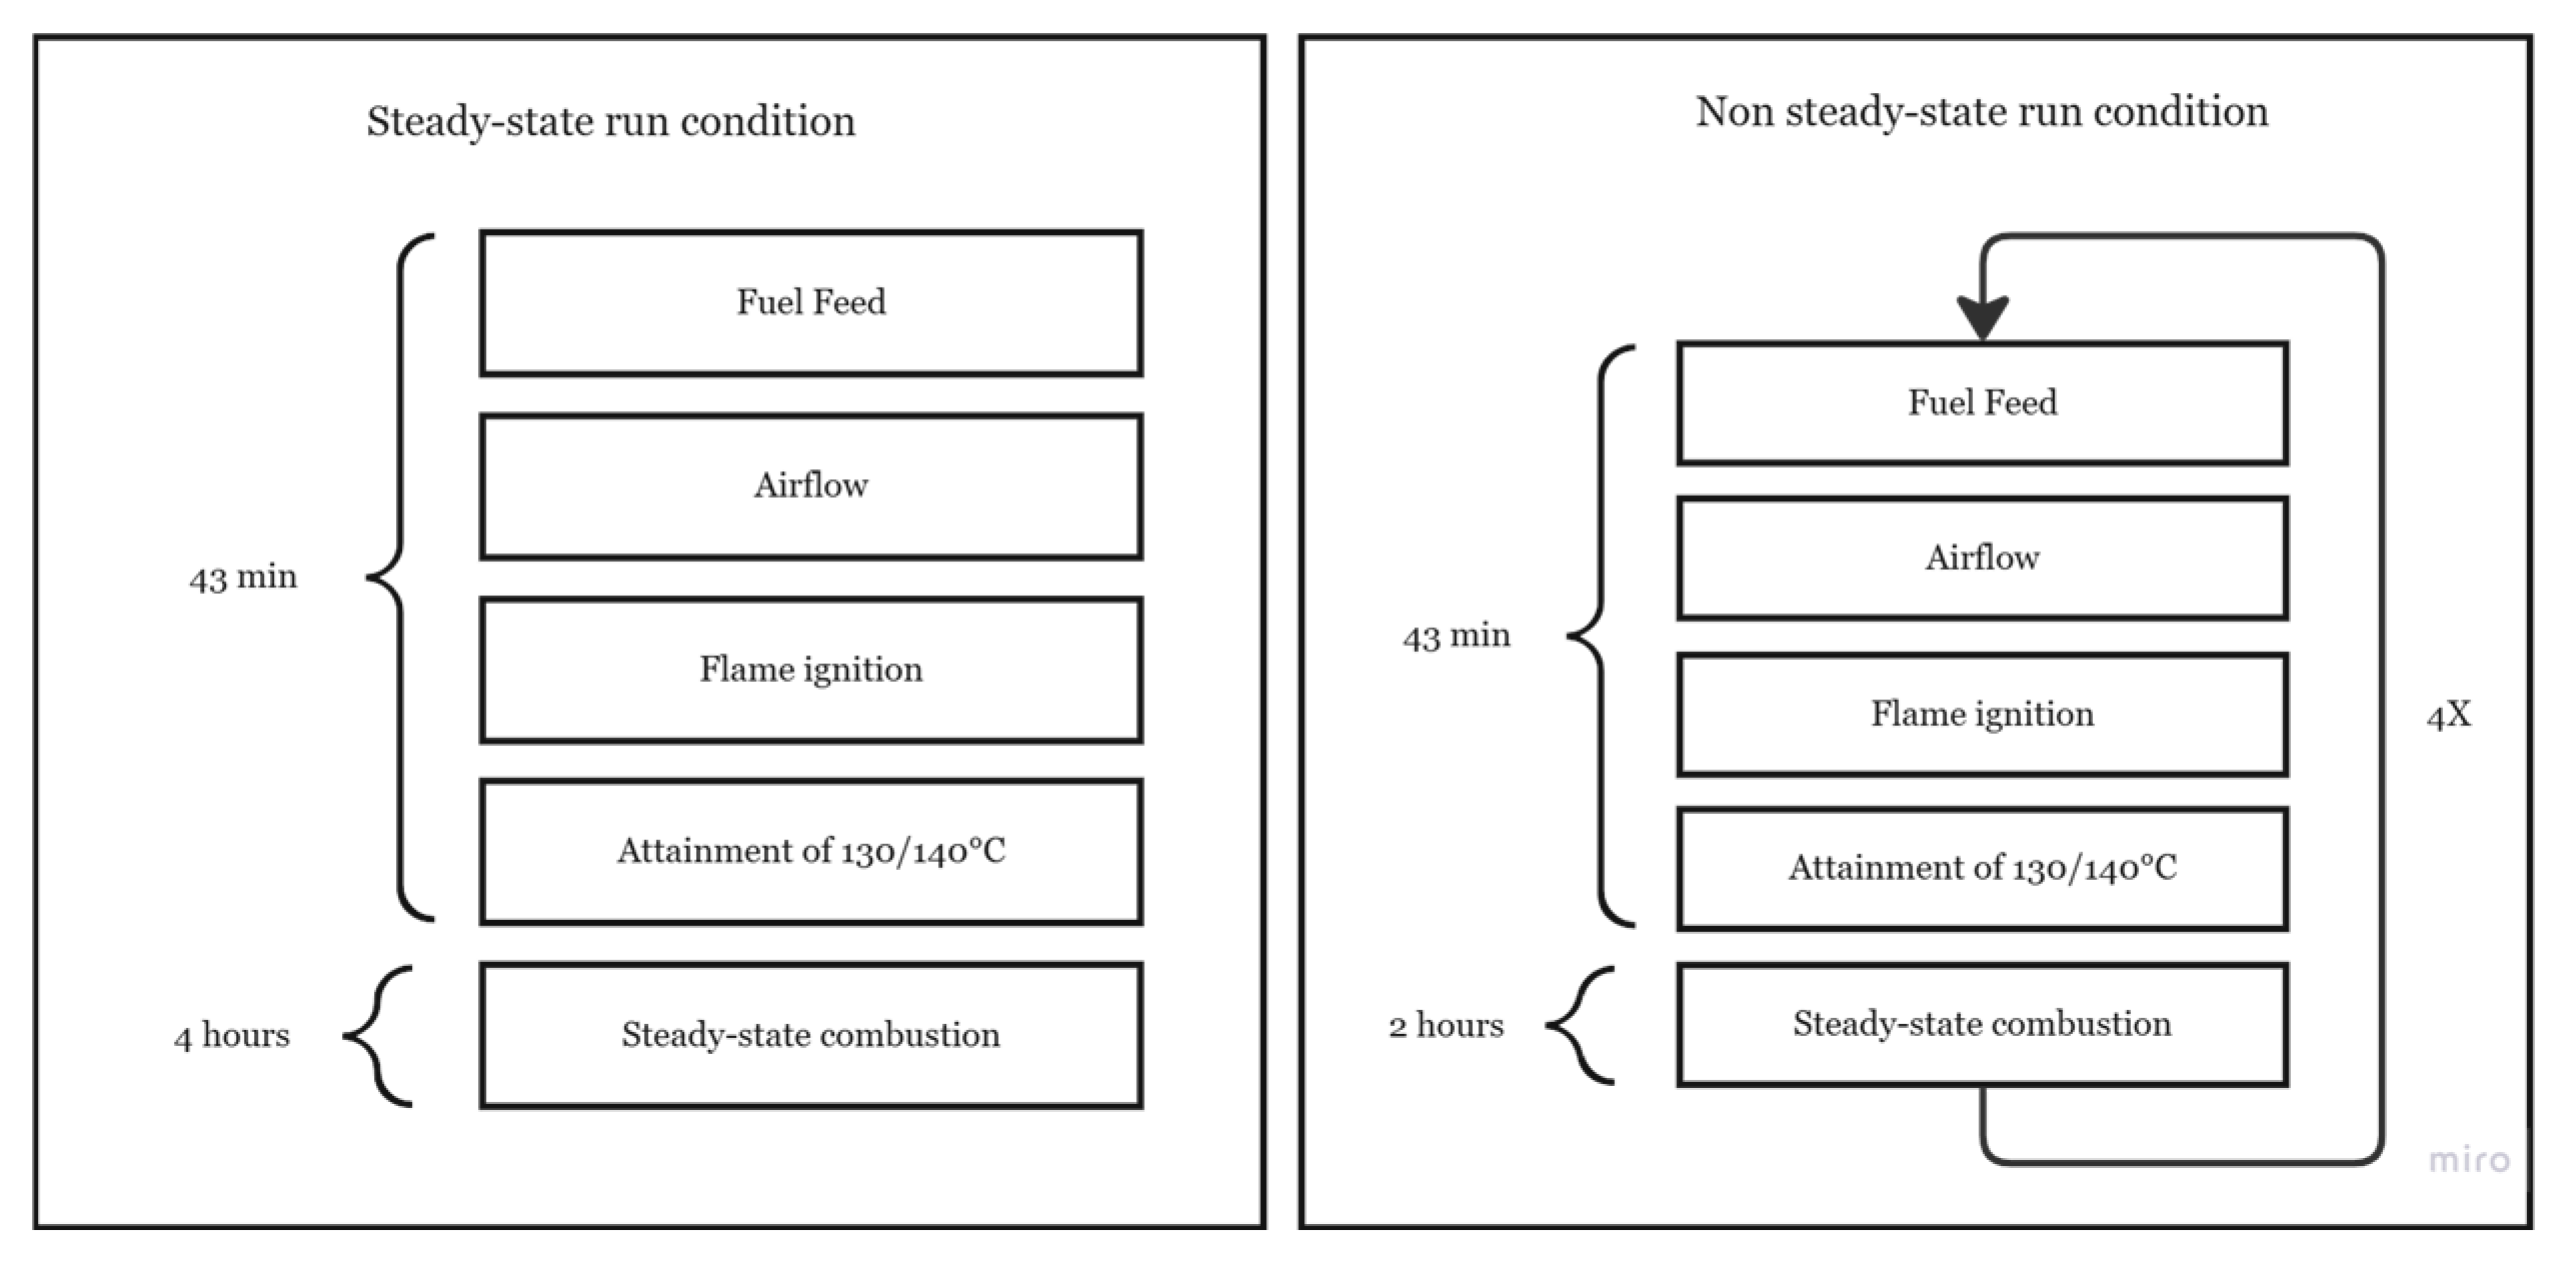
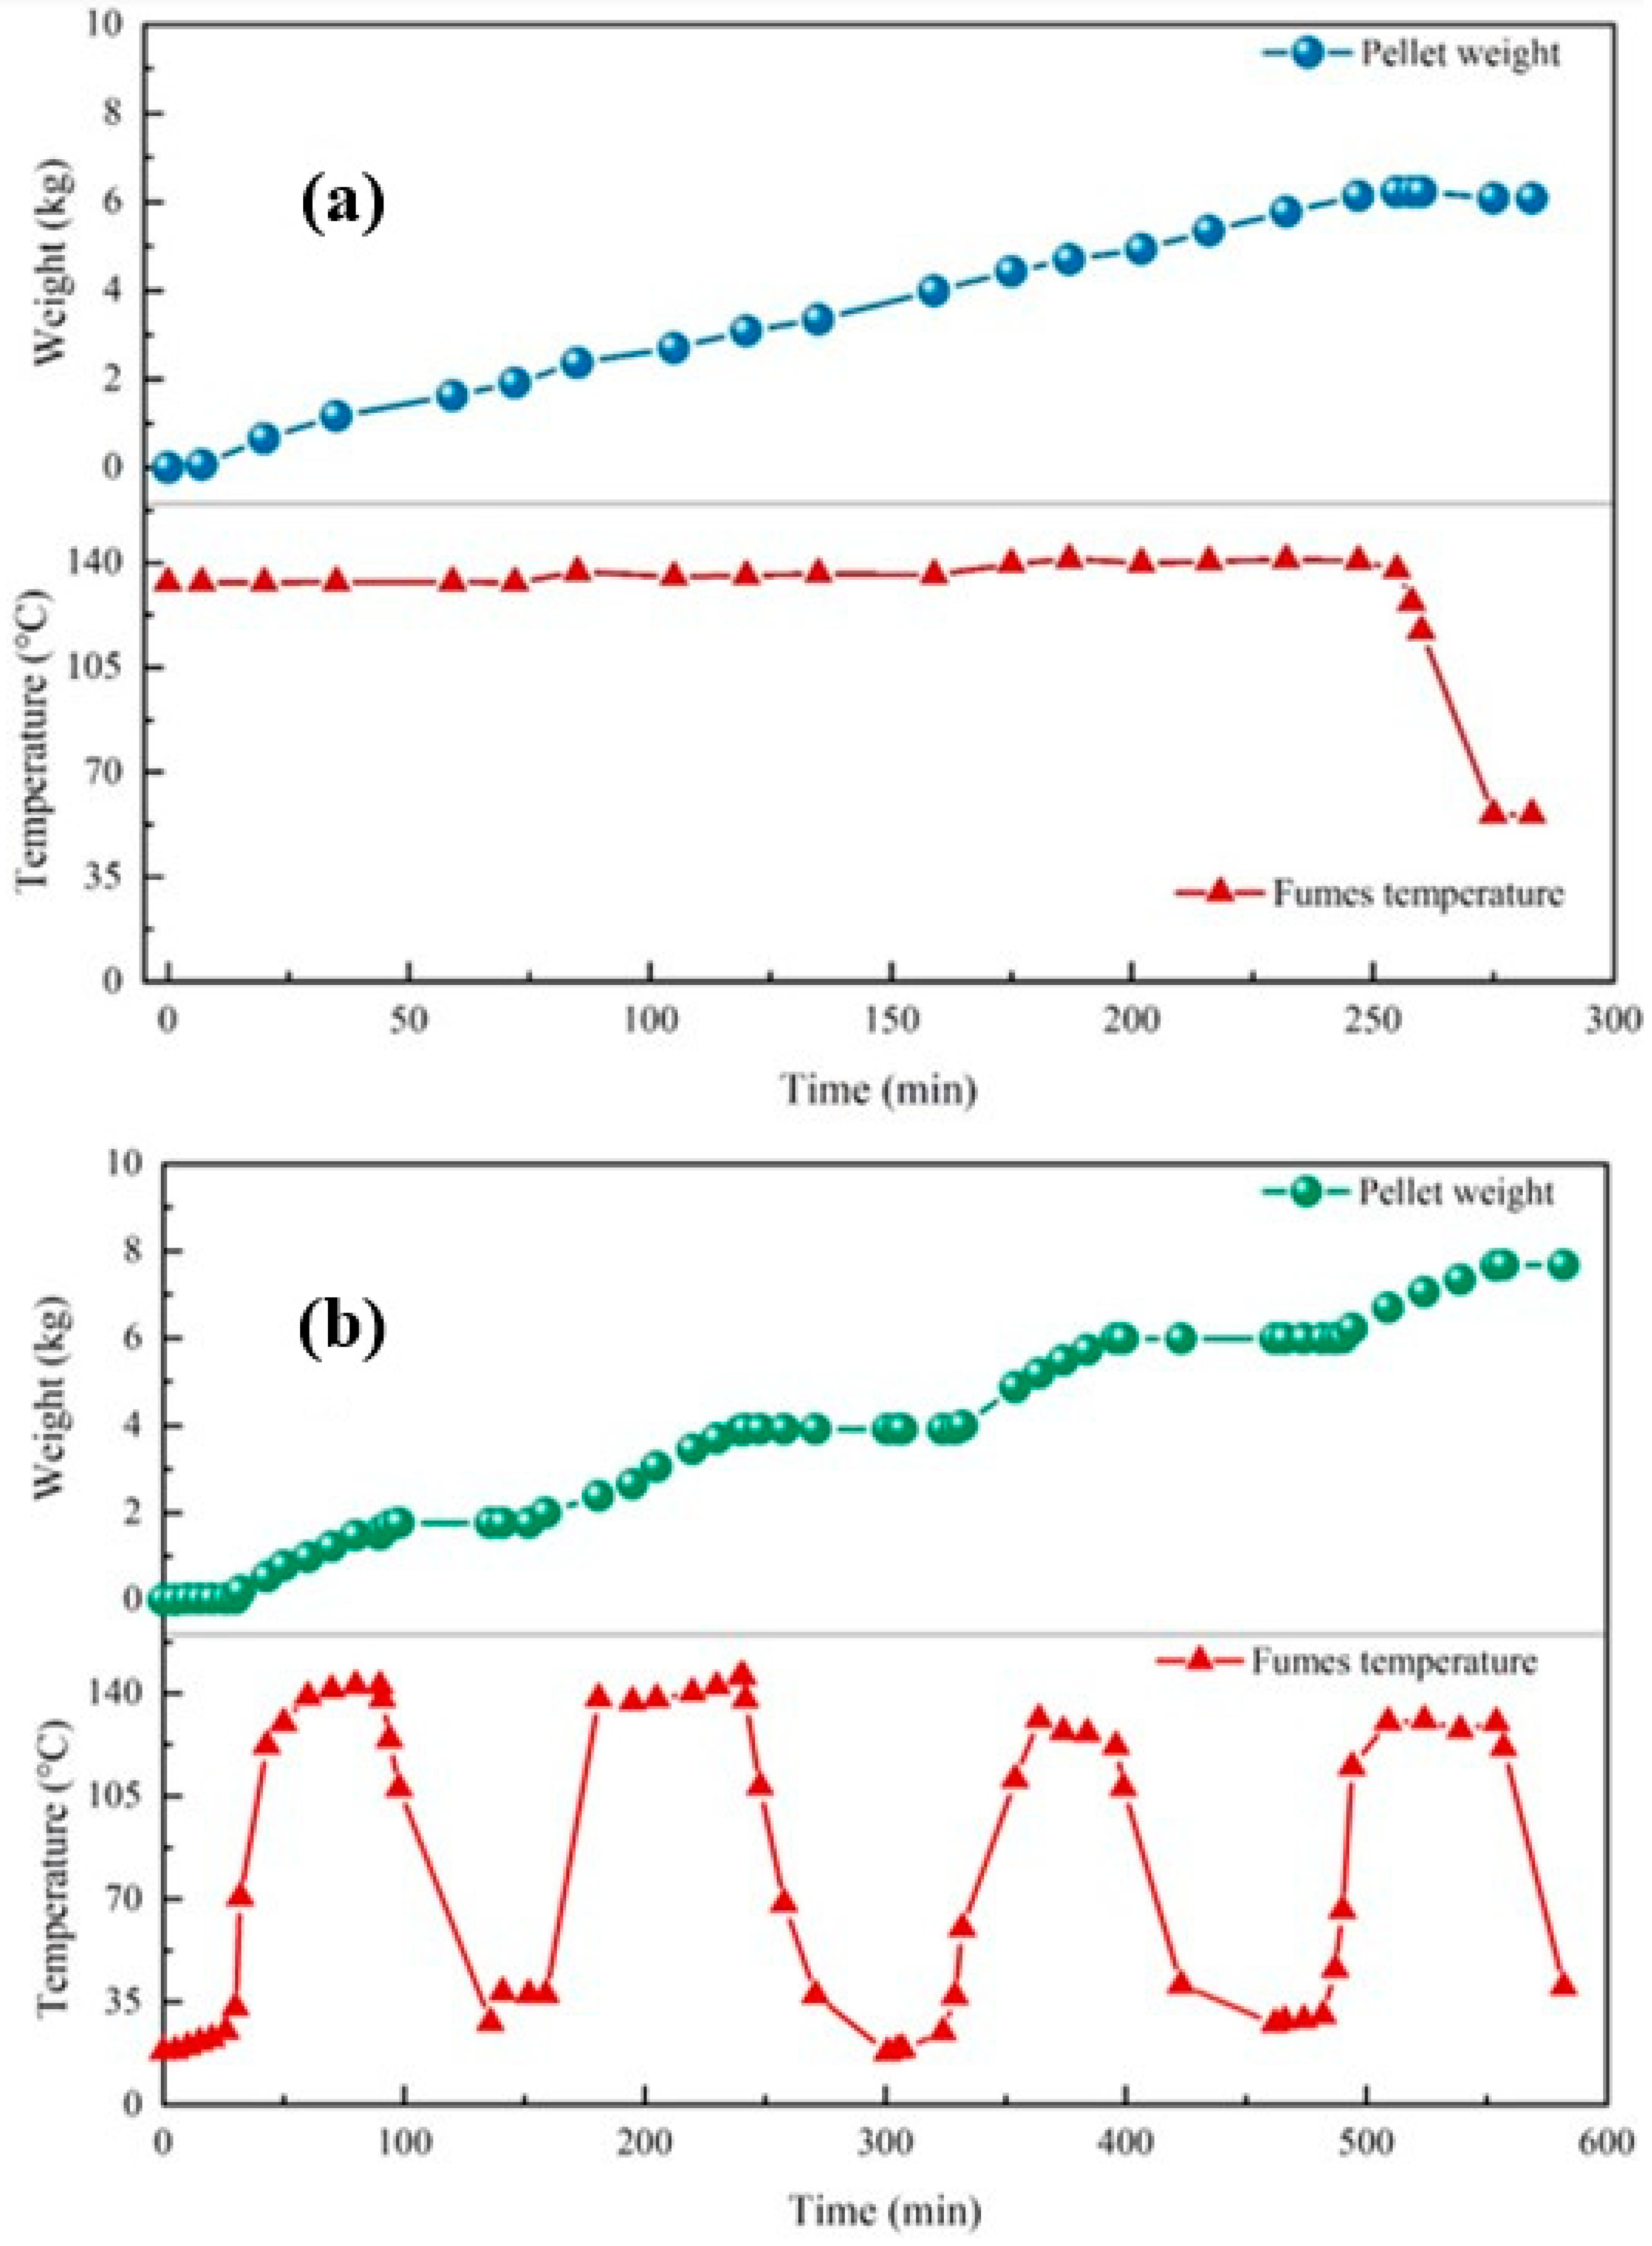
4.2. Operational Parameters

Time, temperature, and pellet consumption were monitored during both steady-state and non-steady-state runs. In the steady-state run, a stable mode was maintained for approximately 4 h, with a feed rate of 1.47 kg of pellets per hour, resulting in a total consumption of 6.08 kg of pellets and 0.32 g of PM captured by the PCAS. The PM capture rates per unit of thermal energy output and pellets consumed were 54.89 mg of PM per kg of pellets and 3.46 mg of PM per MJ, respectively. The relationship between pellet consumption over time and flue gas temperature under steady-state and non-steady-state operating conditions is presented in Figure 3a,b, respectively.
The steady-state run, shown in Figure 3a, presents the pellet consumption (in kg) over time (in minutes), along with the corresponding fume temperature (in °C) measured at the PCAS gas outlet. During this run, a pellet feed rate of approximately 1.47 kg/h was used, resulting in a total consumption of 6.08 kg, and the temperature was maintained between 130 and 140 °C. Similarly, the non-steady-state run achieved a steady-state operation for about 4 h. In this case, a higher pellet feed rate of 1.88 kg/h was used, which led to a total pellet consumption of 7.92 kg. The system captured 0.952 g PM. The PM capture rates per thermal energy output and per pellet consumed were 127.20 mg of PM per kg of pellets and 10.64 mg of PM per MJ, respectively. The results of this run are shown in Figure 4. The non-steady-state regime run, shown in Figure 3b, presents the pellet consumption (kg) over time (minutes) in relation to the fume temperature (°C) measured at the PCAS gas outlet. A pellet feed rate of approximately 1.88 kg/h was used, totaling 7.92 kg of pellets. During this run, the temperature was maintained between 130 °C and 140 °C across four cycles, each separated by cooling and cleaning phases. The experiment demonstrated that operating in the non-steady-state regime led to a 30% increase in pellet consumption, while the heat output remained similar to that of the steady-state regime. However, the PM capture rate was twice as high in the non-steady-state regime, likely due to increased disturbances during the transient stages when the ventilation and load systems were functioning more intensively. Unstable phases, particularly the startup phase, were found to significantly impact emission factors, resulting in a 72% increase in PM emissions compared with the steady-state regime [65]. Despite the higher emissions, the non-steady-state run was chosen for further evaluation, as it better represents the typical operation of residential scale systems. In studies of pollutant emissions, non-steady-state analysis is often included due to its closer alignment with real-world usage patterns [17]. Uniform feeding of biomass to the thermochemical section has the potential to reduce and control both gaseous and solid emissions [45]. Improving the consistency (constant flow rate) of the pellets led to a decrease in the emissions of carbon monoxide (CO), PM, and nitrogen oxides (NOx) in the flue gases. Another possibility for controlling emissions is to couple the flue gas pipe with a forced air extractor [43].

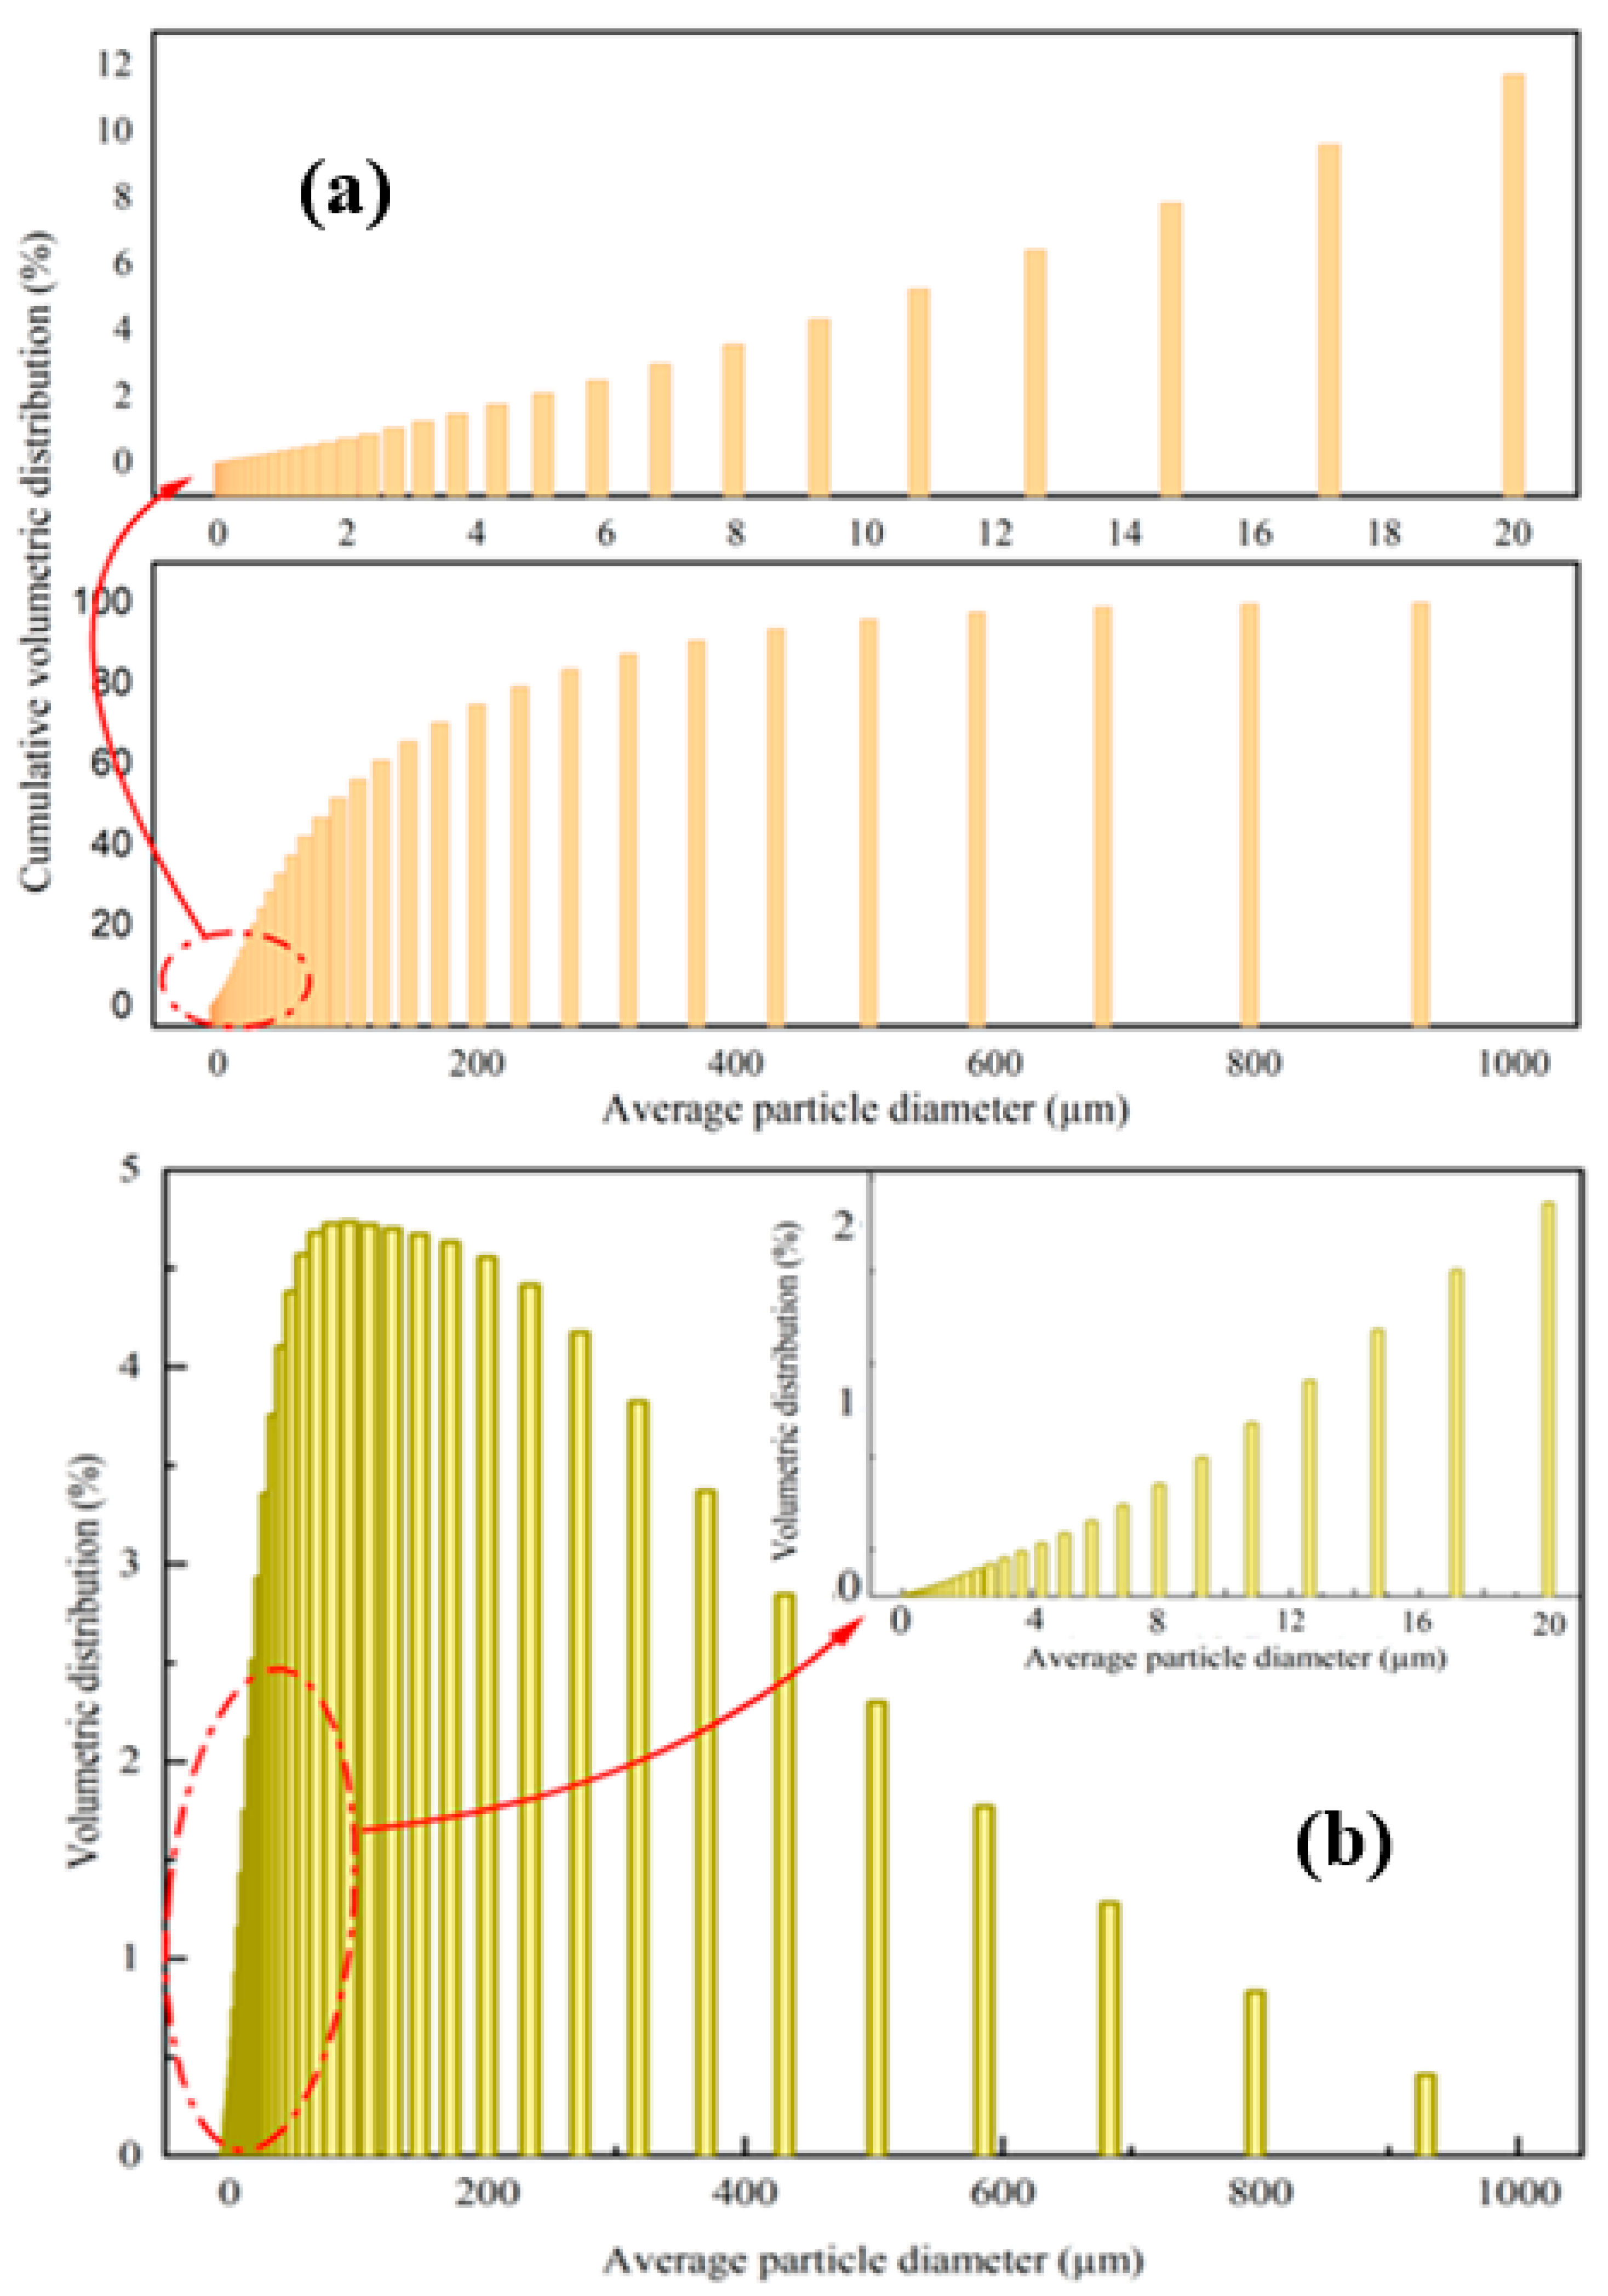
4.3. Characterisation of PM, Combustion Residues and Efficiency

Table 2 presents the heavy metal content of the ashes and PM from the stove and PCAS. These data were used to estimate the maximum amount of ash and PM that could be used as soil amendments, adhering to European limit values (Directive 86/278/EEC—Annex I C) [66].
The metal content of the ashes and captured PM is reported in parts per million (ppm), with values below the detection limit indicated by a minor sign. Data on the maximum allowable mass usage of amendments are given in tonnes per hectare per year (t/ha/y), while the maximum metal threshold limits are provided in kilograms per hectare per year (kg/ha/y). Both runs showed a similar pattern in the metal composition of the ashes and PM, although the levels in the PM were generally much lower, except for those of Cr and Ni. The concentrations of Cd, Cu, Pb, and Zn in the ashes were found to be two to seventy times higher than those in the PM. This finding supports previous studies that suggest that Zn, Cd, Pb, and Cu are mainly present in larger particles, like those found in ashes [67]. In some urban areas in Europe, Zn and Pb are commonly identified as trace metals in PM aerosols due to the use of biomass heating systems [17,68]. Zn is formed through nucleation and condensation processes and can accumulate in fly ash in cyclone systems [69]. This metal is known to contribute to the toxic effects of PM, particularly in the PM1 fraction [67]. Notably, neither arsenic (As) nor mercury (Hg) was detected in the PM or ash. The absence of Hg is likely due to its presence in the gaseous phase of the combustion gases [70]. As shown in Table 2, the chromium content limits are based on French and Swedish local regulations, as there is no EU-wide legislation that sets these limits. When applying ash to agricultural soils, chromium is the limiting factor, allowing for the use of up to 480 kg/ha/yr of ash. For PM, cadmium is the limiting metal, permitting up to 288 t/ha/yr of PM to be applied to agricultural soils. The PCAS system, designed according to the Lapple and Swift standards, was implemented with an adjustment ranging from 91% to 130% of the proportions proposed by these authors. By considering the operational parameters of the combustion system and the proportions of the PCAS, the efficiency in reducing particles larger than 18.81 μm (the system’s cut-point, where 50% capture efficiency is achieved) was determined. Granulometric analysis of the PM captured by the PCAS, based on 222 sample acquisitions, showed that the PM had an accumulated volumetric distribution primarily concentrated in the 0 to 200 μm diameter range, as illustrated in Figure 4. Specifically, Figure 4a shows the cumulative volumetric distribution, and the corresponding volumetric distribution is shown in Figure 4b.
The cumulative volumetric distribution, shown in Figure 4a, illustrates the percentage (%) of the average particle diameter in micrometers (µm) of the PM collected by the PCAS. The lower graph highlights that approximately 75% of the PM has a diameter smaller than 200 µm. According to the analysis, the system was more effective in reducing particles that were larger than 10 µm. The upper graph zooms in on a section of the lower graph, revealing that approximately 5% and 1% of the PM have diameters smaller than 10 µm and 2.5 µm, respectively. In other studies, it was observed that the mass size presented a peak in the size range of 50–130 μm [71]. Indeed, according to the theoretical analysis of the system and the calculation of the cut-point, the system demonstrated a Pdc (particle diameter cut-point) of 18.81 μm. This indicates that the system efficiency improves as the particle diameter in the flue gas increases, and approximately 50% efficiency is achieved at a particle size fraction of 18.81 μm. The remaining 95% of the volume was composed of particles larger than PM10. Cyclone systems, in addition to increasing particle agglomeration due to the high centrifugal force to which the particles are subjected, are more efficient in extracting particles of larger masses, as characterized by high Stokes numbers. The fraction with the upper volume was divided into granulometric ranges of 10–100 µm (46%), 100–200 µm (24%), and 200–900 µm (25%). Coarser particles settle easily due to gravitational deposition, while finer particles with a diameter of less than 0.1 µm are carried away from the source. Particles between 0.1 and 1 µm remain in the atmosphere for longer periods and are more easily removed through wet deposition. To address this, atomizing water inside the cyclone could be a solution, which would be useful for both solid particles and the gas phase of the fumes [72,73]. Based on the cumulative volumetric distribution, it was feasible to determine the volumetric distribution, indicating the percentage of particles with an average particle diameter, as shown in Figure 5. The volumetric distribution in Figure 4b presents the percentage (%) of PM particles’ average diameter (µm) collected by the PCAS. The graph indicates that most of the particles fall within the 70–200 µm range. In the upright box graph, approximately ~1% and ~0.25% of the PM have diameters of 10 µm and 2.5 µm, respectively. Moreover, in the numerical distribution analysis (Figure 5), the curve shifts towards smaller particles. This observation aligns with previous studies on PM formation, where a significant proportion of particles were found in the PM1 fraction [74].
The numerical percentage distribution in Figure 5 shows the average particle diameter (µm) of the PM collected by the PCAS. The lower graph highlights the prevalence of particles with diameters ~1 µm. The upper graph provides a magnified view of the region between 0.1 µm and 0.5 µm, revealing a peak at 0.15 µm for particle abundance. About 99% of the particles were concentrated in the PM1 fraction, which is consistent with other investigations of PM emissions from pellet combustion systems [75]. PM1 emissions are correlated with the Na and K contents of the raw material; when inorganic vapours cool to their condensation temperature and the particle concentration is minimal, nucleation occurs, resulting in the formation of ultrafine particles [3,39,40,70]. As particle concentration increases, saturation occurs, and agglomeration into pre-existing particles occurs, forming heavier particles [39,40,69,70]. The distribution fractions of PM1, PM2.5, PM10, and particles larger than 10 µm are presented in Table 3.
The arithmetic mean diameter, d10, was determined to be 0.27 μm, while the d32 and d43 values were measured at 31 μm and 158 μm, respectively. The significant disparity between d10 and d43 indicates the presence of particles with different diameters in the sample.

4.4. Life Cycle Inventory Analysis and Impact Assessment

The inventory of the system was elaborated by considering the materials and processes for manufacturing the cyclone. The flow of materials, processes, transportation, and reference to the Ecoinvent database represents the impact category of Particulate Matter Formation during the material production, transportation, manufacturing, and end-of-life of the abatement system. The life cycle of the abatement system was responsible for releasing 488 g of PM10 into the atmosphere, of which 11% was PM2.5. The system inventory was defined to include the materials and manufacturing processes listed in Table 1. Table 4 presents the impact of Particulate Matter Formation throughout the life cycle of the abatement system. The system released 488 g of PM10, of which 11% was PM2.5.
The PCAS is a passive structure; thus, it is not responsible for any emissions during its lifespan. Over its entire life cycle, 488 g of PM10 and 55 g of PM2.5 were released into the atmosphere, with the raw material production phase (stainless steel production) and material processing (shaping and welding) being the most impactful phases, responsible for 96% and 99% of the total PM2.5 and PM10 emissions, respectively. The other stages of the life cycle had a negligible impact, contributing less than 1%. At the end-of-life, all the material was considered recyclable, contributing to a reduction in the total impact load of about 10% for PM2.5 and 5% for PM10. Finally, net-zero emissions from the abatement system, which is the point at which the captured PM surpasses the PM emitted by the manufacturing process and the operation of the system starts to have a positive balance, could be achieved in approximately 1 year and 8 months. This is based on a yearly operation of 6 h per day for 7 months.

4.5. Economics of PCAS

The Passive Cyclone Abatement System (PCAS) is significantly more cost-effective than active systems like electrostatic precipitators (ESP) and catalytic converters. For example, the installation cost of an ESP for a small-scale residential system can range from €3000 to €5000, including both equipment and installation. In contrast, the PCAS can be installed for as little as €500 to €1000, due to its simpler design and passive operation, which eliminates the need for electrical components or complex installation processes. In terms of maintenance, active systems require regular service and operational checks, with costs averaging around €200 to €500 per year, due to the need to replace parts and cleaning. In contrast, the PCAS has minimal maintenance requirements, with annual service costs often below €50, as it does not rely on electrical components. Moreover, the PCAS is energy-efficient, consuming zero electricity during operation, while active systems like ESPs can add €50 to €100 per year in electricity costs for continuous operation. Overall, over a 10-year period, the PCAS could save up to €4000 in installation, maintenance, and energy costs compared to active systems. This makes it a highly economical choice for residential heating systems, where budgets are typically limited and the cost of operation is a critical factor in system selection. These cost differences raise important questions regarding the scalability of PCAS technology and its potential to replace more complex systems in broader applications. Additionally, it is worth considering whether regulatory frameworks might evolve to favor passive systems, especially in contexts where affordability and energy efficiency are prioritized.

5. Conclusions

This study proposed the use of a passive cyclone system to reduce PM emissions in residential combustion heating systems fuelled by lignocellulosic biomass pellets. The system was tested in a residential pellet stove under both steady-state and non-steady-state regimes. The proposed abatement system was found to optimize the mechanisms for reducing PM emissions in the atmosphere, especially for particles with a diameter greater than 10 µm, as observed in the experimental analysis, and 18.81 µm, according to the theoretical efficiency estimation. The non-steady-state regime showed 30% higher consumption of pellets and captured two-fold more PM than the steady-state regime, mainly due to disturbances in the combustion chamber during transient phases. The cyclone system was able to capture about 10.64 mg of PM/MJ, with 95% of the volume of the captured material composed of particles between 10 and 900 µm and 99% of the number of particles from the PM1 fraction. The PM captured had approximately the same metal composition as that found in the ash from the combustion process (Cd, Cu, Pb, and Zn) but in much lower concentrations, thus providing an easy and safe final disposal. Based on the concentration of heavy metals in PM captured and respecting European regulations, up to 288 t/ha/yr of this residue could be disposed of in agricultural fields. Finally, considering the PM emitted during the life span of the abatement system, net-zero PM emissions could be achieved after 1 year and 8 months. The mini passive cyclone abatement system is versatile and can be installed in other types of residential combustion heating systems. It would be interesting to understand the performance of these systems in completely passive systems, such as fireplaces, where there is no driving force generated by the exhaust fan, and verify the efficiency and the need for fans downstream of the exhaust pipes. The system demonstrated superior efficiency in capturing PM with a diameter greater than 10 µm, opening the possibility of coupling it with other abatement systems that capture the PM10 fraction, such as electrostatic precipitator systems.

Author Contributions

Conceptualization, A.N. and V.C.; methodology, V.C.; software, R.B.L.T.; validation, A.N. and V.C.; formal analysis, V.C. and R.B.L.T.; investigation, R.B.L.T. and A.D.G.; resources, F.C.; data curation, A.P., V.C., R.B.L.T. and A.D.G.; writing—original draft preparation, A.P., V.C., R.B.L.T. and A.D.G.; writing—review and editing, A.P., V.C., A.D.G. and R.B.L.T.; visualization, R.B.L.T.; supervision, A.P., F.C. and A.N.; project administration, F.C.; funding acquisition, F.C. All authors have read and agreed to the published version of the manuscript.

Funding

This research was carried out under the PRIN2017 BIOCHEAPER project funded by the Italian Ministry of Education and Research Grant n° 20175TXJER.

Institutional Review Board Statement

Not applicable.

Informed Consent Statement

Not applicable.

Data Availability Statement

Data are included in this paper.

Conflicts of Interest

The authors declare no conflicts of interest.

References

  1. Paraschiv, L.S.; Serban, A.; Paraschiv, S. Calculation of combustion air required for burning solid fuels (coal/biomass/solid waste) and analysis of flue gas composition. Energy Rep. 2020, 6, 36–45. [Google Scholar] [CrossRef]
  2. Haq, I.; Qaisar, K.; Nawaz, A.; Akram, F.; Mukhtar, H.; Zohu, X.; Xu, Y.; Mumtaz, M.W.; Rashid, U.; Ghani, W.A.W.A.K.; et al. Advances in Valorization of Lignocellulosic Biomass towards Energy Generation. Catalysts 2021, 11, 309. [Google Scholar] [CrossRef]
  3. Ghafghazi, S.; Sowlati, T.; Sokhansanj, S.; Bi, X.; Melin, S. Particulate matter emissions from combustion of wood in district heating applications. Renew. Sustain. Energy Rev. 2011, 15, 3019–3028. [Google Scholar] [CrossRef]
  4. Shen, G.; Tao, S.; Wei, S.; Zhang, Y.; Wang, R.; Wang, B.; Li, W.; Shen, H.; Huang, Y.; Chen, Y.; et al. Reductions in Emissions of Carbonaceous Particulate Matter and Polycyclic Aromatic Hydrocarbons from Combustion of Biomass Pellets in Comparison with Raw Fuel Burning. Environ. Sci. Technol. 2012, 46, 6409–6416. [Google Scholar] [CrossRef]
  5. Mehmood, M.A.; Ibrahim, M.; Rashid, U.; Nawaz, M.; Ali, S.; Hussain, A.; Gull, M. Biomass production for bioenergy using marginal lands. Sustain. Prod. Consum. 2017, 9, 3–21. [Google Scholar] [CrossRef]
  6. Osman, A.I.; Hefny, M.; Abdel Maksoud, M.I.A.; Elgarahy, A.M.; Rooney, D.W. Recent advances in carbon capture storage and utilisation technologies: A review. Environ. Chem. Lett. 2021, 19, 797–849. [Google Scholar] [CrossRef]
  7. ISO 17225-4; Solid Biofuels—Fuel Specifications and Classes. International Organization for Standardization: Geneva, Switzerland, 2021.
  8. Miranda, T.; Montero, I.; Sepúlveda, F.J.; Arranza, J.I.; Rojas, C.V.; Nogales, S. A Review of Pellets from Different Sources. Materials 2015, 8, 1413–1427. [Google Scholar] [CrossRef]
  9. Thrän, D.; Peetz, D.; Schaubach, K. Global Wood Pellet Industry and Trade Study; IEA Bioenergy: Paris, France, 2017; ISBN 9781910154328. [Google Scholar]
  10. Saosee, P.; Sajjakulnukit, B.; Gheewala, S.H. Life cycle assessment of wood pellet production in Thailand. Sustainability 2020, 12, 6996. [Google Scholar] [CrossRef]
  11. Flach, B.; Bolla, S. Wood Pellets Annual; U.S. Department of Agriculture: Washington, DC, USA, 2024.
  12. Fiedler, F. The state of the art of small-scale pellet-based heating systems and relevant regulations in Sweden, Austria and Germany. Renew. Sustain. Energy Rev. 2004, 8, 201–221. [Google Scholar] [CrossRef]
  13. Johansson, L.S.; Leckner, B.; Gustavsson, L.; Cooper, D.; Tullin, C.; Potter, A. Emission characteristics of modern and old-type residential boilers fired with wood logs and wood pellets. Atmos. Environ. 2004, 38, 4183–4195. [Google Scholar] [CrossRef]
  14. Aste, N.; Adhikari, R.S.; Compostella, J.; Del Pero, C. Energy and environmental impact of domestic heating in Italy: Evaluation of national NOx emissions. Energy Policy 2013, 53, 353–360. [Google Scholar] [CrossRef]
  15. EMEP/EEA Air Pollutant Emission Inventory Guidebook 2013. Available online: https://www.eea.europa.eu/publications/emep-eea-guidebook-2013 (accessed on 20 March 2023).
  16. Lim, M.T.; Phan, A.; Roddy, D.; Harvey, A. Technologies for measurement and mitigation of particulate emissions from domestic combustion of biomass: A review. Renew. Sustain. Energy Rev. 2015, 49, 574–584. [Google Scholar] [CrossRef]
  17. Vicente, E.D.; Alves, C.A. An overview of particulate emissions from residential biomass combustion. Atmos. Res. 2018, 199, 159–185. [Google Scholar] [CrossRef]
  18. Wang, K.; Nakao, S.; Thimmaiah, D.; Hopke, P.K. Emissions from in-use residential wood pellet boilers and potential emissions savings using thermal storage. Sci. Total Environ. 2019, 676, 564–576. [Google Scholar] [CrossRef]
  19. Jaworek, A.; Sobczyk, A.T.; Marchewicz, A.; Krupa, A.; Czech, T. Particulate matter emission control from small residential boilers after biomass combustion. A review. Renew. Sustain. Energy Rev. 2021, 137, 110446. [Google Scholar] [CrossRef]
  20. Samet, J.M.; Dominici, F.; Curriero, F.C.; Coursac, I.; Zeger, S.L. Fine Particulate Air Pollution and Mortality in 20 U.S. Cities, 1987–1994. N. Engl. J. Med. 2000, 343, 1742–1749. [Google Scholar] [CrossRef]
  21. Rohr, A.C.; Habre, R.; Godbold, J.; Moshier, E.; Schachter, N.; Kattan, M.; Grunin, A.; Nath, A.; Coull, B.; Koutrakis, P. Asthma exacerbation is associated with particulate matter source factors in children in New York City. Air Qual. Atmos. Health 2014, 7, 239–250. [Google Scholar] [CrossRef]
  22. Ahn, K. The role of air pollutants in atopic dermatitis. J. Allergy Clin. Immunol. 2014, 134, 993–999. [Google Scholar] [CrossRef]
  23. Roy, A.; Chapman, R.S.; Hu, W.; Wei, F.; Liu, X.; Zhang, J. Indoor air pollution and lung function growth among children in four Chinese cities. Indoor Air 2012, 22, 3–11. [Google Scholar] [CrossRef]
  24. McCracken, J.P.; Smith, K.R.; Díaz, A.; Mittleman, M.A.; Schwartz, J. Chimney Stove Intervention to Reduce Long-term Wood Smoke Exposure Lowers Blood Pressure among Guatemalan Women. Environ. Health Perspect. 2007, 115, 996–1001. [Google Scholar] [CrossRef]
  25. Directive 2008/50/EC of the European Parliament and of the Council of 21 May 2008 on Ambient Air Quality and Cleaner Air for Europe; EU: Strasbourg, France, 2008.
  26. Lopez-Aparicio, S.; Grythe, H.; Markelj, M.; Evangeliou, N.; Walker, S.E. Exploring the connection between COVID 19, the energy crisis and PM2.5 emissions from residential heating. Clean. Environ. Syst. 2024, 15, 100244. [Google Scholar] [CrossRef]
  27. Trojanowski, R.; Fthenakis, V.M. Nanoparticle emissions from residential wood combustion: A critical literature review, characterization, and recommendations. Renew. Sustain. Energy Rev. 2019, 103, 515–528. [Google Scholar] [CrossRef]
  28. Szidat, S.; Prévôt, A.S.H.; Sandradewi, J.; Alfarra, M.R.; Synal, H.; Wacker, L.; Baltensperger, U. Dominant impact of residential wood burning on particulate matter in Alpine valleys during winter. Geophys. Res. Lett. 2007, 34, L05820. [Google Scholar] [CrossRef]
  29. Krecl, P.; Hedberg Larsson, E.; Ström, J.; Johansson, C. Contribution of residential wood combustion and other sources to hourly winter aerosol in Northern Sweden determined by positive matrix factorization. Atmos. Chem. Phys. 2008, 8, 3639–3653. [Google Scholar] [CrossRef]
  30. Caseiro, A.; Bauer, H.; Schmidl, C.; Pio, C.A.; Puxbaum, H. Wood burning impact on PM10 in three Austrian regions. Atmos. Environ. 2009, 43, 2186–2195. [Google Scholar] [CrossRef]
  31. Favez, O.; Cachier, H.; Sciare, J.; Sarda-Esteve, R.; Martinon, L. Evidence for a significant contribution of wood burning aerosols to PM2.5 during the winter season in Paris, France. Atmos. Environ. 2009, 43, 3640–3644. [Google Scholar] [CrossRef]
  32. Bari, M.A.; Baumbach, G.; Kuch, B.; Scheffknecht, G. Temporal variation and impact of wood smoke pollution on a residential area in southern Germany. Atmos. Environ. 2010, 44, 3823–3832. [Google Scholar] [CrossRef]
  33. Amato, F.; Alastuey, A.; Karanasiou, A.; Lucarelli, F.; Nava, S.; Calzolai, G.; Severi, M.; Becagli, S.; Gianelle, V.L.; Colombi, C.; et al. AIRUSE-LIFE+: A harmonized PM speciation and source apportionment in five southern European cities. Atmos. Chem. Phys. 2016, 16, 3289–3309. [Google Scholar] [CrossRef]
  34. Maenhaut, W.; Vermeylen, R.; Claeys, M.; Vercauteren, J.; Roekens, E. Sources of the PM10 aerosol in Flanders, Belgium, and re-assessment of the contribution from wood burning. Sci. Total Environ. 2016, 562, 550–560. [Google Scholar] [CrossRef]
  35. Mangia, C.; Cervino, M.; Gianicolo, E.A.L. Secondary particulate matter originating from an industrial source and its impact on population health. Int. J. Environ. Res. Public Health 2015, 12, 7667–7681. [Google Scholar] [CrossRef]
  36. Verma, V.K.; Bram, S.; Delattin, F.; Laha, P.; Vandendael, I.; Hubin, A.; De Ruyck, J. Agro-pellets for domestic heating boilers: Standard laboratory and real life performance. Appl. Energy 2012, 90, 17–23. [Google Scholar] [CrossRef]
  37. Fernandes, U.; Costa, M. Particle emissions from a domestic pellets-fired boiler. Fuel Process. Technol. 2012, 103, 51–56. [Google Scholar] [CrossRef]
  38. Öhman, M.; Nordin, A.; Hedman, H.; Jirjis, R. Reasons for slagging during stemwood pellet combustion and some measures for prevention. Biomass Bioenergy 2004, 27, 597–605. [Google Scholar] [CrossRef]
  39. García-Maraver, A.; Popov, V.; Zamorano, M. A review of European standards for pellet quality. Renew. Energy 2011, 36, 3537–3540. [Google Scholar] [CrossRef]
  40. Sippula, O.; Hokkinen, J.; Puustinen, H.; Yli-Pirila, P.; Jokiniemi, J. Comparison of particle emissions from small heavy fuel oil and wood-fired boilers. Atmos. Environ. 2009, 43, 4855–4864. [Google Scholar] [CrossRef]
  41. Carroll, J.; Finnan, J. Emissions and efficiencies from the combustion of agricultural feedstock pellets using a small scale tilting grate boiler. Biosyst. Eng. 2013, 115, 50–55. [Google Scholar] [CrossRef]
  42. Directive 2004/107/EC of the European Parliament and of the Council of 15 December 2004 Relating to Arsenic, Cadmium, Mercury, Nickel and Polycyclic Aromatic Hydrocarbons in Ambient Air; EU: Strasbourg, France, 2004.
  43. Valencia-Lopez, A.M.; Romero-Menco, F.; Bustamante, F.; Perez, J.F. Assessment of reductions in CO, PAHs and PM emissions in a forced-draft biomass gasification cookstove. Renew. Energy 2025, 245, 122815. [Google Scholar] [CrossRef]
  44. Monedero, E.; Collado, R.; Villanueva, F.; Borjabad, E.; Ramos, R.; Hernandez, J.J. Particulate-bound PAHs, nitro and oxy-PAHs from small scale boilers fueled with non-woody biomass. Atmos. Res. 2025, 316, 107954. [Google Scholar] [CrossRef]
  45. Da Lioa, L.; Bortolus, M.; Canua, P. Emissions reduction from wood pellet stoves by uniform feeding. Renew. Energy 2025, 242, 122273. [Google Scholar] [CrossRef]
  46. Lee, H.H.; Hsu, C.M. Total Quality Management Enhances Wood Pellet Utilization for Sustainable Energy. Sustainability 2025, 17, 1562. [Google Scholar] [CrossRef]
  47. Dirgo, J.; Leith, D. Cyclone Collection Efficiency: Comparison of Experimental Results with Theoretical Predictions. Aerosol Sci. Technol. 1985, 4, 401–415. [Google Scholar] [CrossRef]
  48. LECO Instruments Thermogravimetric Analyzer TGA701. Available online: https://lecoperu.com/wp-content/uploads/2018/05/TGA701-ESPECIFICACIONES-ENG-28052018.pdf (accessed on 20 March 2025).
  49. LECO Instruments Calorimeter AC-350. Available online: http://www.zycon.com/Literature/128173/62890/ac-350%20flyer%20203-968.pdf (accessed on 20 March 2025).
  50. EPA. Methodology for Thermal Efficiency and Energy Input Calculations and Analysis of Biomass Cogeneration Unit Characteristics. 2007. Available online: https://www3.epa.gov/airtoxics/utility/fnl_biomass_cogen_TSD_04_19_07.pdf (accessed on 20 March 2025).
  51. Last Calor SOFIA. Available online: https://www.termovana.it/wp-content/uploads/2021/02/Manuale_SOFIA_UP_IT_WEB.pdf (accessed on 20 March 2025).
  52. Basu, P. Circulating Fluidized Bed Boilers—Design, Operation and Maintenance; Springer: Berlin/Heidelberg, Germany, 2015; pp. 229–253. [Google Scholar]
  53. Watlow. Thermocouple. Available online: https://www.watlow.com/products/sensors/thermocouples (accessed on 20 March 2025).
  54. Avery Weight-Tronix E1005. Available online: http://www.scaleservice.net/manuals/weightronix/e1005_u.pdf (accessed on 20 March 2025).
  55. Sartorius: Scout Pro. Available online: https://www.sartorius.com/en/products (accessed on 20 March 2025).
  56. Optima 8000 ICO-OES: Monochromator Optical System. Available online: https://resources.perkinelmer.com/lab-solutions/resources/docs/bro_optima-8x00-family.pdf (accessed on 20 March 2025).
  57. EN 15359; Solid Recovered Fuels—Specifications and Classes. CEN: Bruxelles, Belgium, 2011.
  58. Malvern Panalytical. Spraytec Laser Diffraction System. Available online: https://www.malvernpanalytical.com/en/products/product-range/spraytec?utm_source=google&utm_medium=cpc&utm_campaign=EN%20-%20Malvern%20-%20Product%20-%20Spraytec&utm_term=malvern%20spraytec&utm_content=1942201140&gad=1&gclid=CjwKCAjwscGjBhAXEiwAswQqNDSqc7jpwcGH-71vWz5ccDu3YT-kvStndM1zPfKf5I7DoWDR5YWdExoCrmEQAvD_BwE (accessed on 20 March 2025).
  59. ISO 14040; Environmental Management—Life Cycle Assessment—Principles and Framework. International Organization for Standardization: Geneva, Switzerland, 2006.
  60. ISO 14044; Environmental Management—Life Cycle Assessment—Requirements and Guidelines. International Organization for Standardization: Geneva, Switzerland, 2006.
  61. PRé Sustainability. SimaPro. Available online: https://simapro.com/ (accessed on 20 March 2023).
  62. Wernet, G.; Bauer, C.; Steubing, B.; Reinhard, J.; Moreno-Ruiz, E.; Weidema, B. The ecoinvent database version 3 (part I): Overview and methodology. Int. J. Life Cycle Assess. 2016, 21, 1218–1230. [Google Scholar] [CrossRef]
  63. Huijbregts, M.A.J.; Steinmann, Z.J.N.; Elshout, P.M.F.; Stam, G.; Verones, F.; Vieira, M.; Zijp, M.; Hollander, A.; Van Zelm, R. ReCiPe 2016: A harmonized life cycle impact assessment method at midpoint and endpoint level. Int. J. Life Cycle Assess. 2017, 22, 138–147. [Google Scholar] [CrossRef]
  64. Ryu, C.; Bin, Y.Y.; Khor, A.; Yates, N.E.; Sharifi, V.N.; Swithenbank, J. Effect of fuel properties on biomass combustion: Part I. Experiments—Fuel type, equivalence ratio and particle size. Fuel 2006, 85, 1039–1046. [Google Scholar] [CrossRef]
  65. Toscano, G.; Duca, D.; Amato, A.; Pizzi, A. Emission from realistic utilization of wood pellet stove. Energy 2014, 68, 644–650. [Google Scholar] [CrossRef]
  66. Council Directive 86/278/EEC of 12 June 1986 on the Protection of the Environment, and in Particular of the Soil, When Sewage Sludge Is Used in Agriculture; EU: Luxembourg, 1986.
  67. Uski, O.; Jalava, P.I.; Happo, M.S.; Torvela, T.; Leskinen, J.; Mäki-Paakkanen, J.; Tissari, J.; Sippula, O.; Lamberg, H.; Jokiniemi, J.; et al. Effect of fuel zinc content on toxicological responses of particulate matter from pellet combustion in vitro. Sci. Total Environ. 2015, 511, 331–340. [Google Scholar] [CrossRef]
  68. Ostro, B.; Feng, W.Y.; Broadwin, R.; Green, S.; Lipsett, M. The Effects of Components of Fine Particulate Air Pollution on Mortality in California: Results from CALFINE. Environ. Health Perspect. 2007, 115, 13–19. [Google Scholar] [CrossRef]
  69. Boman, C.; Nordin, A.; Boström, D.; Öhman, M. Characterization of Inorganic Particulate Matter from Residential Combustion of Pelletized Biomass Fuels. Energy Fuels 2004, 18, 338–348. [Google Scholar] [CrossRef]
  70. Wiinikka, H.; Grönberg, C.; Boman, C. Emissions of Heavy Metals during Fixed-Bed Combustion of Six Biomass Fuels. Energy Fuels 2013, 27, 1073–1080. [Google Scholar] [CrossRef]
  71. Fernandes, U.; Costa, M. Formation of Fine Particulate Matter in a Domestic Pellet-Fired Boiler. Energy Fuels 2013, 27, 1081–1092. [Google Scholar] [CrossRef]
  72. EPA, Air Quality Criteria for Particulate Matter Volume I of II. 2004. Available online: https://nepis.epa.gov/Exe/ZyPURL.cgi?Dockey=P100LFIQ.TXT (accessed on 20 March 2025).
  73. EPA, Air Quality Criteria for Particulate Matter Volume II of II. 2004. Available online: https://nepis.epa.gov/Exe/ZyPURL.cgi?Dockey=P100LG7Q.TXT (accessed on 20 March 2025).
  74. Jeguirim, M.; Kraiem, N.; Lajili, M.; Guizani, C.; Zorpas, A.; Leva, Y.; Michelin, L.; Josien, L.; Limousy, L. The relationship between mineral contents, particle matter and bottom ash distribution during pellet combustion: Molar balance and chemometric analysis. Environ. Sci. Pollut. Res. 2017, 24, 9927–9939. [Google Scholar] [CrossRef]
  75. Sommersacher, P.; Brunner, T.; Obernberger, I. Fuel Indexes: A Novel Method for the Evaluation of Relevant Combustion Properties of New Biomass Fuels. Energy Fuels 2012, 26, 380–390. [Google Scholar] [CrossRef]
Figure 1. Pellet stove and PCAS views. From left to right in (a)—the SOFIA, Last Calor pellet stove on site placed over a weight bridge to monitor pellet consumption; (b)—view of the flue gas outlet and the PCAS; (c)—PCAS detail figure cyclone body, gas inlet, gas outlet, and dust outlet are shown in a front view; (d)—scheme of the front view design of PCAS with dimensions in mm.
Sustainability 17 03814 g001
Figure 2. Steps for steady-state and non-steady-state run conditions.
Sustainability 17 03814 g002
Figure 3. Pellet consumption over time in correlation with the fume temperature of the steady-state run (a) and non-steady-state regime operation (b).
Sustainability 17 03814 g003
Figure 4. Cumulative volumetric distribution (a) and volumetric distribution (b) plots.
Sustainability 17 03814 g004
Figure 5. Numerical distribution.
Sustainability 17 03814 g005
Table 1. PCAS structure component dimensions.
Structural PartDimension (mm)
Cyclone diameter220
Gas outlet diameter100
Gas inlet diameter100
Gas outlet diameter100
Cyclone height365
Cylinder height100
Dust outlet diameter100
Outlet duct length85
Table 2. Metal characterization of ashes and captured PM.
ElementMetals Content in Ash (ppm)Metals Content in PM (ppm)Limit Value
(kg/ha/yr)
Ash Mass
(t/ha/yr)
PM Mass
(t/ha/yr)
Cadmium0.910.520.15164.84288.46
Copper118.391.6112101.367453.42
Nickel26.6<0.0043112.78-
Lead6.11.37152459.0210,948.91
Zinc162.4113.1530184.722281.37
Mercury<0.02<0.020.10--
Chromium 1 Swe83.1<0.0040.040.48-
Chromium 1 Fra12144.40-
1 European regulation has not yet decided on a common value for the EU; therefore, so for this purpose the lowest value, adopted by Sweden (Swe), and the highest value, adopted by France (Fra), are taken as references [66].
Table 3. Distribution of PM captured in terms of PM 1, 2.5, 10, and >10.
Particle Diameter (μm)Volumetric Distribution (%)Volumetric Accumulate Distribution (%)Numeric Distribution (%)Number Accumulate Distribution (%)
PM 10.340.3498.5898.58
PM 2.50.681.031.1699.74
PM 104.215.240.2499.98
>PM 1094.76100.000.000299.98
TOTAL100.00 99.98
Table 4. Particulate matter formation indicator.
Impact CategoryUnitMaterialMetal WorkingLinear
Welding
Circular WeldingTransportation InputTransportation OutputEnd-of-LifeTotal
Fine particulate matter formationmg PM2.5 eq52,631624836515949696−640254,628
%86.2410.240.602.610.160.16-100
Particulate matter formationmg PM10 eq491,23217,0257603315375375−24,561488,520
%95.743.320.150.650.070.07-100
Fraction PM2.5/
PM10 1
%1137484826262611
1 Method PM10 emissions—Environmental Prices V1.02/European Environmental Prices, Method PM2.5 emissions—ReCiPe 2016 Midpoint (H) V1.06/World (2010) H.
Disclaimer/Publisher’s Note: The statements, opinions and data contained in all publications are solely those of the individual author(s) and contributor(s) and not of MDPI and/or the editor(s). MDPI and/or the editor(s) disclaim responsibility for any injury to people or property resulting from any ideas, methods, instructions or products referred to in the content.

