Article

Selected Meteorological Factors Influencing Gas Emissions from an Abandoned Coal Mine Shaft—Results of In Situ Measurements

1
Faculty of Mining, Safety Engineering and Industrial Automation, Silesian University of Technology, Akademicka 2, 44-100 Gliwice, Poland
2
Central Mining Institute-National Research Institute (GIG-PIB), Plac Gwarkow 1, 40-166 Katowice, Poland
3
Faculty of Transport and Aviation Engineering, Silesian University of Technology, Krasińskiego 8, 40-019 Katowice, Poland
4
Faculty of Energy and Environmental Engineering, Silesian University of Technology, Konarskiego 18, 44-100 Gliwice, Poland
5
Industrial Development Agency JSC, Mikołowska 100, 40-065 Katowice, Poland
*
Author to whom correspondence should be addressed.
Sustainability 2025, 17(9), 3875; https://doi.org/10.3390/su17093875
Submission received: 10 March 2025 / Revised: 9 April 2025 / Accepted: 22 April 2025 / Published: 25 April 2025
(This article belongs to the Topic Mining Safety and Sustainability, 2nd Volume)

Abstract

:
With climate change, more intense weather events are observed, including pressure drops associated with the arrival of atmospheric fronts. These pressure drops are the primary cause of gas emissions from closed mines to the surface, with inactive mine shafts serving as the most likely emission pathways. The most significant emitted gases are carbon dioxide and methane, posing a dual challenge: greenhouse gas emissions and gas-related hazards. This study analyses changes in gas emission intensity in response to short-term (hourly) pressure fluctuations. Additionally, it presents the results of gas emission measurements from an inactive shaft, considering the impact of temperature differences between the air and emitted gases. The findings indicate that gas emissions are subject to inertia, which is crucial for gas monitoring around mine shafts, as emissions may still occur in the early stages of a pressure increase. Furthermore, the results show that temperature differences between the atmosphere and emitted gases could have a major influence on the process.

1. Introduction

Climate change refers to long-term shifts in temperature and weather patterns, observed through changes in mean values or variability over decades [1]. While influenced by natural factors, human activities are a major driver [2,3]. Climate change can lead to increasingly severe and prolonged weather events, including heavy rainfall, rapid pressure and temperature fluctuations, and windstorms [4,5,6]. According to the IPCC, human-induced climate change is unprecedented in the past 2000 years and is intensifying globally, amplifying the frequency and severity of extreme weather events [7]. These phenomena may negatively impact the structure of closed mines, posing risks to both the environment and local communities. Additionally, rapid climate change is leading not only to more frequent and intense extreme events but also to the emergence of new types of climates that humans have never experienced before [8,9]. In the long term, ensuring safety should be a key priority during mine closures and the transformation of post-industrial areas.
Predicted weather-related anomalies may contribute to several issues, including increased erosion and slope destabilization on post-mining landfills and subsidence in mining areas [10]. Additionally, they can accelerate the migration of pollutants through these landfills, leading to the contamination of soil, nearby watercourses, and reservoirs. Another major concern is the increased emission of gases [11].
Gas emissions from closed mines are well-documented, with occurrences recorded in major mining basins worldwide. The most significant of these emissions involve greenhouse gases, primarily carbon dioxide and methane, which contribute both to environmental hazards and climate change. The current research on gas emissions from the rock mass is being conducted in several key areas, including the assessment of multi-hazard risks associated with abandoned mines. For instance, Al Heib and Franck examined gas emissions as part of a broader multi-hazard framework that also considers pollution, flooding, and structural integrity in abandoned mines [12].
Another area of study involves forecasting methane emissions. Duda and Krzemień [13] developed a model to estimate methane volumes released into longwall goafs from relaxed undermined and overmined coal seams, aiding in the assessment of methane emission risks from closed or sealed underground coal mines. Additionally, Duda and Valvedre [14] conducted a risk analysis of methane hazards at the final stage of a Polish underground mine’s closure. Their study explored the impact of the flooding process on gas emissions from goafs, variations in methane concentration, and changes in void volume.
Past studies also focus on the origin, monitoring, and mitigation of mine gas emissions. Chen et al. [15] investigated methane emissions from abandoned coal mines across China, analyzing national and provincial data to support mitigation strategies. The influence of flooding on gas emissions was also examined by Krause and Pokryszka [16]. Additionally, Lunarzewski [17] explored variations in methane emissions following a longwall closure.
Similar issues were examined by Chmiela [18], who conducted an analysis of the possibilities of liquidating hard coal mines in a way that would enable industrial extraction of methane accumulation in goafs.
Krings et al. [19] presented methane emission measurement techniques for shaft monitoring, introducing airborne remote sensing as a precise method for quantifying methane emissions from coal mine shafts. This approach enables accurate monitoring of greenhouse gas emissions from abandoned shafts.
Niecki [20] proposed a method for estimating methane emissions in the Silesian Coal Basin using mobile analyzers. Swolkień, Fix, and Gałkowski [21] examined methane emissions from active coal mines, while Ma et al. [22] discussed fugitive methane emissions from coal mining and post-mining activities in China. Additionally, O’Malley et al. [23] introduced innovative solutions for mitigating methane emissions from orphan wells in the United States.
The origin of mine gas has been investigated by Sechman et al. [24], who analyzed the variability in and sources of methane and carbon dioxide concentrations in the near-surface zone, as well as coalbed methane in the southwestern part of the Chwałowice Trough and adjacent areas of the Main Syncline of the Upper Silesian Coal Basin (USCB).
Research into gas emission mechanisms remains a crucial area of study. As summarized by Wrona et al. [25], existing models describe gas flow through rock masses, gas movement within mine ventilation networks, and the migration of gases to the surface following mine closure.
This topic continues to be actively explored. For example, Dziurzyński et al. [26] recently presented a numerical simulation of methane hazards occurring during the closure of mine excavations in a liquidated mine.
All the cited studies lead to the conclusion that in the case of an empty and abandoned shaft—one of the most likely emission pathways in post-mining areas—the primary cause of gas release to the surface is a decrease in atmospheric pressure. It was observed that the coefficient of determination (R2) for the relationship between barometric tendency (hPa/h) and CO2 was 0.67, while the R2 for the relationship between barometric tendency (hPa/h) and the volumetric flow rate (V [m3/s]), representing the emissions rate, was 0.81 [27]. Given the increasing intensity of extreme weather events, more frequent and severe pressure drops may lead to higher gas emissions from underground excavations. Climate change is expected to amplify this effect, as it is likely to cause more intense and frequent storms associated with deep low-pressure systems. Consequently, an increase in gas emissions from the rock mass can be anticipated.
This article presents the selected findings from a project performed under the Research Fund for Coal and Steel. The project focused, among other aspects, on investigating the extent of gas emissions from abandoned mine shafts.
This research aimed to investigate and verify whether, contrary to the previously presented findings, gas emissions from an abandoned shaft can occur during a pressure increase. Additionally, we sought to identify other meteorological factors related to the physical properties of gases that could accelerate emissions when atmospheric pressure remains relatively stable over time. Preliminary observations of gas emissions at the onset of a pressure increase were presented by Wrona et al. [25]; however, their study was based on numerical simulations. As part of this project, a series of in situ measurements were conducted to confirm the occurrence of gas emissions during the initial phase of pressure rise. Simultaneously, the dry-bulb temperature (“temperature” later in the text) of the emitted gases and the surrounding atmosphere was recorded to assess whether temperature differences could influence the emission process.
To date, no similar studies have been conducted on abandoned mine shafts.

2. Materials and Methods
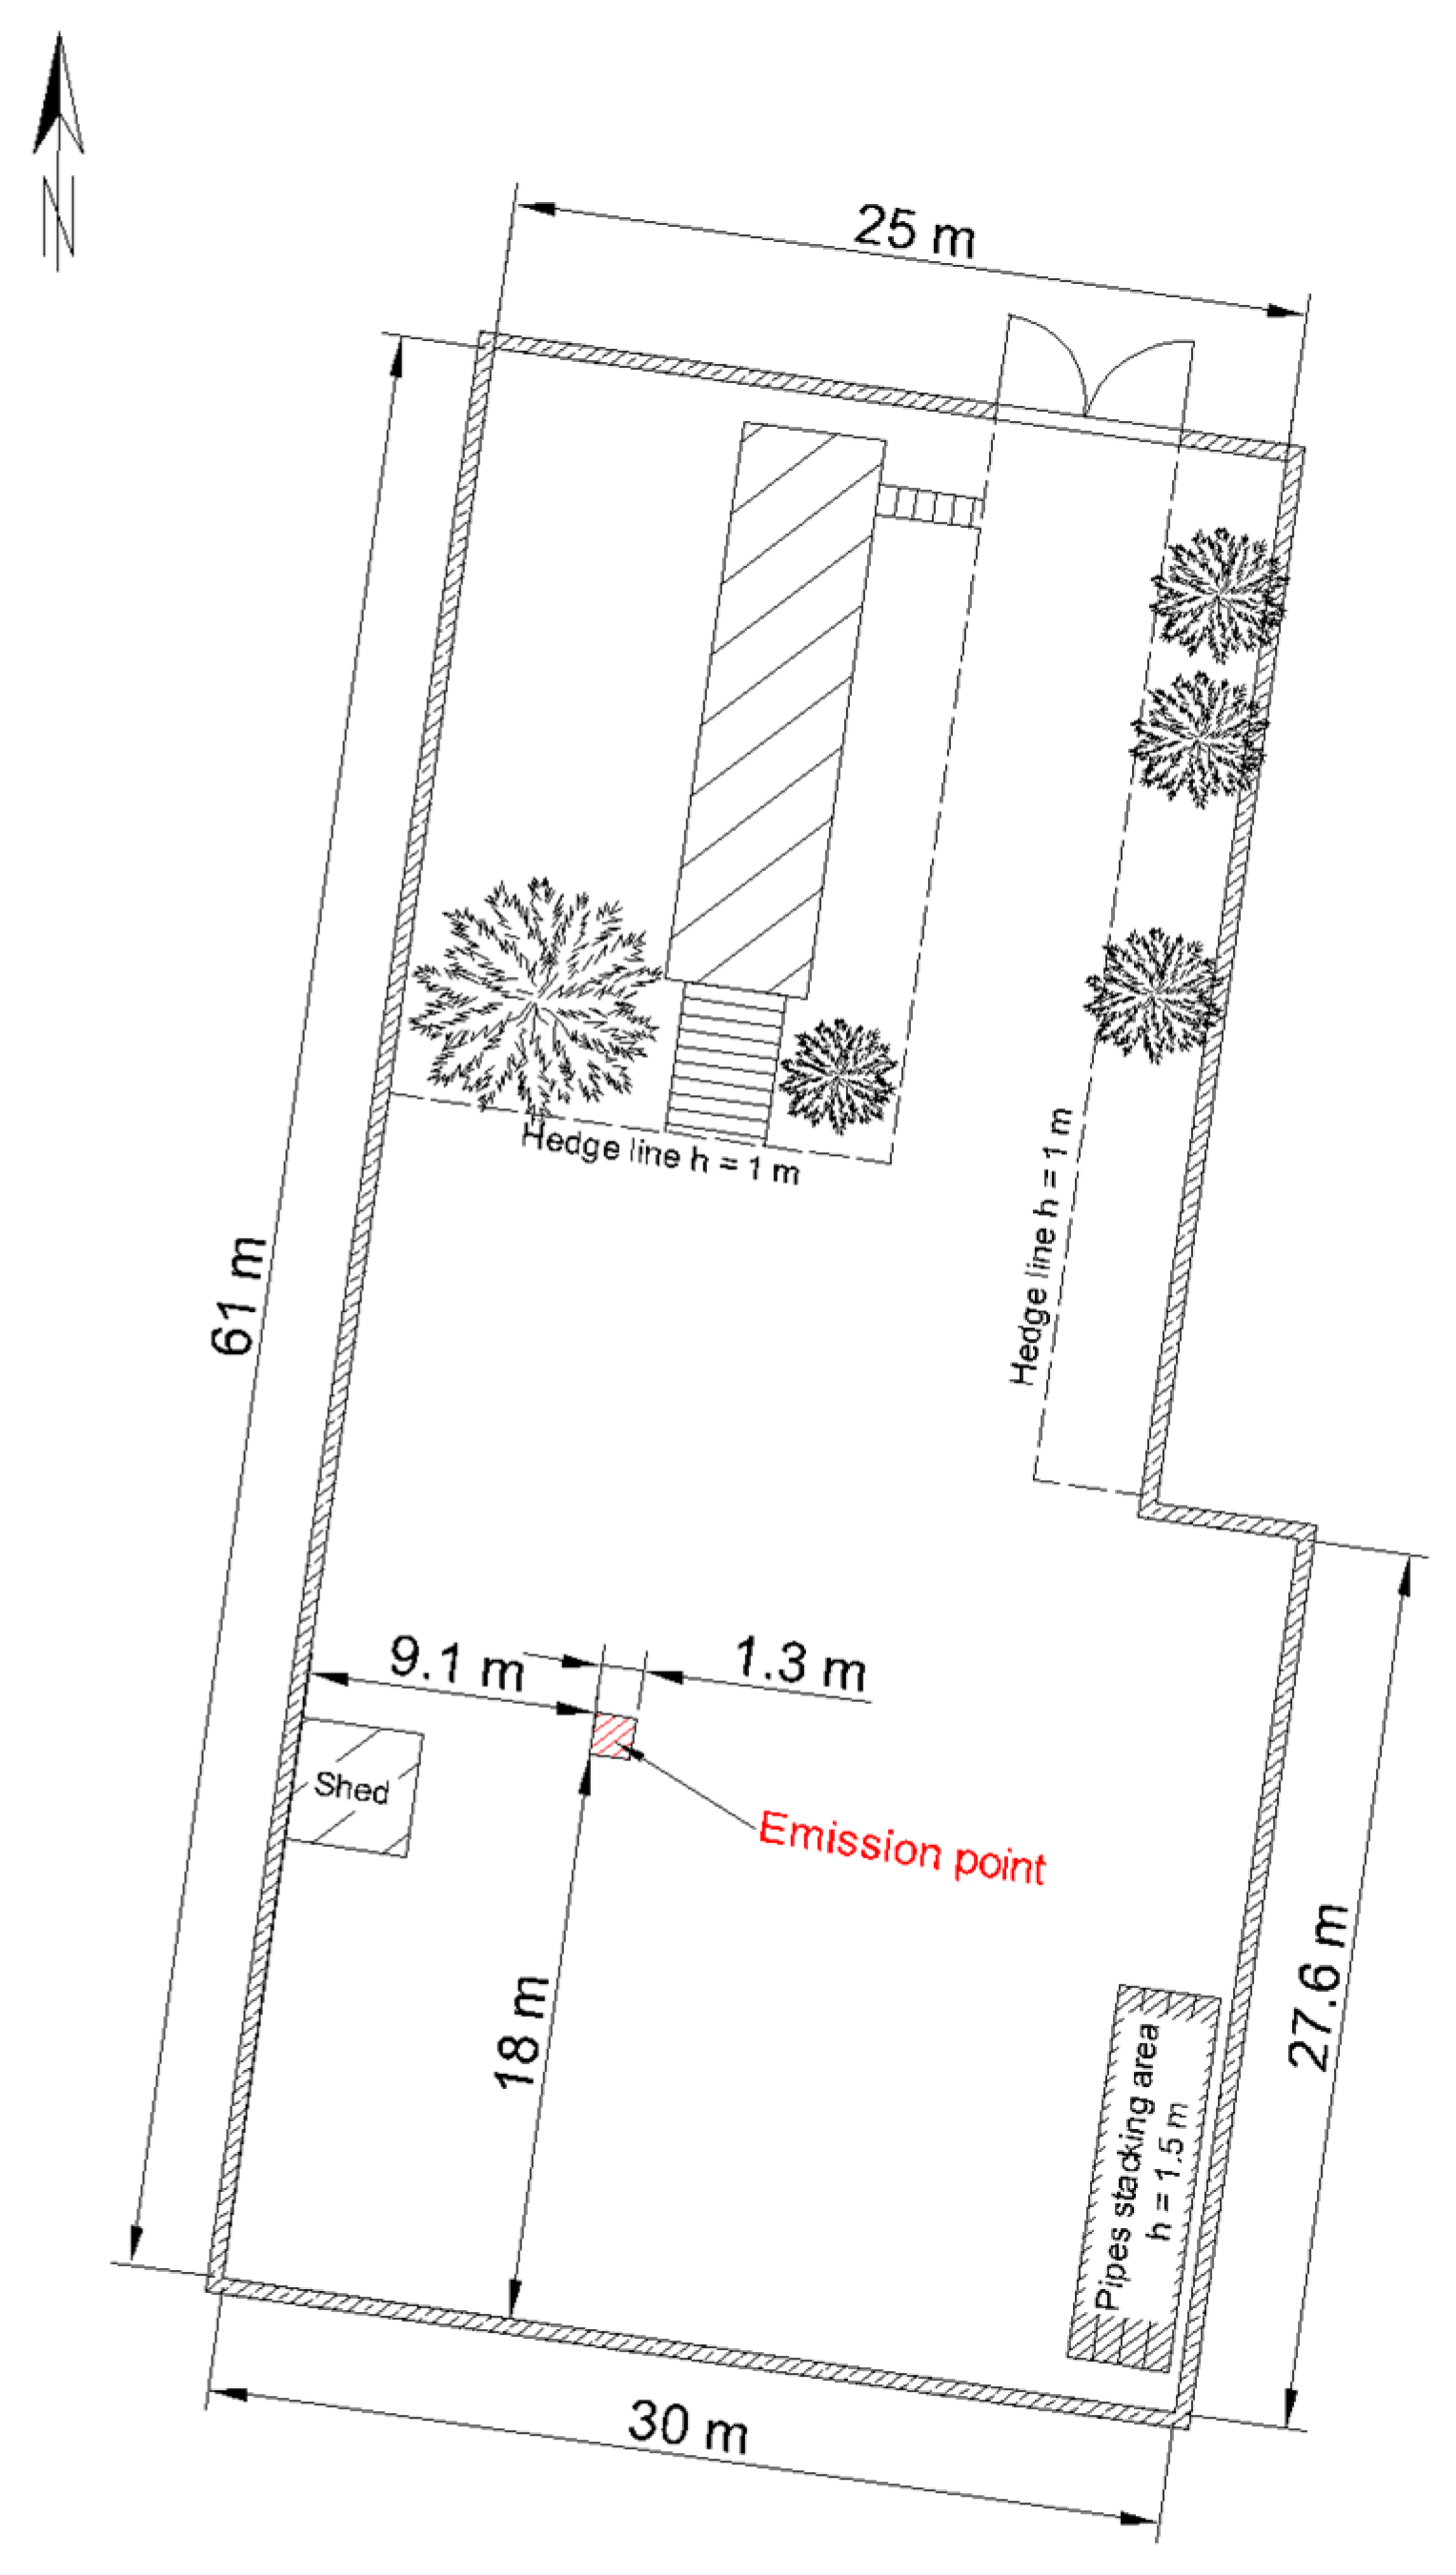
2.1. The Site

Among the several decommissioned shafts analyzed in the post-mining areas of the Upper Silesian Coal Basin, Poland, the shaft “Gliwice II” was selected for a detailed study due to the significant outflow of gases observed at this location. The beginnings of the mine date back to 1901. Exploitation began in 1912. Mining was carried out at levels of 580 and 705 m. In the mining area of the mine, seams with an average thickness of 0.9 to 3.5 m were mined. The largest extraction was recorded in 1979, when the plant extracted 4.8 mln Mg of coal. In March 2000, the mine was liquidated. Emission reduction was achieved by filling the shafts in accordance with the liquidation project; only one shaft, “Gliwice II”, was left for special purposes and pumping groundwater from neighboring mines.
The selected site is situated between two public-use buildings. This proximity raises safety concerns while also limiting gas flow to the north and south, effectively creating a wind tunnel-like structure (a kind of trench) that channels airflow, predominantly from the south. The shaft operates for water pumping purposes only and has not been backfilled. It reaches a depth of 553.2 m (−316.5 m bsl). Three coal seams, each with access to goaf areas, intersect the shaft at depths of 154.0 m, −55.9 m, and −152.2 m (relative to the sea level).
The site is illustrated in Figure 1.

2.2. Methodology

The measurement series was divided into preliminary and specific phases. Three preliminary series (conducted over three days) were carried out to define and select the appropriate methodology. The measurement methodology followed the best practices recommended by the Intergovernmental Panel on Climate Change (IPCC) in the IPCC Guidelines for National Greenhouse Gas Inventories, Volume 2: Energy, Chapter—Fugitive Emissions [28]. Additionally, they adhered to the relevant standard—ISO 10396:2007 [29].
During the preliminary measurement phase, the following steps were undertaken:
  • Determine the range and rate of emissions, gas velocity, and concentration. This allowed for the selection of appropriate measuring instruments.
  • It was observed that the gas concentration remained constant across the profiles. Consequently, the continuous traverse method was chosen to determine the average velocity.
Following the preliminary series, due to the potential for high CO2 concentrations, aspiration, isolation, and passive methods were deemed unsuitable and were abandoned. Instead, an automatic measurement approach was adopted using a gas analyzer.
The selected analytical method falls under in situ analysis, utilizing portable measuring instruments for qualitative determinations, such as gas analyzers and monitors [30].

2.3. Instruments

The following instruments were used during this study:
  • MultiRae IR Plus (JJS Technical Services, Schaumburg, IL, USA)—Gas analyzer with a resolution of 10 ppm for carbon dioxide and 0.1% for oxygen.
  • Nova MRU Plus (MRU GmbH, Neckarsulm-Obereisesheim, Germany)—Gas analyzer with an accuracy of ±0.2% for oxygen, ±2 ppm for CO, ±0.3% for CO2, ±0.03% for CH4, and ±1% for temperature measurements.
  • µAS-4 (IMG PAN, Cracow, Poland)—Digital vane anemometer with a velocity measurement error of ±(0.5% + 0.01 m/s).
  • Kestrel 4500 (Kestrel Instruments, Boothwyn, PA, USA)—Portable meteorological station with a wind speed measurement uncertainty of ±3% of the reading or ±0.1 m/s (within the 0.4–40 m/s range) and a temperature measurement accuracy of ±1 °C. Pressure measurement resolution: 0.1 hPa.
  • Davis Vantage Pro2 (Davis Instruments Corporation, Hayward, CA, USA)—Portable meteorological station with a pressure accuracy of ±1 hPa, a pressure measurement resolution of 0.1 hPa, and a temperature measurement accuracy of ±0.3 °C. It was used as a backup device.
Air pressure was measured using a Kestrel 4500 device positioned near the emission source. From the perspective of atmospheric pressure measurements, the location was appropriate. Data were recorded with manual readings taken and recorded on an hourly or more frequent basis. The same device and methodology were employed to measure the dry temperature of the atmospheric air. Emission parameters were measured using three instruments, all placed within the emission point (presented in Figure 1):
  • Nova MRU Plus: Data were recorded with manual readings taken and recorded on an hourly or more frequent basis. The instrument employed a gas collection tube for safety purposes and was used to measure CO2, O2, CO, and CH4, as well as the temperature of the emitted gases.
  • MultiRae IR Plus: Data were recorded with manual readings taken and recorded at hourly or more frequent intervals. This device served as a backup for CO2 measurement.
  • µAS-4: Manual measurements were conducted using a device mounted on a boom for safety purposes. Readings were taken and recorded on an hourly or more frequent basis to measure the gas velocity.

3. Results

A total of 15 measurement series (conducted over 15 days) were carried out across all seasons. The series included 71 subseries (hourly measurements), of which 11 were deemed unreliable and excluded from further analysis (mainly, they were too short for technical reasons unexpected work around the shaft), or a sudden change in weather conditions (heavy rain preventing the continuation of measurements). The measurements focused on recording the temperature, velocity, and gas concentrations (carbon dioxide, oxygen, methane, and carbon monoxide) of the gas mixture emitted from the emission point.
Additionally, the following environmental data were collected in the vicinity of Shaft II:
  • Atmospheric temperature and pressure (ambience);
  • Wind speed;
  • Wind direction;
  • Background gas concentrations.
  • Additional data were used for other topics related to the project.
An example of measurement results from a single day is presented in Table 1.
Throughout all the measurement series, the hourly pressure changes (dp) ranged from −1.0 hPa/h to +1.0 hPa/h. The temperature difference (dt) between the atmosphere and the emitted gases varied between +11.1 °C and −4.4 °C. The following two examples illustrate selected measurement series in which dynamic weather events occurred:
  • The first example demonstrates that gas emissions from an abandoned shaft can occur despite an increase in atmospheric pressure.
  • The second example highlights that even in the absence of a significant pressure drop, the temperature difference between the surrounding environment and gases within the rock mass can trigger their emission into the atmosphere.

3.1. Inertia of Gas Emissions (Example 1)

On August 22nd, before the arrival of the atmospheric front (17:00), the air temperature reached 34.4 °C, while the temperature of the emitted gases was 26.4 °C at 14:30. Between 14:00 and 17:00, prior to the front’s arrival, the CO2 concentration increased to 2.37% vol., while the oxygen concentration dropped to 17.0% vol. During this period, the highest recorded temperature difference between the ambient air and the emitted gases was +11.1 °C.
From 17:00 to 18:00, the atmospheric pressure increased from 981.0 hPa to 982.0 hPa, resulting in a mean positive barometric tendency of 1.0 hPa/h for this period. During this hour, the CO2 concentration decreased from 2.37% vol. to 0.0% vol., the O2 concentration increased from 17.0% vol. to 20.9% vol., and the emission velocity dropped from 1.99 m/s to 0.0 m/s.
The collected data are presented in Table 2.
In this example, it is important to analyze the variation in the temperature difference between the ambient air (tamb) and the emitted gases (tgas). Throughout the series of measurements and during changes in pressure, a notable shift in this temperature difference was observed, ranging from 8.5 °C to 12.0 °C, and then falling to 3.3 °C. The maximum difference occurred when the pressure trend transitioned from negative to positive. At that point, the hourly rate of pressure change was relatively small, at 0.5 hPa/h, while the CO2 concentration reached its peak at 2.37% by volume, and the emissions velocity was recorded as a maximum of 2.37 m/s. Consequently, despite the relatively low hourly rate of pressure change, the significant temperature difference between the atmosphere and the gases likely played a role in accelerating the emission process.
The above in situ observation also leads to an important conclusion: the process of gas emission from closed mines is subject to inertia, which becomes evident during highly dynamic weather phenomena (e.g., extreme weather events in the future). Despite the positive barometric tendency recorded from 17:00, CO2 emissions from the shaft were still observed. An increase in atmospheric pressure does not always indicate a safe gas situation in the vicinity of the shaft. Gas emissions from a closed shaft may persist for up to an hour after the barometric tendency shifts from negative to positive.
During the inertia phenomenon, the relationship between the gas flow rate and atmospheric pressure is a characteristic of the ‘gas reservoir–atmosphere’ system, indicating both the extent of the underground space in aerodynamic contact with the atmosphere and the flow resistance. Due to the inability to directly access these underground spaces to verify these values, the individual contributions of various factors remain unknown. The time taken for the cessation of gas flow when transitioning from a downward to an upward pressure trend (referred to as the inertia phenomenon) serves as an indicator of the reservoir size. A similar phenomenon has been observed during the ventilation of closed underground mine areas, specifically during methane release in mines influenced by atmospheric pressure changes.
Inertia was also found during numerical simulations of gas emissions from an abandoned shaft [25], and preliminary results from the project were published in the article [31]. The results presented in this article confirm and extend these initial observations.
Based on the results we obtained during the tests and presented in Example 2, it can be assumed that the measurement interval during pressure fluctuations can be 15 min. In terms of safety, the best would be continuous monitoring of the site. In the case of a constant pressure drop, the time intervals can be extended up to 1 h when no change in the pressure trend is observed, but a single measurement is not enough.

3.2. Temperature Gradient as a Trigger for Gas Emission (Example 2)
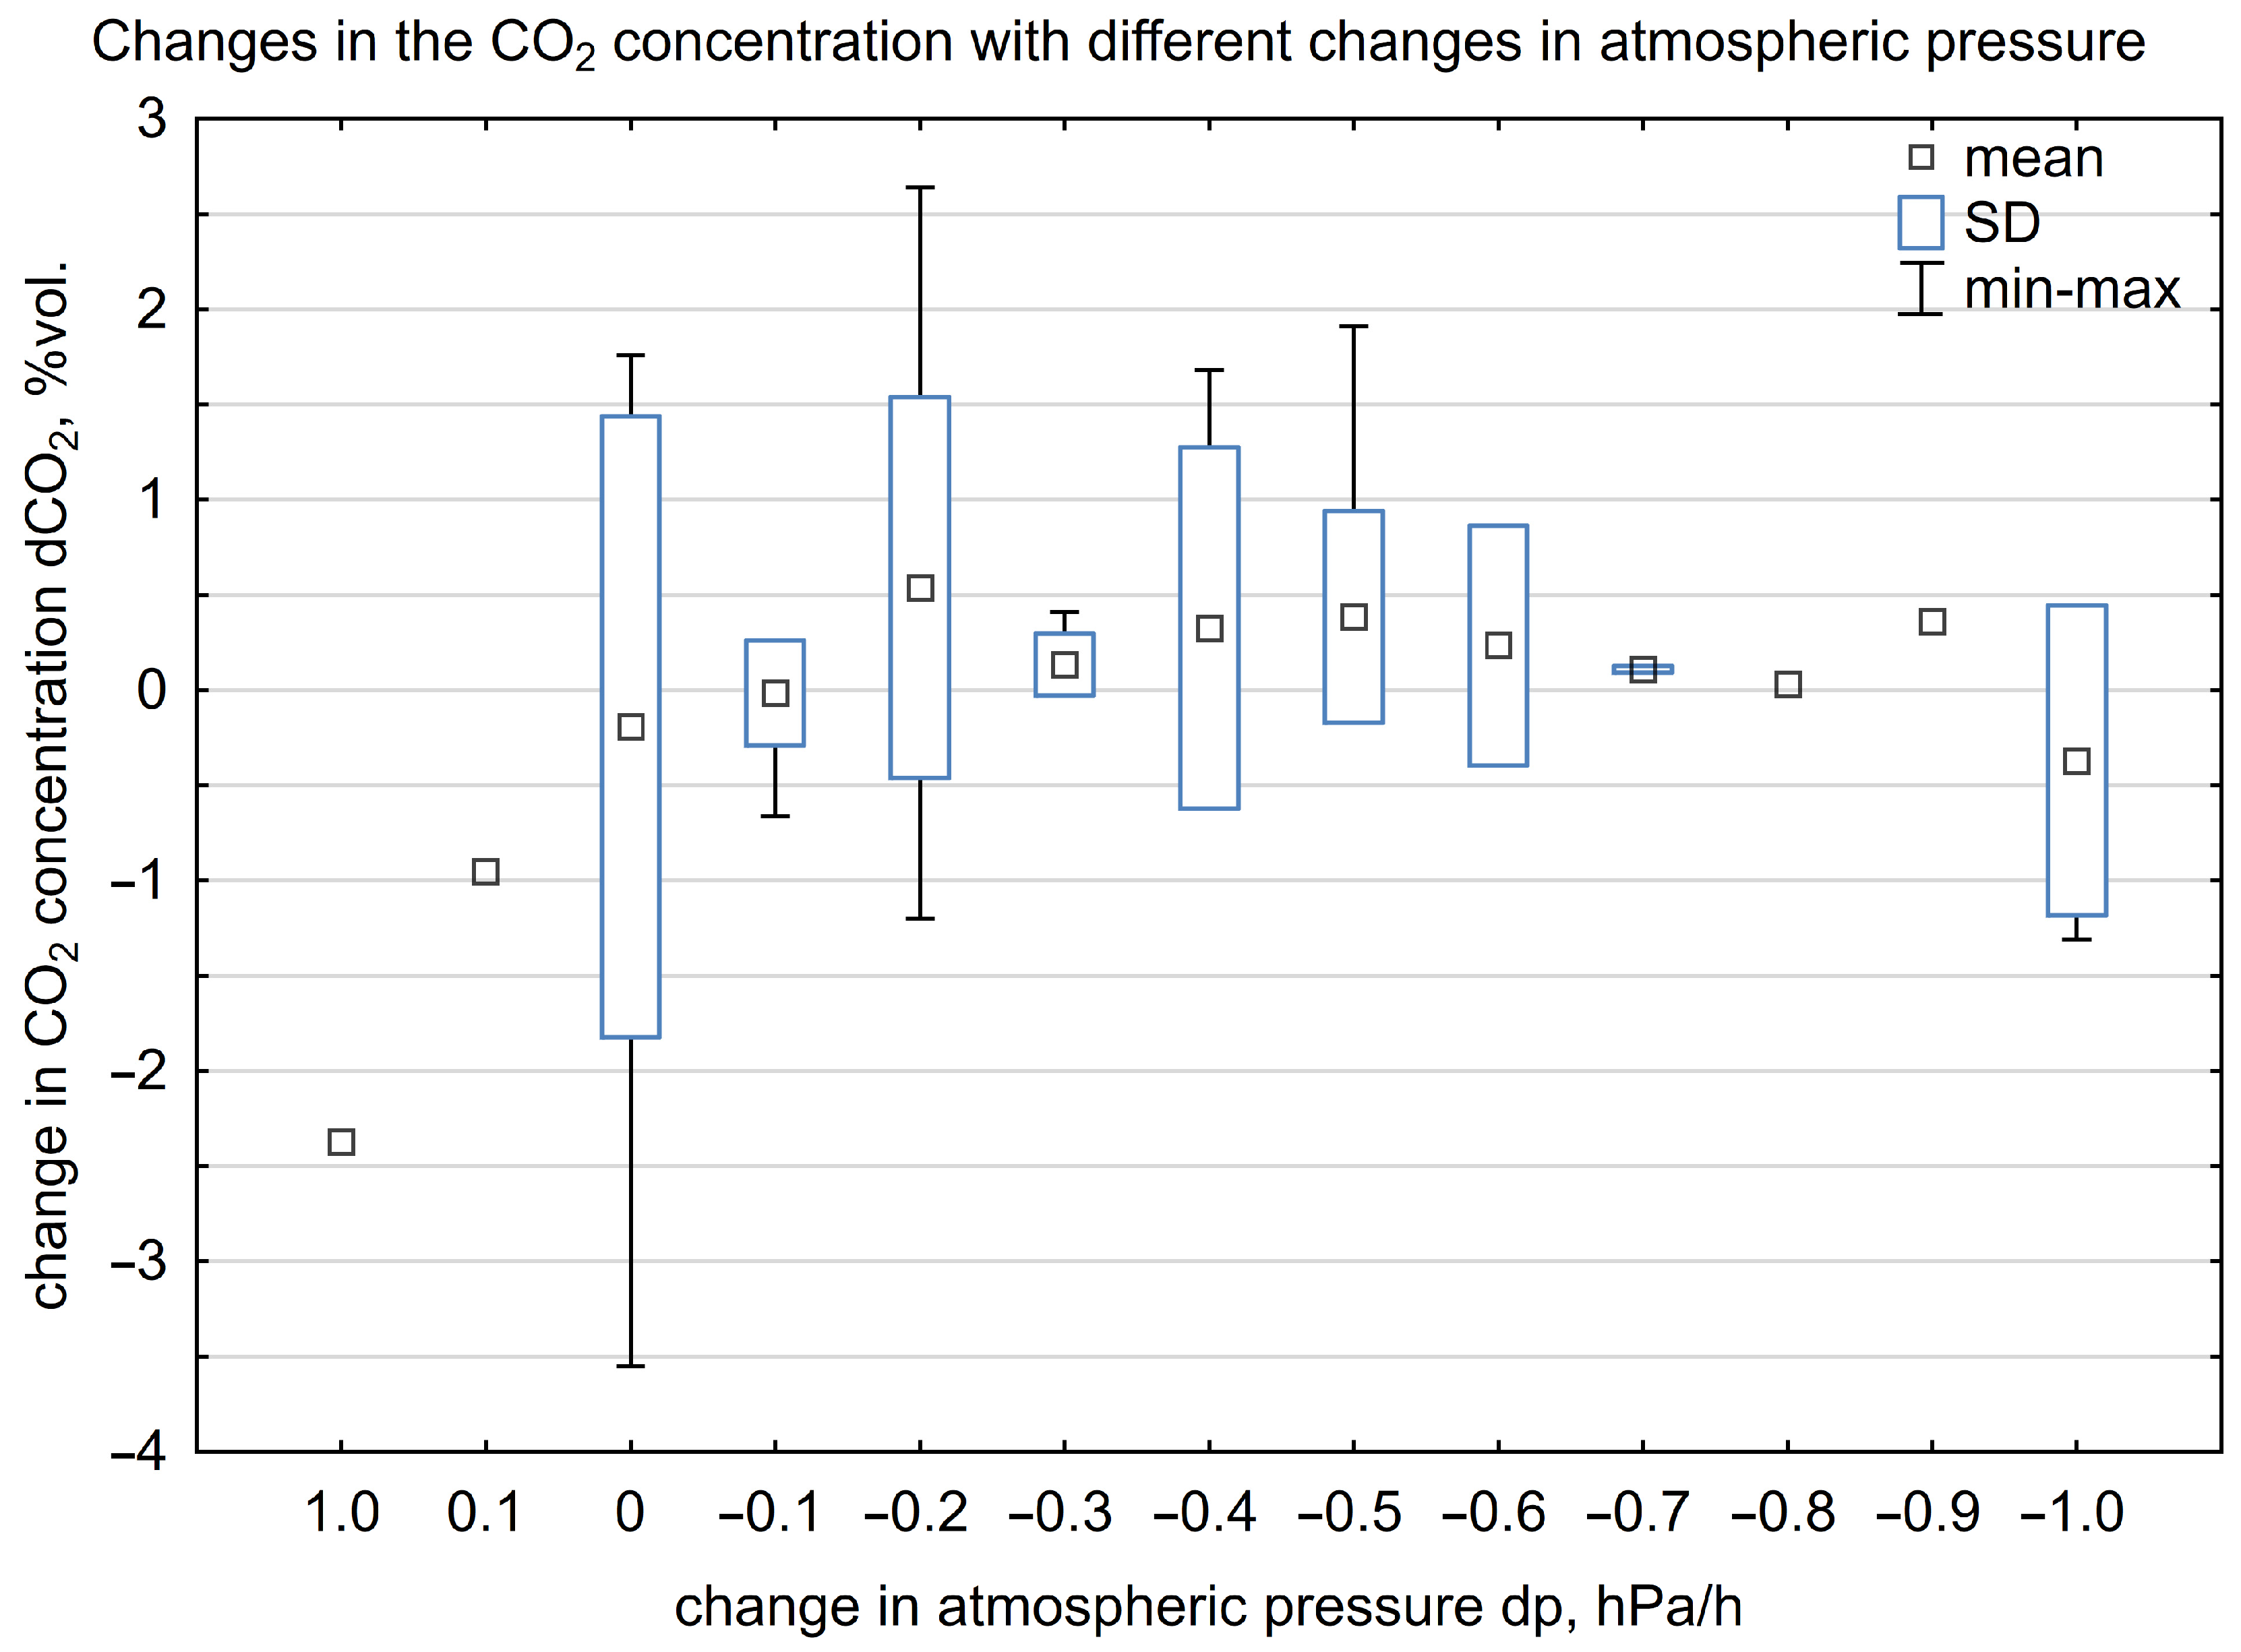
On September 16th, prior to the arrival of the atmospheric front (19:00), the air temperature reached 20.5 °C, while the temperature of the emitted gases was 18.2 °C. The measurements began at 16:00, when the CO2 concentration was 4.46% vol. By 19:00, the CO2 concentration had risen to 8.59% vol., while the oxygen concentration had dropped from 12.7% vol. to 9.9% vol. At the same time, the temperature difference between the surroundings and the emitted gases was +2.3 °C. The emission velocity during the measurements decreased from 0.43 m/s to 0.31 m/s.
This observation illustrates a scenario where a slight pressure drop is accompanied by a significant decrease in ambient temperature, leading to a subsequent drop in exhaust gas temperature. The lower exhaust gas temperature increases its density, contributing to the movement of air within the shaft toward its outlet. This airflow direction results in a rise in the CO2 concentration. The movement of air driven by thermal forces within the shaft has not been previously studied.
The data gathered are presented in Table 3.

4. Analysis

In the next step, an analysis was conducted on the hourly pressure changes and their impact on variations in the measured physical parameters (emissions rate) and chemical parameters (CO2 and O2 concentrations). The analysis included results from all the measurement series conducted, not just examples 1 and 2.
The results are presented in Figure 2, Figure 3 and Figure 4. They were processed using TIBCO Software Inc. Statistica 13 and include the mean value (mean) and standard deviation (SD), as well as minimum and maximum values (min-max).
Analyzing Figure 2, it can be observed that hourly pressure increases of +1.0 hPa/h and +0.1 hPa/h led to a decrease in the emission velocity, ranging from −1.1 m/s to −0.41 m/s. When there was no pressure change within an hour, the velocity fluctuations ranged between −0.14 m/s and +0.11 m/s, with an SD value of 0.0 m/s. Conversely, hourly pressure drops resulted in an increase in the emission velocity, reaching 0.92 m/s at a pressure change of −0.7 hPa/h.
When analyzing Figure 3, it becomes evident that hourly pressure increases of +1.0 hPa/h and +0.1 hPa/h led to a decrease in the CO2 concentration, ranging from −2.37 vol.% to −0.95 vol.%. In the absence of pressure changes within an hour, the CO2 concentration fluctuations varied between −1.76 vol.% and +3.55 vol.%, with an SD value of −0.1 vol.%. Meanwhile, hourly pressure drops resulted in an increase in the CO2 concentration, reaching 2.64 vol.% at a pressure change of −0.2 hPa/h.
Upon examining Figure 4, it is evident that hourly pressure increases of +1.0 hPa/h and +0.1 hPa/h led to a rise in the O2 concentration, ranging from 0.2% vol. to 2.5% vol. In the absence of pressure changes within an hour, the O2 concentration fluctuated between −5.1% vol. and +6.8% vol., with an SD value of +1.0% vol. Meanwhile, hourly pressure drops resulted in both increases and decreases in the O2 concentration, reaching −2.1% vol. at dp = −0.2 hPa/h and −1.9% vol. at dp = −0.5 hPa/h.
The results suggest that both the overall mean value of baric tendency and its type influence the measured parameters (emission velocity and gas concentrations). However, hourly pressure variations can introduce additional fluctuations and contribute to the phenomenon of emission inertia, as demonstrated in Example 1.
To date, no analysis has been conducted on the impact of hourly pressure fluctuations on gas emission parameters from abandoned or closed mines. The literature cited in the Introduction Section pertains to general studies of the phenomenon, for instance [16,17,27]. The results presented in this paper align with these studies. The primary factor driving gas emissions in the studied case is the overall pressure drop trend [31]. However, the authors have demonstrated that during extended periods of this pressure drop, fluctuations may occur, leading to variations in emission parameters. In an extreme case (Example 1), it has been shown that the pressure trend may even reverse. However, the process inertia, primarily due to the volume of the underground reservoir, sustains the emissions process for a certain duration. Additionally, the authors have indicated that the temperature differential between the atmosphere and the emitted gases could establish thermal conditions that accelerate the gas emission process to the surface.

5. Conclusions

The identified relationships can be utilized to enhance safety around inactive mine shafts that serve specialized functions, such as underground water pumping or potential future applications in ecological technologies, like CCS or energy storage. This study demonstrates that gases emitted from the shaft, containing CO2 at concentrations hazardous to humans, can still be detected during the initial phase of atmospheric pressure increase. This indicates that gas emissions from closed, inactive shafts exhibit inertia, which becomes apparent during highly dynamic weather events (e.g., extreme weather conditions, whose frequency is expected to increase due to climate change). Therefore, an increase in atmospheric pressure does not always indicate a safe gas situation in the vicinity of the shaft.
The results can be generalized in a certain manner; however, the local geological structure, shaft depth, and the volume of the underground reservoir—which has aerodynamic interaction with the atmosphere—along with flow resistance, will significantly influence the process being studied at a specific location. For instance, the impact of a negative pressure trend on the emission rate should be observable for each empty shaft, although the rate of emissions will depend on the aforementioned factors.
For the purpose of protecting atmospheric air, during the design phase of shaft decommissioning, consideration may be given to the future capture of mine gases, or, in the case of methane, its utilization for energy production.
These findings highlight the importance of conducting control measurements and maintaining continuous monitoring of gas concentrations around such sites. Furthermore, this study reveals that even in cases where pressure drops are not substantial, a rapid decrease in ambient temperature—accompanied by a relatively smaller drop in gas temperature—can still lead to the formation of hazardous gas concentrations near an inactive shaft. Of course, the influence of the temperature gradient on the process of gas emission from an inactive shaft should be studied further. Conducting such measurements under real conditions poses significant challenges, as meteorological parameters are unpredictable, making research planning complex. The authors intend to continue their work in this area.

Author Contributions

Conceptualization, P.W., Z.R., G.P. and A.P.N.; methodology, P.W., Z.R., G.P. and A.P.N.; software, Z.R. and A.P.N.; formal analysis, P.W., Z.R., G.P. and A.P.N.; investigation, P.W., Z.R., G.P. and A.P.N.; writing—original draft preparation, P.W., Z.R., G.P., A.P.N., M.M., A.K., M.K. and A.C.; writing—review and editing, P.W. and A.P.N.; visualization, A.P.N.; project administration, M.M. All authors have read and agreed to the published version of the manuscript.

Funding

This research was funded by the Research Fund for Coal and Steel, grant agreement no. 847250 TEXMIN “The Impact of Extreme Weather Events on Mining Operations” and scientific work published as part of an international project co-funded by the Ministry of Science and Higher Education entitled “PMW” in the years 2019–2022, contract no. 5009/FBWiS/2019/2 and contract no. 5042/FBWiS/2019/2. Research task subvention no. O6/030/BK_25/0082.

Institutional Review Board Statement

Not applicable.

Informed Consent Statement

Not applicable.

Data Availability Statement

The raw data supporting the conclusions of this article will be made available by the authors on request.

Conflicts of Interest

The authors declare no conflicts of interest. The funding sponsors had no role in the design of the study; in the collection, analyses, or interpretation of data; in the writing of the manuscript, and in the decision to publish the results.

References

  1. IPCC. Climate Change 2014: Synthesis Report. Contribution of Working Groups I, II and III to the Fifth Assessment Report of the Intergovernmental Panel on Climate Change; Core Writing Team, Pachauri, R.K., Meyer, L.A., Eds.; IPCC: Geneva, Switzerland, 2014. [Google Scholar]
  2. Cook, J.; Nuccitelli, D.; Green, S.A.; Richardson, M.; Winkler, B.; Painting, R.; Way, R.; Jacobs, P.; Skuce, A. Quantifying the consensus on anthropogenic global warming in the scientific literature. Environ. Res. Lett. 2013, 8, 024024. [Google Scholar] [CrossRef]
  3. Trisos, C.H.; Merow, C.; Pigot, A.L. The projected timing of abrupt ecological disruption from climate change. Nature 2020, 580, 496–501. [Google Scholar] [CrossRef] [PubMed]
  4. Falarz, M. Climate Change in Poland: Past, Present, Future; Springer International Publishing: Berlin/Heidelberg, Germany, 2021. [Google Scholar] [CrossRef]
  5. Domínguez-Castro, F.; Reig, F.; Vicente-Serrano, S.M.; Aguilar, E.; Peña-Angulo, D.; Noguera, I.; Revuelto, J.; van der Schrier, G.; El Kenawy, A.M. A multidecadal assessment of climate indices over Europe. Sci. Data 2020, 7, 125. [Google Scholar] [CrossRef] [PubMed]
  6. Kolendowicz, L.; Półrolniczak, M. The influence of synoptic conditions on interdiurnal atmospheric pressure changes in Poland. Int. J. Biometeorol. 2025, 69, 1015–1031. [Google Scholar] [CrossRef]
  7. Kron, W.; Löw, P.; Kundzewicz, Z.W. Changes in risk of extreme weather events in Europe. Environ. Sci. Policy 2019, 100, 74–83. [Google Scholar] [CrossRef]
  8. Williams, J.W.; Jackson, S.T.; Kutzbach, J.E. Projected distributions of novel and disappearing climates by 2100 AD. Proc. Natl. Acad. Sci. USA 2007, 104, 5738–5742. [Google Scholar] [CrossRef]
  9. Lotterhos, K.E.; Láruson, Á.J.; Jiang, L.-Q. Novel and disappearing climates in the global surface ocean from 1800 to 2100. Sci. Rep. 2021, 11, 15535. [Google Scholar] [CrossRef]
  10. Fernández, P.R.; Granda, G.R.; Krzemień, A.; Cortés, S.G.; Valverde, G.F. Subsidence versus natural landslides when dealing with property damage liabilities in underground coal mines. Int. J. Rock Mech. Min. Sci. 2020, 126, 104175. [Google Scholar] [CrossRef]
  11. Wrona, P. The influence of climate change on CO2 and CH4 concentration near closed shaft–numerical simulations. Arch. Min. Sci. 2017, 62, 639–652. [Google Scholar] [CrossRef]
  12. Al Heib, M.; Franck, C. A methodology for multi-hazard interaction assessment of abandoned mines. J. Ind. Saf. Eng. 2024, 1, 100018. [Google Scholar] [CrossRef]
  13. Duda, A.; Krzemień, A. Forecast of methane emission from closed underground coal mines exploited by longwall mining—A case study of Anna coal mine. J. Sustain. Min. 2018, 17, 184–194. [Google Scholar] [CrossRef]
  14. Duda, A.; Valverde, G.F. Environmental and Safety Risks Related to Methane Emissions in Underground Coal Mine Closure Processes. Energies 2020, 13, 6312. [Google Scholar] [CrossRef]
  15. Chen, D.; Ma, M.; Hu, L.; Du, Q.; Li, B.; Yang, Y.; Guo, L.; Cai, Z.; Ji, M.; Zhu, R.; et al. Characteristics of China’s coal mine methane emission sources at national and provincial levels. Environ. Res. 2024, 259, 119549. [Google Scholar] [CrossRef]
  16. Krause, E.; Pokryszka, Z. Investigations on Methane Emission from Flooded Workings of Closed Coal Mines. J. Sustain. Min. 2013, 12, 40–45. [Google Scholar] [CrossRef]
  17. Lunarzewski, L. Coal Mine Goaf Gas Predictor. In Proceedings of the 10th Coal Operators Conference, Wollongong, Australia, 18–20 February 2019; pp. 1–12. [Google Scholar]
  18. Chmiela, A. The Choice of the Optimal Variant of the Mine Liquidation due to the Possibility of Obtaining Methane from Goafs. Eur. J. Bus. Manag. Res. 2023, 8, 89–95. [Google Scholar] [CrossRef]
  19. Krings, T.; Gerilowski, K.; Buchwitz, M.; Hartmann, J.; Sachs, T.; Erzinger, J.; Burrows, J.P.; Bovensmann, H. Quantification of methane emission rates from coal mine ventilation shafts using airborne remote sensing data. Atmos. Meas. Tech. 2013, 6, 151–166. [Google Scholar] [CrossRef]
  20. Necki, J. Methane Emission Estimates for Silesia Coal Basin Using Mobile Analysers; Wydawnictwa AGH: Kraków, Poland, 2024. (In Polish) [Google Scholar] [CrossRef]
  21. Swolkień, J.; Fix, A.; Galkowski, M. Factors influencing the temporal variability of atmospheric methane emissions from Upper Silesia coal mines: A case study from the CoMet mission. Atmos. Chem. Phys. 2022, 22, 16031–16052. [Google Scholar] [CrossRef]
  22. Ma, C.; Dai, E.; Liu, Y.; Wang, Y.; Wang, F. Methane fugitive emissions from coal mining and post-mining activities in China. Resour. Sci. 2020, 42, 311. [Google Scholar] [CrossRef]
  23. O’Malley, D.; Delorey, A.A.; Guiltinan, E.J.; Ma, Z.; Kadeethum, T.; Lackey, G.; Lee, J.; Santos, J.E.; Follansbee, E.; Nair, M.C.; et al. Unlocking Solutions: Innovative Approaches to Identifying and Mitigating the Environmental Impacts of Undocumented Orphan Wells in the United States. Environ. Sci. Technol. 2024, 58, 19584–19594. [Google Scholar] [CrossRef]
  24. Sechman, H.; Kotarba, M.J.; Kędzior, S.; Kochman, A.; Twaróg, A. Fluctuations in methane and carbon dioxide concentrations in the near-surface zone and their genetic characterization in abandoned and active coal mines in the SW part of the Upper Silesian Coal Basin, Poland. Int. J. Coal Geol. 2020, 227, 103529. [Google Scholar] [CrossRef]
  25. Wrona, P.; Król, A.; Król, M. Gas outflow from an underground site—Numerical simulations into baric tendency and airflow rate relationship. Arch. Min. Sci. 2018, 63, 251–268. [Google Scholar] [CrossRef]
  26. Dziurzyński, W.; Krawczyk, J.; Pałka, T.; Krach, A.; Skotniczny, P. Methane hazard during the closure of mine excavations in liquidated mine—Numerical simulation. Arch. Min. Sci. 2023, 68, 525–538. [Google Scholar] [CrossRef]
  27. Wrona, P.; Różański, Z.; Pach, G.; Suponik, T.; Popczyk, M. Closed coal mine shaft as a source of carbon dioxide emissions. Environ. Earth Sci. 2016, 75, 1139. [Google Scholar] [CrossRef]
  28. Eggelston, S.; Buendia, L.; Miwa, K.; Ngara, T.; Tanabe, K. IPCC Guidelines for National Greenhouse Gas Inventories; Institute for Global Environmental Strategies (IGES): Hayama, Japan, 2006; ISBN 4-88788-032-4. Available online: https://www.ipcc-nggip.iges.or.jp/public/2006gl/ (accessed on 14 February 2025).
  29. ISO 10396:2007; Stationary Source Emissions—Sampling for the Automated Determination of Gas Emission Concentrations for Permanently-Installed Monitoring Systems. Edition 2; International Organization for Standardization: Geneve, Switzerland, 2007. Available online: https://www.iso.org/standard/39508.html (accessed on 12 December 2024).
  30. Namieśniak, J.; Łukasiak, J.; Jamrógiewicz, Z. Pobieranie Próbek Środowiskowych do Analizy; Wydawnictwo Naukowe PWN: Warszawa, Poland, 1995; ISBN 8301117656. [Google Scholar]
  31. Wrona, P.; Różański, Z.; Pach, G.; Niewiadomski, A.; Suponik, T. The influence of pressure drop on gas emissions from a mining shaft—An overview. J. Sustain. Min. 2021, 20, 20–27. [Google Scholar] [CrossRef]
Figure 1. Overview of the site (Shaft II).
Sustainability 17 03875 g001
Figure 2. Variations in the outflow velocity under different atmospheric pressure changes.
Sustainability 17 03875 g002
Figure 3. Variations in the CO2 concentration under different atmospheric pressure changes.
Sustainability 17 03875 g003
Figure 4. Variations in O2 concentration under different atmospheric pressure changes.
Sustainability 17 03875 g004
Table 1. Example dataset from a measurement series.
Hour
hh:mm
Pressure
hPa
tamb.
°C
tgas
°C
Wind Speed
m/s
Wind
Direction
Velocity of Emission
m/s
CO2 *
%vol.
O2
%vol.
CH4
%vol.
CO
ppm
09:00991.715.618.10.4–0.7S. SE0.280.0620.800
10:00991.515.917.41.4–1.8S. SE0.430.0920.400
11:00991.416.717.30.5–2.1S. SE0.390.120.400
12:00991.415.217.31.0–1.7S. SE0.30.2520.400
13:00991.316.317.20.2–1.2S. SE0.290.2920.400
14:00990.515.516.71.1–1.3S. SE0.340.3220.300
15:00990.115.616.81.1–1.5S. SE0.390.3820.200
16:00989.615.416.80.4–1.8S. SE0.430.420.100
17:00989.115.616.60.8–2.2S. SE0.470.4220.100
18:00988.615.616.70.5–1.8S. SE0.510.4820.100
* Background CO2 level: 390 ppm.
Table 2. Gas emissions—example 1.
Hour
hh:mm
Pressure
hPa
tamb.
°C
tgas
°C
Δt
°C
Wind Speed
m/s
Wind
Direction
Velocity of Emission
m/s
CO2 1
%vol.
O2
%vol.
CH4
%vol.
CO
ppm
14:00982.532.423.98.51.4–2.2SN/A 21.2319.000
14:30982.434.426.48.01.0–2.2N1.031.5217.500
15:00982.033.322.211.10.8–3.5N1.291.6417.300
16:00981.533.823.110.70–0.4N1.651.7217.000
17:00981.033.721.712.00.8N1.992.3718.400
17:30981.330.723.47.30.7S1.101.6320.500
17:45981.628.623.25.41.6–2.5SE0.990.2920.700
18:00982.027.424.13.31.0–2.4N0020.900
1 Background CO2 level: 560 ppm. 2 Missing data due to a technical inability to take measurements.
Table 3. Gas emissions—example 2.
Hour
hh:mm
Pressure
hPa
tamb.
°C
tgas
°C
Δt
°C
Wind Speed
m/s
Wind
Direction
Velocity of Emission
m/s
CO2 *
%vol.
O2
%vol.
CH4
%vol.
CO
ppm
16:00985.928.520.65.41.1–2.9S0.434.4612.700
16:30985.528.320.57.80.7–2.2S0.345.6310.70.020
17:00985.427.119.67.50.8–1.9S0.356.3710.800
17:30985.326.219.46.80–0.9S0.336.9110.300
18:00985.224.418.95.50.3–1.0S0.297.4010.300
18:30985.121.818.33.50–0.1---0.328.349.800
19:00985.020.518.22.30–0.6S0.318.599.900
* Background CO2 level: 550 ppm.
Disclaimer/Publisher’s Note: The statements, opinions and data contained in all publications are solely those of the individual author(s) and contributor(s) and not of MDPI and/or the editor(s). MDPI and/or the editor(s) disclaim responsibility for any injury to people or property resulting from any ideas, methods, instructions or products referred to in the content.

