Article

Partial Substitution of Inorganic Fertilizer with Organic Manure and Reduced Phosphorus Inputs Enhance Rice Yields and Phosphorus Fertilizer Efficiency

1
MOE Key Laboratory of Environment Remediation and Ecological Health, College of Environmental and Resource Sciences, Zhejiang University, Hangzhou 310058, China
2
Key Laboratory of Urban Environment and Health, Institute of Urban Environment, Chinese Academy of Sciences, Xiamen 361021, China
3
Yangtze Delta Region Healthy Agriculture Institute, Jiaxing 314500, China
4
Cultivated Land Quality and Fertilizer Administration Station of Zhejiang Province, Hangzhou 310020, China
*
Author to whom correspondence should be addressed.
These authors contributed equally to this work.
Sustainability 2025, 17(9), 3878; https://doi.org/10.3390/su17093878
Submission received: 30 March 2025 / Revised: 18 April 2025 / Accepted: 20 April 2025 / Published: 25 April 2025

Abstract

:
Chemical phosphorus (P) fertilizers generally exhibit low utilization efficiency. The combined application of chemical fertilizers and organic manure is considered an effective strategy to improve soil P availability and crop yields. However, the long-term effects of partially substituting chemical P fertilizer with organic manure on P fertilizer efficiency and crop yield remain poorly understood. To address this, a 5-year field experiment was conducted in a double-rice cropping system to evaluate the impact of substituting chemical P fertilizer with organic manure on rice yield, apparent P recovery (APR), and soil P availability. Our results showed that compared to conventional chemical fertilization (NPK), substituting 20% of P with organic manure, while maintaining the same total N, P, and K inputs (CM(P)), increased grain yield by 4.59% and soil Olsen-P content by 25.48%. In contrast, 20% swine manure substitution with reduced P input (CM(-P)) sustained rice yield and soil Olsen-P levels comparable to NPK. Additionally, treatments CM(P) and CM(-P) increased APR by 59.91% and 82.50%, respectively, and the P activation coefficient by 139.13% and 171.74%. Rice yield and APR were significantly positively correlated with soil Olsen-P, suggesting that manure-induced improvements in soil P availability promoted both rice yield and APR. Overall, our study demonstrates that partial substitution of chemical P fertilizer with organic manure, particularly with reduced P input, is a sustainable fertilization strategy for enhancing P fertilizer efficiency and maintaining crop yields.

1. Introduction

To meet the ever-growing demand for food production, high amounts of chemical phosphorus (P) fertilizer have been continuously applied to farmland in the last few decades [1,2,3]. However, only 10–25% of applied P can be utilized by crops due to the high P-fixation capacity of soils [4,5], resulting in large amounts of non-available P remaining in the soil and potentially posing severe environmental challenges [6,7]. Moreover, most chemical P fertilizers are derived from phosphate rock, a non-renewable resource expected to be depleted in 50–100 years [8,9]. Substantial regional disparities in phosphorus fertilizer use efficiency are evident worldwide, with southern China being one of the regions exhibiting the most severe P surplus and the lowest P fertilizer use efficiency in agricultural soils [10], which is mainly attributed to the long-term overapplication of P fertilizers by farmers [9]. Consequently, using renewable P resources and improving P fertilizer use efficiency have emerged as key strategies for achieving long-term agricultural sustainability, thereby highlighting the urgent need to explore alternative and more efficient P management approaches [11].
It has been estimated that manure produced in China contains over 5.2 megatons of P annually, and this renewable P resource is widely recognized as an alternative to chemical P fertilizers [12]. Previous studies have revealed that organic manure can promote soil P cycling and increase crop yield by activating the soil microbial community and stimulating the dissolved organic matter (DOM)-mediated adsorption and desorption process [13,14,15,16,17]. However, excessive manure application can also induce severe environmental problems such as P and metal leaching and antibiotics spreading [18,19,20]. Moreover, the gradual release of P from organic manure typically sustains crop uptake for several years following application [21]. Therefore, optimizing manure use to maximize its agronomic benefits while minimizing environmental risks requires a deeper understanding of how manure influences soil P dynamics and crop uptake under different application regimes.
The partial substitution of chemical P fertilizer with manure is a widely recognized fertilization practice with high efficiency in improving soil P availability and crop yield [22,23]. Although manure application has been shown to improve the recovery efficiency of chemical P fertilizers, this practice often leads to excessive P inputs due to the low N/P ratio of manure. Additionally, results can vary depending on soil type and cropping system [14,24,25,26]. P use efficiency is crucially evaluated through P budgeting approaches that assess the balance between inputs and outputs. Evaluating P management performance typically relies on these balances to determine fertilization effectiveness and sustainability [27]. In particular, it has been reported that the spatiotemporal variations in the P budget and use efficiency were primarily associated with shifts in the ratio of chemical fertilizer P to manure P [28]. Given the substantial legacy P accumulated in soils from long-term chemical fertilizer application, the strong potential of organic manure to mobilize fixed soil P presents a promising opportunity to reduce total P input without compromising crop yields. Nevertheless, there is a notable lack of field-based, long-term studies evaluating how the co-application of organic manure and chemical fertilizers under reduced P input influences both crop productivity and P use efficiency, especially in soils with high P fixation capacity.
The double-rice cropping system is a key agricultural practice widely implemented across southern China, where large amounts of chemical P fertilizer have been applied, and soils exhibit strong P fixation. In this study, a 5-year field experiment with a double-rice cropping system was carried out in Jiangxi Province. This study aims to improve the assessment of P footprints in order to increase the efficiency of P resource management in sustainable agriculture. Based on the above research background, we hypothesized that (1) the application of organic manure can significantly enhance the availability of soil P and subsequently crop yields; (2) partial substitution of chemical P fertilizer with organic manure under reduced P input may enhance the apparent P recovery efficiency (APR) of chemical P fertilizers. The findings of this study may provide insights into optimizing fertilization strategies and balancing the soil P budget in double-rice rotation systems, with the potential to promote sustainable agricultural development.

2. Materials and Methods

2.1. Site Description and Experimental Design

The field experiment was conducted over five years with five rice–rice rotations in Sixi Town, Yichun City, Jiangxi Province, China (115°07′13″ E, 28°15′2″ N). This region, located in one of China’s most important rice-producing areas, has a subtropical monsoon climate, characterized by an average annual temperature of 17.2 °C and mean annual precipitation of 1680 mm. The experimental field is situated on typical paddy soil derived from river alluvial deposits, classified as Fe-accumulated Stagnic Anthrosols. Two rice crops were planted as a buffer crop one year before the start of the experiment. The initial properties of the topsoil (0–20 cm) were as follows: pH 5.40, 16.3 g kg−1 of soil organic carbon (SOC), 1.06 g kg−1 of total nitrogen (TN), 0.55 g kg−1 of total phosphorus (TP), 21.1 g kg−1 of total potassium (TK), 140.2 mg kg−1 of available nitrogen (AN), 17.0 mg kg−1 of Olsen-P, and 104.1 mg kg−1 of available potassium (AK).
The field trial was conducted in a double-rice cropping system: early rice (indica rice, Zhongjiazao 17), transplanted in late April and harvested in late July, and late rice (indica rice, Wufengyou T025), transplanted immediately after the early rice and harvested in early November. Plots measuring 8 m × 9 m were separated by concrete bunds. The experiment followed a completely randomized block design with six treatments, each having four replicates (Table 1): (1) CK: no fertilizer; (2) NK: chemical N and K; (3) NPK: chemical N, P, and K; (4) M(20%P): swine manure alone with 20% of total P input; (5) CM(P): substituting 20% of chemical P with swine manure at the same total nutrient input as the NPK treatment; (6) CM(-P): optimized fertilization with a further 20% reduction in chemical P compared to CM(P).
The chemical fertilizers, including N (urea), P (calcium–magnesium phosphate), and K (potassium chloride), were applied accordingly. The nutrient composition of swine manure varied slightly from year to year, with an average of 46% organic matter, 1.86% TN, 1.53% TP, and 0.68% TK. N fertilizer was applied as both basal and supplementary fertilizer in a 6:4 ratio for early rice and a 5:5 ratio for late rice, while the chemical P and K fertilizers and manure were applied as basal fertilizers. Apart from fertilization, all plots received the same management practices, including tillage, sowing, and harvesting. The topsoil was tilled before each crop, and rice straw was removed after each harvest.
However, this experiment was conducted over five years in a rice–rice rotation system, and several uncontrollable factors, such as heavy rainfall or drought, could have impacted some results, particularly crop growth and productivity. Future studies may consider conducting experiments in greenhouse environments to mitigate the impact of such uncontrollable factors and enhance the accuracy and reliability of the data. Furthermore, due to the specific irrigation conditions and cultivation practices associated with the rice–rice rotation system, the generalizability of our findings may be limited. As such, the effects of different fertilization strategies on soil P cycling in other crop rotation systems require further investigation.

2.2. Sampling and Laboratory Analysis

Soil samples (0–20 cm) were collected at the rice maturity stage in each cropping cycle. In each plot, approximately 10 randomly taken soil cores were combined to form a composite sample. Samples were stored at 4 °C after removing visible plant debris, stones, and soil fauna, before the measurement of water-soluble inorganic P (Pi) and phosphatase activity. The samples were then air-dried, ground, and passed through a 2 mm sieve for the determination of soil Olsen-P content.
Soil pH was measured in a 1:5 (w/v) soil-to-water suspension using a pH meter (Orion Star A211, Thermo Scientific, Waltham, MA, USA). Olsen-P was extracted with NaHCO3 solution [29] and quantified using the molybdenum-blue method [30]. Pi was extracted with deionized water and determined using the molybdenum-blue method [30]. SOC content was determined by the external-heat potassium dichromate oxidation-colorimetric method [31]. TP was measured using the molybdenum-blue method [30] after digestion with sulfuric and perchloric acids. Ammonium nitrogen (NH4⁺-N) and nitrate nitrogen (NO3⁻-N) were extracted with 2 M KCl solution and quantified using a flow injection analyzer (FLA sta 5000, Foss, Hilleroed, Denmark). Soil phosphatase activities (acid phosphomonoesterase—ACP; alkaline phosphomonoesterase—ALP; and phosphodiesterase—PDE) were determined following the protocol described by Tabatabai [32].
Rice grains from each plot were weighed and recorded after threshing and air-drying. About 0.5 kg of grain was randomly collected, dried at 65 °C, and weighed to determine the weight of the dried grain. Five samples of aboveground rice biomass were collected from each plot, dried at 65 °C, weighed, and then separated into straw and grain. The straw-to-grain ratio was calculated. Straw biomass was estimated by multiplying the oven-dried grain weight by the straw-to-grain ratio. The oven-dried samples were finely ground and analyzed for TP content using the molybdenum-blue method [30] after digestion with sulfuric acid and hydrogen peroxide.

2.3. Calculation

Based on the amount of P fertilizer applied and crop aboveground P uptake in 10 cropping seasons, soil P surplus (PS, kg ha−1 season−1) and budget (Pb, kg ha−1) in a given season were calculated as follows:
P S = P input P output
P b = i n P S
where Pinput (kg ha−1 season−1) is equal to the amount of P applied in a given season. The P input from seed, irrigation, pesticide application, and atmospheric deposition can be considered negligible in this area, as their contribution to the overall P budget is minimal compared to the P input from fertilization. While these sources of P are unavoidable and their precise quantification is challenging, all treatments in this experiment were subjected to the same conditions. Therefore, these inputs can be safely neglected without compromising the accuracy of the results [33]; Poutput (kg ha−1 season−1) was the amount of aboveground P uptake because the P loss to surface waters and P leaching have limited impact from an agronomic perspective [28]; i was the season.
Poutput was calculated as follows:
P output = Y S   ×   C S + Y g   ×   C g 1000
where YS (kg ha−1) and Yg (kg ha−1) are the biomass of straw and grain yield, respectively; CS (g kg−1) and Cg (g kg−1) represent the P content of straw and grain, respectively.
APR was calculated as follows:
APR = P output     P cont P input   ×   100 %
where Pcont is the P output of treatment without P application (the NK treatment in this study).
We described the quantitative relationship between the soil Olsen-P, water-soluble Pi, and P budget as follows:
y = a   ×   x + b
where the slope a in the linear equation between soil Olsen-P and P budget is defined as the P activation coefficient [26].

2.4. Statistical Analysis

The yield and P uptake of grain and straw, APR, Olsen-P, and Pi were analyzed using a two-way analysis of variance (ANOVA) with cropping season and fertilization treatment as categorical variables. Differences in these variables across cropping seasons for each treatment, and among treatments within each season, were assessed using one-way ANOVA. Significant differences were determined by Tukey’s test at a significance level of p < 0.05. Outliers were identified and removed based on visual inspection. No data standardization was applied, as all variables were measured in consistent units and scales. To ensure the accuracy and reliability of the data, certified reference soils with known nutrient concentrations and physicochemical properties were included in each batch of measurements as internal controls. All statistical analyses were conducted using SPSS version 25.0 software.

3. Results

3.1. Soil Properties Under Different Fertilization Treatments

Our results showed that different fertilization regimes significantly affected all soil properties (Table 2). After 5 years of fertilization, the highest soil TP content was observed in NPK, with significant increases in CM(P) and CM(-P) compared to CK, but not in NK and M(20%P) (p < 0.05). Compared to other fertilization regimes, both CM(P) and CM(-P) significantly increased soil pH, SOC content, and phosphatase activities (including ACP, ALP, and PDE) (p < 0.05), while the lowest soil pH was observed in NK and NPK. Soil Olsen-P content was significantly higher in treatments with chemical P fertilizers [NPK, CM(P), CM(-P)] than in those without [CK, NK, M(20%P)] (p < 0.05), with the highest levels observed in the CM(P) treatment (p < 0.05).

3.2. Rice Yield, P Uptake, and P Recovery Efficiency Under Different Fertilization Treatments

The grain yield in CK and M(20%P) was consistently lower than in other treatments across 5 years (Figure 1). During the last 3 years, the highest grain yields were consistently observed in CM(P), and no significant differences were observed between NPK and CM(-P) among all the crop seasons (Figure 1 and Table A1). The seasonal average grain yield and grain P uptake had no significant differences between CM(-P) and NPK (p > 0.05), whereas these two indices, and also the straw yield and straw P uptake, were the highest in CM(P) treatment (p < 0.05) (Table 3). Moreover, both CM(P) and CM(-P) had significantly higher seasonal average straw yield and P uptake than NPK (p < 0.05). Additionally, both the yield and P uptake of grain and straw were significantly lower in the treatments without chemical P fertilizers, including CK, NK, and M(20%P) (p < 0.05; Table 3). These results suggest that organic manure application significantly enhances crop yields by improving P uptake efficiency in rice, supporting our first hypothesis.
As shown in Figure 2, the rice aboveground P uptake and soil P surplus in NPK, CM(P), and CM(-P) were significantly higher than those in treatments without chemical P fertilizer. Compared to NPK, both CM(P) and CM(-P) significantly increased aboveground P uptake (p < 0.05), driven by higher grain and straw P uptake. The highest and lowest soil P surpluses were observed in NPK (11.37 kg ha⁻1 season⁻1) and CM(-P) (4.04 kg ha⁻1 season⁻1), respectively. Consistent with our second hypothesis, the seasonal average APR index in CM(P) and CM(-P) was higher than in NPK, with increases of 59.91% and 82.50%, respectively. These results suggest that organic manure partially substitutes chemical P fertilizers, and reduced P input may enhance the APR of chemical P fertilizers.

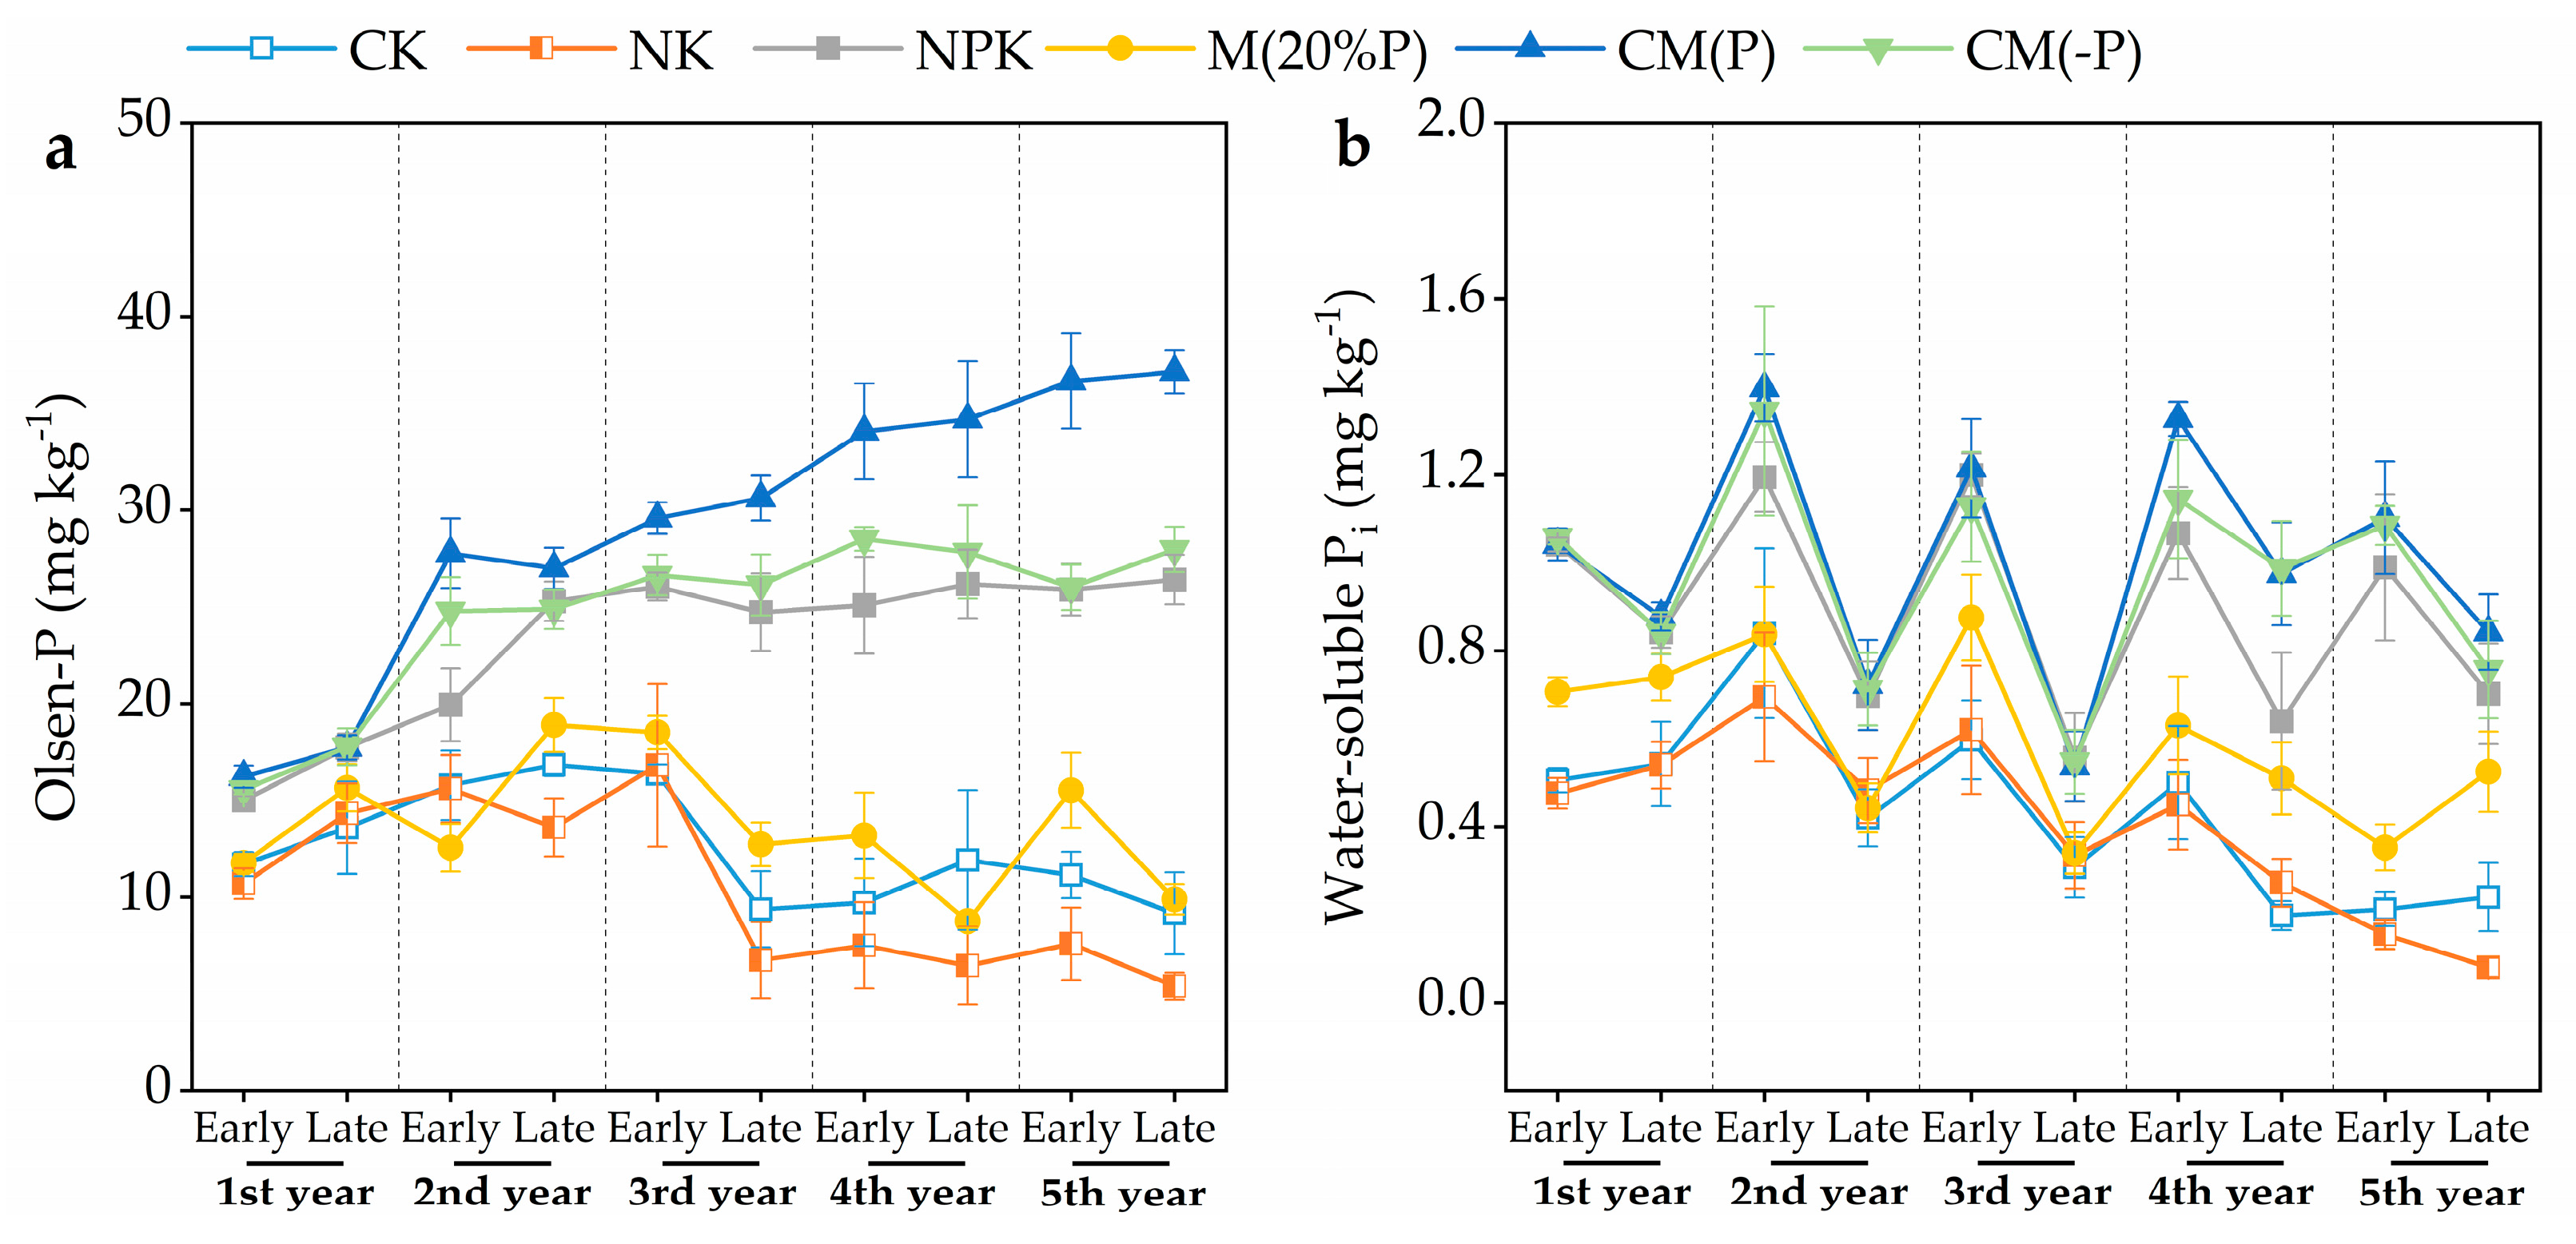
3.3. Soil Olsen-P and Water-Soluble Pi Under Different Fertilization Treatments

As shown in Figure 3, the soil Olsen-P and water-soluble Pi contents in NPK, CM(P), and CM(-P) were significantly higher than CK, NK, and M(20%P) (p < 0.05), and the lowest soil Olsen-P content was observed in NK (Figure 3a and Table A4). Compared with NPK, CM(P) resulted in the highest seasonal average soil Olsen-P and water-soluble Pi contents, and CM(-P) only increased seasonal average soil Olsen-P content alone (Table 3). Moreover, the soil Olsen-P in CM(P) increased steadily over the five years of the experiment, whereas Olsen-P contents in NPK and CM(-P) rose rapidly during the first two years, followed by more stable fluctuations over the next three years (Figure 3a and Table A4). This suggests that the application of organic manure, combined with reduced chemical P input, did not decrease soil P availability, which could help maintain rice yield at high levels. Furthermore, the soil water-soluble Pi content in NPK, CM(P), and CM(-P) remained stable over 5 years of cultivation, despite seasonal fluctuations, whereas it gradually decreased in CK, NK, and M(20%P) (Figure 3b and Table A4).

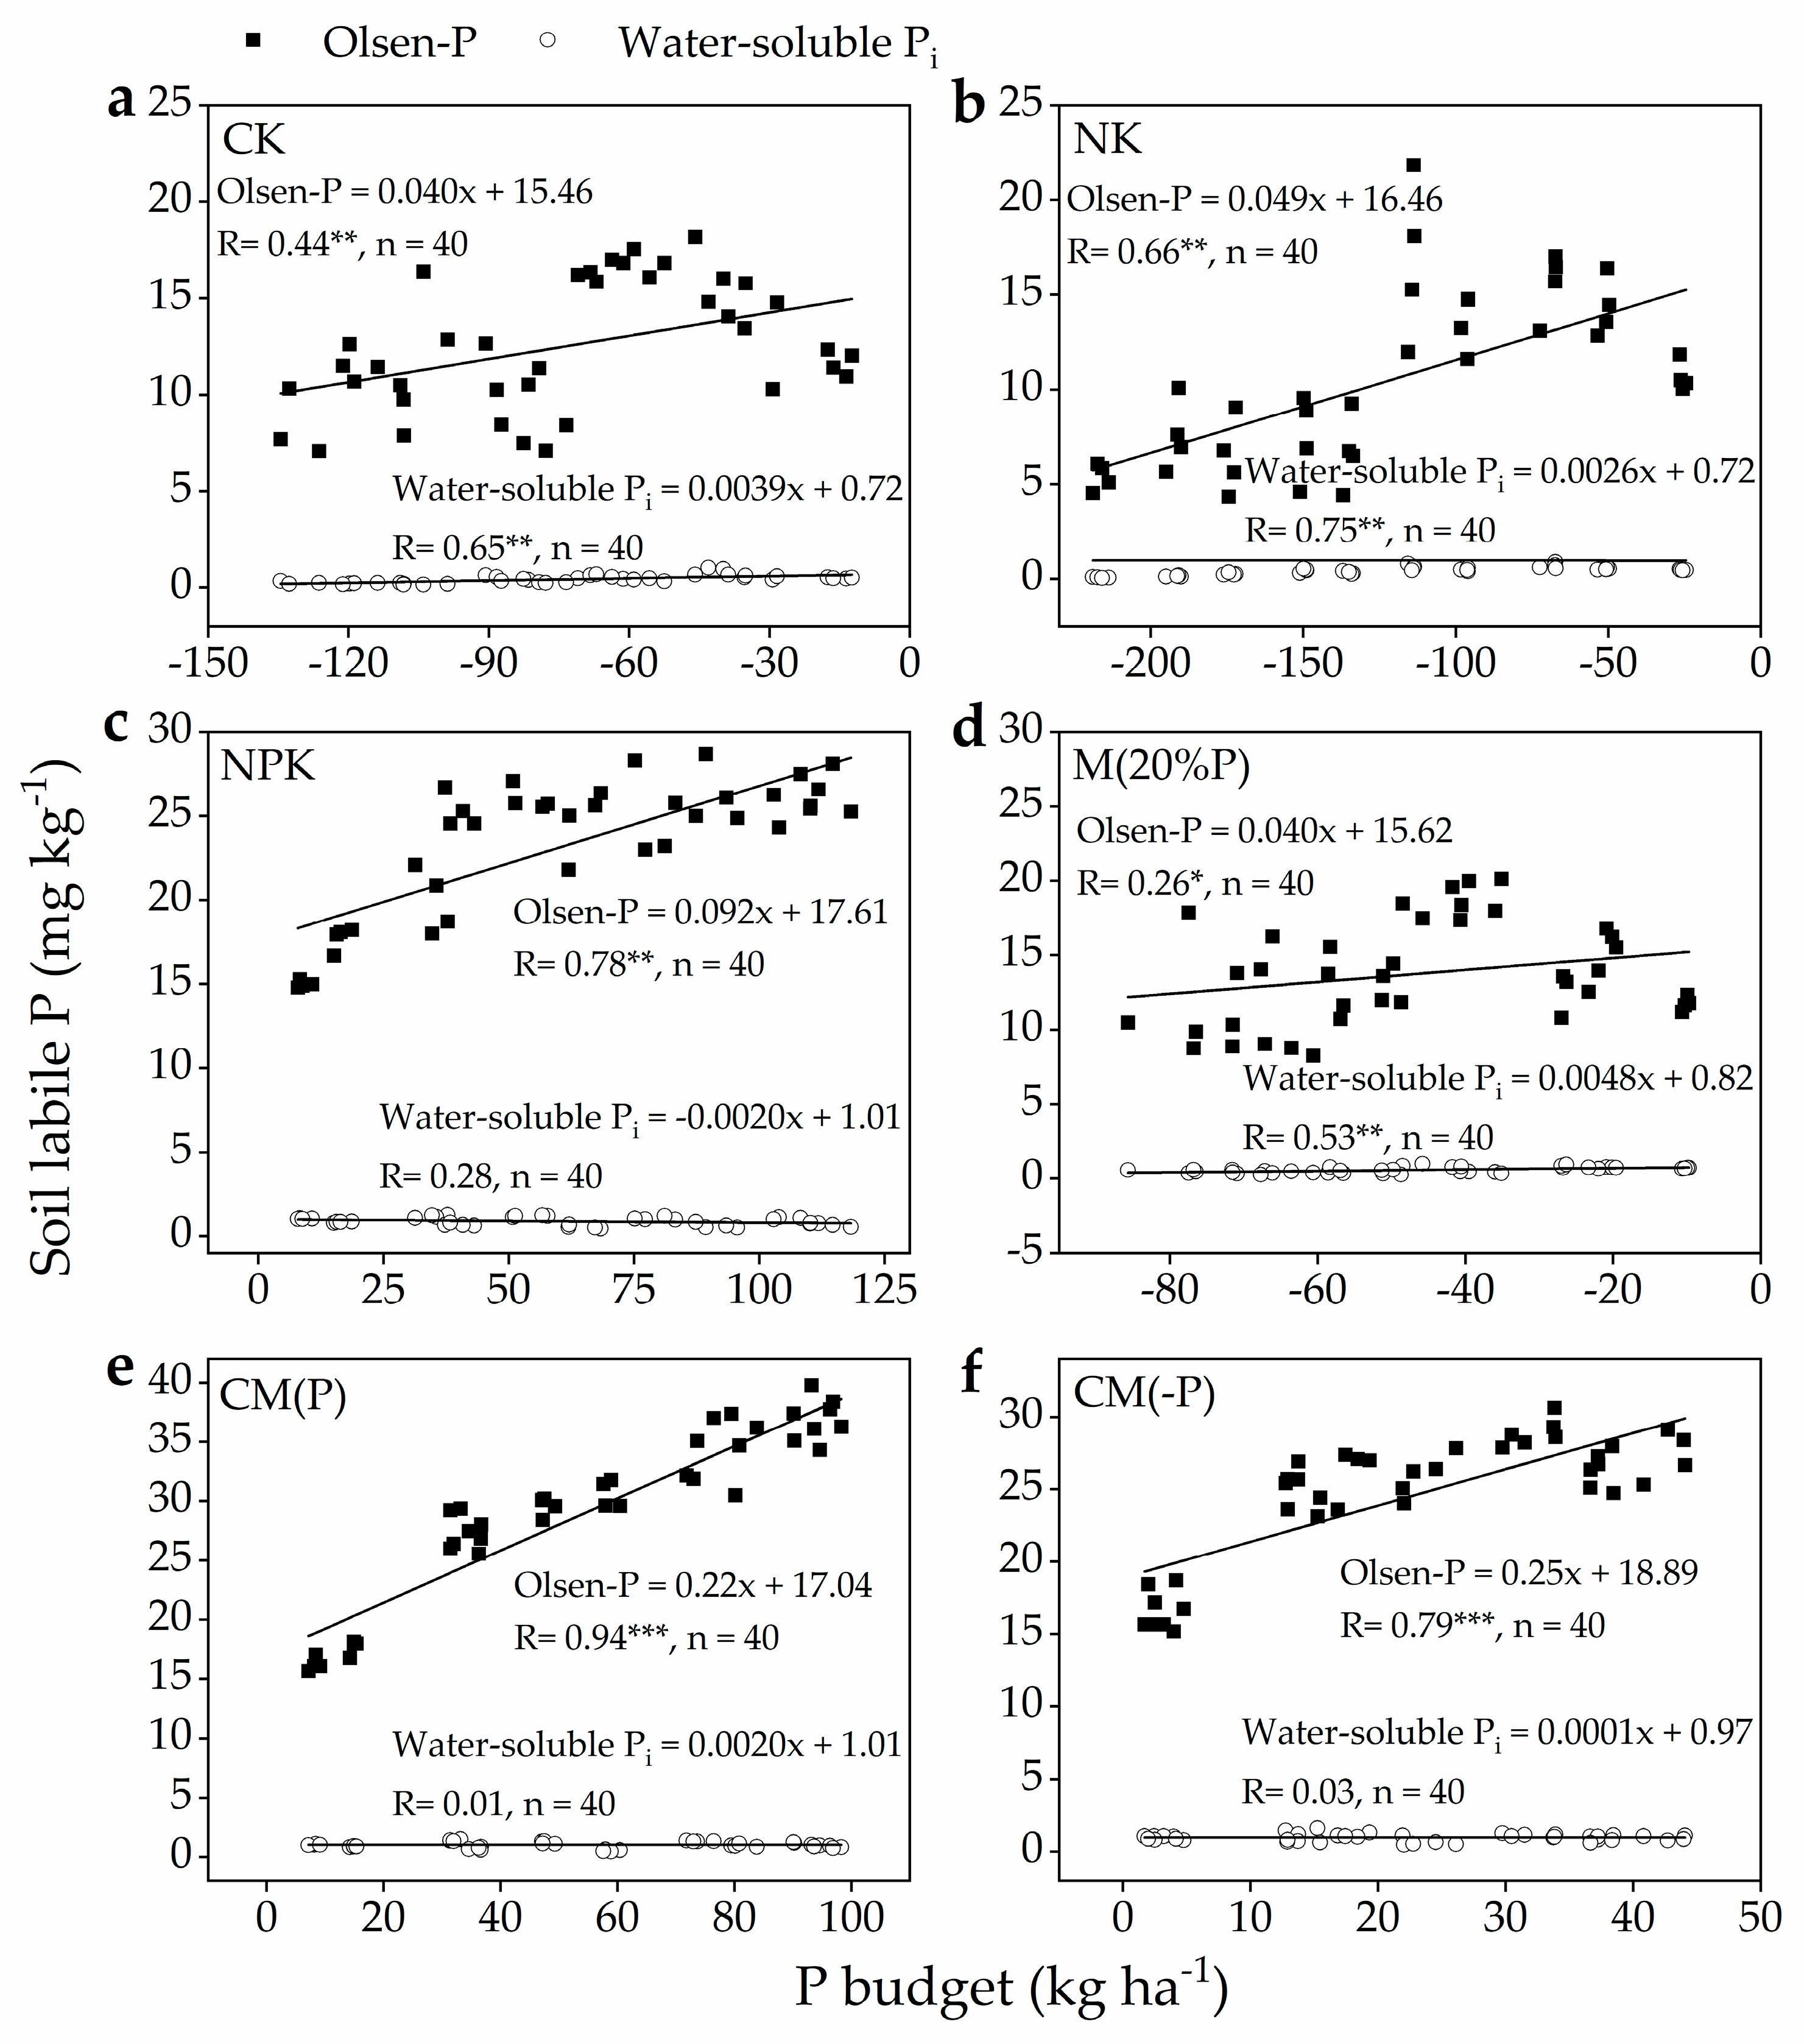
3.4. Correlations Between Soil Olsen-P, Water-Soluble Pi, and Rice Yield

Soil Olsen-P was significantly positively correlated with the soil P budget across all treatments, whereas soil water-soluble Pi showed a significant positive correlation with the soil P budget only in the CK, NK, and M(20%P) treatments (p < 0.05, Figure 4). According to the fitting formula, each 100 kg ha⁻1 of P deficit in soil resulted in a decrease in soil Olsen-P by 4.00, 4.90, and 4.00 mg kg⁻1 in CK, NK, and M(20%P), respectively. Similarly, each 100 kg ha⁻1 of P surplus in soil caused an increase in soil Olsen-P by 9.20, 22.00, and 25.00 mg kg⁻1 in NPK, CM(P), and CM(-P), respectively (Figure 4). Based on covariance analysis, CM(P) and CM(-P) significantly improved the P activation coefficient by 139.13% (F = 22.84, p < 0.001) and 171.74% (F = 54.00, p < 0.001), respectively, in comparison with NPK. Pearson correlation analysis revealed that grain yield, grain P uptake, straw yield, straw P uptake, and aboveground P uptake were significantly positively correlated with both soil Olsen-P and water-soluble Pi, while APR was significantly positively correlated only with soil Olsen-P (Figure 5).

4. Discussion

4.1. Substituting Chemical P with Organic Manure Maintained Crop Yield by Enhancing Soil P Availability

Previous studies have demonstrated that the combined application of inorganic and organic fertilizers can enhance soil fertility and crop nutrient uptake [34,35]. In this study, we further found that the highest Olsen-P content, rice yield, and aboveground P uptake were consistently observed in the manure substitution treatment at the same total P as chemical fertilization, particularly during the last three years of the experiment. This supports our first hypothesis, indicating that organic manure promotes greater P uptake by crops. We attribute this to two main factors. First, our results show that compared to the original soil, chemical fertilization was the only treatment to increase soil TP content after 5 years, while continuous organic manure substitution significantly reduced soil TP content (Table 2). This suggests that the fixed P accumulated in the soil can be substantially activated by organic manure, likely due to increased soil phosphatase activity [36]. Second, the long-term application of organic manure can significantly improve soil physicochemical properties (Table 2), which in turn facilitates crop nutrient uptake from chemical fertilizers [34,37]. However, the highest concentrations of Olsen-P and water-soluble Pi in the manure substitution treatment with standard P inputs also imply that some soil P remained inefficiently utilized, which may increase the risk of P leaching, particularly in frequently flooded paddy soils [19,38]. Thus, these findings suggest that substituting organic manure for chemical P fertilizers with high P input may not be the most suitable fertilization strategy, especially in soils with high accumulated P levels. Additionally, agronomic practices such as increasing ridge height, controlling irrigation input, and prolonging water retention time may help reduce P loss via surface runoff under high P input conditions.
Quantifying P input and output provides critical insights into soil P budget, use efficiency, and environmental risk. These metrics are essential for optimizing fertilization strategies that sustain crop yield while minimizing excess P accumulation and potential leaching risks [39]. Our results further found that organic manure substituting 20% of chemical P with a 20% reduction in total P input was still able to maintain the same high rice yields as chemical fertilization. Our findings corroborate those of a previous long-term fertilization experiment in a rice–rice rotation system, which showed that replacing all chemical P with organic fertilizers while reducing total P input to 80% of the NPK treatment could sustain rice yields comparable to those achieved with chemical fertilizers alone [20]. Therefore, our and their study together suggest that reducing total P input is a more sustainable fertilization strategy. This practice also kept soil available P levels consistent with those observed in chemical fertilization and significantly lower than the manure substituting treatment with high P inputs, indicating a more economical strategy that mitigates environmental pollution risks while sustaining crop productivity. Although similar results have been reported previously, where the application of manure combined with chemical fertilizers increased the yields of wheat and maize [22,40], those findings were obtained under conditions of increased total nutrient inputs. Our study, from the perspective of P input, further demonstrates that partial substitution of chemical fertilizers with manure can sustain high rice yields, even when total P input is reduced. However, despite the significant increase in aboveground P uptake, most of this P was allocated to the straw in two manure substitution treatments, while the grain P uptake in most growing seasons was not significantly higher than that under chemical fertilization (Table A1, Table A2 and Table A3). Therefore, future studies should focus on enhancing the remobilization of P from shoot to grain to further reduce chemical P inputs while maintaining or increasing crop yields [41,42]. In summary, our study shows that manure partially substituting chemical P fertilizers with a reduction of total P input is a promising fertilization strategy that can sustain high yields in a double-rice cropping system, which also potentially minimizes the risk of P loss from the soil.

4.2. Manure Application Enhanced the Utilization Efficiency of Chemical P Fertilizer

High P fertilizer use efficiency is essential to enhance crop yields and mitigate the depletion of phosphate rock resources [39,43]. The APR represents the efficiency of applied P fertilizer recovery during the first growing season. Soil with higher P fixation capacity typically leads to lower APR and excessive P accumulation [10]. In this study, chemical fertilization resulted in the highest TP content, P surplus, and the lowest Olsen-P content among all treatments with chemical P fertilizers. This consequently led to the lowest average APR of 15.89%, which is comparable with previous studies [28,44]. Furthermore, despite the varying magnitudes, all treatments with chemical P fertilizer in this study caused P accumulation in the soil. These findings highlight the critical need to reduce the use of chemical P fertilizers and improve their efficiency. However, previous studies have shown that completely replacing chemical P fertilizers with organic manure, while reducing total P input, can significantly decrease P use efficiency after prolonged application [20]. This suggests that the complete exclusion of chemical P fertilizers is also an unsustainable fertilization strategy.
In this study, we found that partial substitution of chemical P fertilizers with organic manure is an effective strategy for improving APR and reducing P surplus in the soil, with this effect being more pronounced under reduced total P input. It confirms our second hypothesis. Although this can partially be attributed to the reduced total P input, the significantly higher average straw yield and P uptake further suggest that enhanced soil P availability was the primary factor driving the high APR. This could be further supported by the significant correlation between soil available P and crop P uptake and APR (Figure 5). Moreover, the highest P activation coefficient was observed in the manure substitution treatment with reduced P input (Figure 4), reinforcing the idea that such a fertilization practice can effectively activate non-available P in chemical fertilizers or P fixed in the soil. In short, our findings demonstrate an efficient fertilization strategy that enhances the APR of chemical P fertilizers by applying organic manure with reduced total P input. Notably, we also found that compared with chemical fertilization, the manure-induced increase in yields, P uptake, and APR were more pronounced during the last two years of the experiment (Figure 1 and Figure 2). This suggests that manure may require several years to stimulate soil P activation and subsequently improve crop yields. We attribute these slow responses to the gradual optimization of the soil microbial community under long-term manure application [45,46,47], which aligns with the manure-induced increase in phosphatase activity observed in this study (Table 2). Additionally, another possible explanation is the gradual accumulation of soil organic carbon (SOC) and higher soil pH in manure-treated soils, as a previous study reported that these manure-induced changes play a key role in improving soil P availability by reducing soil P sorption [16]. Compared with previous studies focusing on the soil P budget under different fertilization regimes with the same P inputs [39,48], our study provides a practical and scalable fertilization strategy that emphasizes partial manure substitution under reduced total P input. This approach simultaneously improves the APR of chemical P fertilizers and minimizes environmental risks, especially in high P accumulation paddy soils. However, it should be noted that the applicability of optimum P application rates in our findings may be influenced by site-specific factors such as soil type, climatic conditions, and the characteristics of the organic manure used [49]. These factors can affect soil P dynamics and crop responses and should be considered when extrapolating our results to other regions or cropping systems. Future studies are therefore needed under diverse agroecosystems to validate and optimize this fertilization strategy. Altogether, our findings offer a more efficient and economical fertilization practice for promoting crop yield and APR of chemical P fertilizers and emphasize the importance of long-term continuous organic fertilization.

5. Conclusions

Our 5-year field experiment demonstrated that although organic manure substitution for chemical fertilizers under the same total P input achieved the highest rice yield, shoot P uptake, and Olsen-P levels, it also resulted in excessive P input and potential environmental risks due to underutilized P. In contrast, partial substitution of chemical P fertilizers with organic manure under reduced total P input maintained comparable rice yield and Olsen-P levels without significantly reducing shoot P uptake, while achieving the lowest soil P surplus. This strategy reduced chemical P fertilizer input by 35.6% and decreased the 5-year average soil P surplus from 11.37 to 4.04 kg ha⁻1 yr⁻1, a 64.5% reduction, leading to an 82.5% increase in APR. These results highlight the potential of this co-application strategy to activate soil P and promote crop productivity, demonstrating its feasibility as a cost-effective and environmentally sustainable strategy for rice production. Moreover, the beneficial effects of manure application became more evident after three years, likely driven by increased phosphatase activity and accumulated SOC content. By integrating P input–output balance with APR and activation coefficient assessments, our study provides a comprehensive framework for evaluating soil P dynamics. This study underscores the innovative potential of manure-enhanced activation of fixed soil P, contributing to more efficient use of existing P pools. Based on these insights, we recommend partially substituting chemical P fertilizers with organic manure under reduced total P input as a practical management strategy. This approach can inform region-specific nutrient management policies aimed at improving P sustainability in intensive rice systems.

Author Contributions

Conceptualization, X.L. (Xiaoxia Liu) and X.L. (Xianyong Lin); methodology, B.J. and Z.T.; software, K.L.; validation, Z.T., Y.S. and K.L.; formal analysis, B.J. and Z.T.; investigation, Y.S. and K.L.; resources, X.L. (Xiaoxia Liu) and X.L. (Xianyong Lin); data curation, Y.S. and K.L.; writing—original draft preparation, B.J. and Z.T.; writing—review and editing, X.L. (Xiaoxia Liu) and X.L. (Xianyong Lin); visualization, K.L.; supervision, X.L. (Xiaoxia Liu); project administration, X.L. (Xiaoxia Liu) and X.L. (Xianyong Lin); funding acquisition, B.J. and X.L. (Xianyong Lin) All authors have read and agreed to the published version of the manuscript.

Funding

This research was funded by the National Natural Science Foundation of China, grant numbers 42477335, 42077088, and 42407447; Zhejiang Province “Agriculture, Rural Areas, Rural People and Nine Institutions” Science and Technology Collaboration Program, grant number 2023SNJF039; and the China Postdoctoral Science Foundation, grant number 2023M743418. The APC was funded by the National Natural Science Foundation of China, grant number 42477335.

Institutional Review Board Statement

Not applicable.

Informed Consent Statement

Not applicable.

Data Availability Statement

The data are contained within the article.

Conflicts of Interest

The authors declare no conflicts of interest.

Abbreviations

The following abbreviations are used in this manuscript:
APRapparent P recovery
TPtotal phosphorus
SOCsoil organic carbon
ACPacid phosphomonoesterase
ALPalkaline phosphomonoesterase
PDEphosphodiesterase

Appendix A

Table A1. Two-way ANOVA testing for the effects of season, treatment, and their interactions on grain yield and grain P uptake.
ItemSeasonCKNKNPKM(20% P)CM(P)CM(-P)Mean
Grain yield
(Mg ha−1)
2013Early3.93 CDd6.33 ABb6.86 BCa4.36 CDc6.79 DEa6.72 DEa5.83 D
Late4.44 BCc5.69 Cb6.66 CDa4.51 BCc6.27 Eab6.54 EFa5.68 D
2014Early2.72 Fc4.44 Eb5.19 Ea2.83 EFc5.58 Fa5.63 Ga4.40 G
Late3.80 Dd5.53 CDc7.28 ABb3.86 Dd8.03 Aa7.73 Aab6.04 C
2015Early2.98 EFe5.07 Dc6.23 Db3.31 Ed6.60 DEa6.15 Fb5.06 F
Late5.24 Ac6.82 Ab7.70 Aa5.35 Ac7.85 ABa7.55 ABa6.75 A
2016Early2.55 Fc5.99 BCb6.82 Ca2.71 Fc7.14 CDa7.02 CDa5.37 E
Late4.98 Ac6.37 ABb7.06 BCa4.59 BCc7.45 BCa6.98 CDEa6.24 BC
2017Early3.42 DEd5.79 BCc6.79 Cb3.25 Ed7.51 ABCa7.14 BCDab5.65 D
Late4.75 ABd6.13 BCc7.00 BCb4.96 ABd7.77 ABa7.3 ABCb6.32 B
Mean3.88 d5.82 c6.76 b3.97 d7.10 a6.88 b
FactorFp
Season (S)230.96<0.001
Treatment (T)1811.93<0.001
S × T16.28<0.001
Grain P uptake
(kg ha−1)
2013Early11.99 Ac20.32 ABb23.53 Aa13.99 Ac24.46 ABa23.46 ABa19.62 A
Late13.24 Ac18.99 BCb23.31 Aa14.17 Ac23.50 Ba23.15 ABa19.39 A
2014Early7.93 BCc13.49 EFb16.24 Ca10.38 BCc17.04 Ea16.89 Da13.66 D
Late10.63 ABd21.24 Ab23.42 Aab15.22 Ac24.79 ABa23.98 ABab19.88 A
2015Early6.78 Ce15.21 DEc19.72 Bb11.14 BCd22.24 BCa22.32 Ba16.24 C
Late8.02 BCc16.75 Db22.41 Aa14.72 Ab22.65 Ba23.33 ABa17.98 B
2016Early6.17 Cc11.6 Fb18.56 Ba5.94 Ec18.57 DEa18.43 CDa13.21 D
Late13.01 Ac17.20 CDb19.33 Ba13.04 ABc19.95 CDa19.74 Ca17.05 BC
2017Early6.63 Cc12.22 Fb16.40 Ca7.44 DEc18.01 DEa17.44 CDa13.02 D
Late8.13 BCc20.26 ABb24.31 Aa9.67 CDc26.19 Aa25.09 Aa18.94 A
Mean9.25 e16.73 c20.72 b11.57 d21.74 a21.38 ab
FactorFp
Season (S)169.56<0.001
Treatment (T)1093.84<0.001
S × T9.88<0.001
The same lowercase letter after data within a row indicates no significant difference among the fertilization treatments and the same uppercase letter after data within a column indicates no significant difference among the crop seasons (Tukey’s test, p > 0.05).
Table A2. Two-way ANOVA testing for the effects of season, treatment, and their interactions on straw yield and straw P uptake.
ItemSeasonCKNKNPKM(20% P)CM(P)CM(-P)Mean
Straw yield
(Mg ha−1)
2013Early1.94 BCDd3.36 EFb3.89 DEa2.49 CDc3.74 CDab3.56 DEab3.16 EF
Late2.45 Bb3.63 DEa3.90 DEa2.27 CDb3.71 CDa3.98 Da3.32 E
2014Early1.51 Dc2.97 Fa3.10 Fa1.88 DEb3.24 Da3.12 Ea2.64 G
Late2.11 BCd4.08 CDb4.56 Cab2.75 BCc5.00 ABa4.91 BCa3.90 C
2015Early2.44 Bc2.84 Fbc3.70 Ea2.30 CDc3.50 CDab3.53 DEab3.05 F
Late3.26 Ac4.39 BCb5.27 Aa3.15 ABc4.78 ABab4.81 BCab4.28 B
2016Early1.83 CDd3.70 DEc3.73 Ec1.62 Ed4.28 BCb5.08 ABCa3.37 E
Late3.41 Ac5.12 Aab4.69 BCb3.57 Ac5.52 Aa5.58 Aa4.65 A
2017Early1.94 BCDd3.87 CDEc4.34 CDbc1.92 DEd5.25 Aa4.64 Cab3.66 D
Late3.49 Ac4.71 ABb5.13 ABa2.88 BCd5.36 Aa5.18 ABa4.46 AB
Mean2.44 d3.87 c4.23 b2.48 d4.44 a4.44 a
FactorFp
Season (S)174.445<0.001
Treatment (T)596.185<0.001
S × T9.18<0.001
Straw P uptake
(kg ha−1)
2013Early2.99 CDc5.47 CDb6.85 CDEa4.04 BCc6.64 Da6.71 CDa5.45 D
Late3.83 BCc6.34 ABCb8.42 Ba4.18 BCc9.11 BCa9.32 Ba6.87 BC
2014Early1.95 Ed4.02 EFb4.70 Ga2.68 Dc5.09 Ea4.80 Fa3.87 F
Late4.58 ABc6.78 ABb10.79 Aa4.62 Bc10.43 Ba9.91 ABa7.85 A
2015Early3.60 Cb2.52 Gc5.28 FGa3.05 CDbc5.27 Ea5.15 EFa4.14 EF
Late2.51 DEd3.85 EFc6.12 EFa2.72 Dd5.71 DEab5.07 EFb4.33 EF
2016
Early3.04 CDb3.19 FGb6.43 DEFa2.28 Dbc5.67 DEa6.19 DEa4.47 E
Late4.74 ABd6.91 Abc7.7 BCb6.45 Ac11.99 Aa10.93 Aa8.12 A
2017Early3.54 Cd5.71 BCc7.98 BCb5.25 ABc10.29 Ba9.95 ABa7.12 B
Late5.42 Ac4.46 DEc7.52 BCDb5.27 ABc8.84 Ca7.62 Cb6.52 C
Mean3.62 f4.93 d7.18 c4.05 e7.90 a7.57 b
FactorFp
Season (S)246.64<0.001
Treatment (T)567.04<0.001
S × T14.03<0.001
The same lowercase letter after data within a row indicates no significant difference among the fertilization treatments and the same uppercase letter after data within a column indicates no significant difference among the crop seasons (Tukey’s test, p > 0.05).
Table A3. Two-way ANOVA testing for the effects of season, treatment, and their interactions on total P uptake, P surplus, and APR.
ItemSeasonCKNKNPKM(20% P)CM(P)CM(-P)Mean
Total P
uptake
(kg ha−1)
2013Early14.98 ABd25.79 ABb30.38 BCa18.03 ABc31.10 Ca30.17 CDa25.08 C
Late17.07 Ac25.33 Bb31.74 Ba18.35 ABc32.61 BCa32.47 ABCa26.26 B
2014Early9.88 Dd17.51 Db20.94 Ga13.06 Dc22.13 Ea21.69 Ga17.53 F
Late15.21 ABd28.02 Ab34.21 Aa19.85 Ac35.22 Aa33.89 Aa27.73 A
2015Early10.38 CDd17.73 Db25.01 EFa14.18 CDc27.51 Da27.47 Ea20.38 E
Late10.53 CDd20.60 Cb28.53 CDa17.45 ABCc28.36 Da28.40 DEa22.31 D
2016Early9.22 Dc14.79 Eb24.99 EFa8.21 Ec24.24 Ea24.62 Fa17.68 F
Late17.75 Ad24.12 Bc27.03 DEb19.49 Ad31.93 Ca30.67 BCDa25.17 C
2017Early10.17 De17.93 Dc24.37 Fb12.68 Dd28.29 Da27.39 Ea20.14 E
Late13.55 BCd24.72 Bc31.83 Bb14.94 BCDd35.03 ABa32.70 ABab25.46 BC
Mean12.87 e21.66 c27.90 b15.63 d29.64 a28.95 a
FactorFp
Season (S)249.42<0.001
Treatment (T)1616.07<0.001
S × T8.59<0.001
P surplus
(kg ha−1 s−1)
2013Early−14.98 CDd−25.79 DEe8.89 EFa−10.17 DEc8.17 Ca2.82 DEb−5.18 D
Late−17.07 Dd−25.33 De7.54 Fa−10.49 DEc6.66 CDa0.52 EFGb−6.36 E
2014Early−9.88 Ad−17.51 Be18.33 Aa−5.20 Bc17.14 Aa11.3 Ab2.37 A
Late−15.21 CDc−28.02 Ed5.06 Ga−11.99 Ec4.05 Ea−0.90 Gb−7.83 F
2015Early−10.38 ABd−17.73 Be14.26 BCa−6.32 BCc11.76 Ba5.52 Cb−0.48 B
Late−10.53 ABc−20.60 Cd10.74 DEa−9.59 CDEc10.91 Ba4.59 CDb−2.41 C
2016Early−9.22 Ad−14.79 Ae14.28 BCa−0.35 Ac15.03 Aa8.37 Bb2.22 A
Late−17.75 De−24.12 Df12.24 CDa−11.63 Ed7.34 Cb2.32 DEFc−5.27 D
2017Early−10.17 Ae−17.93 Bf14.9 Ba−4.82 Bd10.98 Bb5.60 Cc−0.24 B
Late−13.55 BCe−24.72 Df7.44 Fa−7.08 BCDd4.24 DEb0.29 FGc−5.56 DE
Mean−12.87 e−21.66 f11.37 a−7.77 d9.63 b4.04 c
FactorFp
Season (S)249.42<0.001
Treatment (T)5449.75<0.001
S × T8.59<0.001
APR
(%)
2013Early 11.66 CDb 16.89 CDa17.40 Da15.31 EF
Late 16.29 BCb 23.15 BCDa28.37 BCa22.6 CD
2014Early 8.72 Db 14.68 Dab16.62 Da13.34 F
Late 15.74 BCb 22.88 BCDa23.33 CDa20.65 D
2015Early 18.50 Bc 31.11 ABb38.71 Aa29.44 AB
Late 20.17 Bb 24.68 ABCab30.99 ABCa25.28 BC
2016Early 25.95 Ab 30.06 ABb39.12 Aa31.71 A
Late 7.42 Db 24.87 ABCa26.07 CDa19.45 DE
2017Early 16.40 BCb 32.97 Aa37.63 ABa29.00 AB
Late 18.09 Bb 32.79 Aa31.74 ABCa27.54 AB
Mean 15.89 c 25.41 b29.00 a
FactorFp
Season (S)38.93<0.001
Treatment (T)153.90<0.001
S × T3.85<0.001
The same lowercase letter after data within a row indicates no significant difference among the fertilization treatments and the same uppercase letter after data within a column indicates no significant difference among the crop seasons (Tukey’s test, p > 0.05). APR: apparent P recovery efficiency.
Table A4. Two-way ANOVA testing for the effects of season, treatment, and their interactions on Olsen-P and water-soluble Pi.
ItemSeasonCKNKNPKM(20% P)CM(P)CM(-P)Mean
Olsen-P (mg kg−1)2013Early11.70 BCDc10.69 BCc15.00 Cb11.76 DEFc16.23 Da15.55 Cab13.49 F
Late13.58 ABCDb14.32 ABb17.74 BCa15.64 BCab17.74 Da17.77 Ca16.13 E
2014Early15.78 ABCc15.59 ABc19.93 Bb12.55 CDEc27.76 Ca24.78 Ba19.40 CD
Late16.84 Ab13.60 ABc25.29 Aa18.89 Ab26.99 Ca24.87 Ba21.08 AB
2015Early16.37 ABb16.81 Ab26.04 Aa18.51 ABb29.58 Ca26.64 ABa22.32 A
Late9.36 Dcd6.74 CDd24.72 Ab12.73 CDEc30.62 BCa26.13 ABb18.38 D
2016Early9.72 Dcd7.50 CDb25.08 Ab13.19 CDc34.06 ABa28.51 ABb19.68 BCD
Late11.92 BCDc6.45 CDd26.18 Ab8.75 Fcd34.69 ABa27.82 Ab19.30 CD
2017Early11.14 CDd7.59 CDd25.89 Ab15.51 BCc36.66 Aa26.01 ABb20.47 BC
Late9.15 Dc5.40 Dd26.40 Ab9.88 EFc37.15 Aa27.96 ABb19.32 CD
Mean12.56 e10.47 f23.23 c13.74 d29.15 a24.61 b
FactorFp
Season (S)55.02<0.001
Treatment (T)847.51<0.001
S × T25.85<0.001
Water-soluble Pi
(mg kg−1)
2013Early0.51 BCc0.48 BCDc1.04 ABa0.71 ABCb1.04 BCDa1.06 BCa0.81 CD
Late0.54 Bc0.54 ABCc0.84 BCab0.74 ABb0.88 DEa0.84 CDEab0.73 DE
2014Early0.84 Ab0.70 Ab1.20 Aa0.84 Ab1.40 Aa1.35 Aa1.05 A
Late0.42 BCDb0.48 BCb0.70 CDa0.44 DEb0.72 EFa0.71 EFa0.58 FG
2015Early0.60 Bc0.62 ABc1.20 Aa0.88 Ab1.22 ABa1.13 ABa0.94 B
Late0.31 CDb0.34 CDEb0.56 Da0.34 Eb0.54 Fa0.55 Fa0.44 H
2016Early0.50 BCc0.45 BCDc1.07 ABb0.63 BCDc1.33 Aa1.15 ABab0.85 BC
Late0.20 Dc0.27 DEFc0.64 CDb0.51 DEa0.98 CDa0.99 BCDa0.6 FG
2017Early0.21 Db0.16 EFb0.99 ABa0.35 Eb1.10 BCa1.09 ABCa0.65 EF
Late0.24 Dc0.08 Fc0.70 CDab0.53 CDEb0.84 DEa0.76 DEFa0.52 GH
Mean0.44 d0.41 d0.89 b0.60 c1.00 a0.96 ab
FactorFp
Season (S)102.42<0.001
Treatment (T)324.64<0.001
S × T6.90<0.001
The same lowercase letter after data within a row indicates no significant difference among the fertilization treatments and the same uppercase letter after data within a column indicates no significant difference among the crop seasons (Tukey’s test, p > 0.05).

References

  1. Guo, J.H.; Liu, X.J.; Zhang, Y.; Shen, J.L.; Han, W.X.; Zhang, W.F.; Christie, P.; Goulding, K.W.T.; Vitousek, P.M.; Zhang, F.S. Significant Acidification in Major Chinese Croplands. Science 2010, 327, 1008–1010. [Google Scholar] [CrossRef] [PubMed]
  2. Tilman, D.; Balzer, C.; Hill, J.; Befort, B.L. Global Food Demand and the Sustainable Intensification of Agriculture. Proc. Natl. Acad. Sci. USA 2011, 108, 20260–20264. [Google Scholar] [CrossRef]
  3. Lu, C.; Tian, H. Global Nitrogen and Phosphorus Fertilizer Use for Agriculture Production in the Past Half Century: Shifted Hot Spots and Nutrient Imbalance. Earth Syst. Sci. Data 2017, 9, 181–192. [Google Scholar] [CrossRef]
  4. Vance, C.P.; Uhde-Stone, C.; Allan, D.L. Phosphorus Acquisition and Use: Critical Adaptations by Plants for Securing a Nonrenewable Resource. New Phytol. 2003, 157, 423–447. [Google Scholar] [CrossRef] [PubMed]
  5. Zhu, J.; Li, M.; Whelan, M. Phosphorus Activators Contribute to Legacy Phosphorus Availability in Agricultural Soils: A Review. Sci. Total Environ. 2018, 612, 522–537. [Google Scholar] [CrossRef]
  6. Zou, L.; Liu, Y.; Wang, Y.; Hu, X. Assessment and Analysis of Agricultural Non-Point Source Pollution Loads in China: 1978–2017. J. Environ. Manage. 2020, 263, 110400. [Google Scholar] [CrossRef]
  7. Van Heyst, A.; Sinclair, A.; Jamieson, R. Application of Phosphorus Loading Models to Understand Drivers of Eutrophication in a Complex Rural Lake-Watershed System. J. Environ. Manage. 2022, 302, 114010. [Google Scholar] [CrossRef]
  8. Van Vuuren, D.P.; Bouwman, A.F.; Beusen, A.H.W. Phosphorus Demand for the 1970–2100 Period: A Scenario Analysis of Resource Depletion. Glob. Environ. Chang. 2010, 20, 428–439. [Google Scholar] [CrossRef]
  9. Jiang, S.; Hua, H.; Sheng, H.; Jarvie, H.P.; Liu, X.; Zhang, Y.; Yuan, Z.; Zhang, L.; Liu, X. Phosphorus Footprint in China over the 1961–2050 Period: Historical Perspective and Future Prospect. Sci. Total Environ. 2019, 650, 687–695. [Google Scholar] [CrossRef]
  10. MacDonald, G.K.; Bennett, E.M.; Potter, P.A.; Ramankutty, N. Agronomic Phosphorus Imbalances across the World’s Croplands. Proc. Natl. Acad. Sci. USA 2011, 108, 3086–3091. [Google Scholar] [CrossRef]
  11. George, T.S.; Hinsinger, P.; Turner, B.L. Phosphorus in Soils and Plants—Facing Phosphorus Scarcity. Plant Soil 2016, 401, 1–6. [Google Scholar] [CrossRef]
  12. Jia, W.; Qin, W.; Zhang, Q.; Wang, X.; Ma, Y.; Chen, Q. Evaluation of Crop Residues and Manure Production and Their Geographical Distribution in China. J. Clean. Prod. 2018, 188, 954–965. [Google Scholar] [CrossRef]
  13. Chen, X.; Jiang, N.; Chen, Z.; Tian, J.; Sun, N.; Xu, M.; Chen, L. Response of Soil phoD Phosphatase Gene to Long-Term Combined Applications of Chemical Fertilizers and Organic Materials. Appl. Soil Ecol. 2017, 119, 197–204. [Google Scholar] [CrossRef]
  14. Andriamananjara, A.; Rakotoson, T.; Razafimbelo, T.; Rabeharisoa, L.; Razafimanantsoa, M.-P.; Masse, D. Farmyard Manure Improves Phosphorus Use Efficiency in Weathered P Deficient Soil. Nutr. Cycl. Agroecosyst. 2019, 115, 407–425. [Google Scholar] [CrossRef]
  15. Celestina, C.; Hunt, J.R.; Sale, P.W.G.; Franks, A.E. Attribution of Crop Yield Responses to Application of Organic Amendments: A Critical Review. Soil Tillage Res. 2019, 186, 135–145. [Google Scholar] [CrossRef]
  16. Han, X.; Hu, C.; Chen, Y.; Qiao, Y.; Liu, D.; Fan, J.; Li, S.; Zhang, Z. Crop Yield Stability and Sustainability in a Rice-Wheat Cropping System Based on 34-Year Field Experiment. Eur. J. Agron. 2020, 113, 125965. [Google Scholar] [CrossRef]
  17. Li, K.; Bi, Q.; Liu, X.; Wang, H.; Sun, C.; Zhu, Y.; Lin, X. Unveiling the Role of Dissolved Organic Matter on Phosphorus Sorption and Availability in a 5-Year Manure Amended Paddy Soil. Sci. Total Environ. 2022, 838, 155892. [Google Scholar] [CrossRef]
  18. Pan, M.; Chu, L.M. Transfer of Antibiotics from Wastewater or Animal Manure to Soil and Edible Crops. Environ. Pollut. 2017, 231, 829–836. [Google Scholar] [CrossRef]
  19. Liu, X.-P.; Bi, Q.-F.; Qiu, L.-L.; Li, K.-J.; Yang, X.-R.; Lin, X.-Y. Increased Risk of Phosphorus and Metal Leaching from Paddy Soils after Excessive Manure Application: Insights from a Mesocosm Study. Sci. Total Environ. 2019, 666, 778–785. [Google Scholar] [CrossRef]
  20. Muhammad, J.; Khan, S.; Su, J.Q.; Hesham, A.E.-L.; Ditta, A.; Nawab, J.; Ali, A. Antibiotics in Poultry Manure and Their Associated Health Issues: A Systematic Review. J. Soils Sediments 2020, 20, 486–497. [Google Scholar] [CrossRef]
  21. Lu, Y.; Gao, Y.; Nie, J.; Liao, Y.; Zhu, Q. Substituting Chemical P Fertilizer with Organic Manure: Effects on Double-Rice Yield, Phosphorus Use Efficiency and Balance in Subtropical China. Sci. Rep. 2021, 11, 8629. [Google Scholar] [CrossRef] [PubMed]
  22. Weihrauch, C.; Opp, C. Ecologically Relevant Phosphorus Pools in Soils and Their Dynamics: The Story so Far. Geoderma 2018, 325, 183–194. [Google Scholar] [CrossRef]
  23. Cai, A.; Xu, M.; Wang, B.; Zhang, W.; Liang, G.; Hou, E.; Luo, Y. Manure Acts as a Better Fertilizer for Increasing Crop Yields than Synthetic Fertilizer Does by Improving Soil Fertility. Soil Tillage Res. 2019, 189, 168–175. [Google Scholar] [CrossRef]
  24. Schröder, J. Revisiting the Agronomic Benefits of Manure: A Correct Assessment and Exploitation of Its Fertilizer Value Spares the Environment. Bioresour. Technol. 2005, 96, 253–261. [Google Scholar] [CrossRef]
  25. Xin, X.; Qin, S.; Zhang, J.; Zhu, A.; Yang, W.; Zhang, X. Yield, Phosphorus Use Efficiency and Balance Response to Substituting Long-Term Chemical Fertilizer Use with Organic Manure in a Wheat-Maize System. Field Crops Res. 2017, 208, 27–33. [Google Scholar] [CrossRef]
  26. Hua, K.; Zhang, W.; Guo, Z.; Wang, D.; Oenema, O. Evaluating Crop Response and Environmental Impact of the Accumulation of Phosphorus Due to Long-Term Manuring of Vertisol Soil in Northern China. Agric. Ecosyst. Environ. 2016, 219, 101–110. [Google Scholar] [CrossRef]
  27. Chen, D.; Hu, M.; Guo, Y.; Dahlgren, R.A. Influence of legacy phosphorus, land use, and climate change on anthropogenic phosphorus inputs and riverine export dynamics. Biogeochemistry 2015, 123, 99–116. [Google Scholar] [CrossRef]
  28. Chen, D.; Hu, M.; Guo, Y.; Wang, J.; Huang, H.; Dahlgren, R.A. Long-Term (1980–2010) Changes in Cropland Phosphorus Budgets, Use Efficiency and Legacy Pools across Townships in the Yongan Watershed, Eastern China. Agric. Ecosyst. Environ. 2017, 236, 166–176. [Google Scholar] [CrossRef]
  29. Olsen, S.R. (Ed.) Estimation of Available Phosphorus in Soils by Extraction with Sodium Bicarbonate; Circular/United States Department of Agriculture: Washington, DC, USA, 1954. [Google Scholar]
  30. Murphy, J.; Riley, J.P. A Modified Single Solution Method for the Determination of Phosphate in Natural Waters. Anal. Chim. Acta 1962, 27, 31–36. [Google Scholar] [CrossRef]
  31. Nelson, D.W.; Sommers, L.E. Total Carbon, Organic Carbon, and Organic Matter. In Methods of Soil Analysis; John Wiley & Sons, Ltd.: Hoboken, NJ, USA, 1996; pp. 961–1010. ISBN 978-0-89118-866-7. [Google Scholar]
  32. Tabatabai, M.A. Soil Enzymes. In Methods of Soil Analysis; John Wiley & Sons, Ltd.: Hoboken, NJ, USA, 1994; pp. 775–833. ISBN 978-0-89118-865-0. [Google Scholar]
  33. Zhu, J.; Wang, Q.; He, N.; Smith, M.D.; Elser, J.J.; Du, J.; Yuan, G.; Yu, G.; Yu, Q. Imbalanced Atmospheric Nitrogen and Phosphorus Depositions in China: Implications for Nutrient Limitation. J. Geophys. Res. Biogeosci. 2016, 121, 1605–1616. [Google Scholar] [CrossRef]
  34. Fang, H.; Liu, K.; Li, D.; Peng, X.; Zhang, W.; Zhou, H. Long-Term Effects of Inorganic Fertilizers and Organic Manures on the Structure of a Paddy Soil. Soil Tillage Res. 2021, 213, 105137. [Google Scholar] [CrossRef]
  35. Gao, P.; Zhang, T.; Lei, X.; Cui, X.; Lu, Y.; Fan, P.; Long, S.; Huang, J.; Gao, J.; Zhang, Z.; et al. Improvement of Soil Fertility and Rice Yield after Long-Term Application of Cow Manure Combined with Inorganic Fertilizers. J. Integr. Agric. 2023, 22, 2221–2232. [Google Scholar] [CrossRef]
  36. Hu, W.; Zhang, Y.; Xiangmin, R.; Fei, J.; Peng, J.; Luo, G. Coupling Amendment of Biochar and Organic Fertilizers Increases Maize Yield and Phosphorus Uptake by Regulating Soil Phosphatase Activity and Phosphorus-Acquiring Microbiota. Agric. Ecosyst. Environ. 2023, 355, 108582. [Google Scholar] [CrossRef]
  37. Ma, Q.; Wen, Y.; Ma, J.; Macdonald, A.; Hill, P.W.; Chadwick, D.R.; Wu, L.; Jones, D.L. Long-Term Farmyard Manure Application Affects Soil Organic Phosphorus Cycling: A Combined Metagenomic and 33P/14C Labelling Study. Soil Biol. Biochem. 2020, 149, 107959. [Google Scholar] [CrossRef]
  38. Cui, N.; Cai, M.; Zhang, X.; Abdelhafez, A.A.; Zhou, L.; Sun, H.; Chen, G.; Zou, G.; Zhou, S. Runoff Loss of Nitrogen and Phosphorus from a Rice Paddy Field in the East of China: Effects of Long-Term Chemical N Fertilizer and Organic Manure Applications. Glob. Ecol. Conserv. 2020, 22, e01011. [Google Scholar] [CrossRef]
  39. Khan, A.; Lu, G.; Ayaz, M.; Zhang, H.; Wang, R.; Lv, F.; Yang, X.; Sun, B.; Zhang, S. Phosphorus Efficiency, Soil Phosphorus Dynamics and Critical Phosphorus Level under Long-Term Fertilization for Single and Double Cropping Systems. Agric. Ecosyst. Environ. 2018, 256, 1–11. [Google Scholar] [CrossRef]
  40. Gai, X.; Liu, H.; Liu, J.; Zhai, L.; Yang, B.; Wu, S.; Ren, T.; Lei, Q.; Wang, H. Long-Term Benefits of Combining Chemical Fertilizer and Manure Applications on Crop Yields and Soil Carbon and Nitrogen Stocks in North China Plain. Agric. Water Manag. 2018, 208, 384–392. [Google Scholar] [CrossRef]
  41. Bindraban, P.S.; Dimkpa, C.O.; Pandey, R. Exploring Phosphorus Fertilizers and Fertilization Strategies for Improved Human and Environmental Health. Biol. Fertil. Soils 2020, 56, 299–317. [Google Scholar] [CrossRef]
  42. Wang, Y.; Chen, Y.-F.; Wu, W.-H. Potassium and Phosphorus Transport and Signaling in Plants. J. Integr. Plant Biol. 2021, 63, 34–52. [Google Scholar] [CrossRef]
  43. Li, G.; van Ittersum, M.K.; Leffelaar, P.A.; Sattari, S.Z.; Li, H.; Huang, G.; Zhang, F. A Multi-Level Analysis of China’s Phosphorus Flows to Identify Options for Improved Management in Agriculture. Agric. Syst. 2016, 144, 87–100. [Google Scholar] [CrossRef]
  44. Xu, X.; He, P.; Zhao, S.; Qiu, S.; Johnston, A.M.; Zhou, W. Quantification of Yield Gap and Nutrient Use Efficiency of Irrigated Rice in China. Field Crops Res. 2016, 186, 58–65. [Google Scholar] [CrossRef]
  45. Nayak, D.R.; Babu, Y.J.; Adhya, T.K. Long-Term Application of Compost Influences Microbial Biomass and Enzyme Activities in a Tropical Aeric Endoaquept Planted to Rice under Flooded Condition. Soil Biol. Biochem. 2007, 39, 1897–1906. [Google Scholar] [CrossRef]
  46. Bi, Q.-F.; Li, K.-J.; Zheng, B.-X.; Liu, X.-P.; Li, H.-Z.; Jin, B.-J.; Ding, K.; Yang, X.-R.; Lin, X.-Y.; Zhu, Y.-G. Partial Replacement of Inorganic Phosphorus (P) by Organic Manure Reshapes Phosphate Mobilizing Bacterial Community and Promotes P Bioavailability in a Paddy Soil. Sci. Total Environ. 2020, 703, 134977. [Google Scholar] [CrossRef]
  47. Qaswar, M.; Chai, R.; Ahmed, W.; Jing, H.; Han, T.; Liu, K.; Ye, X.; Xu, Y.; Anthonio, C.K.; Zhang, H. Partial Substitution of Chemical Fertilizers with Organic Amendments Increased Rice Yield by Changing Phosphorus Fractions and Improving Phosphatase Activities in Fluvo-Aquic Soil. J. Soils Sediments 2020, 20, 1285–1296. [Google Scholar] [CrossRef]
  48. Han, Y.; Lv, F.; Lin, X.; Zhang, C.; Sun, B.; Yang, X.; Zhang, S. Crop yield and nutrient efficiency under organic manure substitution fertilizer in a double cropping system: A 6-year field experiment on an anthrosol. Agronomy 2022, 12, 2047. [Google Scholar] [CrossRef]
  49. Chen, G.; Xiao, L.; Yue, K.; Wang, Y.; Wang, S.; Zhu, Y.; Kai, L. Optimizing phosphate application to improve soil quality and reduce phosphorus loss in rice-wheat rotation. Agric. Ecosyst. Environ. 2025, 378, 109310. [Google Scholar] [CrossRef]
Figure 1. Dynamics of (a) grain yield, (b) grain P uptake, (c) straw yield, and (d) straw P uptake for all treatments across 5 years.
Sustainability 17 03878 g001
Figure 2. Dynamics of (a) aboveground P uptake, (b) APR, and (c) soil P surplus for all treatments across 5 years. APR: apparent P recovery efficiency.
Sustainability 17 03878 g002
Figure 3. Dynamics of (a) soil Olsen-P and (b) water-soluble Pi for all treatments across 5 years.
Sustainability 17 03878 g003
Figure 4. Relationship between soil labile P (Olsen-P and water-soluble Pi) and soil P budget in 6 fertilization treatments: (a) CK; (b) NK; (c) NPK; (d) M(20%P); (e) CM(P); (f) CM(-P). *, **, and *** indicate significance at p < 0.05, 0.01, and 0.001, respectively.
Sustainability 17 03878 g004
Figure 5. Relationships between the grain yield, grain P uptake, straw yield, straw P uptake, aboveground P uptake, APR, and soil Olsen-P (af), soil water-soluble Pi (gl). APR: apparent P recovery efficiency.
Sustainability 17 03878 g005
Table 1. Application rates of N, P, and K for early and late rice under different fertilization treatments.
SeasonTreatmentChemical Fertilizer (kg ha−1)Organic Fertilizer (kg ha−1)
NP2O5K2ONP2O5K2O
EarlyCK000000
NK1650150000
NPK16590150000
M(20%P)00011185
CM(P)1547214511185
CM(-P)1545814511185
LateCK000000
NK1950150000
NPK19590150000
M(20%P)00011185
CM(P)1847214511185
CM(-P)1845814511185
Table 2. Soil properties under different fertilization treatments after 5 years.
TreatmentCKNKNPKM(20%P)CM(P)CM(-P)
pH5.30 b5.17 c5.18 c5.28 b5.49 a5.44 a
NH4+-N (mg kg−1)66.80 b102.81 a101.78 a73.47 b104.15 a97.48 a
NO3--N (mg kg−1)67.64 b117.74 a120.84 a61.33 b107.92 a111.32 a
Olsen-P (mg kg−1)9.15 c5.40 d26.40 b9.88 c33.15 a27.96 b
TP (mg kg−1)436.41 cd401.07 d582.12 a446.14 c533.18 b535.47 b
SOC (g kg−1)16.36 b16.21 b16.81 b15.98 b18.35 a17.96 a
ACP activity (mg kg−1 h−1)376.98 d402.09 c467.55 b414.74 c495.95 a498.16 a
ALP activity (mg kg−1 h−1)60.66 c61.85 c86.72 b65.65 c96.66 a94.58 a
PDE activity (mg kg−1 h−1)85.49 d90.61 d116.28 b100.30 c129.36 a125.49 a
The same lowercase letter after data within a row indicates no significant difference (Tukey’s test, p > 0.05). NH4+-N: ammonium nitrogen; NO3-N: nitrate nitrogen; TP: total phosphorus; SOC: soil organic carbon; ACP: acid phosphomonoesterase; ALP: alkaline phosphomonoesterase; PDE: phosphodiesterase.
Table 3. Seasonal average grain yield, grain P uptake, straw yield, straw P uptake, aboveground P uptake, APR, soil P surplus, soil Olsen-P, and soil water-soluble Pi in different fertilization regimes.
ItemCKNKNPKM(20%P)CM(P)CM(-P)
Grain yield (Mg ha−1)3.88 d5.82 c6.76 b3.97 d7.10 a6.88 b
Grain P uptake (kg ha−1)9.25 e16.73 c20.72 b11.57 d21.74 a21.38 ab
Straw yield (Mg ha−1)2.44 d3.87 c4.23 b2.48 d4.44 a4.44 a
Straw P uptake (kg ha−1)3.62 f4.93 d7.18 c4.05 e7.90 a7.57 b
Aboveground P uptake (kg ha−1)12.87 e21.66 c27.90 b15.63 d29.64 a28.95 a
APR (%) 15.89 c 25.41 b29.00 a
Soil P surplus (kg ha−1 season−1)−12.87 e−21.66 f11.37 a−7.77 d9.63 b4.04 c
Soil Olsen-P (mg kg−1)12.56 e10.47 f23.23 c13.74 d29.15 a24.61 b
Soil water-soluble Pi (mg kg−1)0.44 d0.41 d0.89 b0.60 c1.00 a0.96 ab
The same lowercase letter after data within a row indicates no significant difference (Tukey’s test, p > 0.05).
Disclaimer/Publisher’s Note: The statements, opinions and data contained in all publications are solely those of the individual author(s) and contributor(s) and not of MDPI and/or the editor(s). MDPI and/or the editor(s) disclaim responsibility for any injury to people or property resulting from any ideas, methods, instructions or products referred to in the content.

