Article

Analysis of Soil Nutrient Content and Carbon Pool Dynamics Under Different Cropping Systems

Institute of Agricultural Resources and Environment, Xinjiang Academy of Agricultural Sciences, Urumqi 830091, China
*
Author to whom correspondence should be addressed.
Sustainability 2025, 17(9), 3881; https://doi.org/10.3390/su17093881
Submission received: 24 March 2025 / Revised: 22 April 2025 / Accepted: 22 April 2025 / Published: 25 April 2025

Abstract

:
Understanding the effects of agricultural practices on soil nutrient dynamics is critical for optimizing land management in arid regions. This study analyzed spatial patterns, driving factors, and surface stocks (0–20 cm) of soil organic carbon (SOC), total nitrogen (TN), total phosphorus (TP), and their stoichiometric ratios (C:N, C:P, and N:P) across six cropping systems (paddy fields, cotton fields, wheat–maize, orchards, wasteland, and others) in the Aksu region, Northwest China, using 1131 soil samples combined with geostatistical and field survey approaches. Results revealed moderate to low levels of SOC, TN, and TP, and stoichiometric ratios, with moderate spatial autocorrelation for SOC, TN, TP, and C:N but weak dependence for C:P and N:P. Cropping systems significantly influenced soil nutrient distribution: intensive systems (paddy fields and orchards) exhibited the highest SOC (22.31 ± 10.37 t hm−2), TN (2.20 ± 1.07 t hm−2), and TP stocks (peaking at 2.58 t hm−2 in orchards), whereas extensive systems (cotton fields and wasteland) showed severe nutrient depletion. Soil pH and elevation were key drivers of SOC and TN variability across all systems. The C:N ratio ranked highest in “other systems” (e.g., diversified rotations), while wheat–maize fields displayed elevated C:P and N:P ratios, likely linked to imbalanced fertilization. These findings highlight that sustainable intensification (e.g., paddy and orchard management) enhances soil carbon and nutrient retention, whereas low-input practices exacerbate degradation in arid landscapes. The study provides actionable insights for tailoring land-use strategies to improve soil health and support ecosystem resilience in water-limited agroecosystems.

1. Introduction

Soil, a core component of terrestrial ecosystems, significantly impacts agricultural sustainability and the global carbon cycle through its nutrient cycling and carbon pool dynamics [1]. Amid intensifying climate change and population pressure, exploring how different cropping systems affect soil nutrient levels and carbon pool evolution has become a key focus in modern soil science and agricultural ecology [2]. Soil nutrient composition, a central indicator of ecosystem material cycling, greatly influences farm productivity, ecological stability, and agricultural management effectiveness [3]. From an eco—stoichiometric perspective, soil element contents (C, N, and P) and their ratios (C:N, C:P, and N:P) are crucial for assessing soil fertility, understanding energy distribution in soil-plant systems, and microbial activity [4]. For instance, a high C:N ratio may indicate nitrogen limitation for crops [5], while a low N:P ratio suggests phosphorus limitation. These ratios affect organic matter decomposition, nutrient mineralization, and root absorption, directly impacting crop yield and quality.
In agriculture, the spatial and temporal heterogeneity of soil nutrients guides precision fertilization [6]. Studies show that optimizing nitrogen and phosphorus fertilizer ratios based on regional soil C:N:P characteristics can reduce nutrient loss by over 20% and improve fertilizer efficiency [7]. Soil nutrient stoichiometric balance also affects soil health. An optimal C:N ratio (10:1–12:1) promotes organic matter accumulation and microbial succession, while a low C:P ratio (<50:1) may increase phosphorus fixation and soil acidification or heavy metal activation risks [8]. Under climate change, soil nutrient stoichiometric features serve as environmental indicators [9]. Long-term nitrogen deposition lowers the soil C:N ratio, while drought stress may raise the C:P ratio by inhibiting decomposition [10,11], providing data for predicting carbon sequestration potential and formulating management strategies. Thus, understanding soil nutrient composition and its regulation is essential for efficient agricultural resource use and addressing food and ecological security challenges.
Analyzing the balance and coupling mechanisms of key elements (C, N, P) in ecosystems is vital for understanding material cycling and energy flow regulation [12,13]. In cropland ecosystems, soil C, N, and P stoichiometric characteristics reflect nutrient supply capacity and limiting factors influenced by both natural factors and human-driven land management [14]. Changes in cropland use, such as altering crop rotation [15], optimizing crop structure, or implementing organic substitution [16], affect external nutrient inputs, crop residue return, and microbial metabolism, reshaping the C:N:P ecological stoichiometric network through soil–plant–microbe interactions [17]. For example, continuous monocropping can imbalance the soil C:N ratio and increase phosphorus fixation, while balanced organic–inorganic fertilization can enhance nutrient use efficiency by adjusting element coupling [18].
Agricultural ecosystems are highly dynamic, multifactorial networks where nutrient cycling (e.g., carbon, nitrogen, and phosphorus), microbial activity, and crop responses are directly governed by tillage practices. For example, no-till farming preserves soil organic carbon by minimizing soil disturbance, while intercropping enhances nutrient use efficiency through root complementarity [19]. Monoculture systems reduce soil microbial diversity by 15–30%, whereas diversified practices (e.g., crop rotation combined with cover crops) restore the abundance of functional microbial communities [20]. Using an extended Lotka–Volterra modeling framework, different tillage systems modulate competitive interactions among crops, weeds, insects, and microbes, thereby influencing nutrient use efficiency. For instance, intercropping systems improve nitrogen availability via root exudates (e.g., nitrogen fixation by legumes), whereas continuous monoculture exacerbates nutrient depletion [21]. A 2024 Nature study revealed that 51–60% of global anthropogenic ammonia emissions originate from rice, wheat, and maize cultivation, and optimized fertilizer management (e.g., deep placement of enhanced-efficiency fertilizers) could reduce ammonia emissions by 38% [22]. Excessive nitrogen fertilization further induces nitrate leaching and eutrophication, posing ecological risks. In this study, we quantify the long-term stability of nutrient cycling under various tillage systems using semi-variogram equations and soil C-N-P stock estimation models. Currently, there is a lack of systematic analysis on soil C, N, and P stoichiometric responses and driving mechanisms under different cropping systems, especially regarding regional—scale management measures to coordinate element balance for soil health and sustainable agriculture. Clarifying the response mechanisms of soil ecological stoichiometric characteristics to land management practices under various cropping systems is crucial for precision fertilization, soil fertility management, and agricultural low-carbon transition.

2. Materials and Methods

2.1. Overview of the Study Area

The Aksu region is located between 78°03′ and 84°07′ east longitude and 39°30′ and 42°41′ north latitude, on the southern slope of the Tianshan Mountains in the Xinjiang Uygur Autonomous Region and the northern edge of the Tarim Basin (Figure 1), in the alluvial plain area of the Aksu River. The terrain of the region is higher in the north and lower in the south, with numerous peaks in the north, the boundless Taklamakan Desert in the south, and the middle part is a mixture of the mountain foot, gravelly fan-shaped land, alluvial plain areas, Gobi, and oases. The region administers 7 counties, 2 cities, 84 townships, and 56 agricultural and forestry farms. Aksu has a warm temperate, arid climate, located on the northern edge of the Tarim Basin, with little precipitation, high evaporation, a dry climate, and abundant light and heat resources. The farmland cropping system can be divided into six types: paddy field, wheat–corn rotation, cotton field, orchard, others (mainly vegetables and some cash crops), and wasteland (Table 1). The main food crops are wheat and corn, with paddy fields in some areas.

2.2. Study Methods

2.2.1. Sample Collection

The data comes from the Aksu region’s arable land quality evaluation database. Soil samples are mainly from farmland areas in various counties and districts of the Aksu region. Sampling follows the Technical Regulations for Arable Land Productivity Survey and Quality Evaluation (NY/T 1634-2008). Samples were collected from October to November 2020. In the lab, multiple soil nutrient indicators were measured, including soil organic carbon (SOC), total nitrogen (TN), and total phosphorus (TP). Soil C:N:P content was determined using the dry burning method, Kjeldahl method, and molybdenum-antimony colorimetric method, respectively; Soil bulk weight (ring knife method); Gravel content (sieve method). Considering both natural and human-related conditions of the region’s arable land, we randomly set 1131 sampling points. At each point, the mixed sampling method was used to collect soil samples from 0–20 cm depth. We also gathered information on cropping conditions and the latitude and longitude of each point, converting sample point data into vector data with spatial coordinates.

2.2.2. Semi-Variable Function Models

Spatial variability of soil C, N, and P was quantified using semi-variogram modeling. The experimental semi-variogram was calculated as:
γ ( h ) = 1 2 N h i = 1 N h   [ z x i z x i + h ] 2
where γ(h) is the semi-variance at lag distance h, N(h) is the number of data pairs separated by h, and z(xi) represents the measured value (C, N, or P) at location xi.
Three theoretical models (spherical, exponential, and Gaussian) were fitted to the experimental semi-variograms to evaluate spatial dependence [23]. Model parameters, including nugget (C0), sill (C0 + C), and range (A0), were optimized by minimizing the residual sum of squares (RSS). The spatial dependence index (SDI) was calculated as C0/(C0 + C) × 100%, with SDI ≤ 25% indicating strong spatial dependence, 25–75% moderate, and ≥75% weak.

2.2.3. Model for Estimating Soil C, N and P Stocks

Based on previous studies, the following equations were used to determine C, N, and P stocks in the soil horizons of different land use types [24].
S = i = 1 n c i × p i × H i × 1 δ i 10
In the formula, c represents the carbon, nitrogen, and phosphorus content in the soil surface (g·kg−1), p represents the soil surface bulk density (g·cm−3), H represents the soil layer depth (cm), and δi represents the volume percentage of gravel larger than 2 mm in the soil (%).

2.2.4. Data Processing

WPS Office 2021 and SPSS 22.0 software were used for data processing and statistical analysis. The K-S test in SPSS 22.0 checked if soil nutrient data followed a normal distribution. Non-normal data were transformed to meet normality. The LSD method tested differences in soil nutrient content and C:N:P ratios across farmland uses. If data had unequal variances, multiple comparisons were done before correlating soil nutrients and C:N:P ratios with their influencing factors.

3. Results

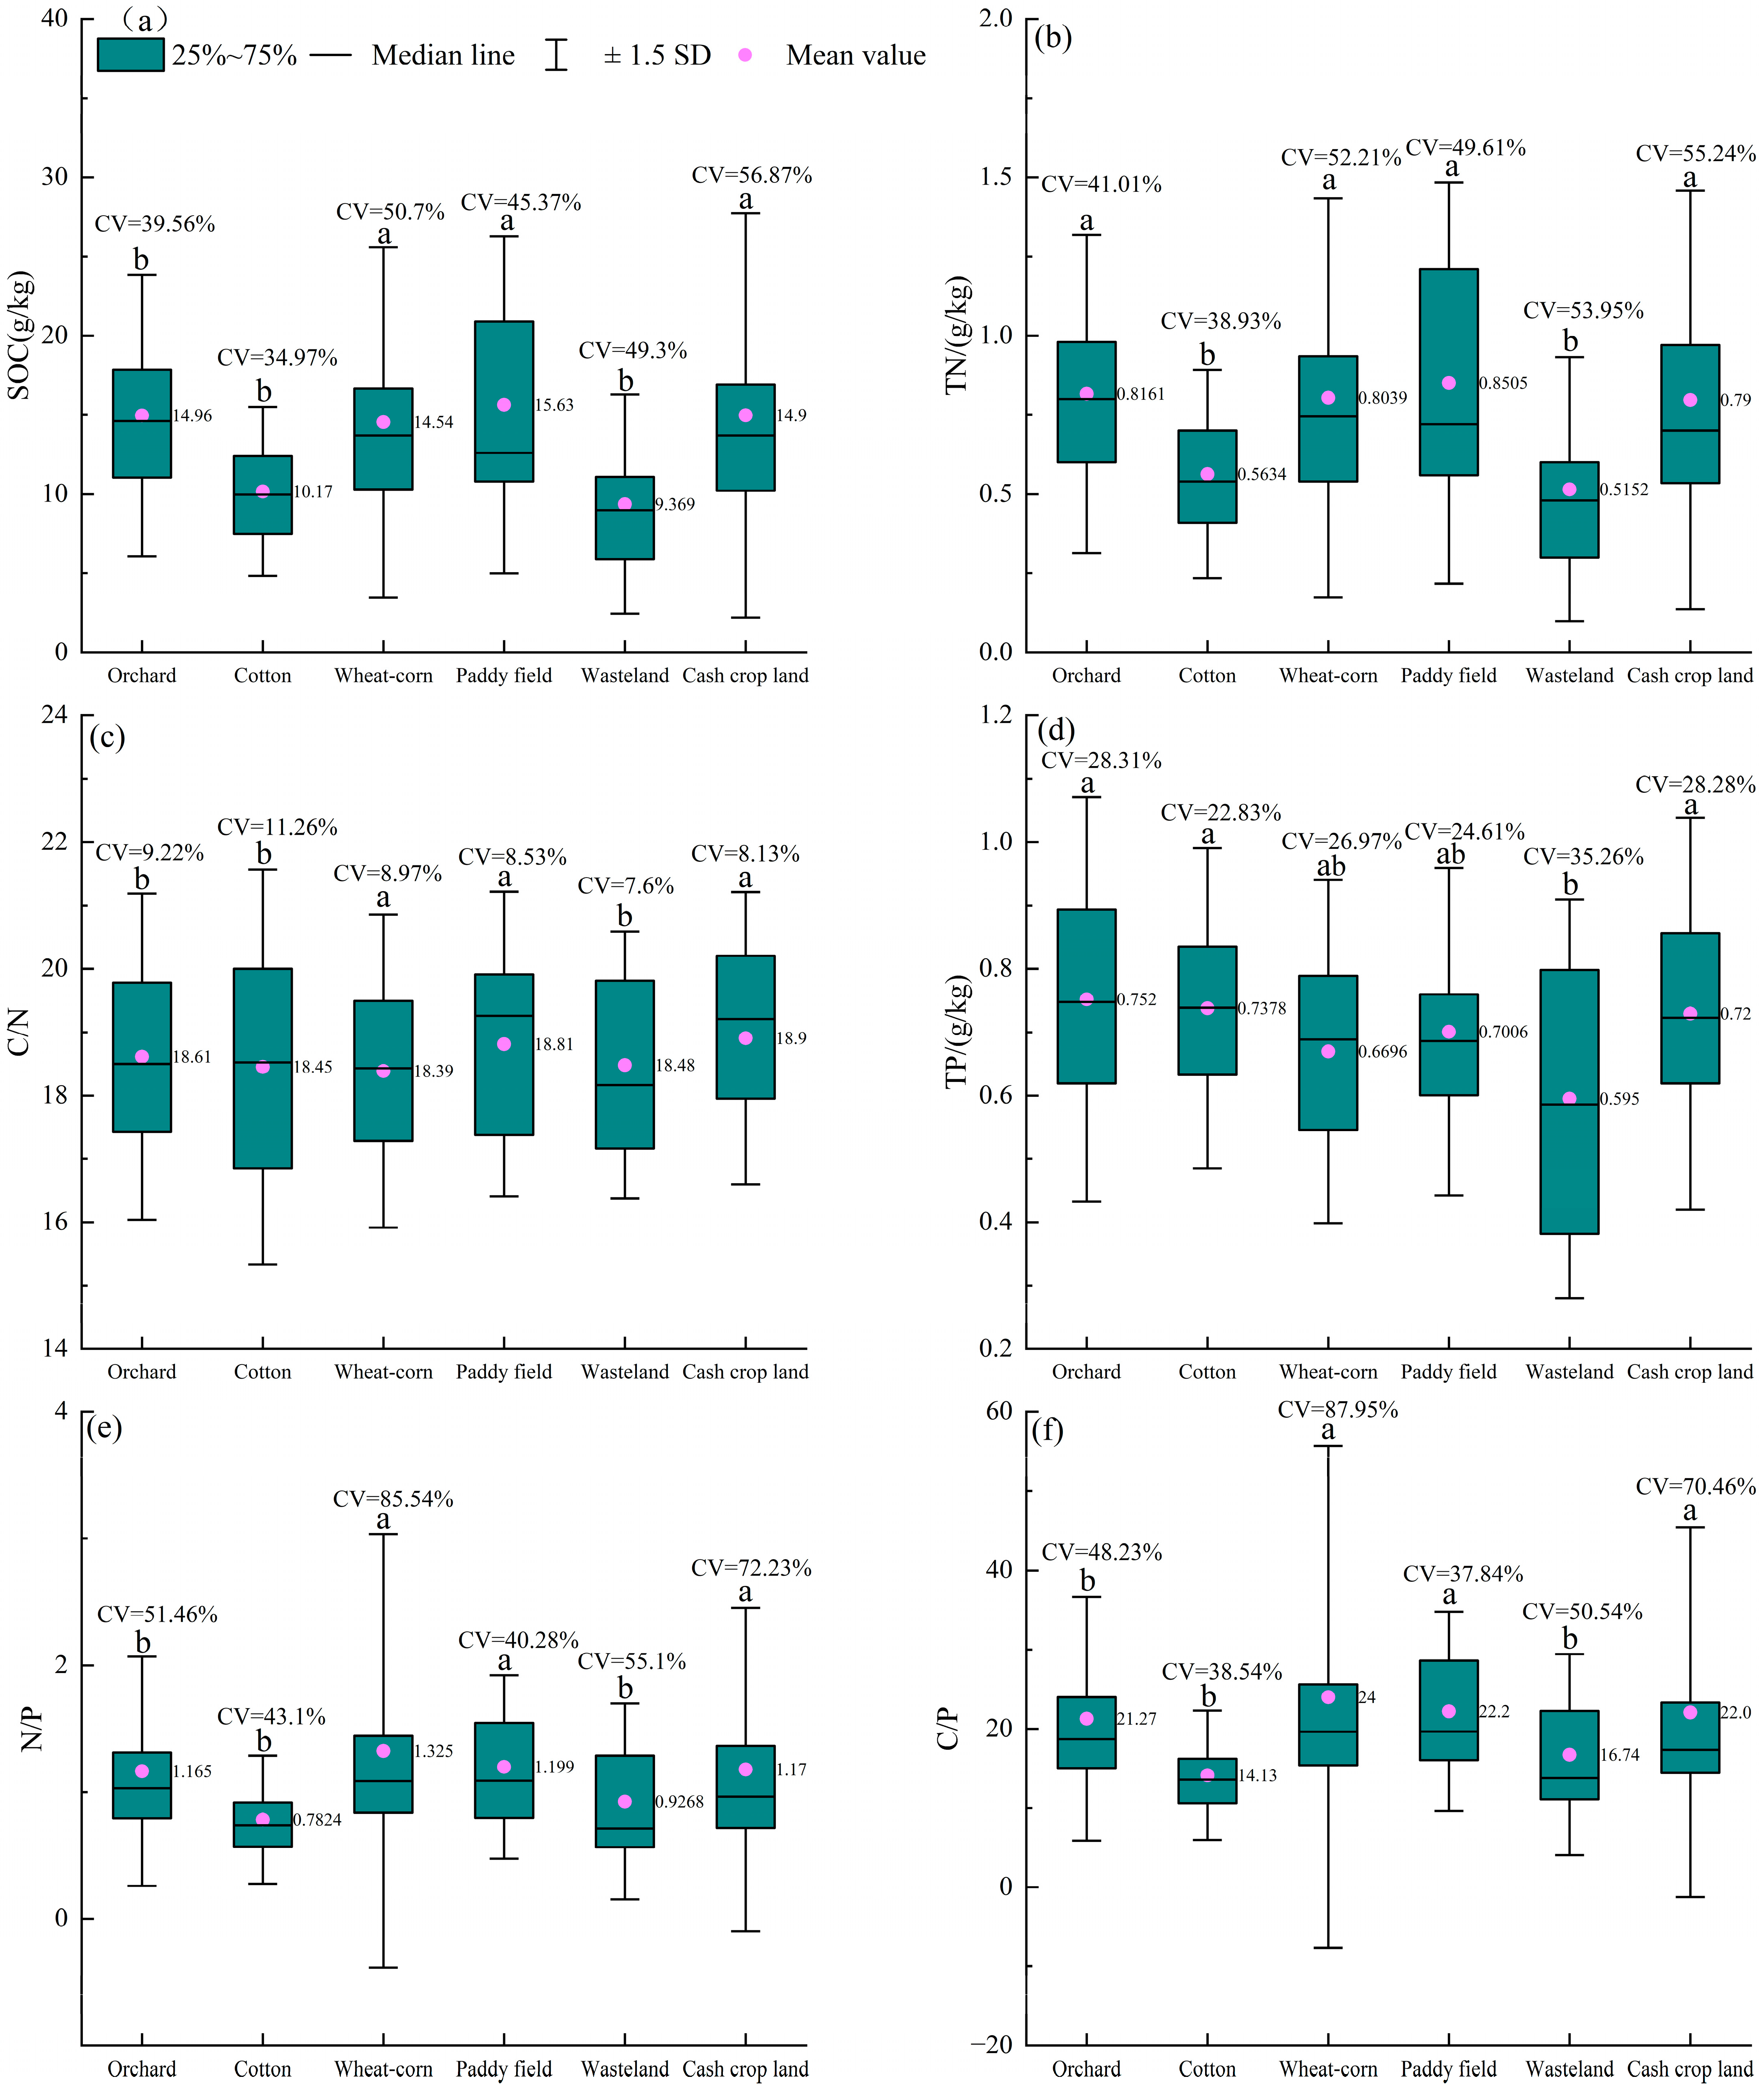
3.1. Statistical Characteristics of Soil Nutrient Content and C:N:P Ratios

Among the 1131 sampling points in the Aksu region, 408 were orchards, 355 cotton fields, 288 wheat–corn rotations, 21 paddy fields, 23 wastelands, and 36 others (see Table 2).
Descriptive statistical results (Figure 2) revealed that across six cropping systems in the Aksu region, the average contents of soil organic carbon (SOC), total nitrogen (TN), and total phosphorus (TP) in the plough layer ranged from 9.37–15.63 g/kg, 0.52–0.85 g/kg, and 0.67–0.75 g/kg, respectively. The stoichiometric ratios of C:N, C:P, and N:P varied between 18.39 and 18.91, 14.13 and 24.00, and 0.78 and 1.31, respectively. Overall, the regional averages for SOC, TN, TP, C:N, C:P, and N:P were 13.25 g/kg, 0.73 g/kg, 0.72 g/kg, 18.52, 19.68, and 1.08, respectively. Additionally, the mean contents of alkali-hydrolyzable nitrogen and available phosphorus in the plough layer were 62.90 mg/kg and 24.80 mg/kg, respectively.
Significant differences in SOC, TN, TP contents, and stoichiometric ratios were observed among cropping systems. The coefficients of variation (CV) for SOC, TN, and TP ranged primarily between 20% and 60%, indicating moderate to high variability, which suggests substantial anthropogenic influences on these nutrients. The remaining nutrient ratios also exhibited considerable variability, ranked as TN > SOC > C:P > C:N, reflecting distinct spatial distribution patterns of soil carbon, nitrogen, and stoichiometric ratios across different agricultural practices in the Aksu region.

3.2. Spatial Autocorrelation of Soil Nutrient Content and C:N:P Ratio

The spatial distribution of soil nutrients exhibits both stochastic and structural features, which can be effectively modeled using semi-variogram analysis. Structural factors primarily include natural conditions such as soil type, parent material, topography, soil texture, and climate, while stochastic factors refer to anthropogenic influences from land use practices and field management. The nugget (C0) represents spatial heterogeneity caused by random factors, and the sill (C0 + C) indicates total variability within the dataset. The nugget-to-sill ratio (C0/(C0 + C)) quantifies the proportion of spatial heterogeneity attributable to stochastic factors, with higher values suggesting dominant random effects.
Using GS+ 9.0 geostatistical software, semi-variogram models were fitted for SOC, TN, TP contents, and C:N:P ratios. Optimal models were selected based on spatial heterogeneity and trend analysis (Table 3 and Figure 3). Exponential models best described SOC, TN, and C:N ratios, whereas spherical models were optimal for TP, C:P, and N:P ratios. The coefficients of determination (R2) for SOC, TN, TP, C:N, C:P, and N:P were 0.389, 0.352, 0.362, 0.639, 0.447, and 0.469, respectively. Nugget-to-sill ratios for SOC, TN, and TP ranged between 50.01–58.14%, indicating moderate spatial autocorrelation driven by both structural and stochastic factors. In contrast, C:N, C:P, and N:P ratios exhibited nugget-to-sill ratios > 80%, suggesting dominant stochastic influences with no clear spatial patterns.
The ranges (spatial correlation distances) of SOC, TN, and TP were 50.7 km, 78.1 km, and 94.4 km, respectively. The C:N ratio showed a shorter range (24.6 km), implying higher localized spatial autocorrelation compared to other nutrients. The ranges of C:P (98.0 km) and N:P (97.7 km) ratios were smaller than those of SOC and TP, reflecting weaker spatial dependencies in stoichiometric relationships.

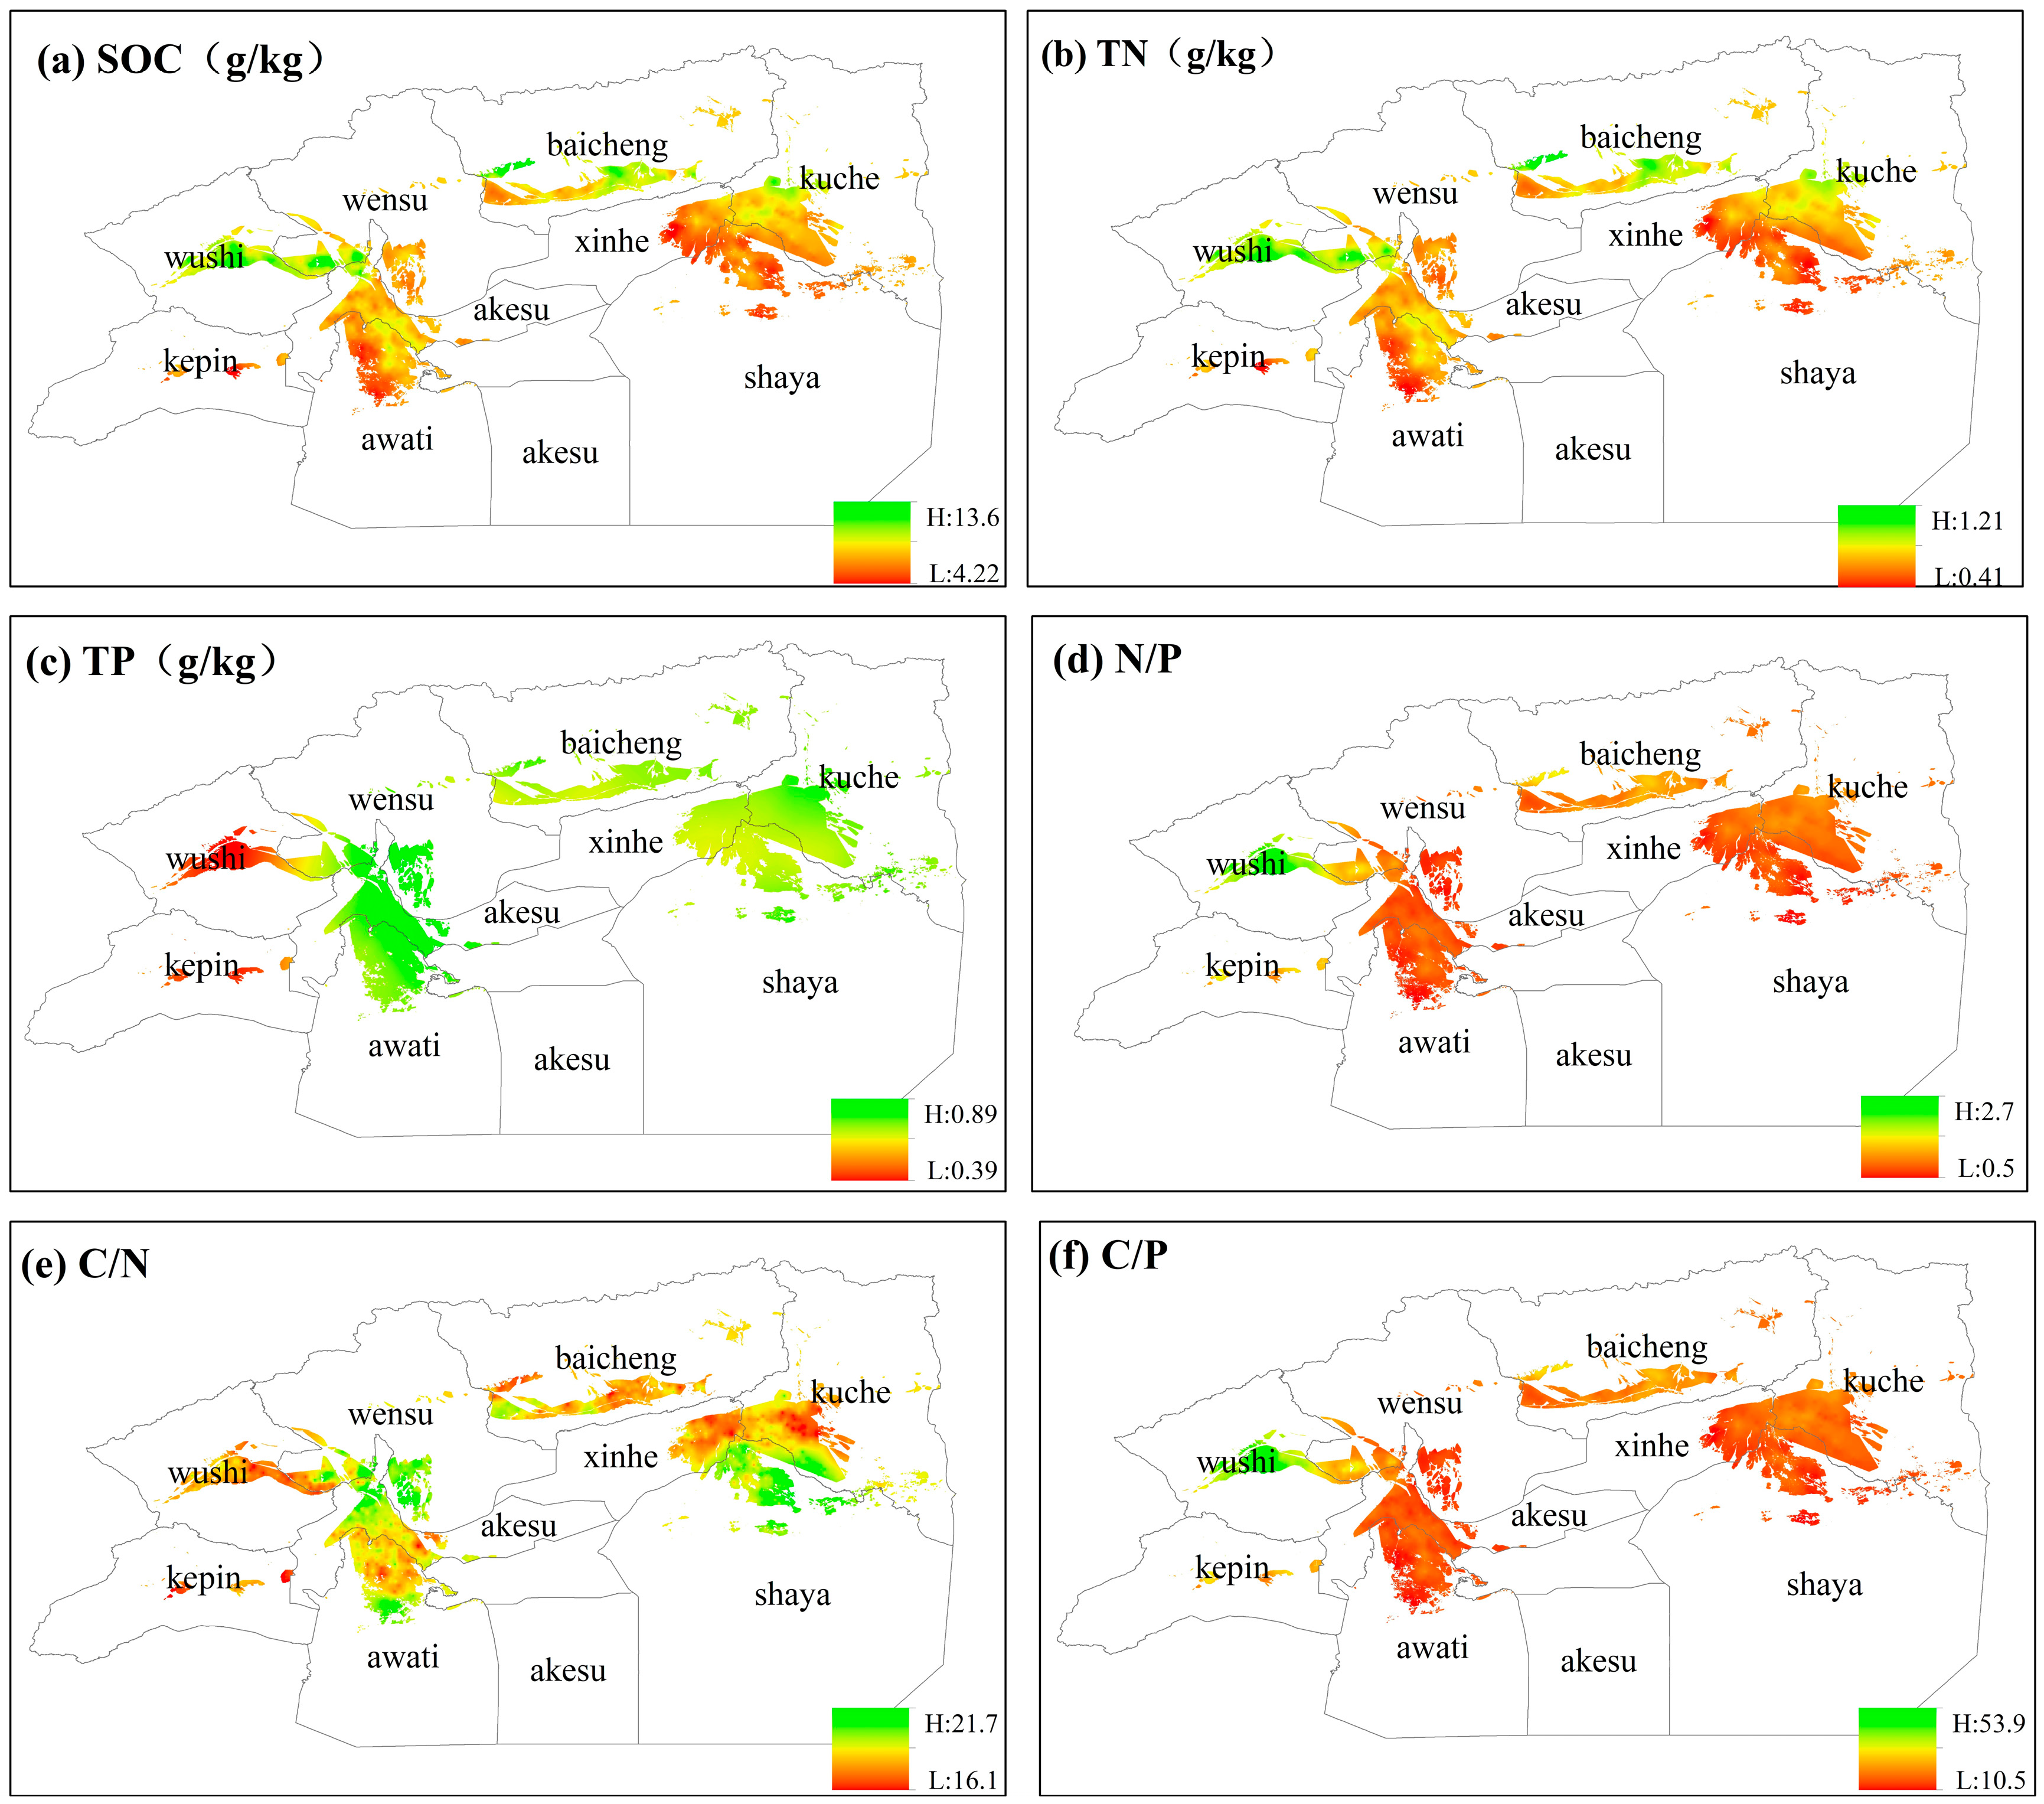
3.3. Spatial Distribution Patterns of Soil Nutrient Contents and C:N:P Ratios

Based on the optimal semi-variogram models for SOC, TN, TP, and stoichiometric ratios, spatial distribution maps of these parameters in the Aksu region were generated using ordinary Kriging interpolation (Figure 4). The results show that SOC and TN contents ranged from 4.22–13.60 g/kg and 0.41–1.21 g/kg, respectively, with similar spatial patterns characterized by higher values in the north and lower in the south and higher values in the eastern part of the oasis compared to the west—a trend attributable to the significant positive correlation between SOC and TN. High SOC and TN concentrations were clustered in Wushi, Wensu, and Baicheng, whereas low values predominated in Xinhe, Shaya County, and Awat.TP content exhibited relatively homogeneous spatial distribution, with moderate to high levels concentrated in Wensu, Aksu, and Kuche. In contrast, the C:N ratio displayed strong spatial randomness, consistent with the semi-variogram analysis results.

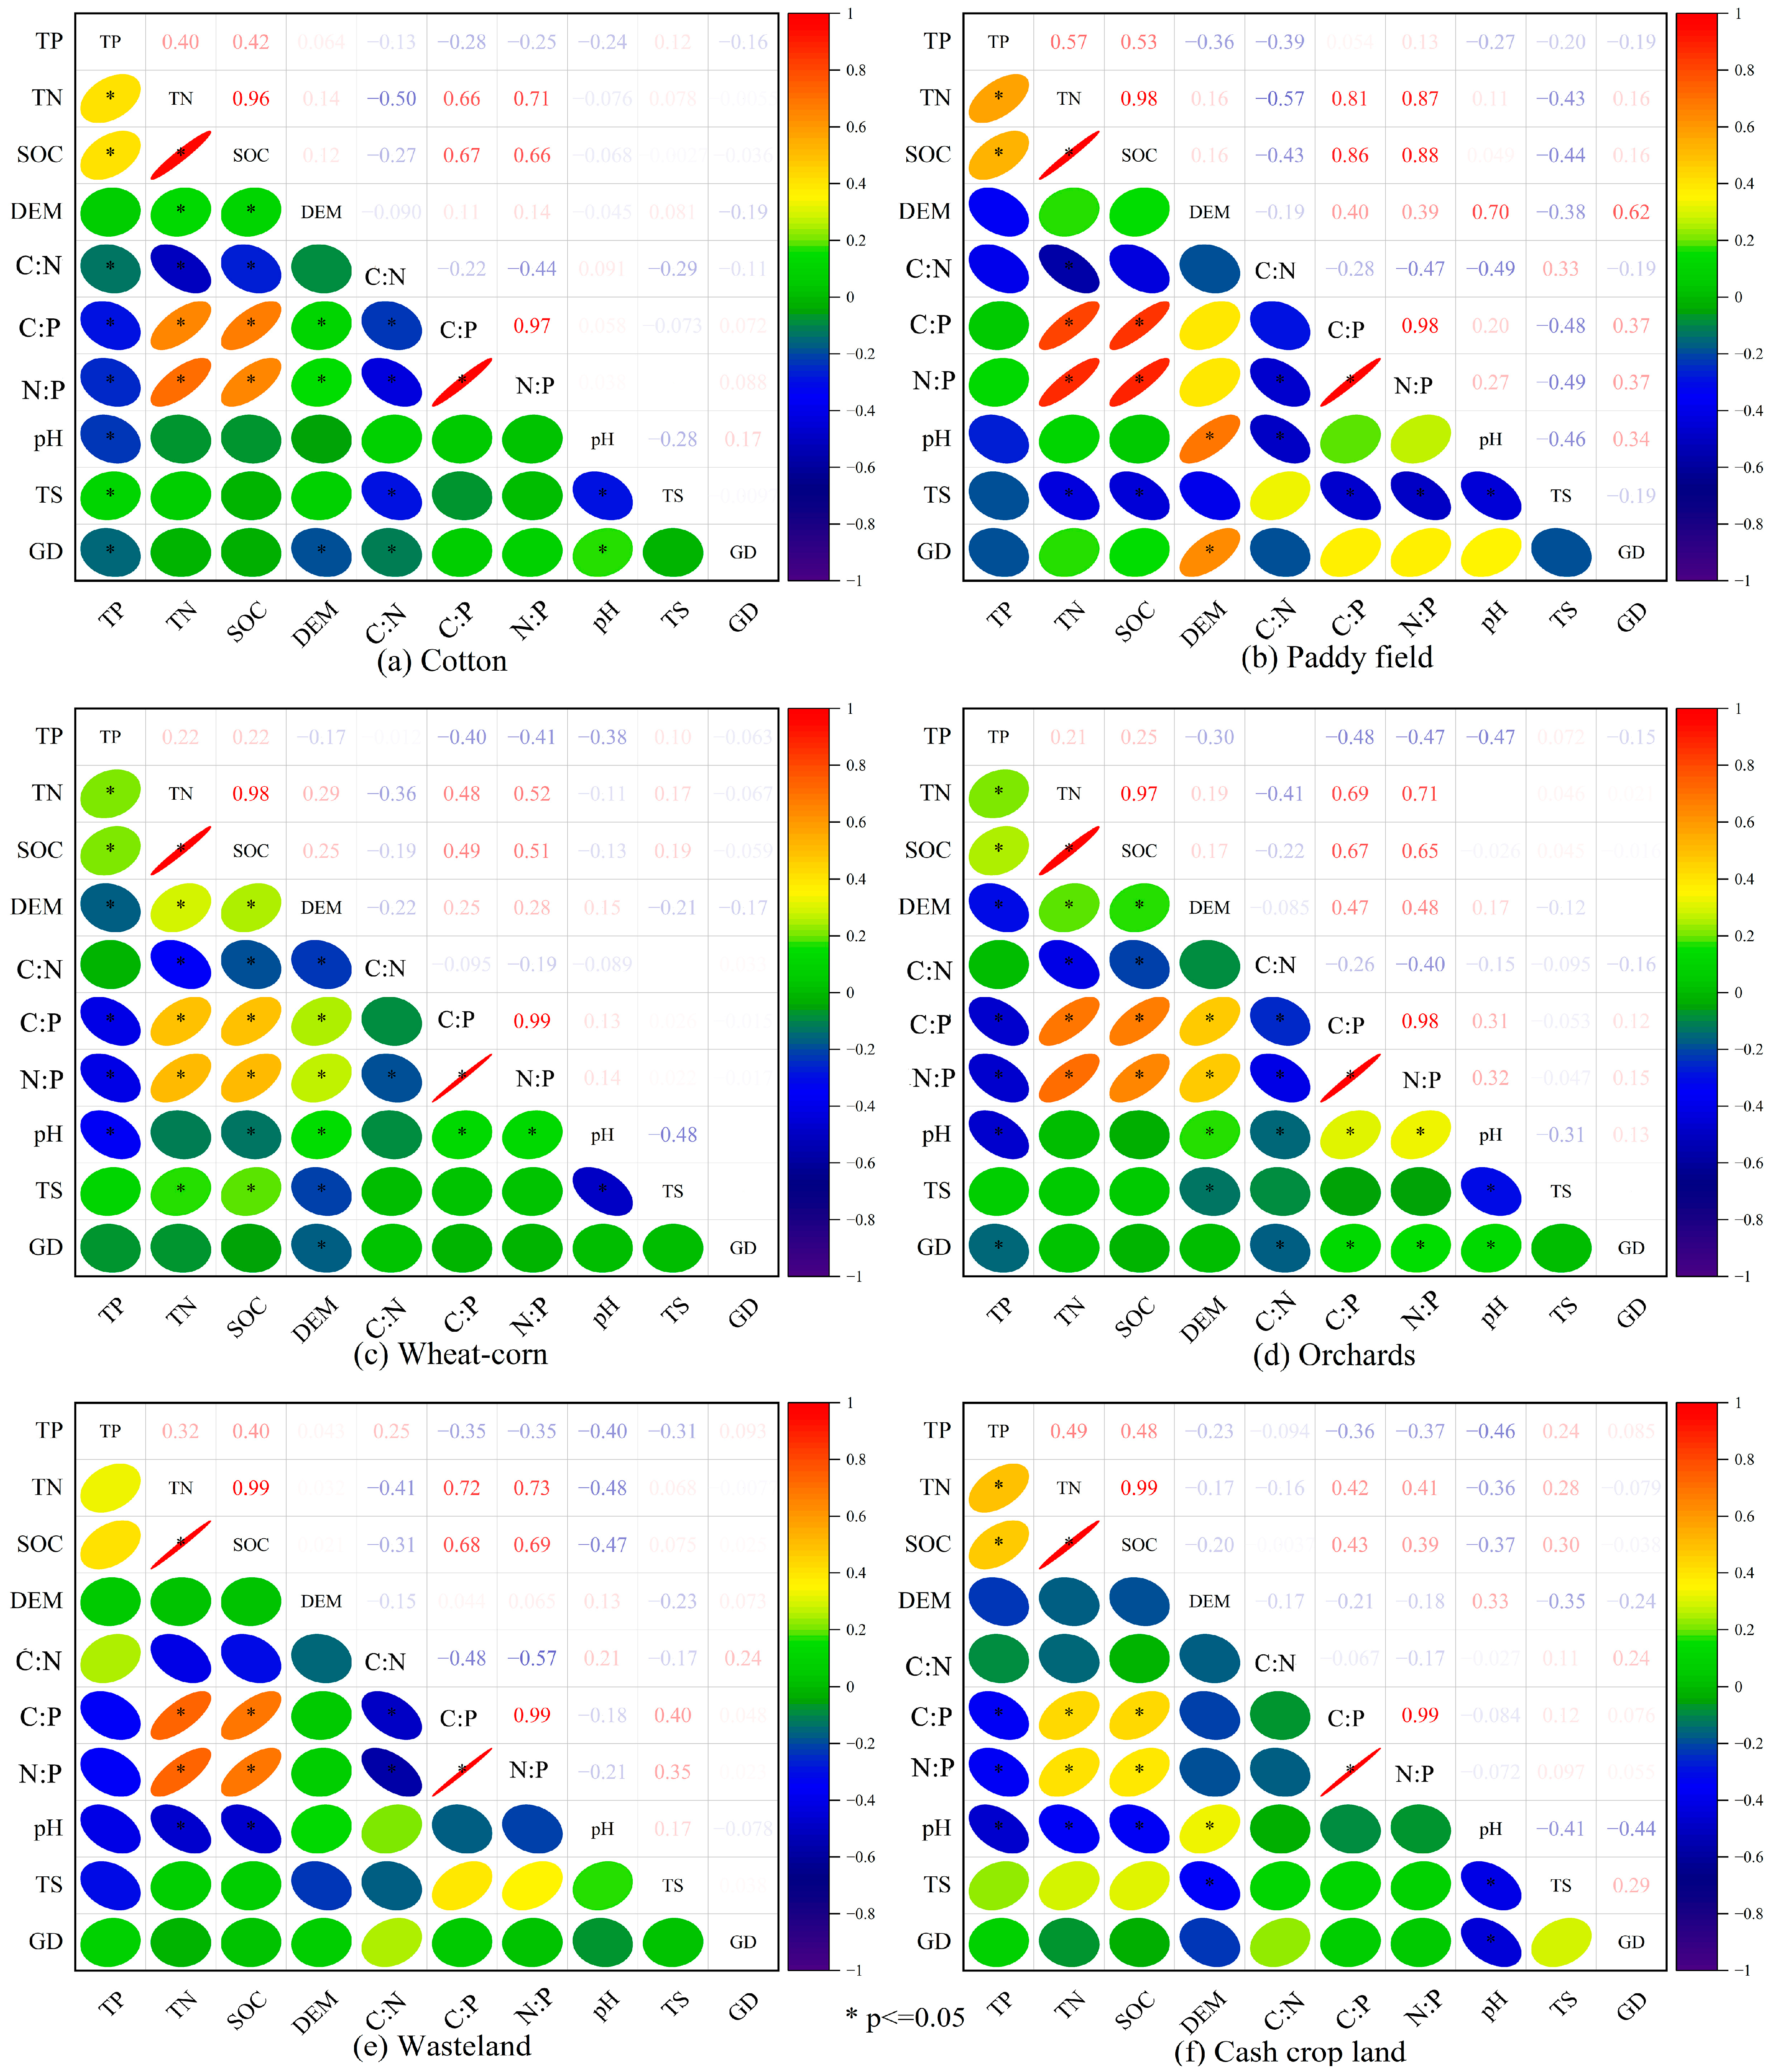
3.4. Analysis of Factors Influencing Soil SOC, TN, TP, and C:N:P Ratios Across Cropping Systems

The spatial heterogeneity of soil nutrients in the Aksu region arises from both natural environmental factors and anthropogenic activities. Pearson correlation analysis revealed a strong positive correlation between SOC and TN in the plough layer (r = 0.979 **, p < 0.01). SOC and TN showed significant negative correlations with a C:N ratio (r = −0.179 ** and −0.353 **, respectively, p < 0.01), indicating that the C:N ratio is influenced by SOC and TN levels. As illustrated in Figure 5, the soil C:N ratio was further modulated by pH, elevation, and groundwater depth, with varying dominant factors across cropping systems.

3.5. Analysis of Environmental Drivers and Interrelationships of Soil Carbon, Nitrogen, and Phosphorus Stocks, and Stoichiometric Ratios in Different Agricultural Systems

Orchards: Elevation was the key factor affecting SOC and TN, while C:P and N:P ratios were closely linked to pH and elevation. TP exhibited significant correlations with pH, elevation, and groundwater depth. Wheat–maize systems: SOC, TN, TP, and stoichiometric ratios (C:N, C:P, and N:P) were all significantly influenced by elevation. TP and C:N ratio showed significant negative correlations with elevation, while only TP was negatively correlated with pH. Cotton fields: SOC, C:N, and C:P ratios showed no significant correlations with elevation, pH, or groundwater depth. TN positively correlated with elevation, whereas TP negatively correlated with pH and groundwater depth. Paddy fields and wasteland: No significant correlations were observed between soil parameters and environmental factors. Other systems: Only TP exhibited a significant correlation with elevation. Comprehensive analysis identified soil pH and elevation as the primary drivers of SOC, TN, and C:N ratio variability across all six cropping systems.
Correlations between C:N:P stocks and stoichiometric ratios are summarized in Table 4: Orchards: C and N stocks positively correlated with C:P and N:P (p < 0.01), but negatively with C:N (p < 0.01). P stock negatively correlated with C:P and N:P (p < 0.05). Cotton and wheat–maize systems: C and N stocks strongly positively correlated with C:P and N:P (p < 0.01); P stock negatively correlated with these ratios (p < 0.01). C stock negatively correlated with C:N, which is significant in cotton systems. Paddy fields: C and N stocks positively correlated with C:P and N:P (p < 0.01), negatively with C:N (p < 0.01). P stock showed no correlations. Wasteland: C and N stocks positively correlated with C:P and N:P (p < 0.01); no correlations for P stock. Other systems: C stock positively correlated with C:P and N:P (p < 0.05); N stock correlated with C:P (p < 0.01); P stock weakly correlated with C:P and N:P (p < 0.05).

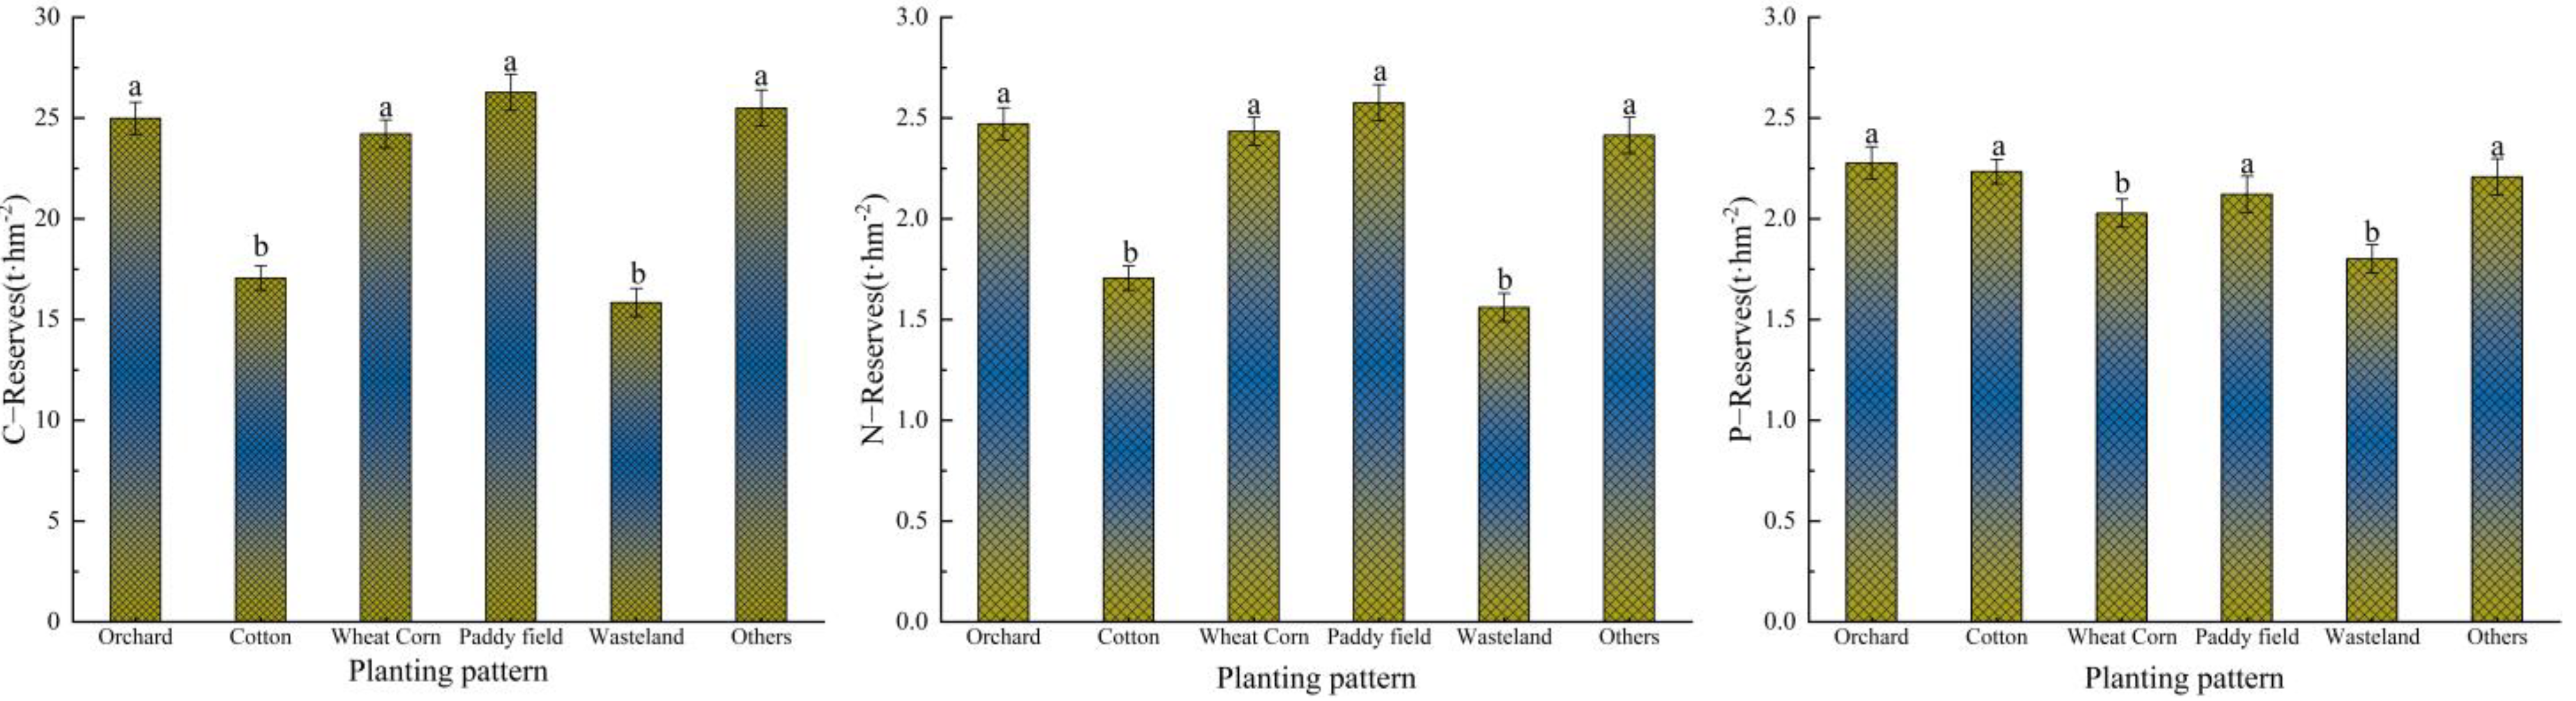
3.6. Analysis of Surface Soil Carbon, Nitrogen, and Phosphorus Stocks and Their Correlations

Based on soil bulk density data from the Aksu region (2020), average values for orchards, cotton fields, wheat–maize systems, paddy fields, other systems, and wasteland were 1.441, 1.444, 1.44, 1.457, 1.459, and 1.456 g cm−3, respectively. Surface soil C, N, and P stocks were calculated accordingly (Figure 6). The mean surface soil C stock was 22.31 ± 10.37 t hm−2, ranked as paddy fields (26.28 t hm−2) > other systems (25.49 t hm−2) > orchards (24.98 t hm−2) > wheat–maize (24.21 t hm−2) > cotton fields (17.06 t hm−2) > wasteland (15.84 t hm−2), with significant differences (p < 0.05) between cotton/other systems and the remaining four. Mean N stock (2.20 ± 1.07 t hm−2) followed paddy fields (2.58 t hm−2) > orchards (2.47 t hm−2) > wheat–maize (2.43 t hm−2) > other systems (2.41 t hm−2) > cotton fields (1.71 t hm−2) > wasteland (1.56 t hm−2), where cotton and wasteland differed significantly (p < 0.05) from others. Mean P stock (2.21 ± 0.59 t hm−2) showed orchards (2.58 t hm−2) > cotton fields (2.47 t hm−2) > other systems (2.43 t hm−2) > paddy fields (2.41 t hm−2) > wheat–maize (1.71 t hm−2) > wasteland (1.56 t hm−2), with wheat–maize and wasteland significantly lower (p < 0.05). These results highlight pronounced anthropogenic impacts on surface soil nutrient stocks across land-use types.
Soil P is mainly derived from matric weathering or anthropogenic inputs (e.g., fertilization) rather than as a direct product of organic matter decomposition. The accumulation of C and N may be correlated with organic matter inputs, whereas P storage is dominated by physicochemical processes, such as mineral adsorption-desorption and fixation of Fe-Al oxides, and is decoupled from the C/N cycle. The ability of microorganisms to mineralize P is regulated by phosphatase activity, whereas changes in C:N have a small effect on the P cycle, resulting in no significant correlation between C:P and C/N storage.
In most terrestrial ecosystems, P is readily immobilized by soil minerals to form insoluble phosphates (e.g., Fe-P, Al-P), and its effectiveness is strongly influenced by pH and redox conditions. Even if C and N stocks increase, P effectiveness may still be limited by mineral adsorption, resulting in insignificant C:P fluctuations. Plant and microbial demand for P is relatively independent of C/N metabolism. For example, in nitrogen-limited ecosystems, plants may activate P by increasing organic acid secretion from the root system, but this adaptive strategy does not significantly alter the relationship between C and N stocks, and, thus, changes in C:P ratios may not be correlated.
Overall, C and N stocks in Aksu soils exhibited significant positive correlations with C:P and N:P (p < 0.01) but no linkage to C:N. P stock showed no consistent relationships with any stoichiometric ratios, suggesting its dynamics are decoupled from C and N cycling.

4. Discussion

4.1. Impacts of Cropping Systems on Soil SOC, TN, TP Contents, and C:N:P Ratios

The diverse cropping systems and heterogeneous management practices in the Aksu region contribute to pronounced spatial variability in soil nutrient dynamics across counties or subregions. Soil carbon (C), nitrogen (N), and phosphorus (P) storage and release are closely linked to cropping systems, which further regulate their contents. Among the six cropping systems, soil organic carbon (SOC) content ranked as paddy fields > other systems > orchards > wheat–maize > cotton fields > wasteland. This pattern arises because prolonged waterlogging in paddy fields suppresses microbial activity and facilitates cation-organic matter complexation, thereby enhancing SOC and total nitrogen (TN) accumulation [25,26]. The “other systems”, dominated by vegetable cultivation exhibit high SOC due to substantial organic inputs and intensive irrigation.
Soil TN followed the order: paddy fields > orchards > wheat–maize > other systems > cotton fields > wasteland. Orchards showed elevated TN due to litter accumulation, minimal tillage, and reduced solar radiation, which collectively inhibit N loss. Wasteland soils exhibited the lowest TN due to long-term abandonment and lack of fertilization. In wheat–maize and cotton systems, nitrogen-dominated fertilization (with limited P inputs) combined with crop residue incorporation enhanced soil N retention.
The C:N ratio ranked as other systems > paddy fields > orchards > wasteland > cotton fields > wheat–maize. This reflects variations in hydrothermal conditions, fertilization regimes, and management practices. Cotton and wheat–maize systems, characterized by improved soil aeration and porosity, promote aerobic microbial activity, accelerating organic carbon decomposition and N loss [27]. High C:N ratios in “other systems” result from heavy organic fertilization, while waterlogged paddy fields exhibit slower organic matter decomposition due to low soil and water temperatures, leading to higher C:N.
The C:P ratio followed wheat–maize > paddy fields > other systems > orchards > wasteland > cotton fields. In Xinjiang, N-based fertilization predominates, with P applied secondarily. Wheat–maize systems demonstrate higher P use efficiency than cotton, partially explaining their elevated C:P ratios. Notably, Aksu’s farmland soils exhibit higher C:N (18.52) than China’s average (12.30), but markedly lower C:P (19.68 vs. 52.64) and N:P (1.08 vs. 4.20). Higher C:N ratios (18.52) may have a dual impact on ecosystem carbon sinks and agricultural sustainability by inhibiting microbial nitrogen conversion efficiency, slowing down organic matter decomposition, and exacerbating nitrogen limitation. In ecosystems, this imbalance may promote carbon sequestration at the expense of productivity, while in agriculture, optimizing the ratio of carbon and nitrogen inputs, regulating microbial function, and improving fertilization techniques are needed to break the nitrogen limitation bottleneck. Future research is needed to quantify the threshold effect of elevated C:N on the coupled carbon and nitrogen cycle by combining long-term positional observations with process modeling. Although soil testing and formulated fertilization have improved nutrient management in recent years, potassium (K) application remains suboptimal, and imbalanced fertilizer ratios persist. Expanding precision fertilization technologies is critical to address these challenges.

4.2. Factors Influencing SOC, TN, TP, and C:N:P Ratios in the Aksu Farmland

Through correlation analysis with soil physicochemical properties and environmental factors, it was found that total salt, soil pH, elevation, and groundwater significantly influence soil carbon, nitrogen, and phosphorus at varying degrees [28,29]. In the cultivated layer soils of the Aksu region, soil organic carbon (SOC) and total nitrogen (TN) exhibited a strong positive correlation (r = 0.979, p < 0.01). SOC showed a significant negative correlation with the C:N ratio (r = −0.179 **), while TN also displayed a significant negative correlation with the C:N ratio (r = −0.353 **), both reaching highly significant levels (p < 0.01). This indicates that the soil C:N ratio is primarily determined by SOC and TN contents. Beyond these elemental proportions, the C:N ratio is additionally influenced by pH, elevation, and other factors. Variations in SOC, TN, and C:N ratios under different agricultural land-use types also differ in their characteristic patterns and driving factors.
Under orchard systems, elevation emerged as a key factor affecting SOC, TN, and the C:P ratio, while groundwater depth correlated with C:N, C:P, and N:P ratios. In wheat–maize rotation systems, SOC, TN, and the C:N ratio showed significant correlations with elevation and total salt, with the C:N ratio exhibiting a significant negative correlation with soil pH. In cotton cultivation, SOC and TN were significantly associated with elevation. In paddy fields, SOC and TN demonstrated significant correlations with pH. Overall, soil nutrient contents generally displayed positive correlations with elevation: SOC, TN, C:P, and N:P ratios increased with rising elevation, whereas TP and C:N ratios showed negative correlations with elevation. The observed relationships between SOC, TN, and elevation partially diverged from previous studies, which may be attributed to zonal soil characteristics [30]. The negative correlation between the C:N ratio and elevation aligns with earlier findings [31,32].
Total salt exerted substantial effects on nutrients, showing negative correlations with all measured nutrient indices except TP. Soil pH exhibited a significant negative correlation with TP but positive correlations with N:P and C:P ratios. These patterns are consistent with the ecological stoichiometric characteristics observed in farmland ecosystems across Xinjiang.

4.3. Implications of Soil C:N:P Stoichiometry for Nutrient Management

Human activities under different cultivation practices profoundly influence soil carbon (C), nitrogen (N), and phosphorus (P) stocks and their cycling processes. In the Aksu region, the variation patterns of soil C and N stocks across five cultivation systems were similar. Paddy fields exhibited higher C and N stocks compared to the other four systems, while orchard systems showed superior soil P stocks. Thus, in terms of carbon sequestration and nitrogen retention efficiency, paddy fields represent a more effective approach than other systems and serve as primary “carbon sources” and “nitrogen sources” [33,34]. Regarding phosphorus fixation capacity, orchards outperform paddy fields and act as dominant “phosphorus sinks” [35]. Overall, soil C:P and N:P ratios in the Aksu cultivated area demonstrated significant correlations with C and N stocks (p < 0.01), indicating that large-scale soil ecological stoichiometric characteristics also provide critical insights into soil carbon and nitrogen storage dynamics.

5. Conclusions

This study analyzed 1131 surface soil samples (0–20 cm) in the Aksu region, revealing moderate-to-low levels of SOC, TN, TP, and stoichiometric ratios (C:N, C:P, and N:P), with weak spatial autocorrelation for C:P and N:P. Intensive systems (paddy fields, orchards) significantly enhanced C and N stocks (22.31 ± 10.37 and 2.20 ± 1.07 t hm−2, respectively), whereas cotton and wasteland showed nutrient depletion. Soil pH and elevation were key drivers of SOC and TN variability. Stock assessments demonstrated that intensive cultivation systems (e.g., paddy fields and orchards) significantly enhanced surface soil carbon (22.31 ± 10.37 t·ha−1) and nitrogen stocks (2.20 ± 1.07 t·ha−1), whereas cotton fields and wastelands, characterized by extensive management practices, exhibited notably lower nutrient stocks. Phosphorus stocks were highest in orchards (2.58 t·ha−1), while wheat–maize systems and wastelands showed insufficient stocks due to soil impoverishment. The observed stoichiometric imbalances (e.g., elevated C:P and N:P ratios in cotton systems) align with the ecological stoichiometry theory, which posits that deviations from optimal elemental ratios disrupt microbial-mediated nutrient cycling and plant productivity. The weak spatial autocorrelation of C:P and N:P further reflects a departure from homeostatic equilibrium—a hallmark of stable ecosystems—suggesting that arid agroecosystems in Aksu are operating under suboptimal nutrient coupling. Long-term monitoring is critical to assess whether current nutrient stocks reflect transient states or irreversible degradation, particularly under climate-induced aridification. The 0–20 cm sampling depth overlooks subsurface nutrient fluxes (e.g., deep-rooted crops accessing deeper P reserves). Future studies should integrate vertical profiling (e.g., 0–100 cm) to refine stock estimates. This work positions arid agroecosystems as critical testbeds for advancing agricultural ecology theory, particularly in reconciling human-driven intensification with biogeochemical resilience. By integrating stoichiometric principles into land management, we contribute to the emergent paradigm of ecological precision agriculture—a discipline that harmonizes data-driven decision-making with ecosystem thresholds. Future efforts should scale these insights through partnerships with regional land-use planners, ensuring that Xinjiang’s fragile farmlands serve as a model for sustainable dryland agriculture under global change.

Author Contributions

Conceptualization, L.P. and Q.G.; methodology, M.C.and S.C.; software, N.L. (Na Li); validation, N.L. (Ning Lai); formal analysis, C.L.; investigation, Y.L.; resources, H.X.; data curation, H.X.; writing—original draft preparation, H.X.; writing—review and editing, L.P. All authors have read and agreed to the published version of the manuscript.

Funding

This research was supported by stabilization support from the Xinjiang Academy of Agricultural Sciences (nkyzzkj-014,xjnkywdzc-2023002-5,xjnkywdzc-202401-05-0101) and (XinJiang Agriculture Research System—Wheat (XJARS-01-21)).

Institutional Review Board Statement

Not applicable.

Informed Consent Statement

Not applicable.

Data Availability Statement

The data presented in this study are available on request from the corresponding author.

Acknowledgments

We would like to thank our laboratory colleagues who collected and processed the data. We sincerely thank the editor-in-chief and the two anonymous reviewers for their helpful comments on improving this paper.

Conflicts of Interest

The authors declare no conflicts of interest.

References

  1. George, T.S.; Giles, C.D.; Menezes-Blackburn, D.; Condron, L.M.; Gama-Rodrigues, A.C.; Jaisi, D.; Lang, F.; Neal, A.L.; Stutter, M.I.; Almeida, D.S. Organic phosphorus in the terrestrial environment: A perspective on the state of the art and future priorities. Plant Soil 2018, 427, 191–208. [Google Scholar] [CrossRef]
  2. Abbas, F.; Hammad, H.M.; Ishaq, W.; Farooque, A.A.; Bakhat, H.F.; Zia, Z.; Fahad, S.; Farhad, W.; Cerdà, A. A review of soil carbon dynamics resulting from agricultural practices. J. Environ. Manag. 2020, 268, 110319. [Google Scholar] [CrossRef]
  3. Sanaullah, M.; Usman, M.; Wakeel, A.; Cheema, S.A.; Ashraf, I.; Farooq, M. Terrestrial ecosystem functioning affected by agricultural management systems: A review. Soil Tillage Res. 2020, 196, 104464. [Google Scholar] [CrossRef]
  4. Feng, W.-L.; Yang, J.-L.; Xu, L.-G.; Zhang, G.-L. The spatial variations and driving factors of C, N, P stoichiometric characteristics of plant and soil in the terrestrial ecosystem. Sci. Total Environ. 2024, 175543. [Google Scholar] [CrossRef] [PubMed]
  5. Dawson, J.C.; Huggins, D.R.; Jones, S.S. Characterizing nitrogen use efficiency in natural and agricultural ecosystems to improve the performance of cereal crops in low-input and organic agricultural systems. Field Crops Res. 2008, 107, 89–101. [Google Scholar] [CrossRef]
  6. Tomaz, A.; Martins, I.; Catarino, A.; Mourinha, C.; Dôres, J.; Fabião, M.; Boteta, L.; Coutinho, J.; Patanita, M.; Palma, P. Insights into the spatial and temporal variability of soil attributes in irrigated farm fields and correlations with management practices: A multivariate statistical approach. Water 2022, 14, 3216. [Google Scholar] [CrossRef]
  7. Zheng, S.; Xia, Y.; Hu, Y.; Chen, X.; Rui, Y.; Gunina, A.; He, X.; Ge, T.; Wu, J.; Su, Y. Stoichiometry of carbon, nitrogen, and phosphorus in soil: Effects of agricultural land use and climate at a continental scale. Soil Tillage Res. 2021, 209, 104903. [Google Scholar] [CrossRef]
  8. Shen, H.; Huang, Y.; Lin, X.; Dai, Z.; Zhao, H.; Su, W.-Q.; Dahlgren, R.A.; Xu, J. Recoupling of Soil Carbon, Nitrogen, and Phosphorus Cycles along a 30 Year Fire Chronosequence in Boreal Forests of China. Environ. Sci. Technol. 2025, 59, 4432–4443. [Google Scholar] [CrossRef]
  9. Luo, H.; Li, J.; Li, P.; Rioual, P.; Zou, Y.; Zhang, J.; Yan, Y.; Li, J.; Wang, L. Variation in the seasonal response to climate change during the past 1000 years as inferred from a Maar Lake sediment record, northeast China. J. Paleolimnol. 2022, 68, 133–154. [Google Scholar] [CrossRef]
  10. Shen, F.; Wu, J.; Fan, H.; Liu, W.; Guo, X.; Duan, H.; Hu, L.; Lei, X.; Wei, X. Soil N/P and C/P ratio regulate the responses of soil microbial community composition and enzyme activities in a long-term nitrogen loaded Chinese fir forest. Plant Soil 2019, 436, 91–107. [Google Scholar] [CrossRef]
  11. Zhao, X.; Tian, Q.; Huang, L.; Lin, Q.; Wu, J.; Liu, F. Fine-root functional trait response to nitrogen deposition across forest ecosystems: A meta-analysis. Sci. Total Environ. 2022, 844, 157111. [Google Scholar] [CrossRef] [PubMed]
  12. Sardans, J.; Rivas-Ubach, A.; Penuelas, J. The elemental stoichiometry of aquatic and terrestrial ecosystems and its relationships with organismic lifestyle and ecosystem structure and function: A review and perspectives. Biogeochemistry 2012, 111, 1–39. [Google Scholar] [CrossRef]
  13. Yuan, Z.; Chen, H.Y. Decoupling of nitrogen and phosphorus in terrestrial plants associated with global changes. Nat. Clim. Change 2015, 5, 465–469. [Google Scholar] [CrossRef]
  14. Sokol, N.W.; Slessarev, E.; Marschmann, G.L.; Nicolas, A.; Blazewicz, S.J.; Brodie, E.L.; Firestone, M.K.; Foley, M.M.; Hestrin, R.; Hungate, B.A. Life and death in the soil microbiome: How ecological processes influence biogeochemistry. Nat. Rev. Microbiol. 2022, 20, 415–430. [Google Scholar] [CrossRef] [PubMed]
  15. Schönhart, M.; Schmid, E.; Schneider, U.A. CropRota–A crop rotation model to support integrated land use assessments. Eur. J. Agron. 2011, 34, 263–277. [Google Scholar] [CrossRef]
  16. Tian, S.; Xu, Y.; Wang, Q.; Zhang, Y.; Yuan, X.; Ma, Q.; Feng, X.; Ma, H.; Liu, J.; Liu, C. The effect of optimizing chemical fertilizers consumption structure to promote environmental protection, crop yield and reduce greenhouse gases emission in China. Sci. Total Environ. 2023, 857, 159349. [Google Scholar] [CrossRef]
  17. Yuan, S.; Li, R.; Zhang, Y.; Tang, J.; Wang, L.; Ji, H.; Huang, S. Effects of long-term partial substitution of inorganic fertilizer with pig manure and/or straw on nitrogen fractions and microbiological properties in greenhouse vegetable soils. J. Integr. Agric. 2024, 23, 2083–2098. [Google Scholar] [CrossRef]
  18. Zhang, L.; Feng, Y.; Zhao, Z.; Cui, Z.; Baoyin, B.; Wang, H.; Li, Q.; Cui, J. Maize/soybean intercropping with nitrogen supply levels increases maize yield and nitrogen uptake by influencing the rhizosphere bacterial diversity of soil. Front. Plant Sci. 2024, 15, 1437631. [Google Scholar] [CrossRef]
  19. Almagro, M.; Díaz-Pereira, E.; Boix-Fayos, C.; Zornoza, R.; Sánchez-Navarro, V.; Re, P.; Fernández, C.; Martínez-Mena, M. The combination of crop diversification and no tillage enhances key soil quality parameters related to soil functioning without compromising crop yields in a low-input rainfed almond orchard under semiarid Mediterranean conditions. Agric. Ecosyst. Environ. 2023, 345, 108320. [Google Scholar]
  20. Lv, Y.-J.; Zhang, X.-L.; Gong, L.; Huang, S.-B.; Sun, B.-L.; Zheng, J.-Y.; Wang, Y.-J.; Wang, L.-C. Long-term reduced and no tillage increase maize (Zea mays L.) grain yield and yield stability in Northeast China. Eur. J. Agron. 2024, 158, 127217. [Google Scholar] [CrossRef]
  21. Homulle, Z.; George, T.S.; Karley, A.J. Root traits with team benefits: Understanding belowground interactions in intercropping systems. Plant Soil 2022, 471, 1–26. [Google Scholar] [CrossRef]
  22. Xu, P.; Li, G.; Zheng, Y.; Fung, J.C.; Chen, A.; Zeng, Z.; Shen, H.; Hu, M.; Mao, J.; Zheng, Y. Fertilizer management for global ammonia emission reduction. Nature 2024, 626, 792–798. [Google Scholar] [CrossRef] [PubMed]
  23. Oliver, M.A.; Webster, R. Semi-variograms for modelling the spatial pattern of landform and soil properties. Earth Surf. Process. Landf. 1986, 11, 491–504. [Google Scholar] [CrossRef]
  24. Tang, X.; Hu, J.; Lu, Y.; Qiu, J.; Dong, Y.; Li, B. Soil C, N, P stocks and stoichiometry as related to land use types and erosion conditions in lateritic red soil region, south China. Catena 2022, 210, 105888. [Google Scholar] [CrossRef]
  25. Wei, L.; Ge, T.; Zhu, Z.; Luo, Y.; Yang, Y.; Xiao, M.; Yan, Z.; Li, Y.; Wu, J.; Kuzyakov, Y. Comparing carbon and nitrogen stocks in paddy and upland soils: Accumulation, stabilization mechanisms, and environmental drivers. Geoderma 2021, 398, 115121. [Google Scholar] [CrossRef]
  26. Lin, S.; Wang, W.; Sardans, J.; Lan, X.; Fang, Y.; Singh, B.P.; Xu, X.; Wiesmeier, M.; Tariq, A.; Zeng, F. Effects of slag and biochar amendments on microorganisms and fractions of soil organic carbon during flooding in a paddy field after two years in southeastern China. Sci. Total Environ. 2022, 824, 153783. [Google Scholar] [CrossRef] [PubMed]
  27. Ghezzehei, T.A.; Sulman, B.; Arnold, C.L.; Bogie, N.A.; Berhe, A.A. On the role of soil water retention characteristic on aerobic microbial respiration. Biogeosciences 2019, 16, 1187–1209. [Google Scholar] [CrossRef]
  28. Zhang, W.; Zhu, J.; Zhou, X.; Li, F. Effects of shallow groundwater table and fertilization level on soil physico-chemical properties, enzyme activities, and winter wheat yield. Agric. Water Manag. 2018, 208, 307–317. [Google Scholar] [CrossRef]
  29. Ping, C.L.; Michaelson, G.J.; Stiles, C.A.; González, G. Soil characteristics, carbon stores, and nutrient distribution in eight forest types along an elevation gradient, eastern Puerto Rico. Ecol. Bull. 2013, 54, 67–86. [Google Scholar]
  30. Wu, X.; Cai, C.; Wang, J.; Wei, Y.; Wang, S. Spatial variations of aggregate stability in relation to sesquioxides for zonal soils, South-central China. Soil Tillage Res. 2016, 157, 11–22. [Google Scholar] [CrossRef]
  31. Jiang, L.; He, Z.; Liu, J.; Xing, C.; Gu, X.; Wei, C.; Zhu, J.; Wang, X. Elevation gradient altered soil C, N, and P stoichiometry of Pinus taiwanensis forest on Daiyun Mountain. Forests 2019, 10, 1089. [Google Scholar] [CrossRef]
  32. Ravikovitch, S.; Porath, A. The effect of nutrients on the salt tolerance of crops. Plant Soil 1967, 26, 49–71. [Google Scholar] [CrossRef]
  33. Chen, S.; Elrys, A.S.; Zhao, C.; Cai, Z.; Zhang, J.; Müller, C. Global patterns and controls of yield and nitrogen use efficiency in rice. Sci. Total Environ. 2023, 898, 165484. [Google Scholar] [CrossRef] [PubMed]
  34. Jun, X.; Evgenia, B.; Zhang, Y.; Yu, W.; Hu, Q.-J.; Zhang, C.-M.; Jie, W.; Zhang, Y.-Q.; Shi, X.-J. Substituting nitrogen and phosphorus fertilizer with optimal amount of crop straw improves rice grain yield, nutrient use efficiency and soil carbon sequestration. J. Integr. Agric. 2022, 21, 3345–3355. [Google Scholar]
  35. Solangi, F.; Zhu, X.; Khan, S.; Rais, N.; Majeed, A.; Sabir, M.A.; Iqbal, R.; Ali, S.; Hafeez, A.; Ali, B. The global dilemma of soil legacy phosphorus and its improvement strategies under recent changes in agro-ecosystem sustainability. ACS Omega 2023, 8, 23271–23282. [Google Scholar] [CrossRef]
Figure 1. Overview maps of the (a) Xinjiang Uygur Autonomous Region and (b) study area. (c) Data sampling points.
Sustainability 17 03881 g001
Figure 2. Descriptive statistics of soil C, N, and P, and other indicators and their ecological stoichiometric characteristics ((af) are soil SOC, TN, C/D, TP, N/P, and C/P mathematical and statistical characteristics, respectively; Numbers a and b represent significant differences).
Sustainability 17 03881 g002
Figure 3. Semi-variogram of the soil C:N ratio (a), C:P ratio (b), N:P ratio (c), and contents of SOC (d), TN (e), and TP (f) in the Aksu region.
Sustainability 17 03881 g003
Figure 4. Spatial distribution of SOC, TN, and TP, contents and C:N, C:P, and N:P ratios in the Aksu region.
Sustainability 17 03881 g004
Figure 5. Correlation analysis of influencing factors for soil SOC, TN, and C:N ratio under different cropping systems (GD: ground water; DEM: digital elevation model; TS: total salt).
Sustainability 17 03881 g005
Figure 6. Soil organic carbon (SOC), total nitrogen (TN), and total phosphorus (TP) stocks under different cropping systems. (Numbers a and b represent significant differences).
Sustainability 17 03881 g006
Table 1. Planting pattern type description.
TypeSample Sites Overview
OrchardMainly fruit trees
CottonLong-term cotton cultivation
Wheat–cornLong-term cultivation of wheat or corn and wheat–corn crop rotation
Paddy fieldMainly planted with rice
WastelandNewly reclaimed or abandoned plots
OtherPlots planted with vegetables and cash crops
Table 2. Data table of sampling points in the Aksu area.
Mode CountyAksuAwatiBaichengKepingKucheShayaWensuWushiXinheTotal
Orchard103371916425835125408
Wasteland10--7112-223
Wheat–corn182910133614244221288
Cotton3692-19579626-29355
Paddy field2-1---171-21
Other1419-228--36
Total1701621403016013816094771131
Table 3. Semi-variance models of the soil SOC, TN, TP, and C:N, C:P, and N:P ratios and their corresponding parameters in the Aksu area.
Plough Layer NutrientFitted ModelCoefficient of Determination (R2)Nugget-to-Sill Ratio (C0/(C0 + C))
SOCE0.38950.01%
TNE0.35252.55%
TPS0.36258.14%
C:NE0.63983.03%
C:PS0.44781.91%
N:PS0.46985.53%
Table 4. Correlation of soil carbon, nitrogen, and phosphorus reserves with C:N, C:P, and N:P.
Planting PatternsC, N, P Storage CapacityC:NC:PN:P
OrchardC−0.206 **0.655 **0.631 **
N−0.408 **0.691 **0.705 **
P0.019−0.477 **−0.468 **
CottonC−0.260 **0.677 **0.663 **
N−0.501 **0.657 **0.711 **
P−0.135 *−0.282 **−0.246 **
Wheat–cornC−0.3040.640 **0.645 **
N−0.4110.721 **0.735 **
P0.254−0.347−0.350
Paddy fieldC−0.4300.837 **0.864 **
N−0.573 **0.811 **0.872 **
P−0.3850.0540.133
WastelandC−0.3040.640 **0.645 **
N−0.4110.721 **0.735 **
P0.254−0.347−0.350
OtherC−0.0010.415 *0.383 *
N−0.1590.425 **0.410 *
P−0.094−0.362 *−0.366 *
Total cultivated landC−0.3040.640 **0.645 **
N−0.4110.721 **0.735 **
P0.254−0.347−0.350
Note: ** indicates p < 0.01, * indicates p < 0.05.
Disclaimer/Publisher’s Note: The statements, opinions and data contained in all publications are solely those of the individual author(s) and contributor(s) and not of MDPI and/or the editor(s). MDPI and/or the editor(s) disclaim responsibility for any injury to people or property resulting from any ideas, methods, instructions or products referred to in the content.

