Article

Data-Driven Risk Warning of Electricity Sales Companies in the Whole Business Process

1
Guangxi Key Laboratory of Power System Optimization and Energy-Saving Technology, School of Electrical Engineering, Guangxi University, Nanning 530004, China
2
China Southern Power Grid Guangxi Electric Power Trading Center, Nanning 530023, China
*
Author to whom correspondence should be addressed.
Sustainability 2025, 17(9), 3884; https://doi.org/10.3390/su17093884
Submission received: 8 February 2025 / Revised: 29 March 2025 / Accepted: 23 April 2025 / Published: 25 April 2025

Abstract

:
As China’s power market reforms deepen, the scale of market operations and the number of participants have reached new highs, introducing increasingly complex threats and heightened risk scenarios. Traditional risk early warning systems for electricity sales companies are heavily influenced by subjective factors, incomplete data, and poor real-time performance, which cannot meet the requirements of sustainable development. To achieve efficient, full-chain, and sustainable risk control, this paper proposes a data-driven risk warning method for electricity sales companies, encompassing the entire sales process. Firstly, based on data correlations across the electricity sales process, appropriate data sources for risk warnings are identified. Key elements are then extracted using Principal Component Analysis (PCA), while historical business data is adaptively clustered, with risk warning levels classified using the Adaptive Sparrow Optimization Density Peak Clustering Algorithm (DPC-SSA). Lastly, dynamic risk warnings are generated through the stacking identification model. The effectiveness and practicality of the proposed method are validated through an analysis using real data from a provincial power trading management platform.

1. Introduction

In 2023, the total electricity traded in China’s power market reached 5.7 trillion kilowatt-hours, a 7.9% increase year-on-year. Additionally, the number of registered entities in trading organizations reached 708,000; the number of retail customers meeting the conditions of market-based transactions is gradually increasing, and the electricity sales business of electricity retailers is becoming increasingly complex [1,2,3]. As market-oriented reforms progress [4], diversified competition patterns continue to develop in China’s power market. Transactions in this market now feature diversification, digitalization, and scaling, which introduce uncertainties and heighten associated risks [5].
Electricity sales companies, important main players in the electricity market, have huge differences in their qualifications, credit, and operational capabilities, making them a major source of market risk [6]. Violations and breaches of trust by electricity sales companies affect the order of market transactions and bring operational pressure to the power regulator; on the other hand, they jeopardize the economic interests of other market members and reduce the motivation of market players to participate in market construction [7]. Consequently, an efficient, end-to-end risk warning method is urgently needed for electricity sales companies to identify high-risk segments in business processes and promote healthy, high-quality market development.
Risk control in the electricity market is a measure that cannot be ignored for its sustainable development, and nowadays, research is mainly focused on risk categories and market players. Risk categories include the seasonal risk of transaction prices [8], price fluctuation risk, electricity tariff risk in the electricity market, and the risk of power user loss of power grid companies under the new electricity reform [9].
Electricity sales companies also have wholesale business risks, retail business risks, and internal business risks in their operations [10]. Under the medium- and long-term electricity market, power sales companies also have certain risks of supply stability and cost fluctuations [11,12]. From the perspective of market players, some have arrears of payment and overuse of market power in the electricity market. Comprehensive identification of market power risks of electricity sales companies requires extensive multidimensional time scales and hierarchical regulatory structures [13].
Therefore, to study the risk of power sales companies, it is necessary to consider multiple dimensions and build a comprehensive risk indicator system. According to the actual situation of the market, appropriate indicators should be chosen to build an indicator system; the authors of [14] considered the market share, capital, and employee qualification of power sales companies, and the authors of [15,16] mentioned market force. Compared to foreign electricity markets, the domestic electricity market forces are highly concentrated, the Herfindahl–Hirschman index is higher than the threshold of 1800, and the abuse of market forces is more common [17]. The authors of [18] used an improved support vector machine to automatically identify market power abuses and reduce credit risk in electricity market transactions. Some scholars have also measured the risks faced by electricity retailers in the power sales market from multiple perspectives and constructed a risk evaluation system for electricity retailers [19]. The authors of [20] used the Intuitionistic Mold Lake Hierarchy Analysis Method (IFAHP) based on intuition to identify the credit risk of electricity sales companies and established a credit risk indicator system for electricity sales companies from four dimensions: external basic environment, operational credit risk, financial credit risk, and transactional credit risk. The construction of indicators can be optimized through the combination of Environmental, Social, and Governance (ESG) factors using principal component analysis and grey correlation methods [21].
In terms of risk assessment models, unique models have been developed in various regions of the world to assess the credit risk of power sales companies [22,23,24,25]. The authors of [26] proposed an identification method for assessing the potential for collusion in the electricity market by calculating the Jacobian matrix of profits to identify the presence of collusion in electricity sales companies. The authors of [27] proposed a credit rating method for retailers based on the Bayesian Best Worst Method (BBWM)–Cloud model. In [28], the researchers developed a credit risk evaluation model for electricity sales companies by combining the Intuitionistic Fuzzy Analytic Hierarchy Process (IFAHP) with the cloud model. The authors of [29] developed four credit models to assess credit risk under extreme economic conditions using innovative Conditional Value-at-Risk (CVaR) techniques applied to structural models (Xtreme-S), transition models (Xtreme-T), and quantile regression models (Xtreme-Q). The authors of [20,30,31,32] integrated extenics theory, cloud modeling, and cloud entropy optimization algorithms to evaluate the health of electricity market operations.
In terms of risk early warning, the authors of [33] developed an enhanced backpropagation (BP) neural network model to model the relationship between market power behavior and risk levels, achieving early warning for market power in the electricity spot market. The authors of [34] established a warning indicator system to capture market power risks and applied the Value at Risk (VaR) method based on the Generalized Autoregressive Conditional Heteroskedasticity (GARCH) model to determine thresholds for risk indicators, thus enabling early warnings of market power risk levels. The authors of [35] proposed a method for identifying potentially dangerous behaviors in the electricity market using a cloud model and fuzzy Petri nets to provide real-time early warnings. The authors of [36] used logit regression and artificial neural networks (ANN), the Naïve Bayes algorithm, and the C4.5 decision tree model to predict the overall risk score. Data-driven modeling [37], a common method, has not yet been applied in the early warning of the risk of electricity sales companies.
The above analysis primarily focuses on identifying the security threats posed by power sales companies from the perspective of a certain part of the market in which they participate, but it does not cover the whole process of the business. The main deficiencies are as follows:
  • The early warning method based on the indicator system for identifying the risk level of electricity sales companies relies on expert experience in setting risk thresholds, which is influenced by subjective factors. Additionally, the method has a certain degree of lag and cannot be updated in real time to reflect the actual conditions of the electricity sales company.
  • The current research on early warning methods primarily analyzes a certain part of the electricity sales company and lacks comprehensive risk warnings throughout the whole transaction process, which is unable to meet the requirements of its sustainable development.
Therefore, to address the aforementioned deficiencies, this paper proposes a data-driven risk warning method for electricity sales companies in the whole business process. The core innovations are expressed in the following aspects:
(1)
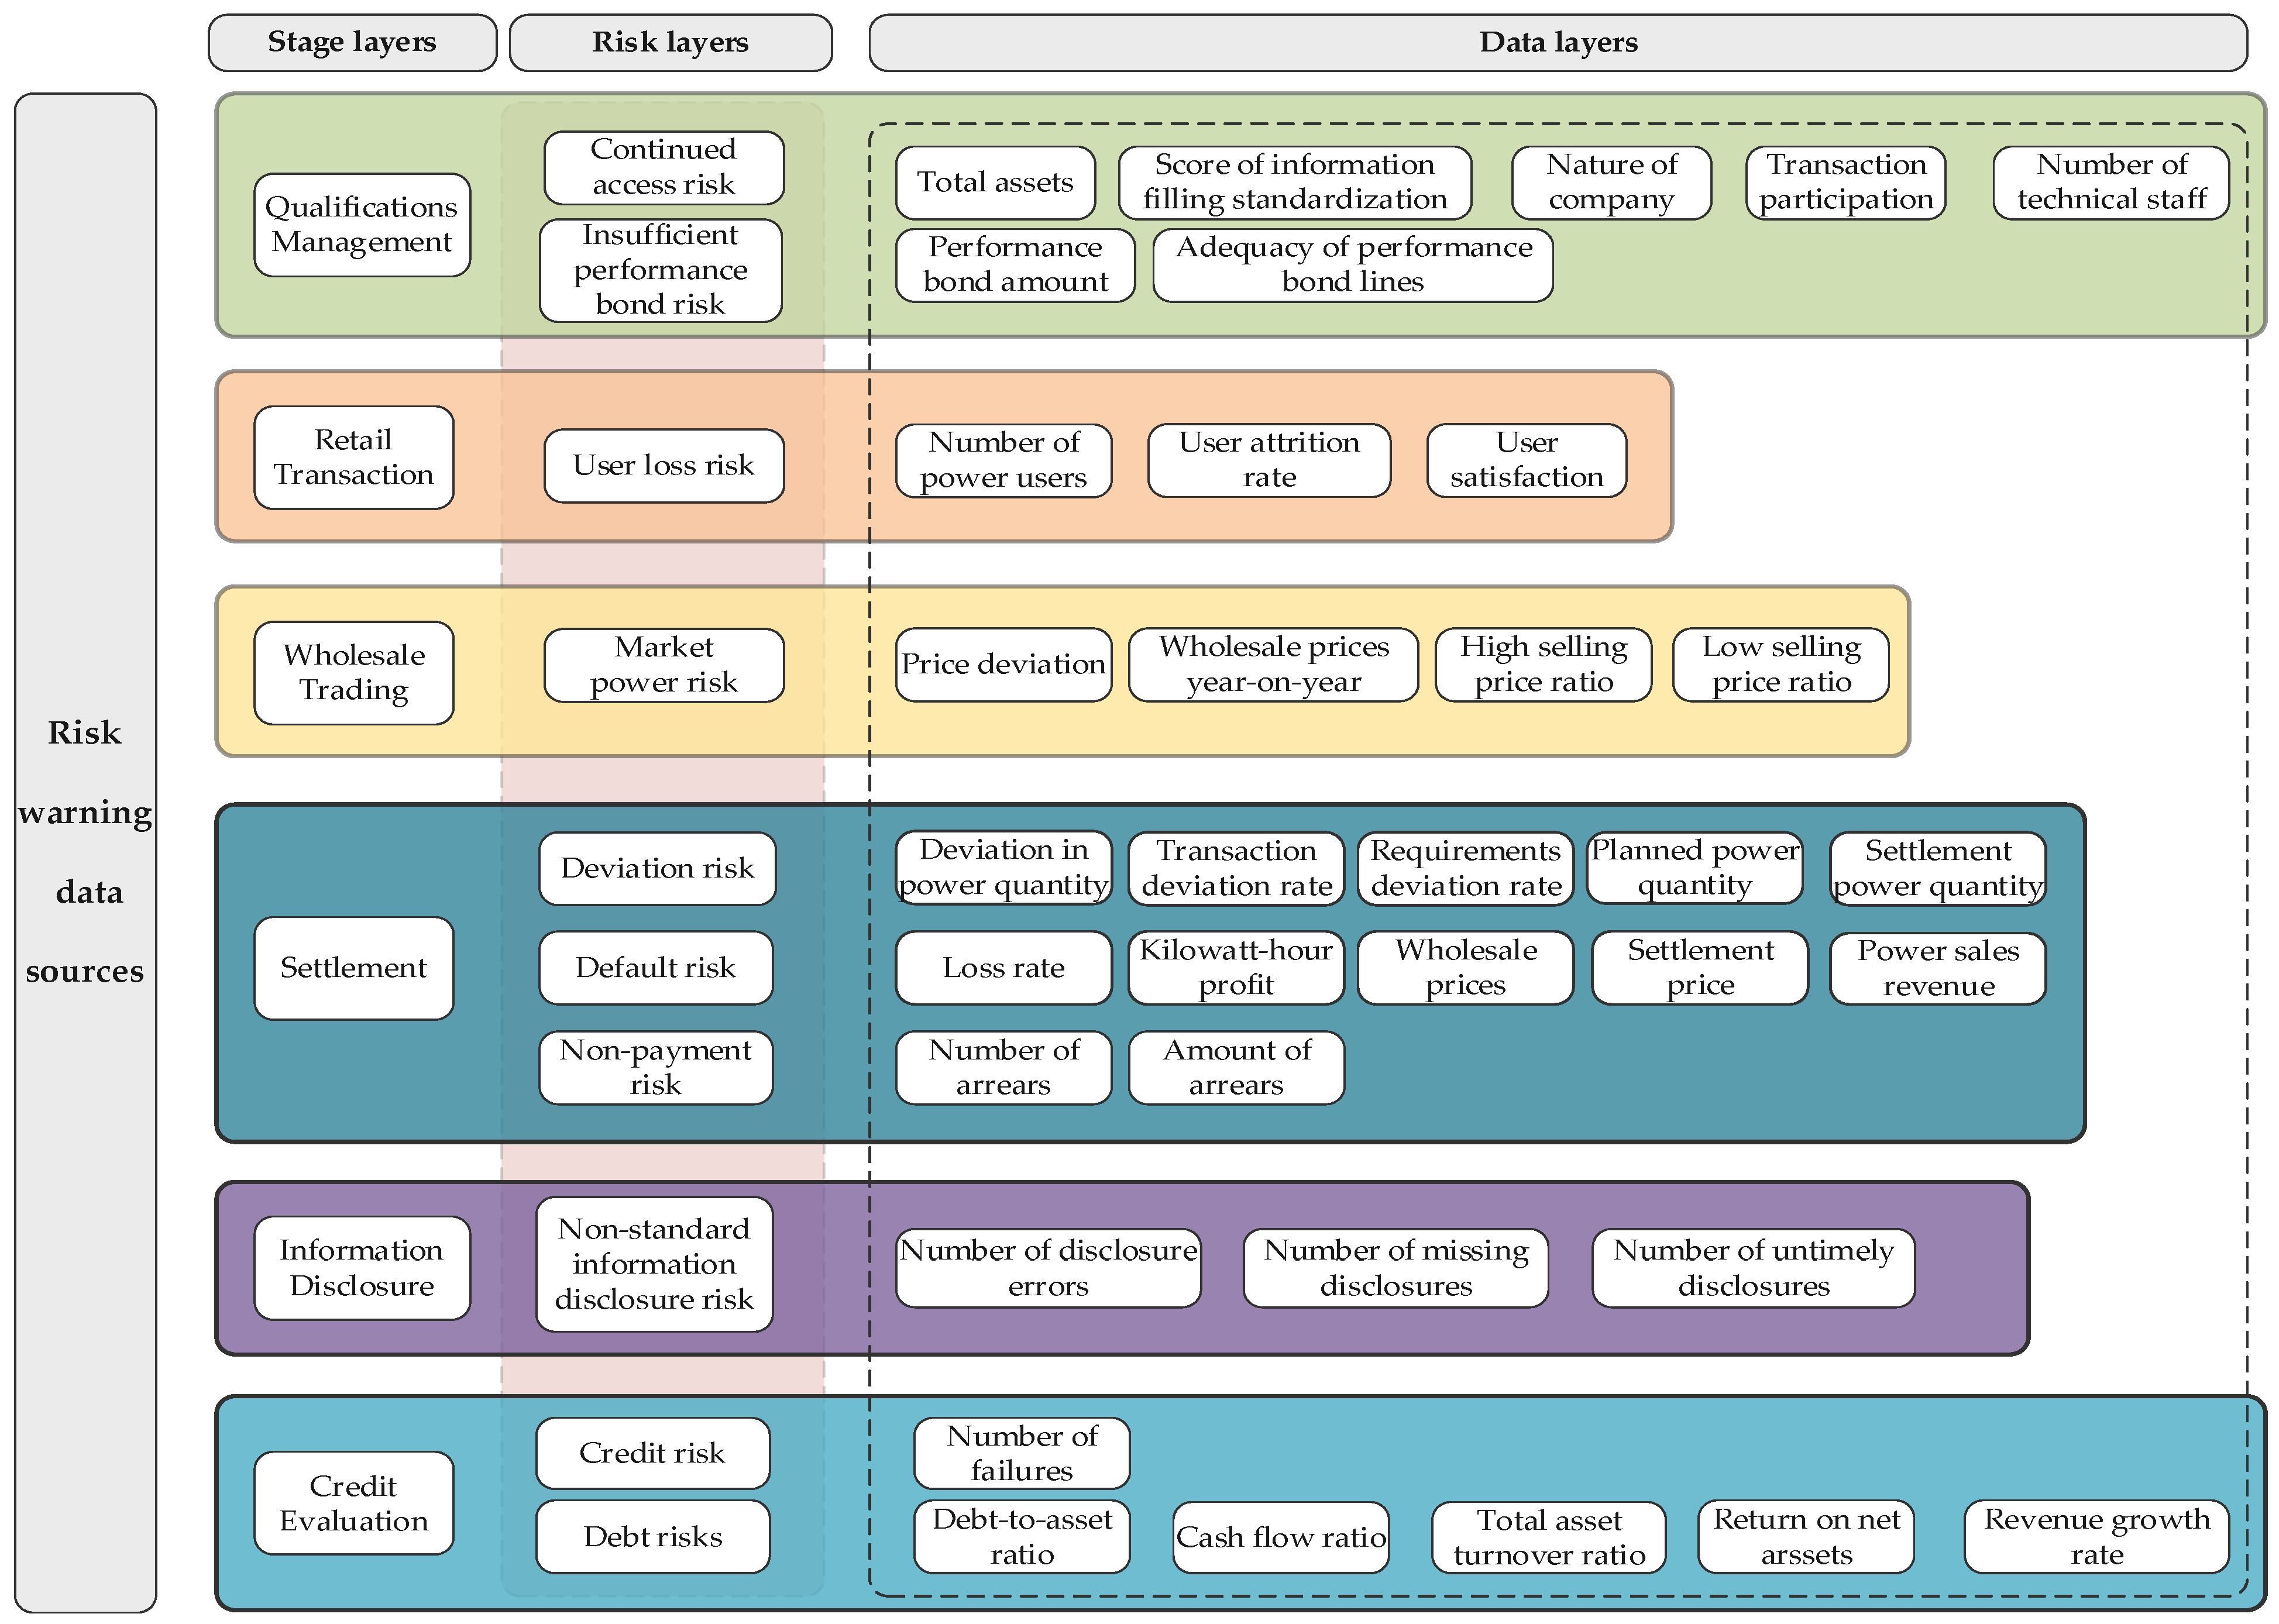
Based on the data relevance of the whole business process, this method analyzes the risk factor clusters throughout the whole process. Risk warning data sources for electricity sales companies are identified from the Qualifications Management, Retail Transaction, Wholesale Trading, Settlement, Information Disclosure, and Credit Evaluation processes to improve comprehensiveness.
(2)
The key elements of risk assessment are refined using PCA, and DPC-SSA is applied for adaptive clustering and automatic classification of risk warning levels based on historical business data. The stacking model is employed to implement dynamic risk early warning for electricity sales companies. This method enables the scientific management and control of risks generated by electricity sales companies, reduces losses from potential risks, im-proves the stability and reliability of the electricity market, and fosters a more favorable business environment for market participants. This method ensures that electricity sales companies can participate sustainably in the electricity market.

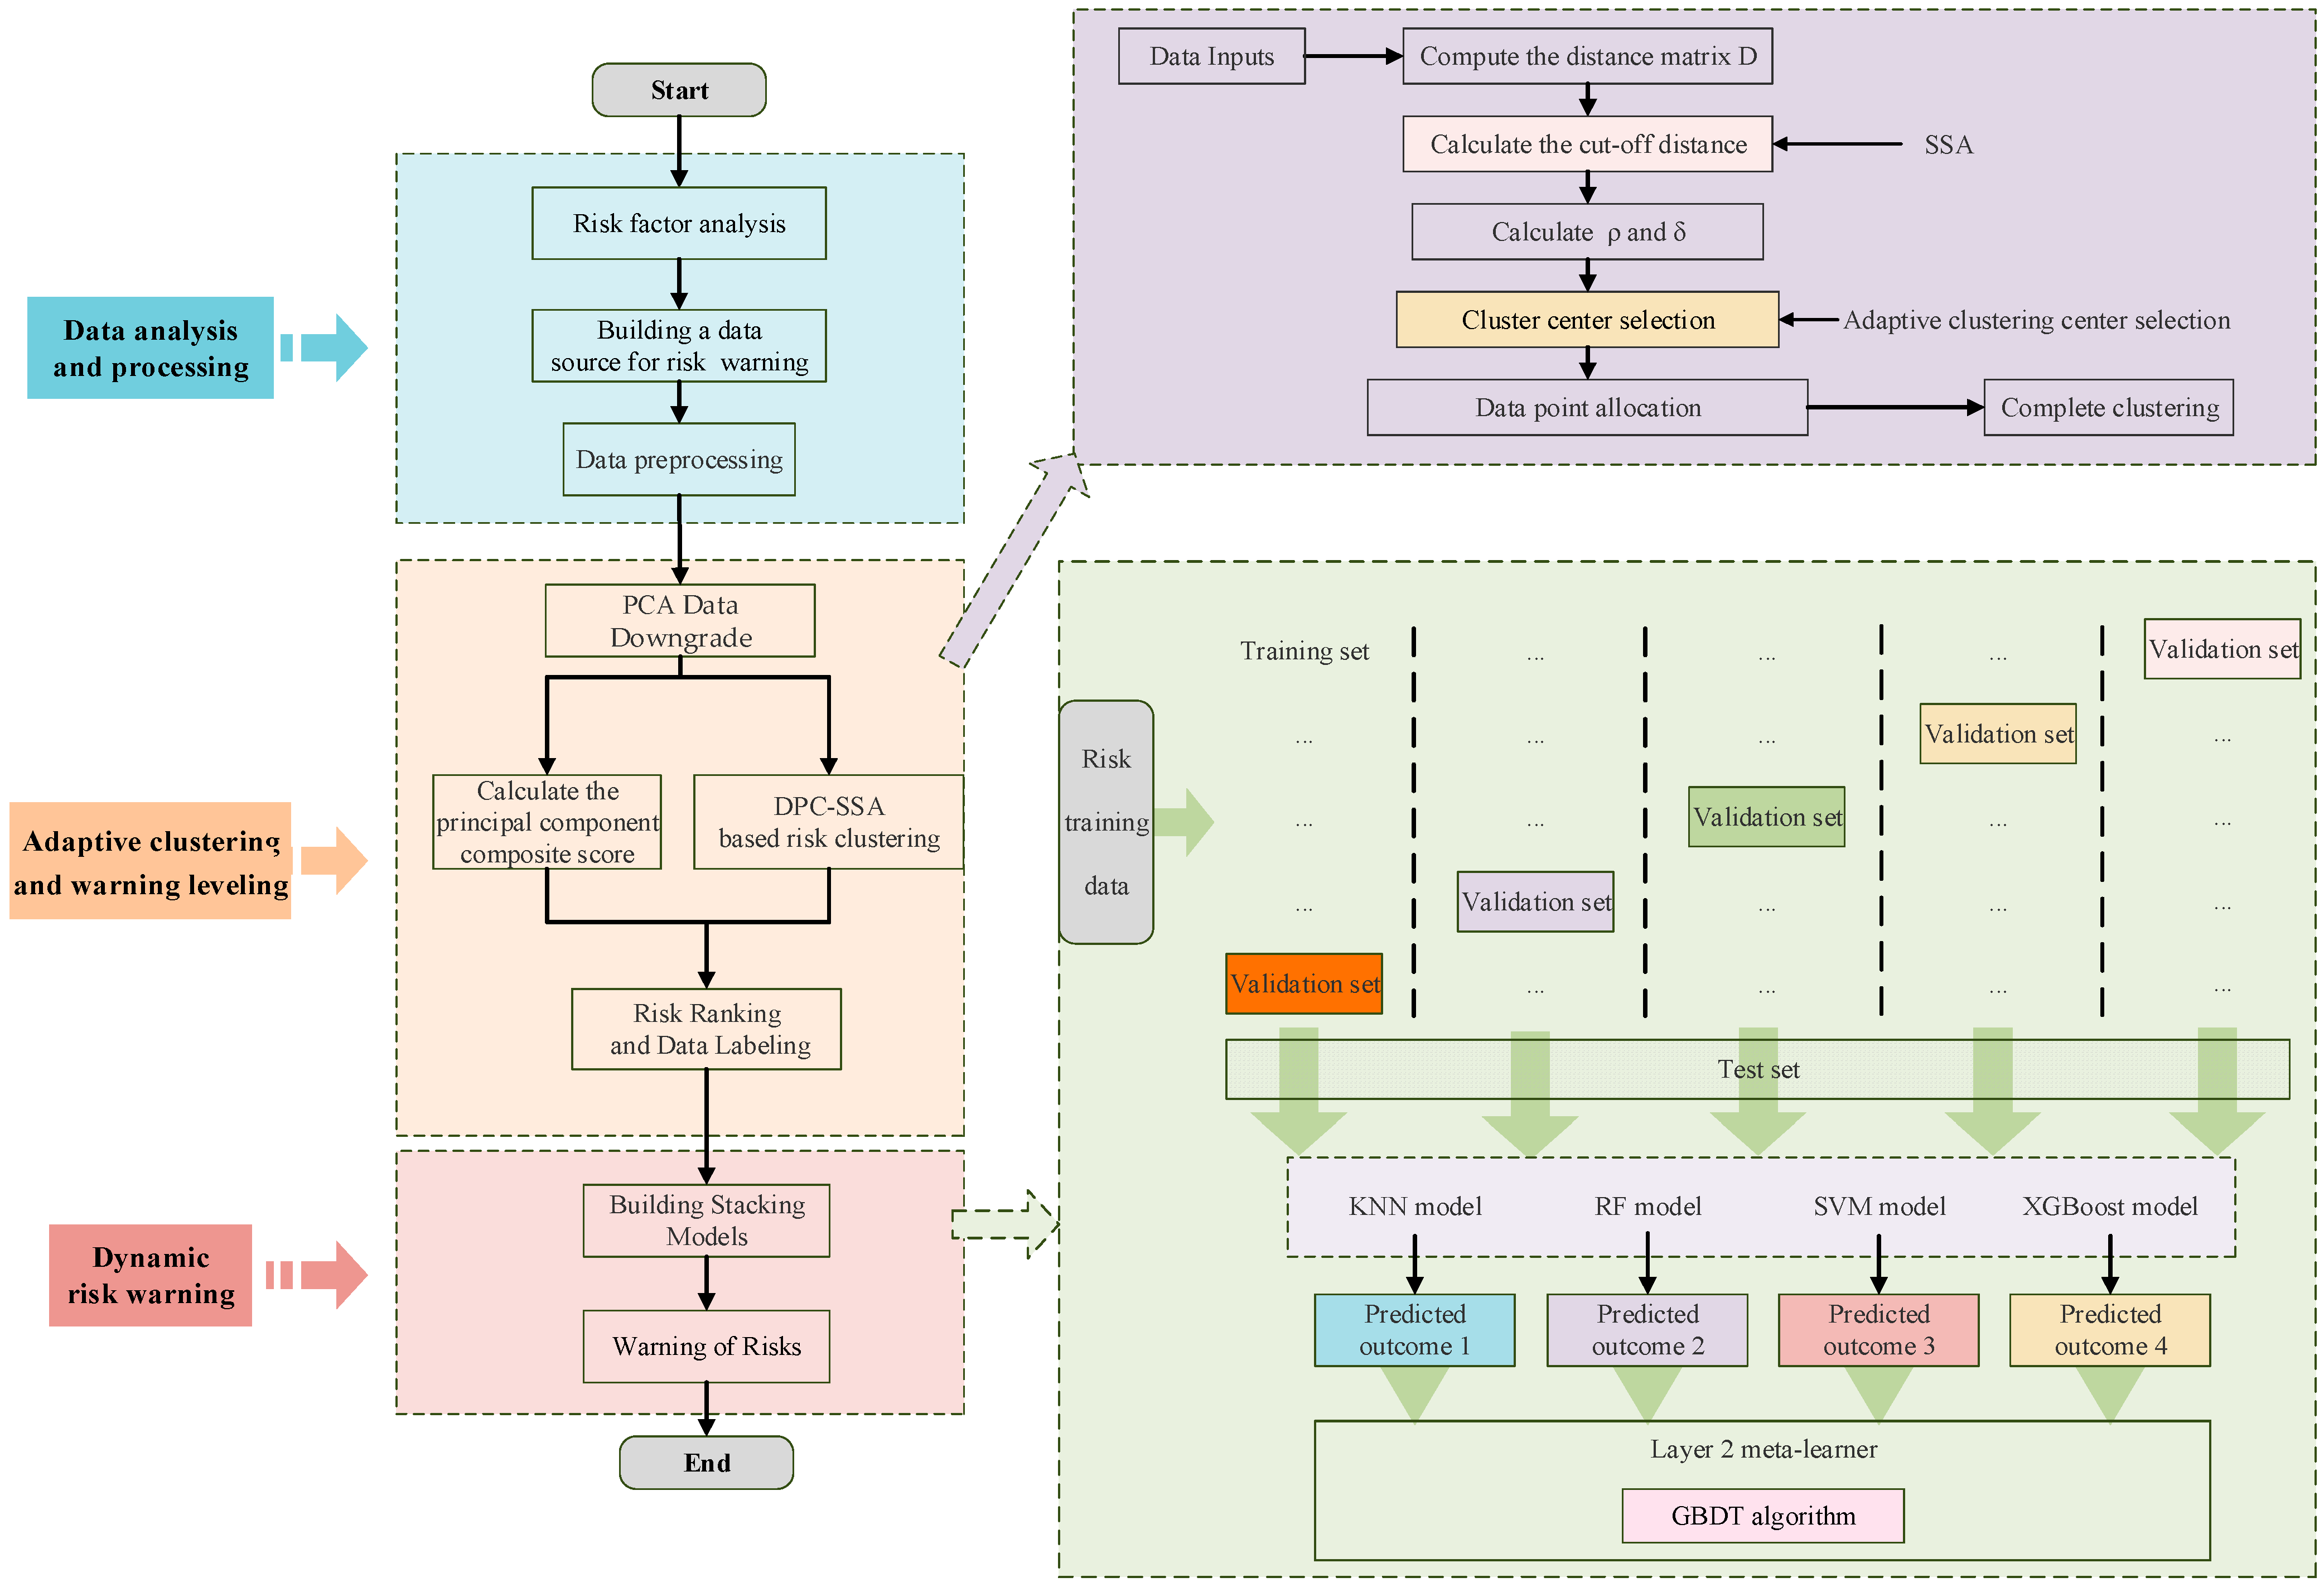
2. Design of Risk Warning Method for Electricity Sales Companies

The framework of the risk warning method for electricity sales companies, based on complete power sales data, is illustrated in Figure 1. It consists of three modules: data analysis and processing, adaptive clustering and risk level classification, and dynamic risk warning.

2.1. Data Analysis and Processing

First, data correlation analysis is conducted across all aspects of the electricity sales process to mine risk-related data elements and construct a data structure for risk identification. Considering the heterogeneity and volume differences of data sources, data standardization is applied:
X = x x min x max x min
where X represents the standardized indicator data, and x max and x min represent the maximum and minimum values of the indicator data, respectively.
Simultaneously, to achieve risk level classification, negative data indicators are processed for alignment:
X i j = M j x i j
where X i j represents the aligned data, M j represents the maximum value of the j-th indicator, and x i j denotes the i-th feature value of the j-th sample.

2.2. Adaptive Clustering and Risk Warning Level Classification

High-dimensional data are extracted using PCA, and the DPC-SSA algorithm is applied for adaptive clustering of the reduced-dimensional data. This result, combined with integrated principal component scores, classifies the clusters into risk levels and labels the risk data.

2.3. Dynamic Risk Warning

A stacking model is constructed using automatically labeled historical data as training samples to implement dynamic risk warnings for electricity sales companies.

3. Data Analysis and Processing

3.1. Analysis of Risk Factors in the Whole Process

To identify potential risk factors, it is essential to examine the business processes of electricity sales companies. This paper categorizes the electricity sales business process into six stages: qualification management, retail transactions, wholesale transactions, settlement, information disclosure, and credit evaluation, as shown in Figure 2.
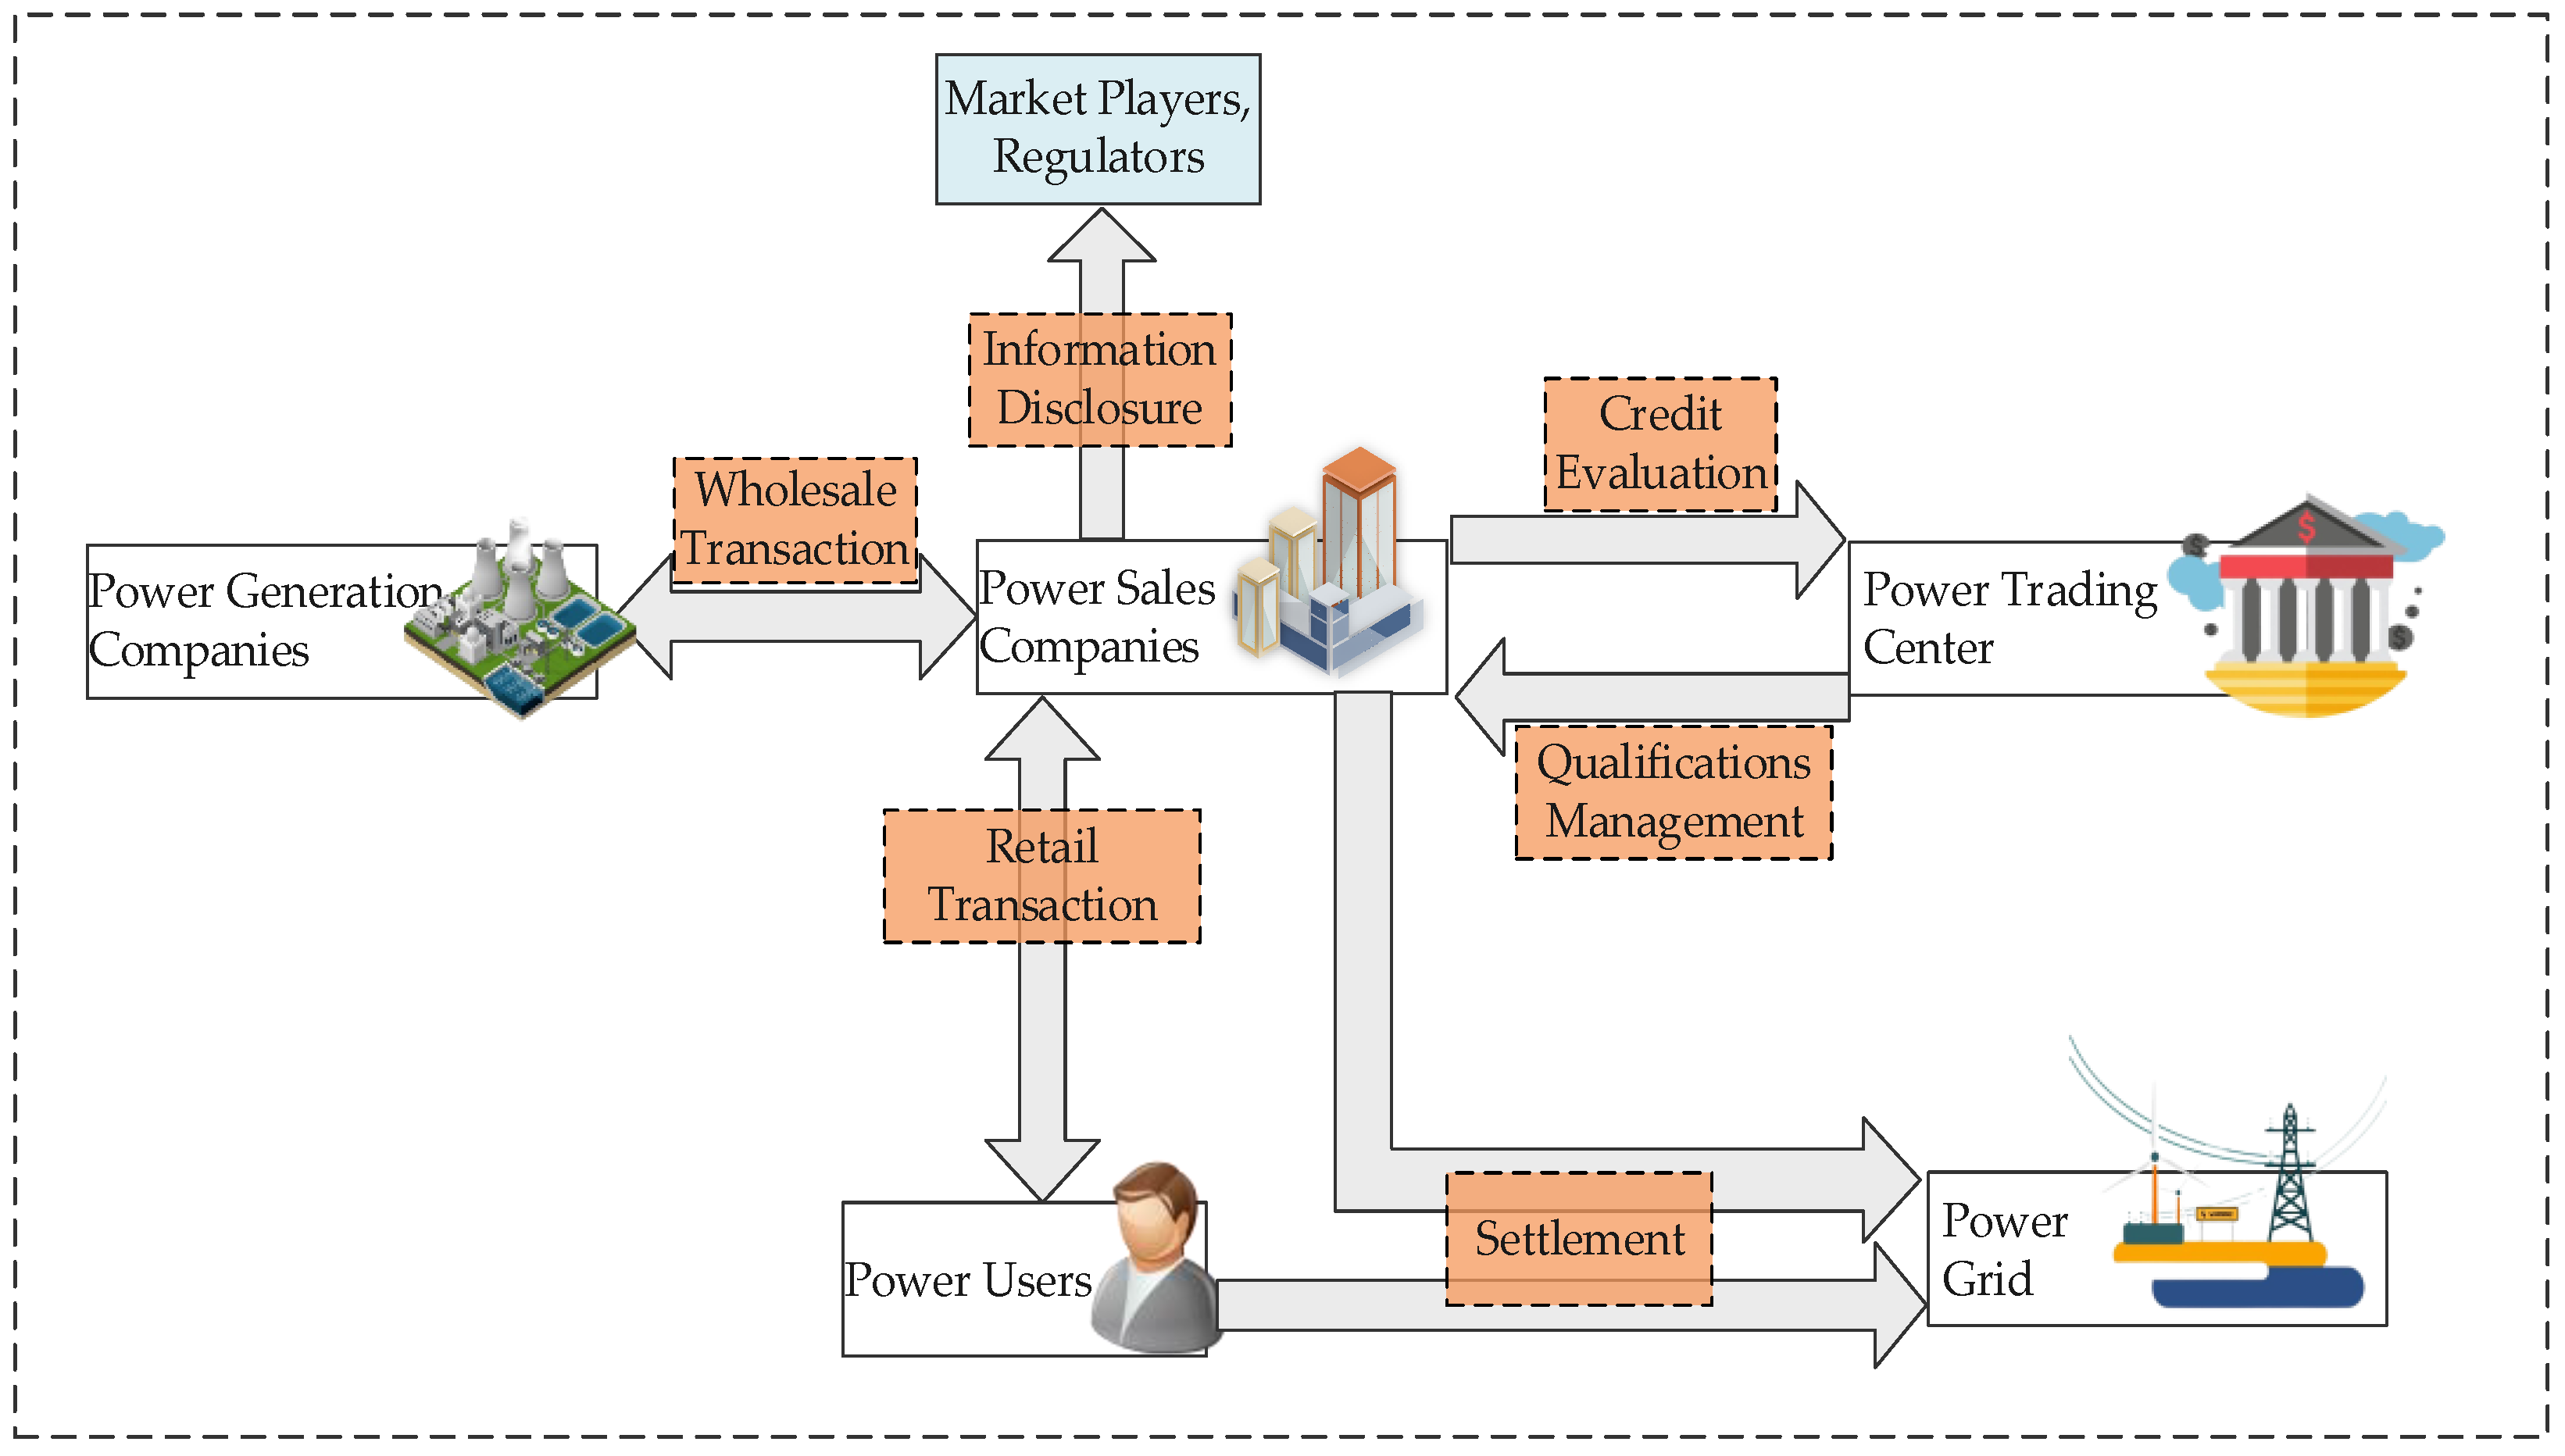
  • Qualification Management Stage [38]. In this stage, third-party organizations review an electricity sales company’s eligibility, technical staffing, and performance bond in accordance with the “Regulations on the Management of Electricity Sales Companies”. Requirements for market entry, technical staffing, and performance bond indicate the company’s profitability and risk resilience to a certain extent.
  • Retail Transaction Stage. In this stage, the electricity sales company enters agency purchase contracts with power users. Metrics such as the number of power users, user churn rate, and user satisfaction reflect the service quality and competitiveness of the electricity sales company.
  • Wholesale Transaction Stage. During wholesale transactions, an electricity sales company’s purchasing behavior reflects whether it leverages market power for improper benefits, impacting transaction stability and security.
  • Settlement Stage. Upon transaction completion, the power trading center performs settlement calculations and assesses the company’s deviations. The company’s deviation and profit-loss status indicate its technical strength and operational capability [39].
  • Information Disclosure Stage. Beyond regular transactions, the electricity sales company must disclose its operational, financial, and pricing information. The frequency of disclosure errors, omissions, and delays reflects the company’s level of responsibility to a certain extent.
  • Credit Evaluation Stage. In this stage, the power trading center evaluates the electricity sales company’s credit status and financial condition, indicating its creditworthiness and financial health.

3.2. Construction of Risk Warning Data Source

After analyzing the risk factors of electricity sales companies, a risk warning data source is constructed to support subsequent risk warnings. As shown in Figure 3, the risk data source is divided into three layers: stage, risk, and data. The stage layer represents the entire business process of the electricity sales company, while the risk layer captures the associated risks within each stage. The data layer quantifies the risk layer and serves as the direct data source for risk warnings.

4. Adaptive Clustering and Risk Level Classification

The DPC-SSA algorithm is used to cluster historical data after dimensionality reduction, combined with the principal component composite score to enable automatic classification and data labeling of risk warning levels for the electricity sales company. The steps for adaptive clustering and risk level classification with the DPC-SSA algorithm are illustrated in Figure 4.

4.1. Principal Component Analysis

PCA is a multivariate statistical technique that combines multiple correlated indicators into a set of uncorrelated composite indicators [40]. PCA is used to identify key risk indicators for power sales, remove redundant information, and improve the stacking model’s performance. The main steps of PCA are as follows:
(1)
Preprocess the dataset X to eliminate the effects of dimensionality.
(2)
Calculate the covariance matrix V:
V = 1 n X ¯ X ¯ T
(3)
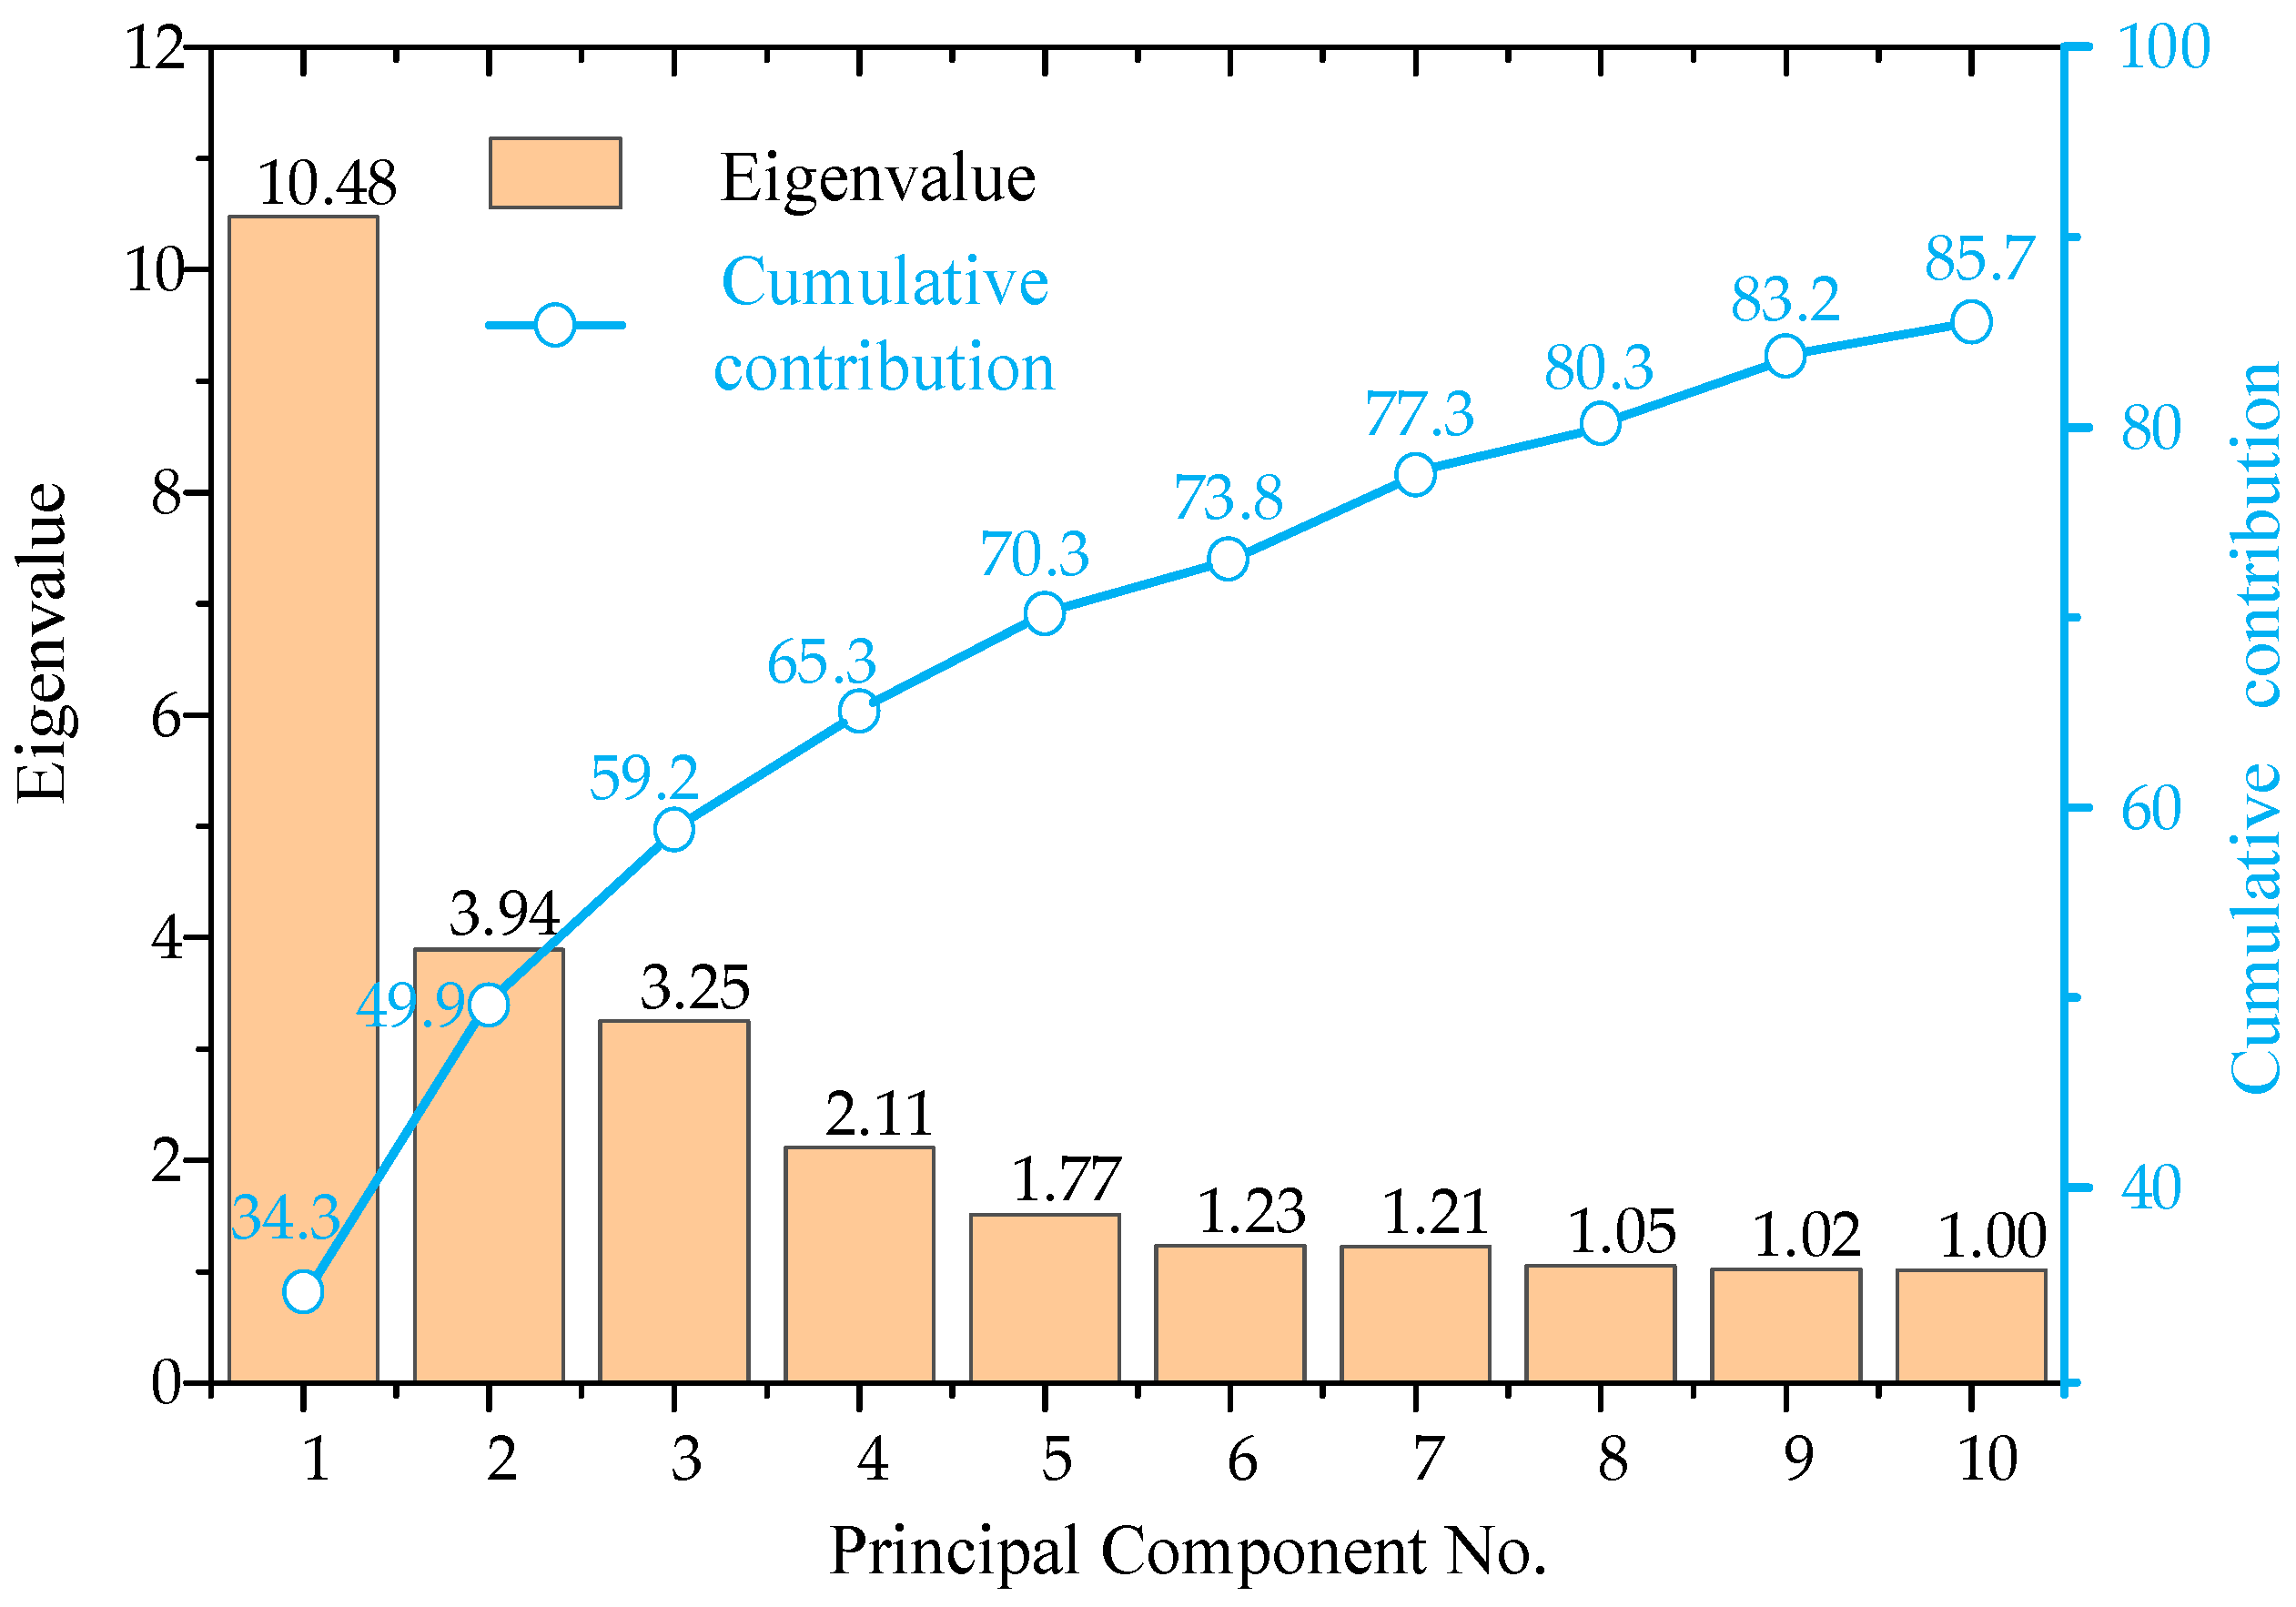
Perform eigen decomposition on the covariance matrix to compute the eigenvalues and corresponding eigenvectors w i , arrange the eigenvalues in descending order, and obtain the cumulative contribution rate λ.
(4)
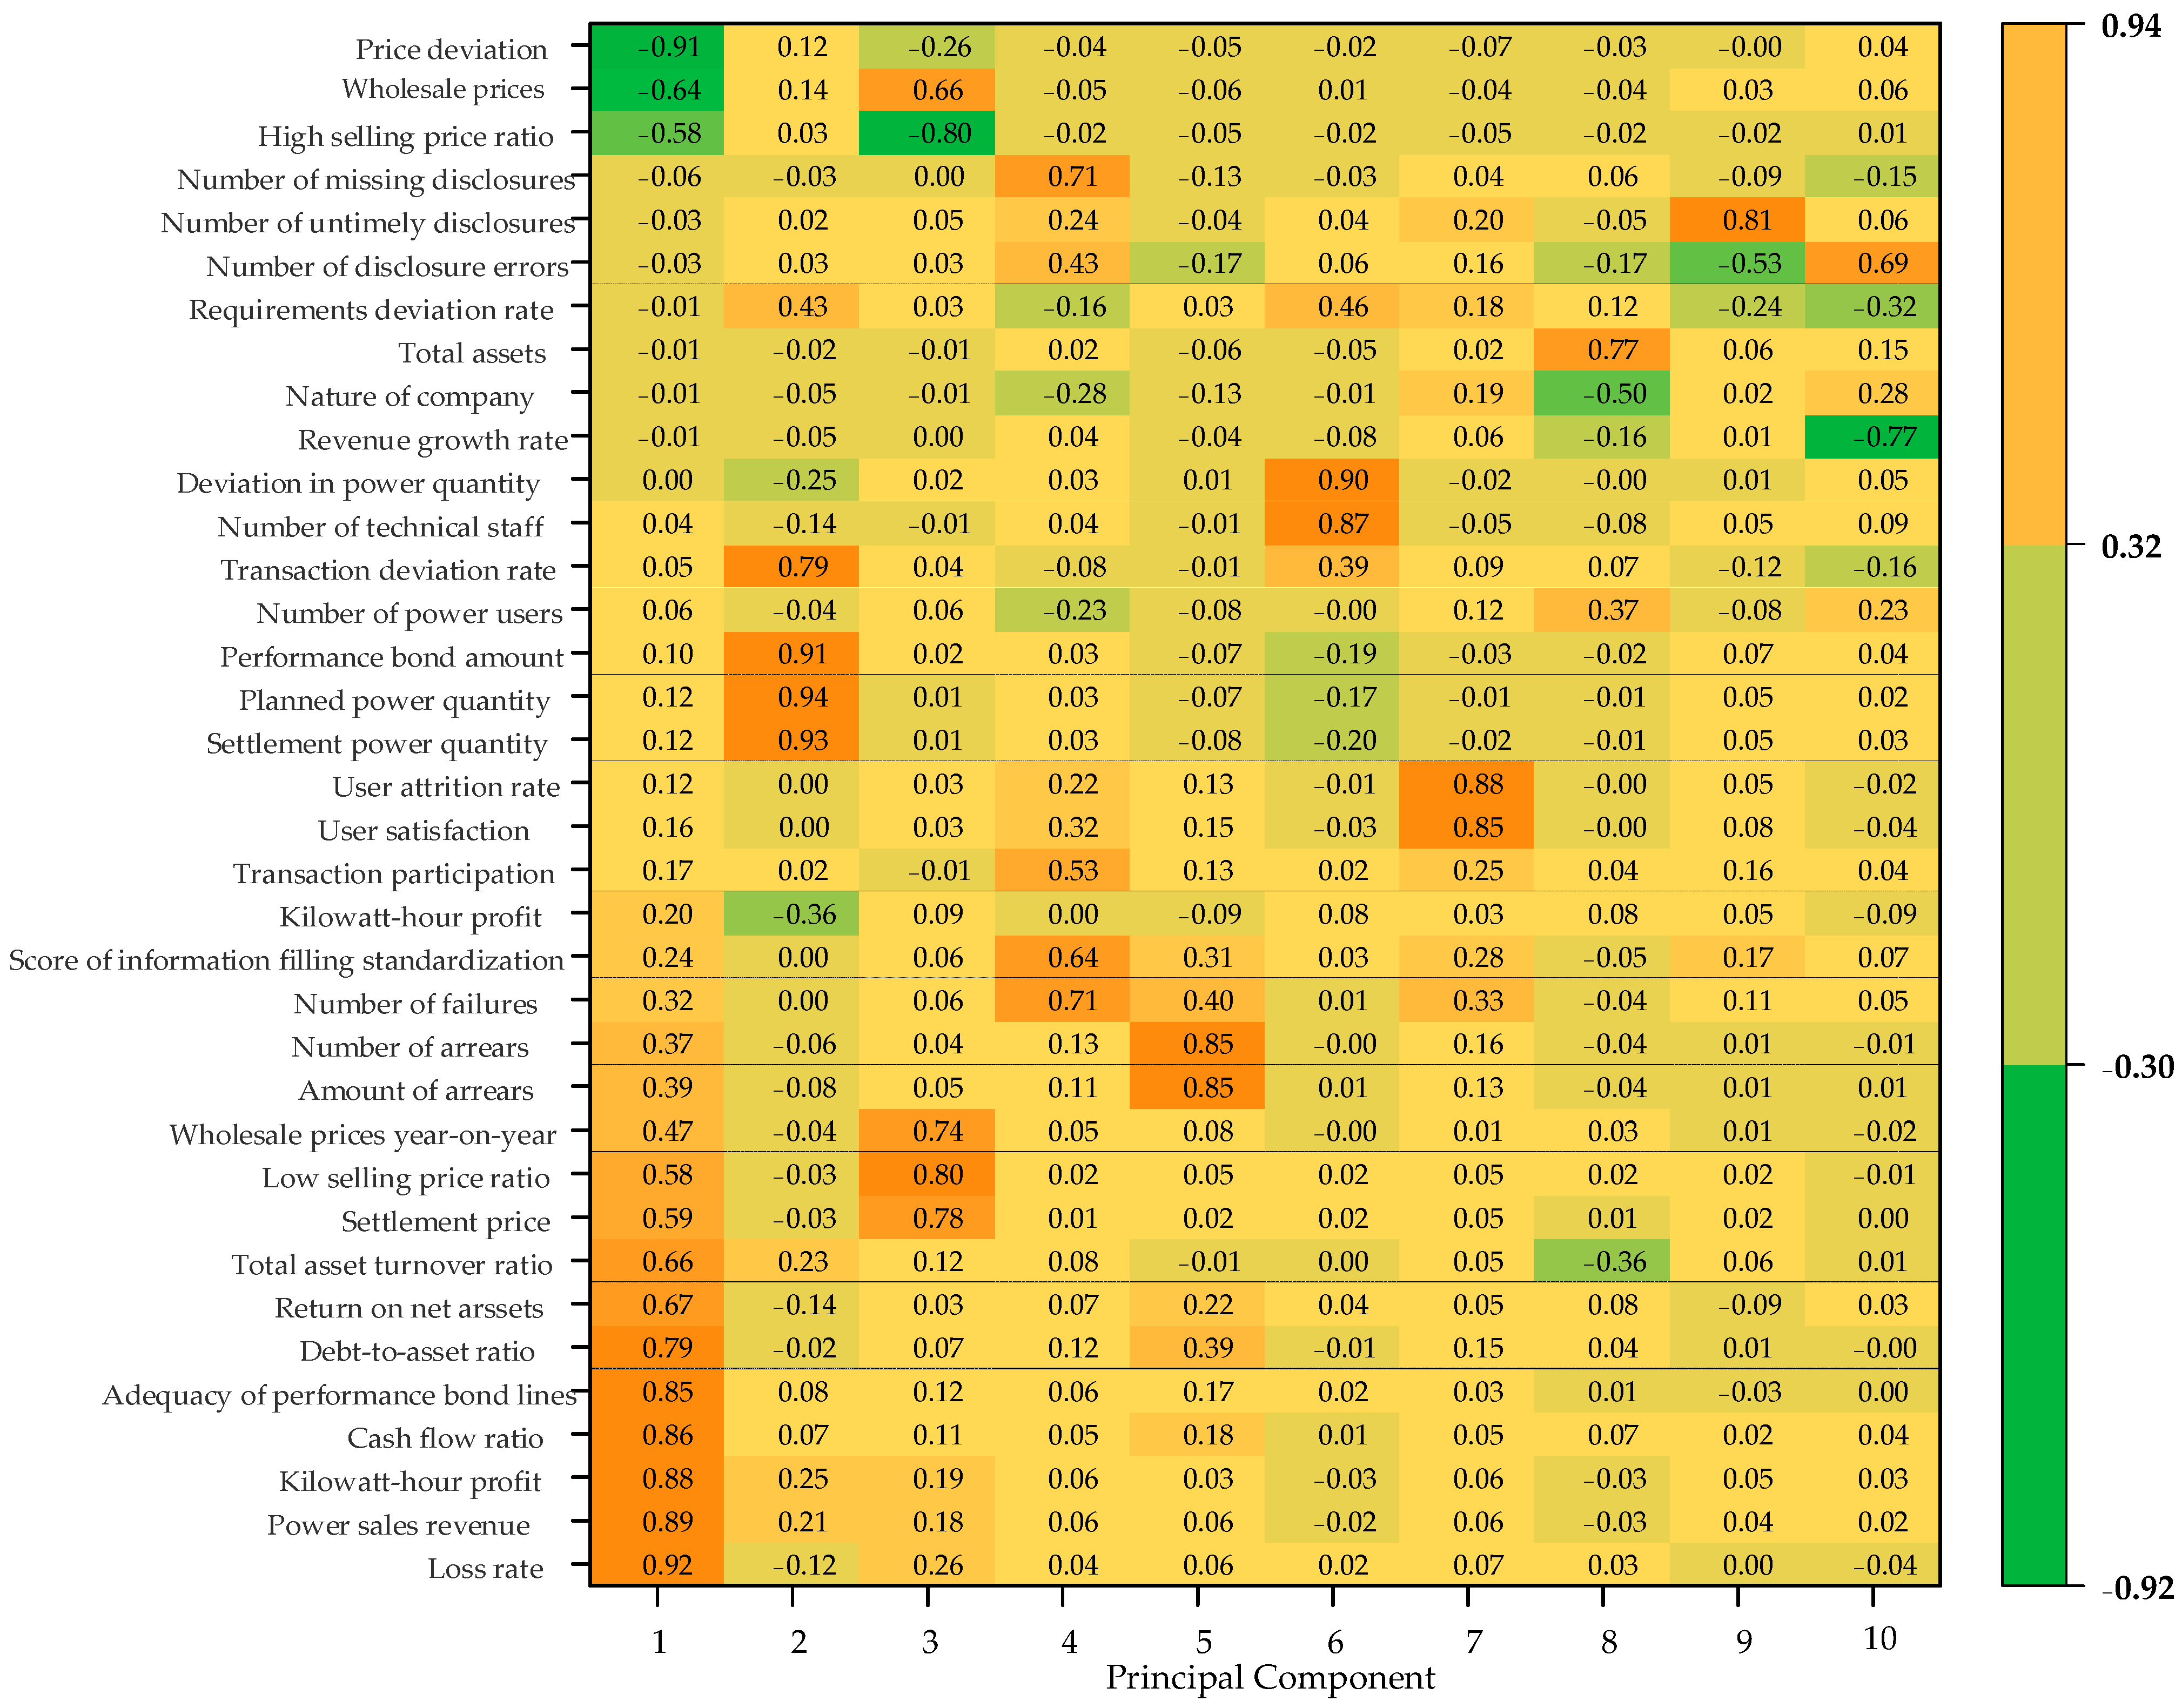
Based on the set cumulative contribution rate, select the top m eigenvalues and their corresponding eigenvectors W k , where the eigenvectors W k form the loading coefficient matrix. The extracted m principal components are denoted as F :
F = W k T X ¯ = F 1 , F 2 , F m
(5)
Calculate the composite score of principal components. The principal component score matrix is Y = X F , and the composite score is calculated as:
Z = Y ϕ = y 1 ϕ 1 + y 2 ϕ 2 + y m ϕ m
where ϕ is the weight vector after normalizing the contribution rate.

4.2. DPC-SSA Algorithm

The traditional Density Peak Clustering (DPC) algorithm can automatically identify density peaks in the data and cluster data around these peaks [41,42]. It is characterized by a simple principle, few parameters, and no need for iteration, allowing it to identify clusters of various shapes and sizes. However, the truncation distance parameter d c and selection of cluster centers must be manually chosen, introducing subjectivity [43].
To address this, this paper proposes the DPC-SSA clustering algorithm, which uses the Sparrow Search Algorithm (SSA) to conduct a global search for the truncation distance d c , reducing manual intervention and enhancing clustering accuracy. Additionally, an adaptive clustering center selection strategy determines the number of clusters and cluster centers. The process of the DPC-SSA clustering algorithm is shown in Figure 5.

4.2.1. Truncation Distance Optimization

The SSA is a swarm intelligence optimization algorithm inspired by simulating the foraging and anti-predation behaviors of sparrows [44]. Leveraging the SSA’s robust search optimization capabilities, it optimizes the truncation distance to achieve optimal clustering results.
During optimization, sparrow group discoverers decide whether to continue foraging or flee based on environmental safety. The position update formula for discoverers is as follows:
X i , j t + 1 = X i , j t exp i τ T max , R 2 < S T max X i , j t + Q L , R 2 > S T max
where t represents the current iteration, T max represents the maximum number of iterations, X i , j t is the position of the j-th dimension of the i-th sparrow, Q is a normally distributed random number, L is the unit matrix, τ is a random number in (0, 1], R 2 is the alert value within (0, 1), and S T max represents the safety value in [0.5, 1].
Followers adjust their positions by following the discoverers, and the position update formula for followers is:
X i , j t + 1 = Q exp X w o r s t t X i , j t i 2 , i > N 2 X p t + 1 + X i , j t X p t + 1 A + L , i < N 2
A + = A T ( A A T ) 1
where X w o r s t t represents the global worst position, X p t + 1 is the best-discovered position, N is the number of sparrows, and A is a matrix consisting of −1 and 1.
Some sparrows act as vigilantes, monitoring the foraging environment for threats. The position update formula for guards is:
X i , j t + 1 = X b e s t t + β X i , j t X b e s t t , f i > f g X i , j I + K X i , j t X w o r s t t ( f i f w ) + ε , f i = f g
where X b e s t t denotes the global best position, β is the step-size control parameter, K is a random number, ε is a very small value to prevent division by zero, f i represents the fitness value of the current sparrow individual, and f g and f w represent the fitness values of the best and worst sparrow individuals, respectively.

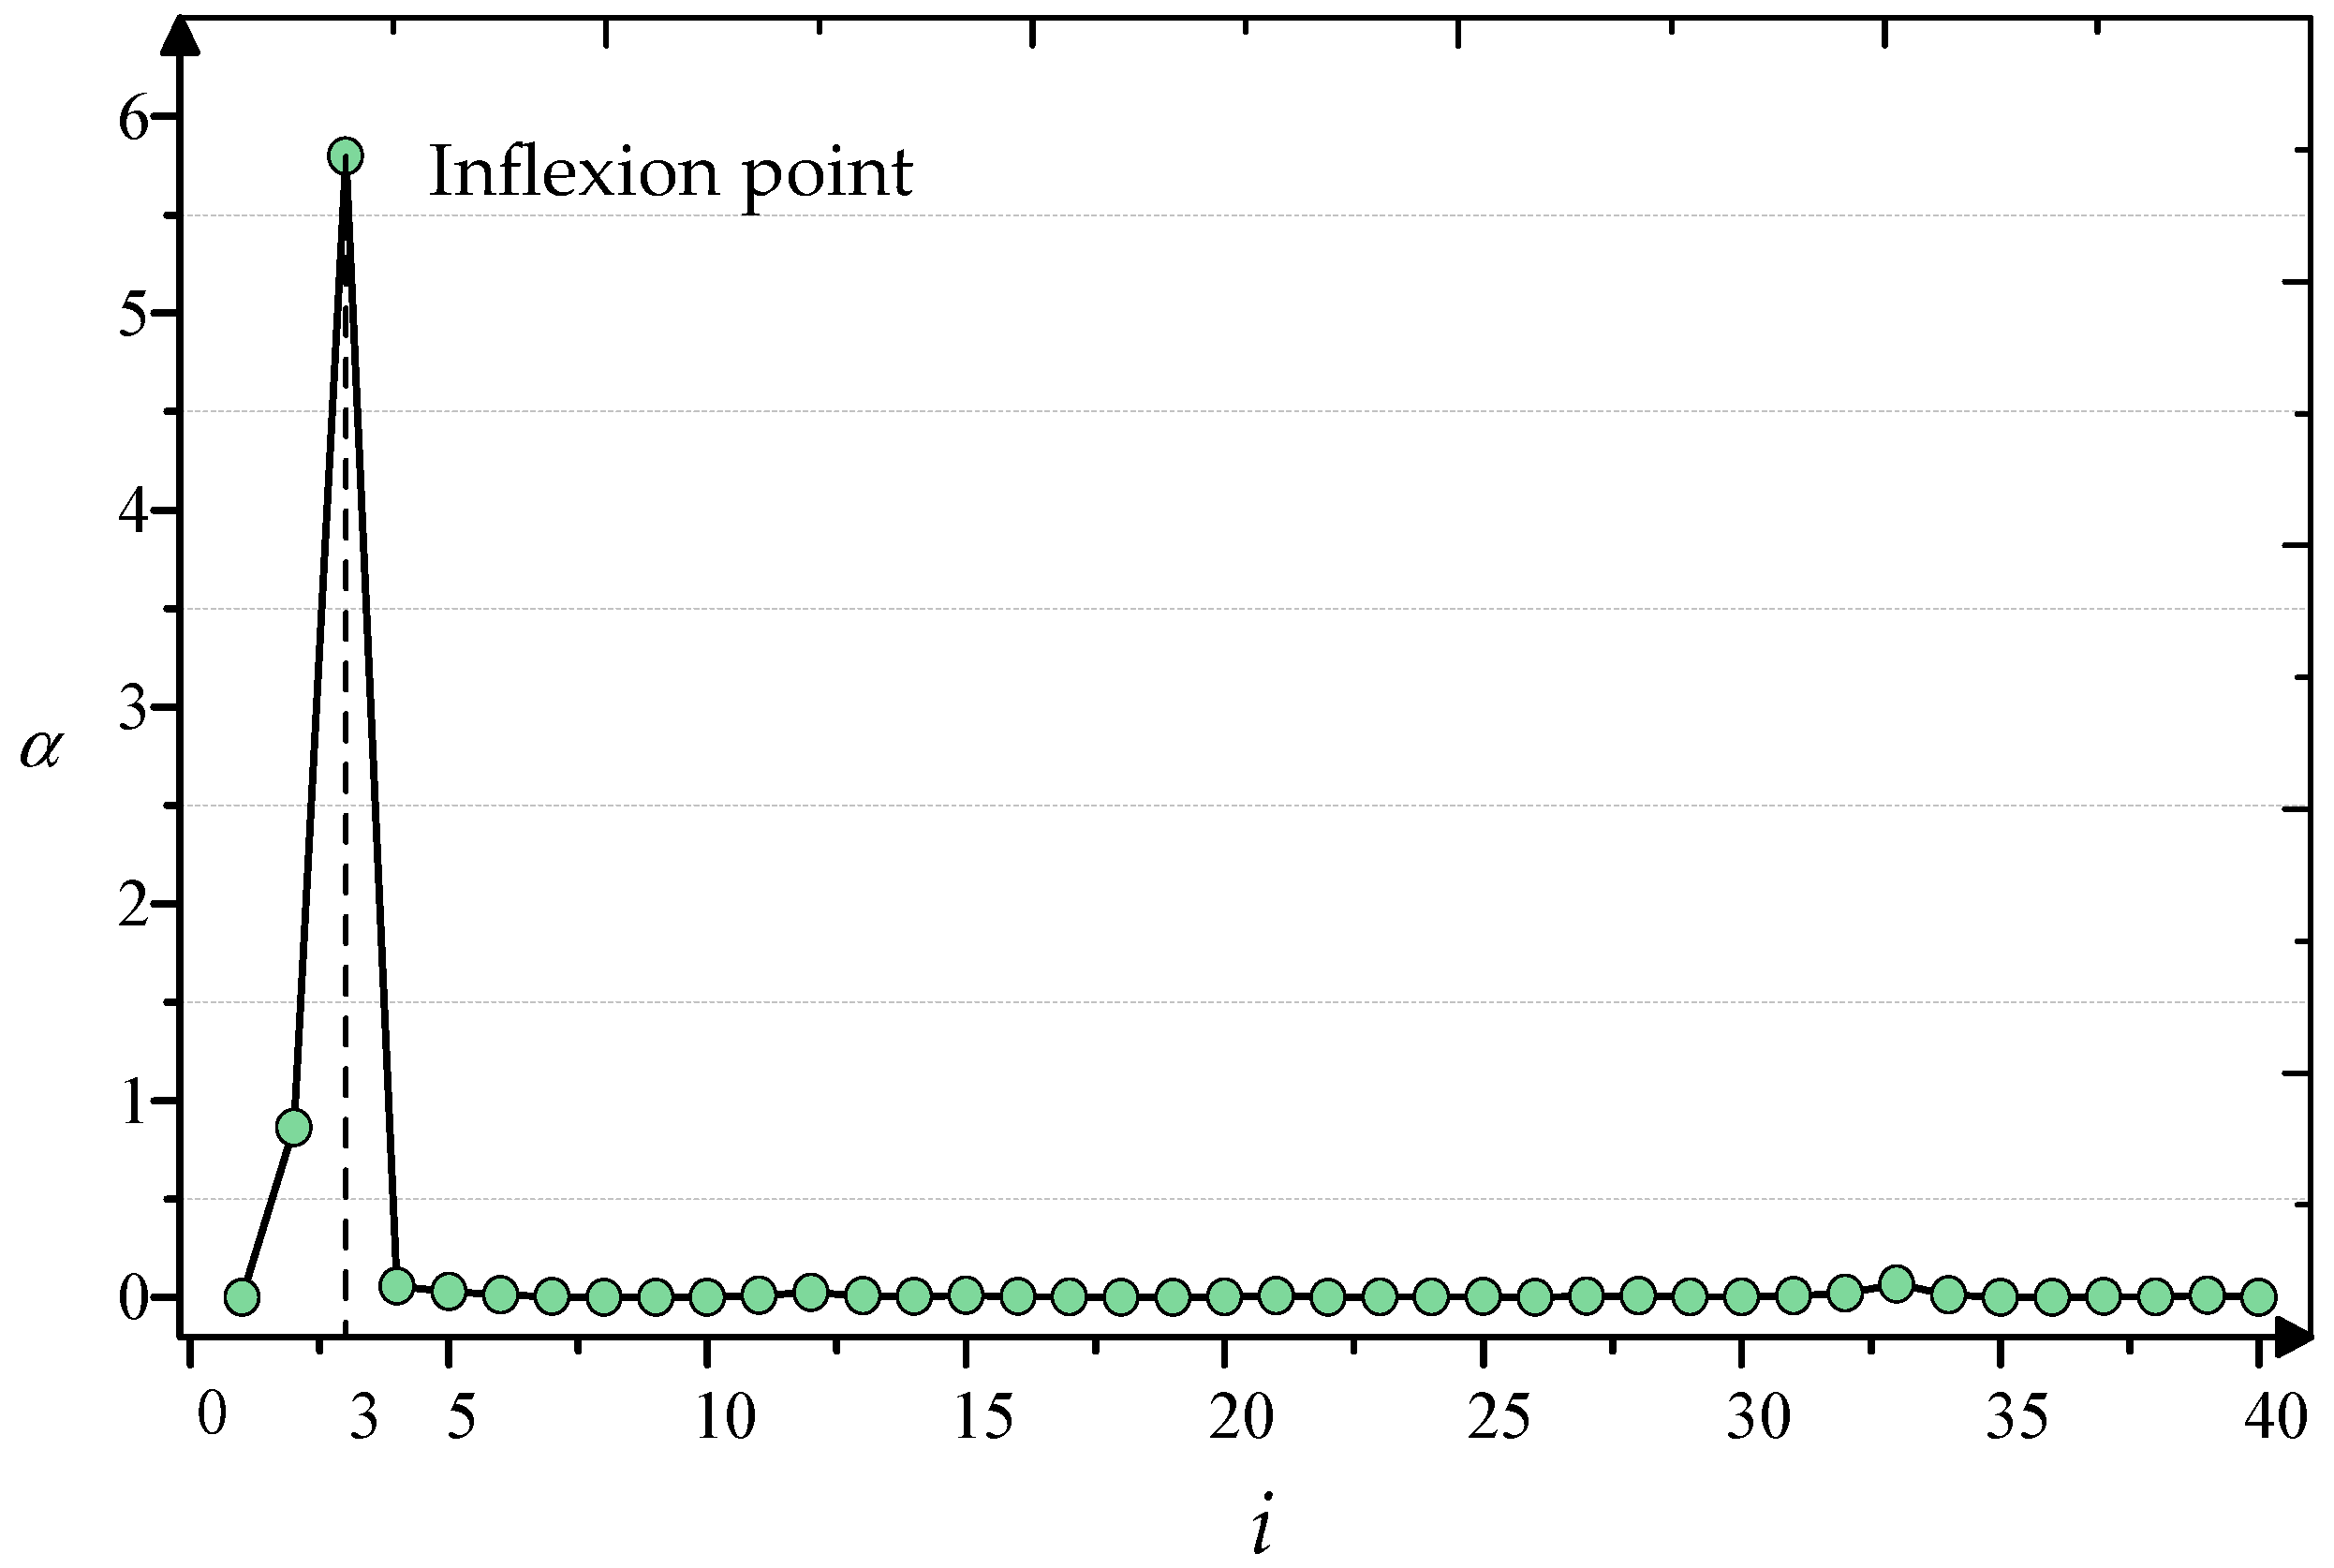
4.2.2. Adaptive Cluster Center Selection

To avoid the issues of multiple selection or omission in determining the cluster centers and numbers from decision graphs, this paper uses an adaptive cluster center selection strategy to determine the cluster centers and the number of clusters [45]. The following are the relevant definitions:
Definition 1.
The decision value  γ i  is the product of the relative distance  δ  and local density  ρ , calculated as follows:
γ i = ρ i δ i
where  i = 1 , 2 , n ,  n  is the number of sample points in the dataset.
Definition 2.
The values  γ i  are sorted in descending order, and the top  n  data points are selected. The change rate  k  indicates the trend of  γ i , and  k  is expressed as follows:
k i i + t = γ i + t γ i t
Definition 3.
The second-order rate of change  α  is used to represent the speed of the trend change of  γ i , characterizing how quickly  γ i  decreases:
α = k j u k i j
where  i = 1 ,  u = j + 1 , so  α = k j j + 1 / k 1 j ,  k 1 j  is the rate of change from the first data point to the j-th data point.  k j j + 1  represents the slope from the j-th data point to the next data point.
Definition 4.
An inflection point is a boundary between cluster centers and other points, where the second-order rate of change reaches its maximum among all data points, representing the critical point of the fastest overall trend change of the decision value.
X = arg max ( α ( i , j , u ) )
The data points corresponding to the j  γ -values before the inflection point are selected as cluster centers, with the number of cluster centers being j. This strategy is based on the fact that the decision value  γ i  of the clustering center and the non-clustering center differ greatly. By observing the  γ i  change trend, the boundary between cluster centers and non-cluster centers is identified when the change rate  γ i  transitions from rapid to gradual.

5. Construction of Risk Warning Model for Electricity Sales Companies

5.1. Stacking Model

The risk warning stacking model [46] constructed in this paper consists of two layers: base learners in the first layer and a meta-learner in the second layer. The original dataset is divided into equally sized sub-training sets, which are fed to the k base learners in the first layer to train and generate predictions. The second layer then uses the k outputs from the first layer as input data to train the meta-learner, which produces the final identification results. To reduce the risk of overfitting in the ensemble model, cross-validation is applied to the data.
(1)
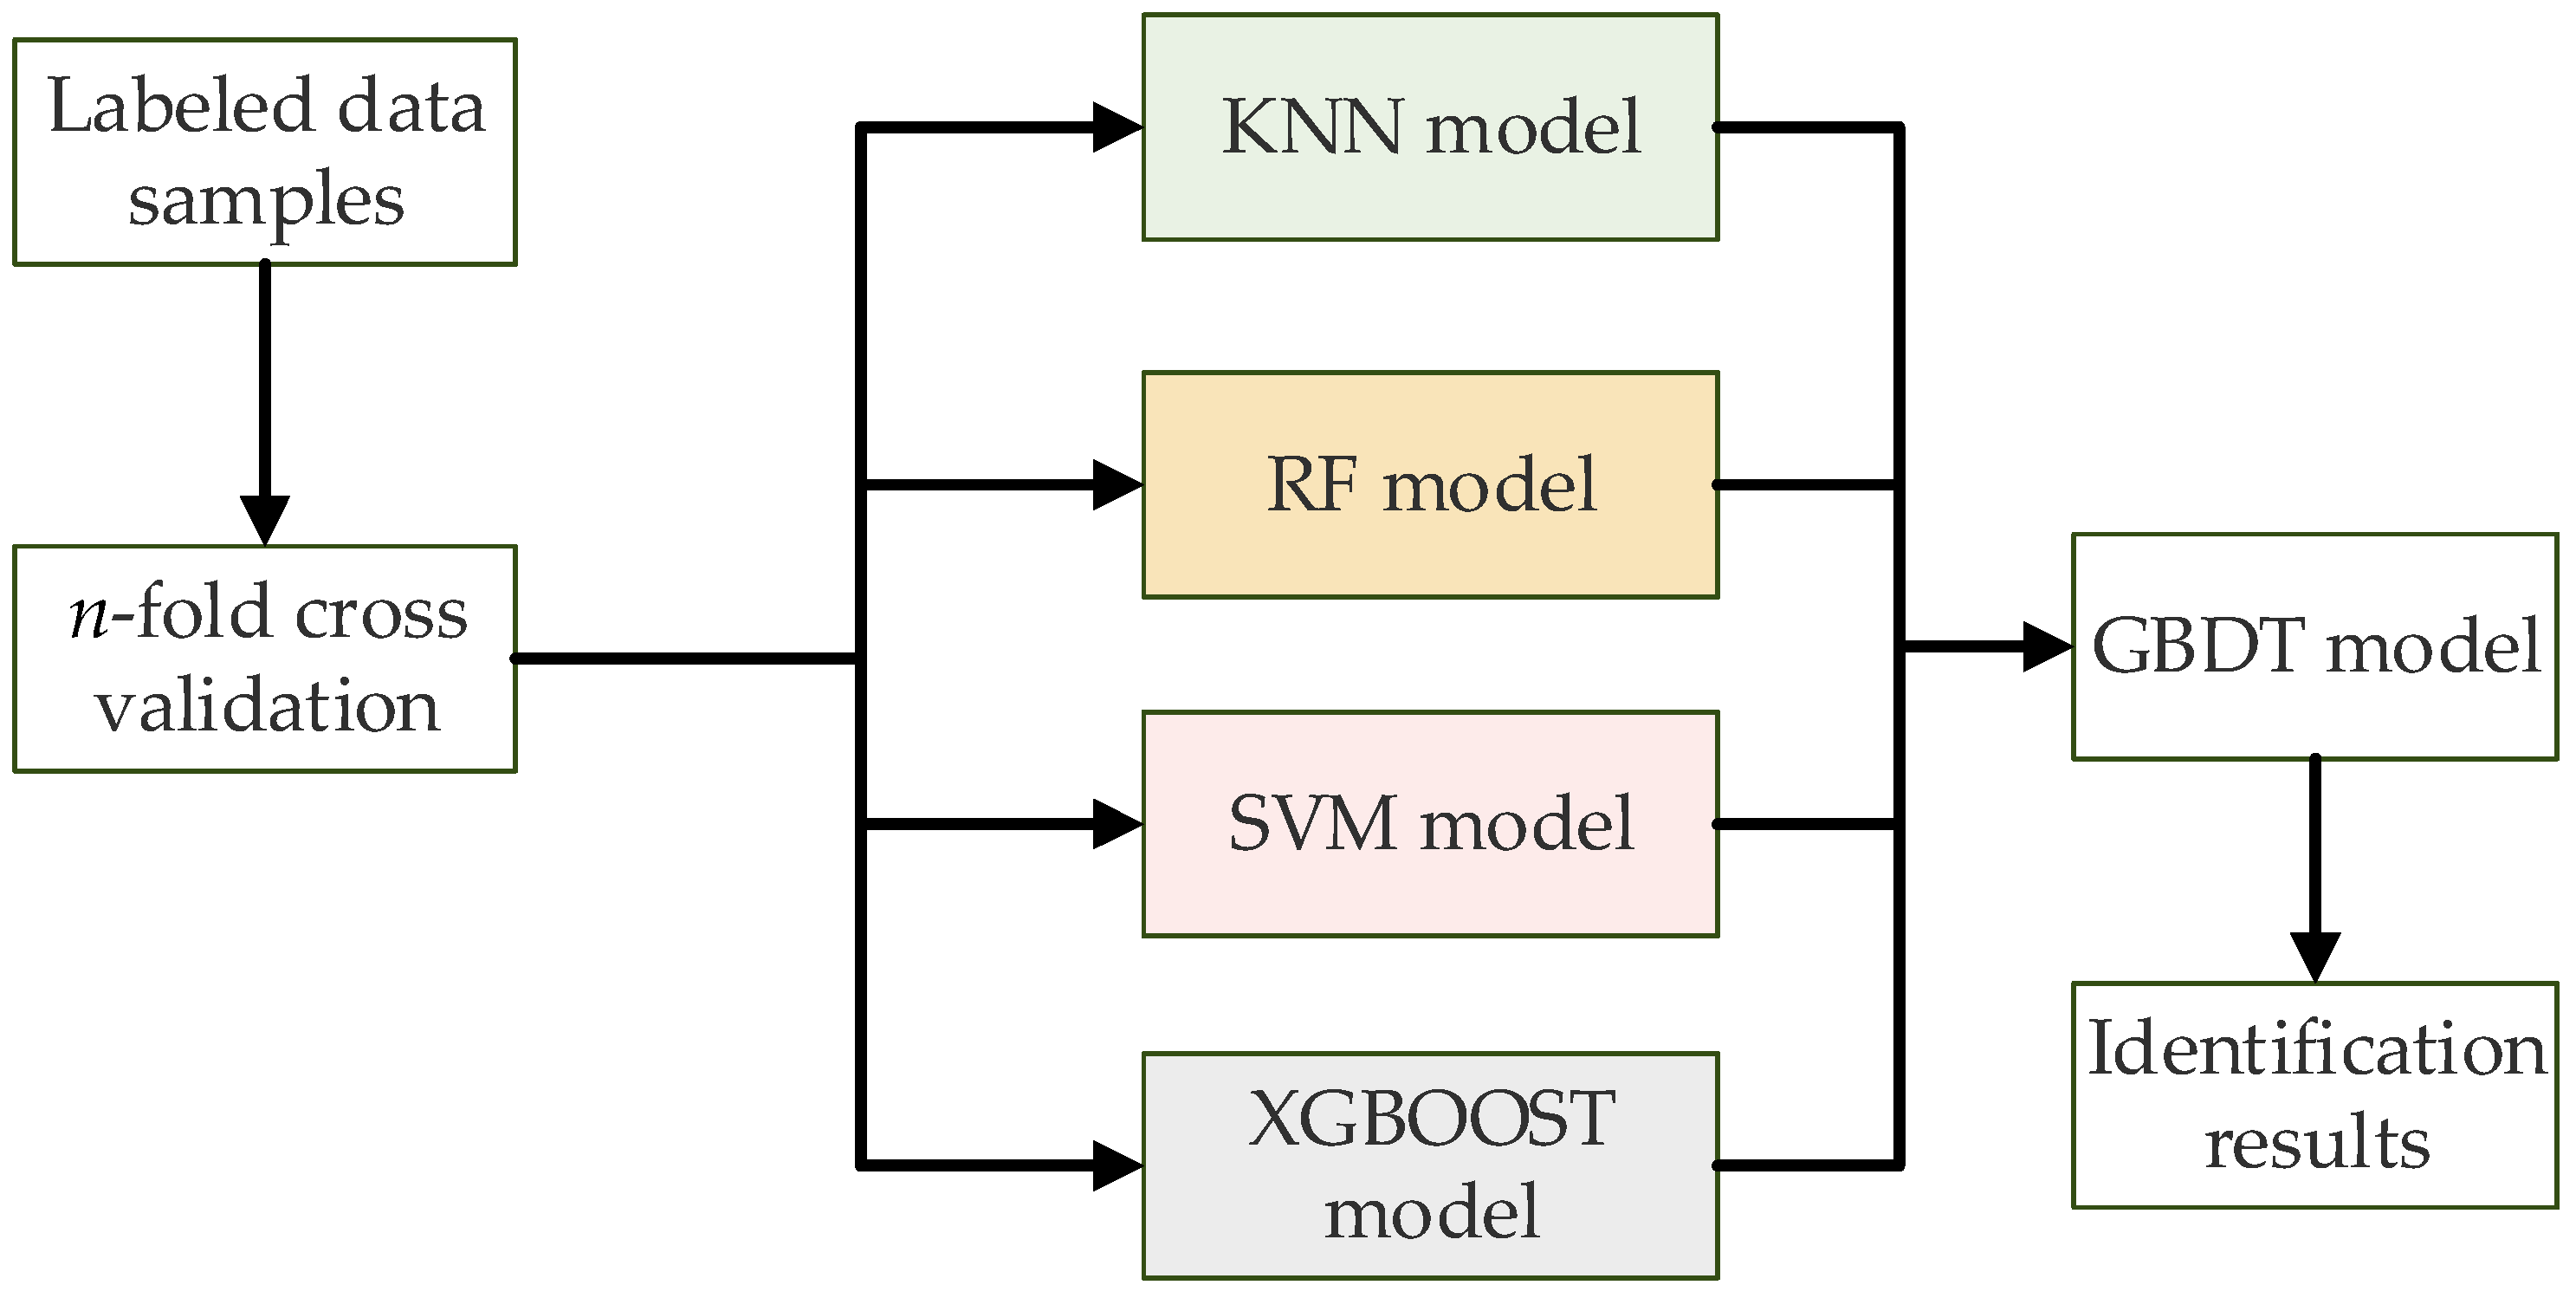
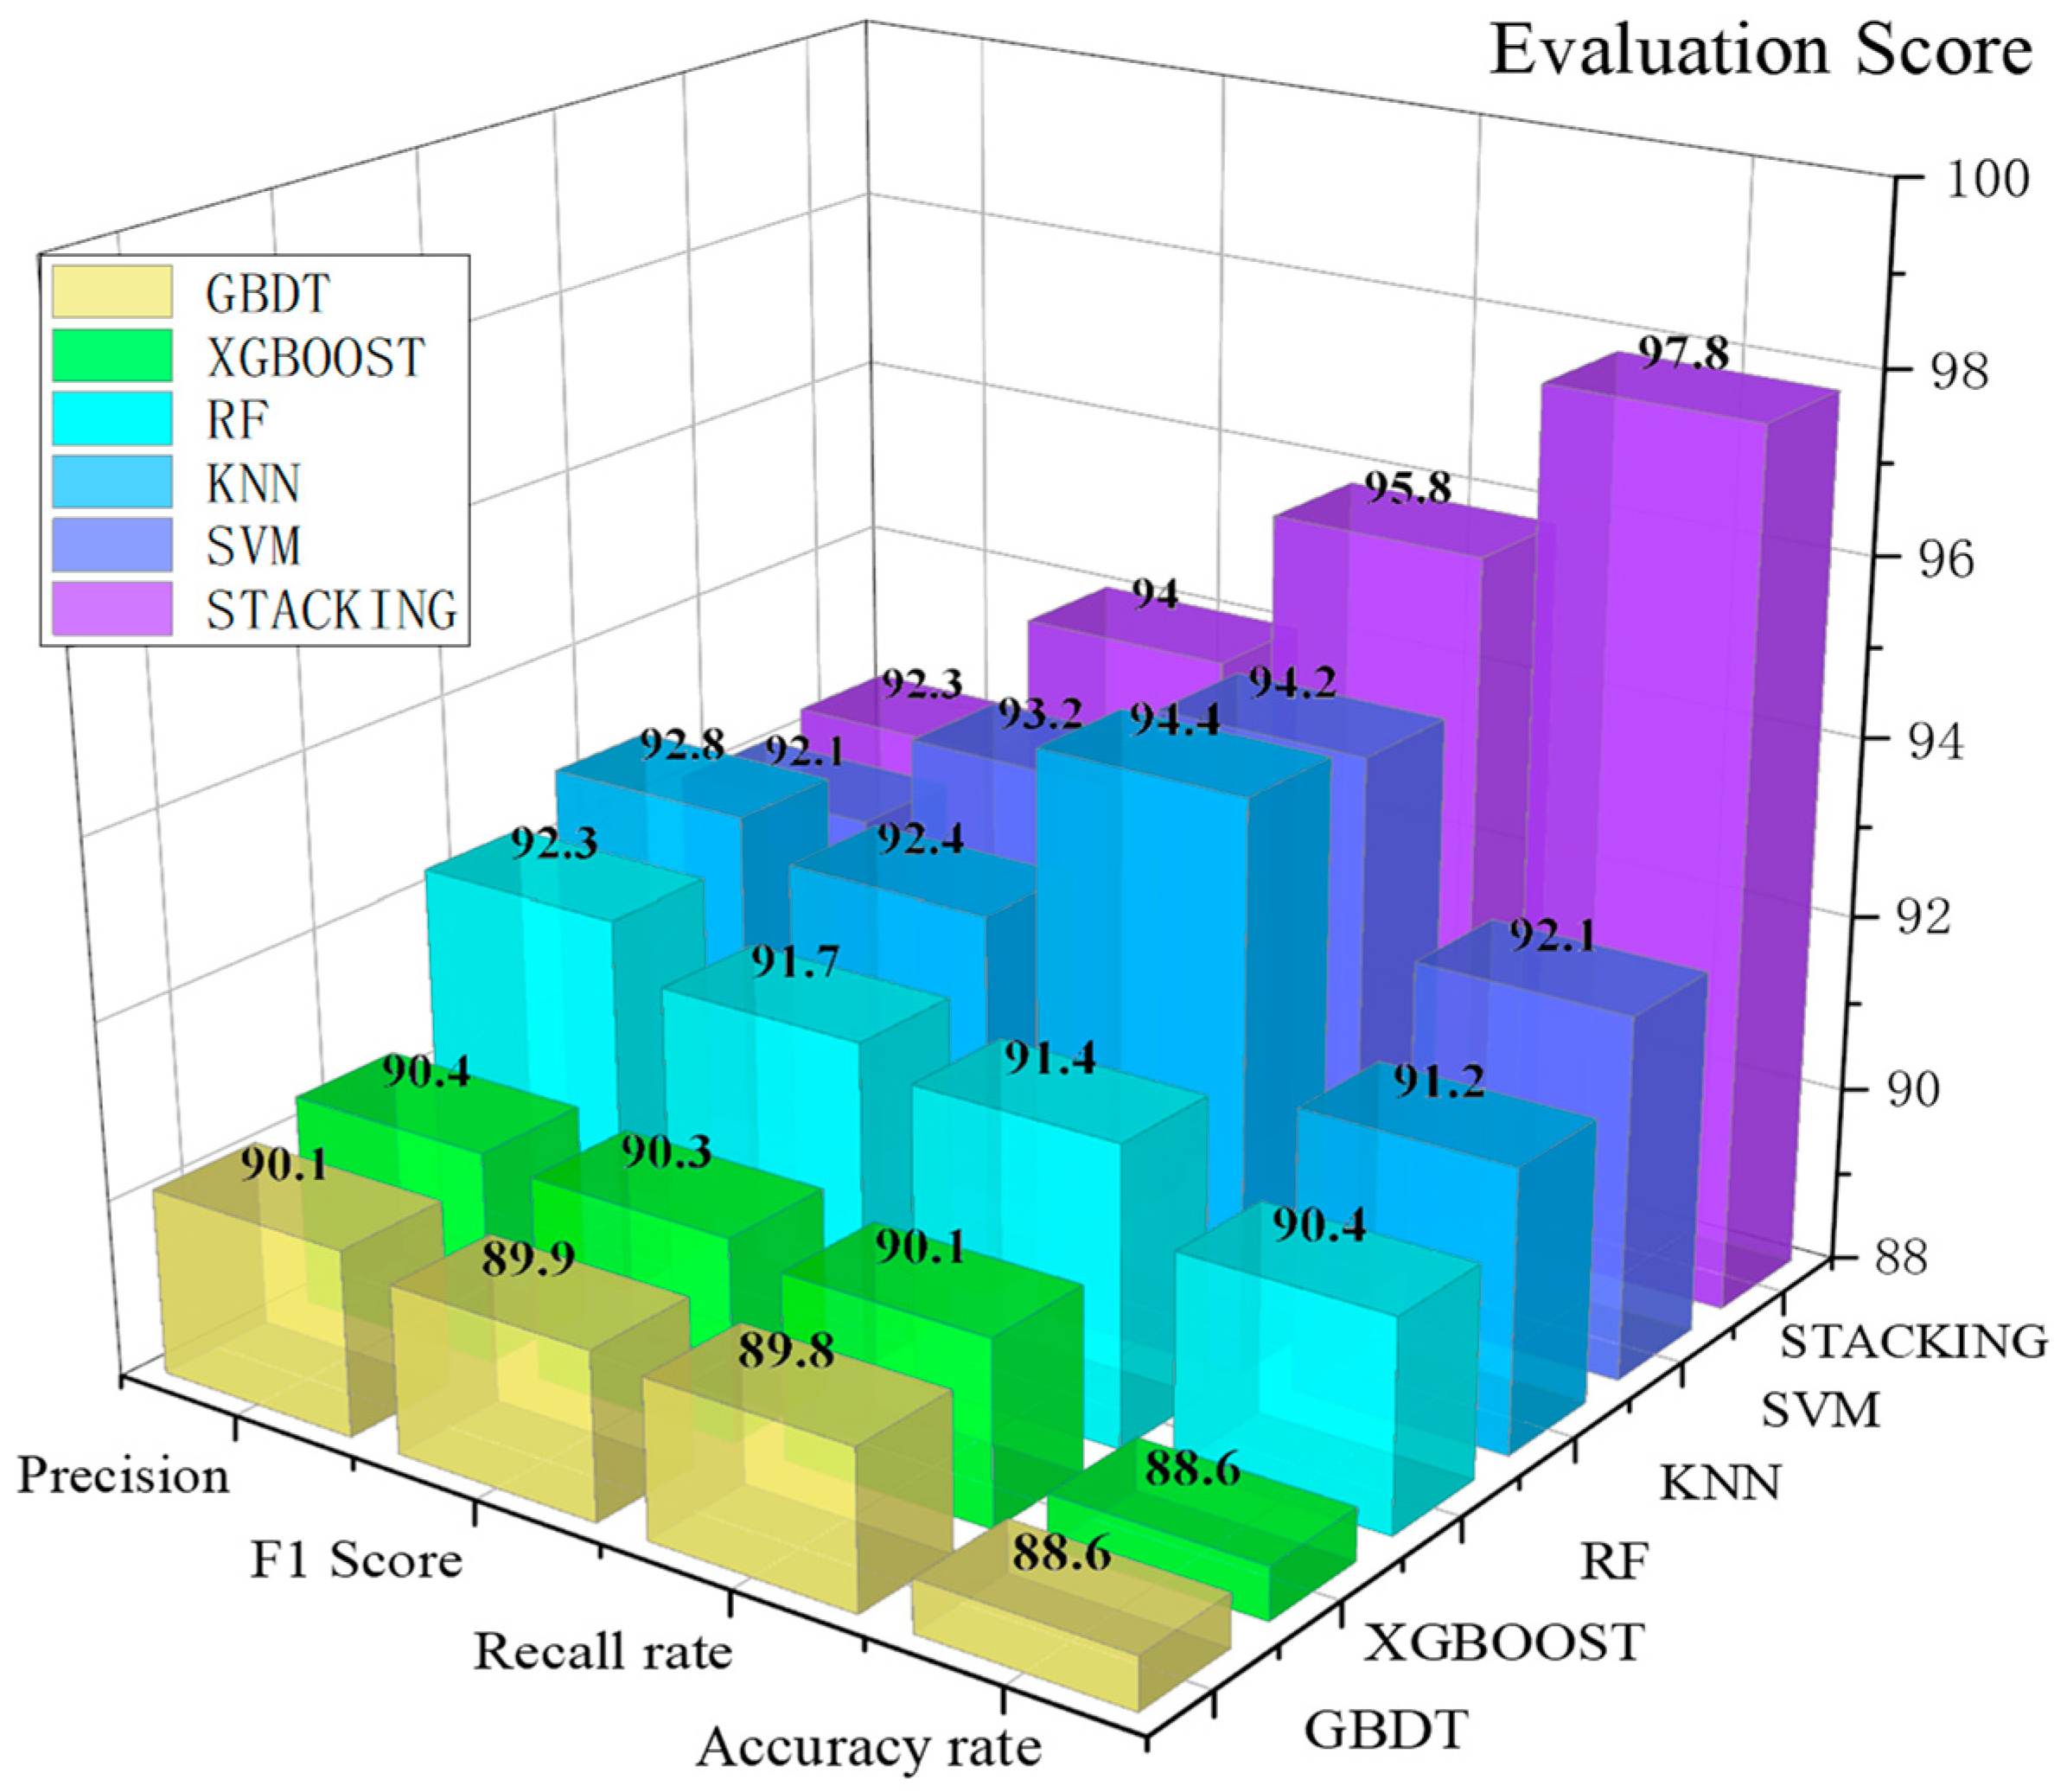
Selection of base learners. When selecting base learners, each base model should have distinct learning characteristics to ensure varied strengths in handling different data aspects. Therefore, this paper employs Support Vector Machines (SVM) [47], Random Forest (RF) [48], K-Nearest Neighbors (KNN) [49], and Extreme Gradient Boosting (XGBoost) [50] as base learners in the risk identification model.
(2)
Selection of meta-learner. To prevent overfitting, the meta-learner should have strong generalization capabilities to effectively refine and optimize the base learners’ predictions. Therefore, Gradient Boosting Decision Trees (GBDT) [51] are selected as the meta-learner for the second layer. The structure of the stacking model is illustrated in Figure 6.

5.2. Performance Metrics of the Stacking Model

The performance of the stacking model is evaluated using the confusion matrix, accuracy (A), recall (R), precision (P), and F1 score. The confusion matrix visually represents the model’s performance across categories, as shown in Table 1.
In Table 1, N T N represents the number of cases where both the identified values and true values are 1, N T P represents cases where both are 2; N F N represents cases where the identified values are 1 but the true values are 2, and N F P represents cases where the identified values are 2 but the true values are 1.
The formulas for calculating accuracy (A), recall (R), precision (P), and F1 score are as follows [52]:
A = N T P + N T N N T P + N T N + N F P + N F N
R = N T P N T P + N F N
P = N T P N T P + N F P
F 1 = 2 P R P + R

6. Simulation Verification and Analysis

As an example, we analyzed whole-process business data on the participation of electricity sales companies in the medium-to-the-term electricity market in a whole year for a province in China, encompassing 2448 samples from 204 companies.

6.1. Extraction of Principal Components of Data

Data samples are aligned and standardized, with PCA employed for dimensionality reduction. The number of principal components is selected based on eigenvalues greater than 1. Figure 7 displays the eigenvalues of the principal components and cumulative contribution rate after dimensionality reduction.
Observably, the eigenvalues level off after the 8th principal component, with a cumulative contribution rate of 85.7% by the 10th component, which contains 85.7% of the data information of the original dataset. Therefore, the first 10 principal components effectively summarize the main information of the 36 risk features in the risk feature library, resulting in a risk feature set with a matrix size of 2448 × 10 for electricity sales companies. This method achieves efficient data dimensionality reduction, retains the key information in the data, and has a low impact on the final results.
The principal component loading matrix is constructed using the feature vectors of the principal components, and the loading coefficients of each index are calculated. It represents both the projection of the original variables onto the principal components and the relationship between the components and the original variables. The matrix heat map of loading coefficients is shown in Figure 8.
The correlation of each principal component with risk can be observed in the figure. The higher the number of heat values of the indicator, the more strongly the indicator is considered to correlate with the principal component. Therefore, the final selection of the composition of each principal component is shown in Table A1.
As shown in Table A2, the linear equation for each principal component score is derived by calculating the score coefficient matrix for each component. Finally, the composite score of the principal components for each sample is calculated to evaluate the risk warning level of the electricity sales company. A higher composite score indicates a lower risk level, while a lower score signifies significant risks, requiring timely risk control measures.

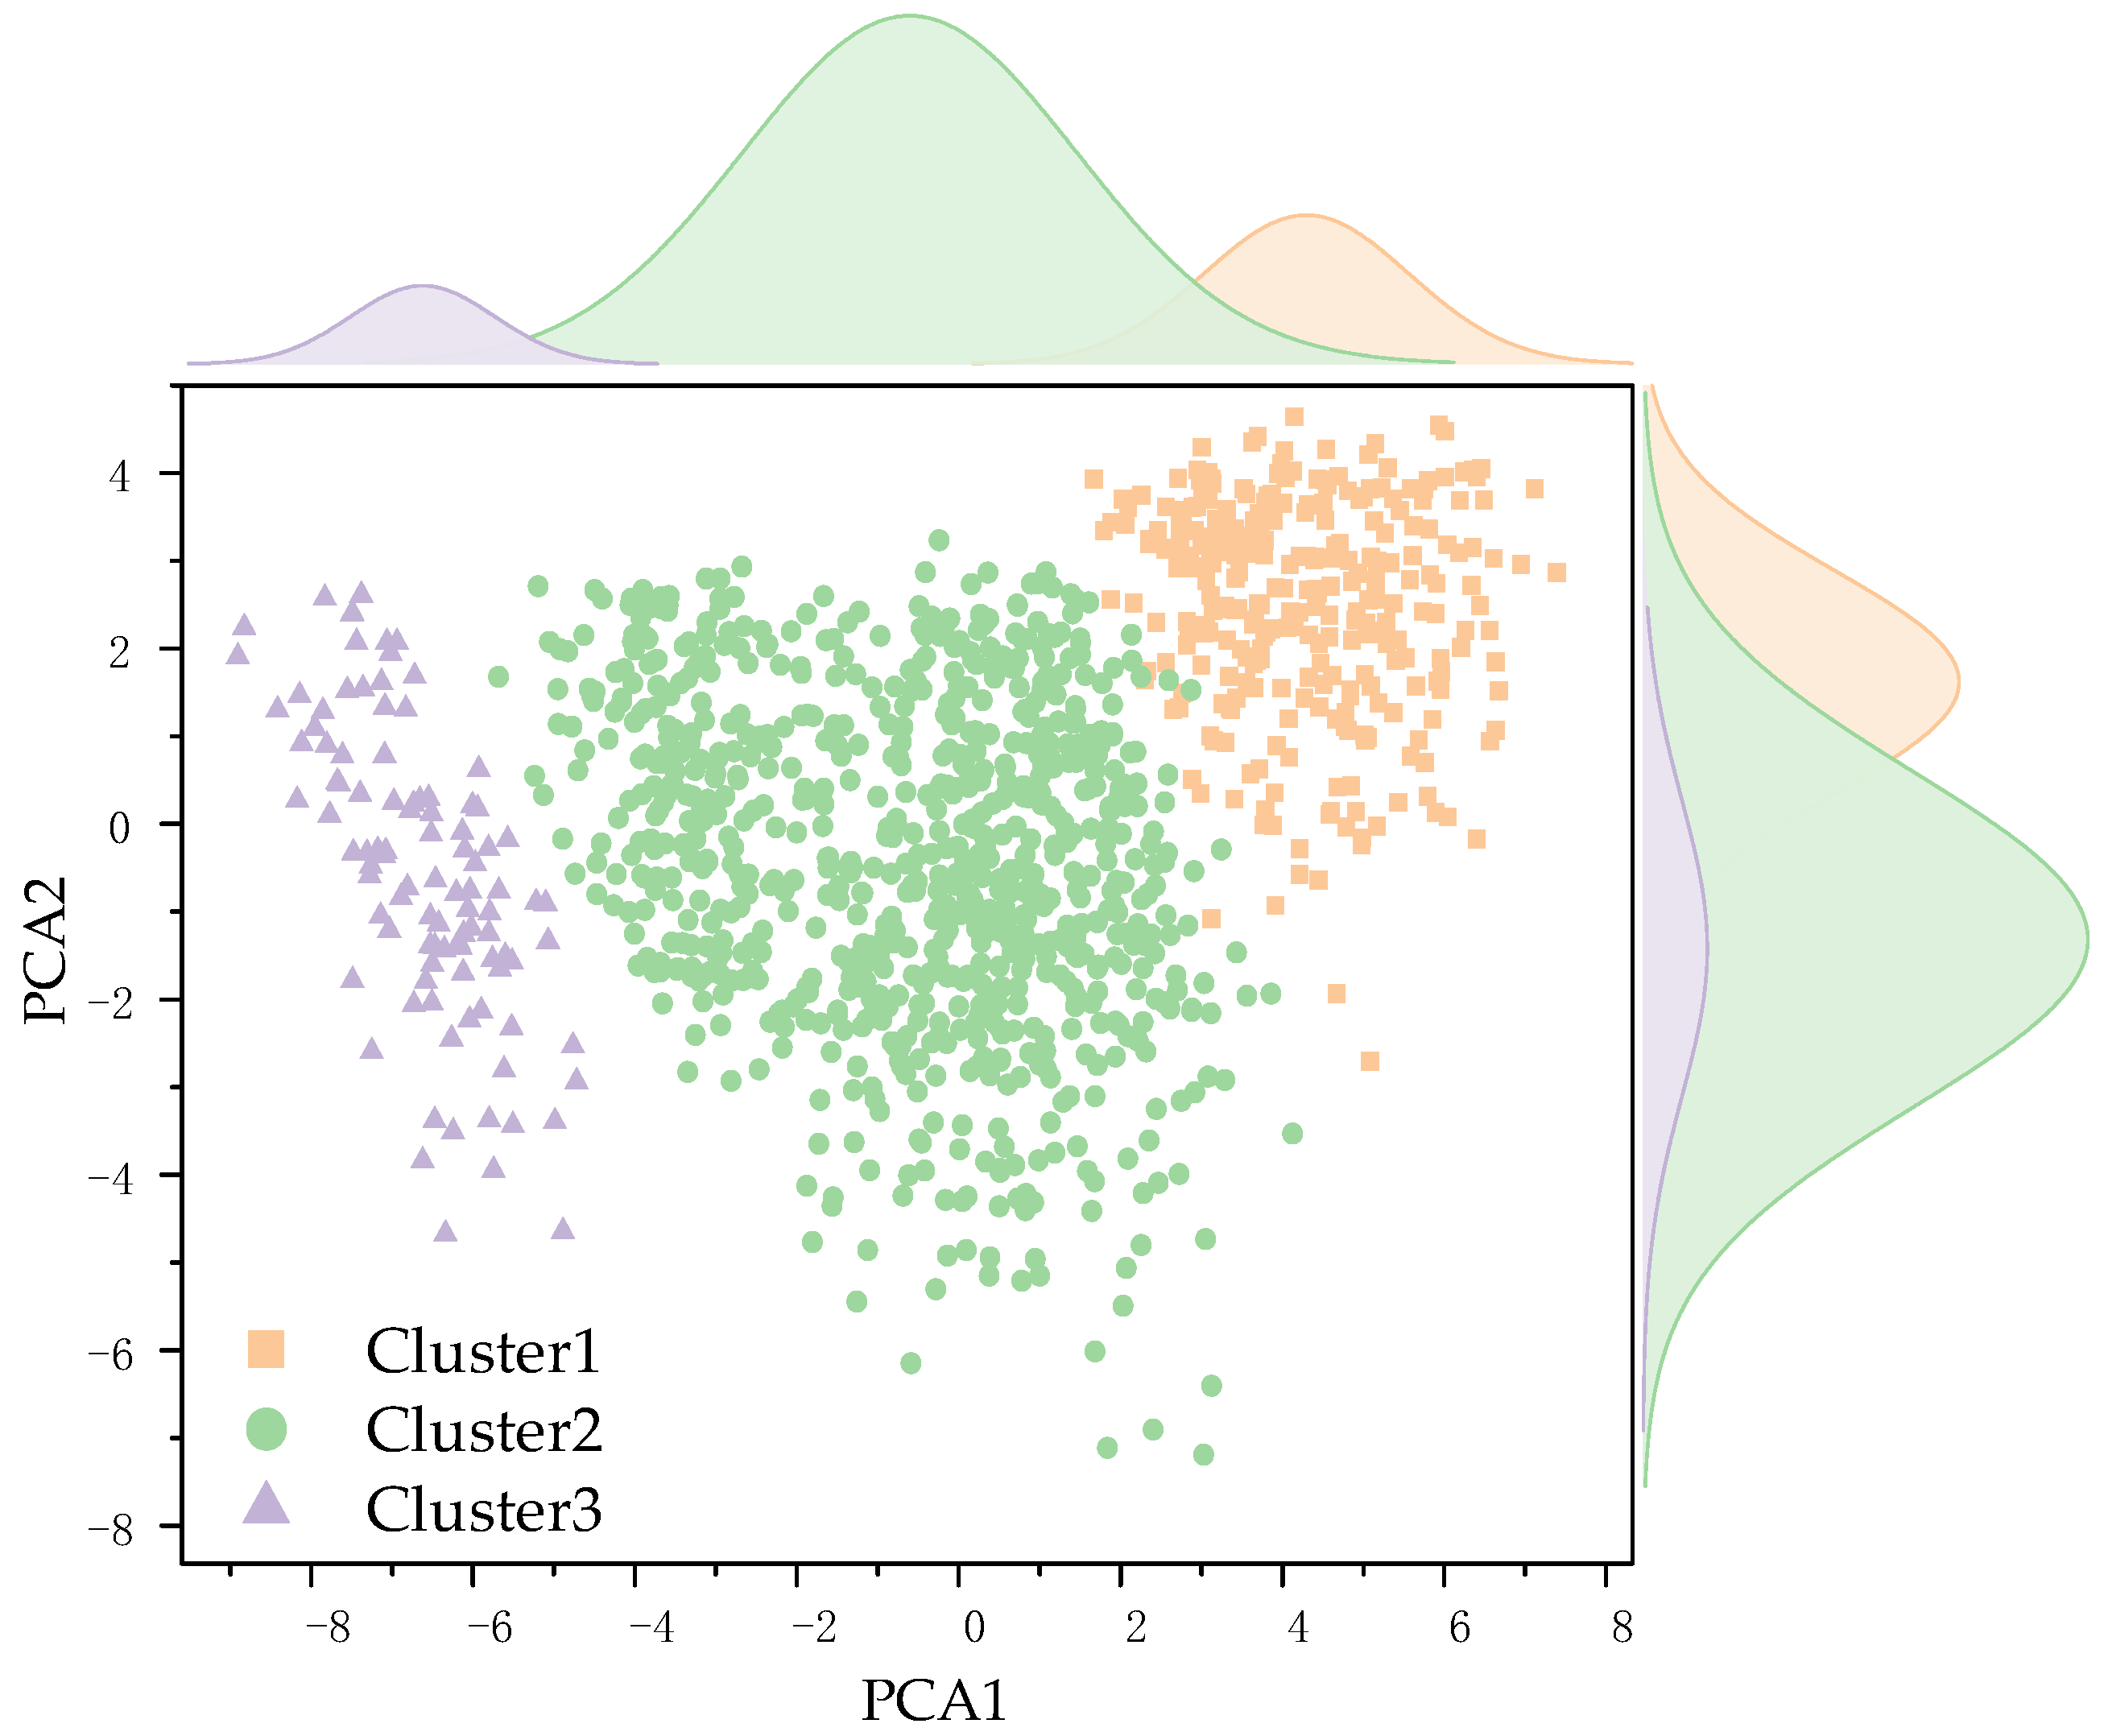
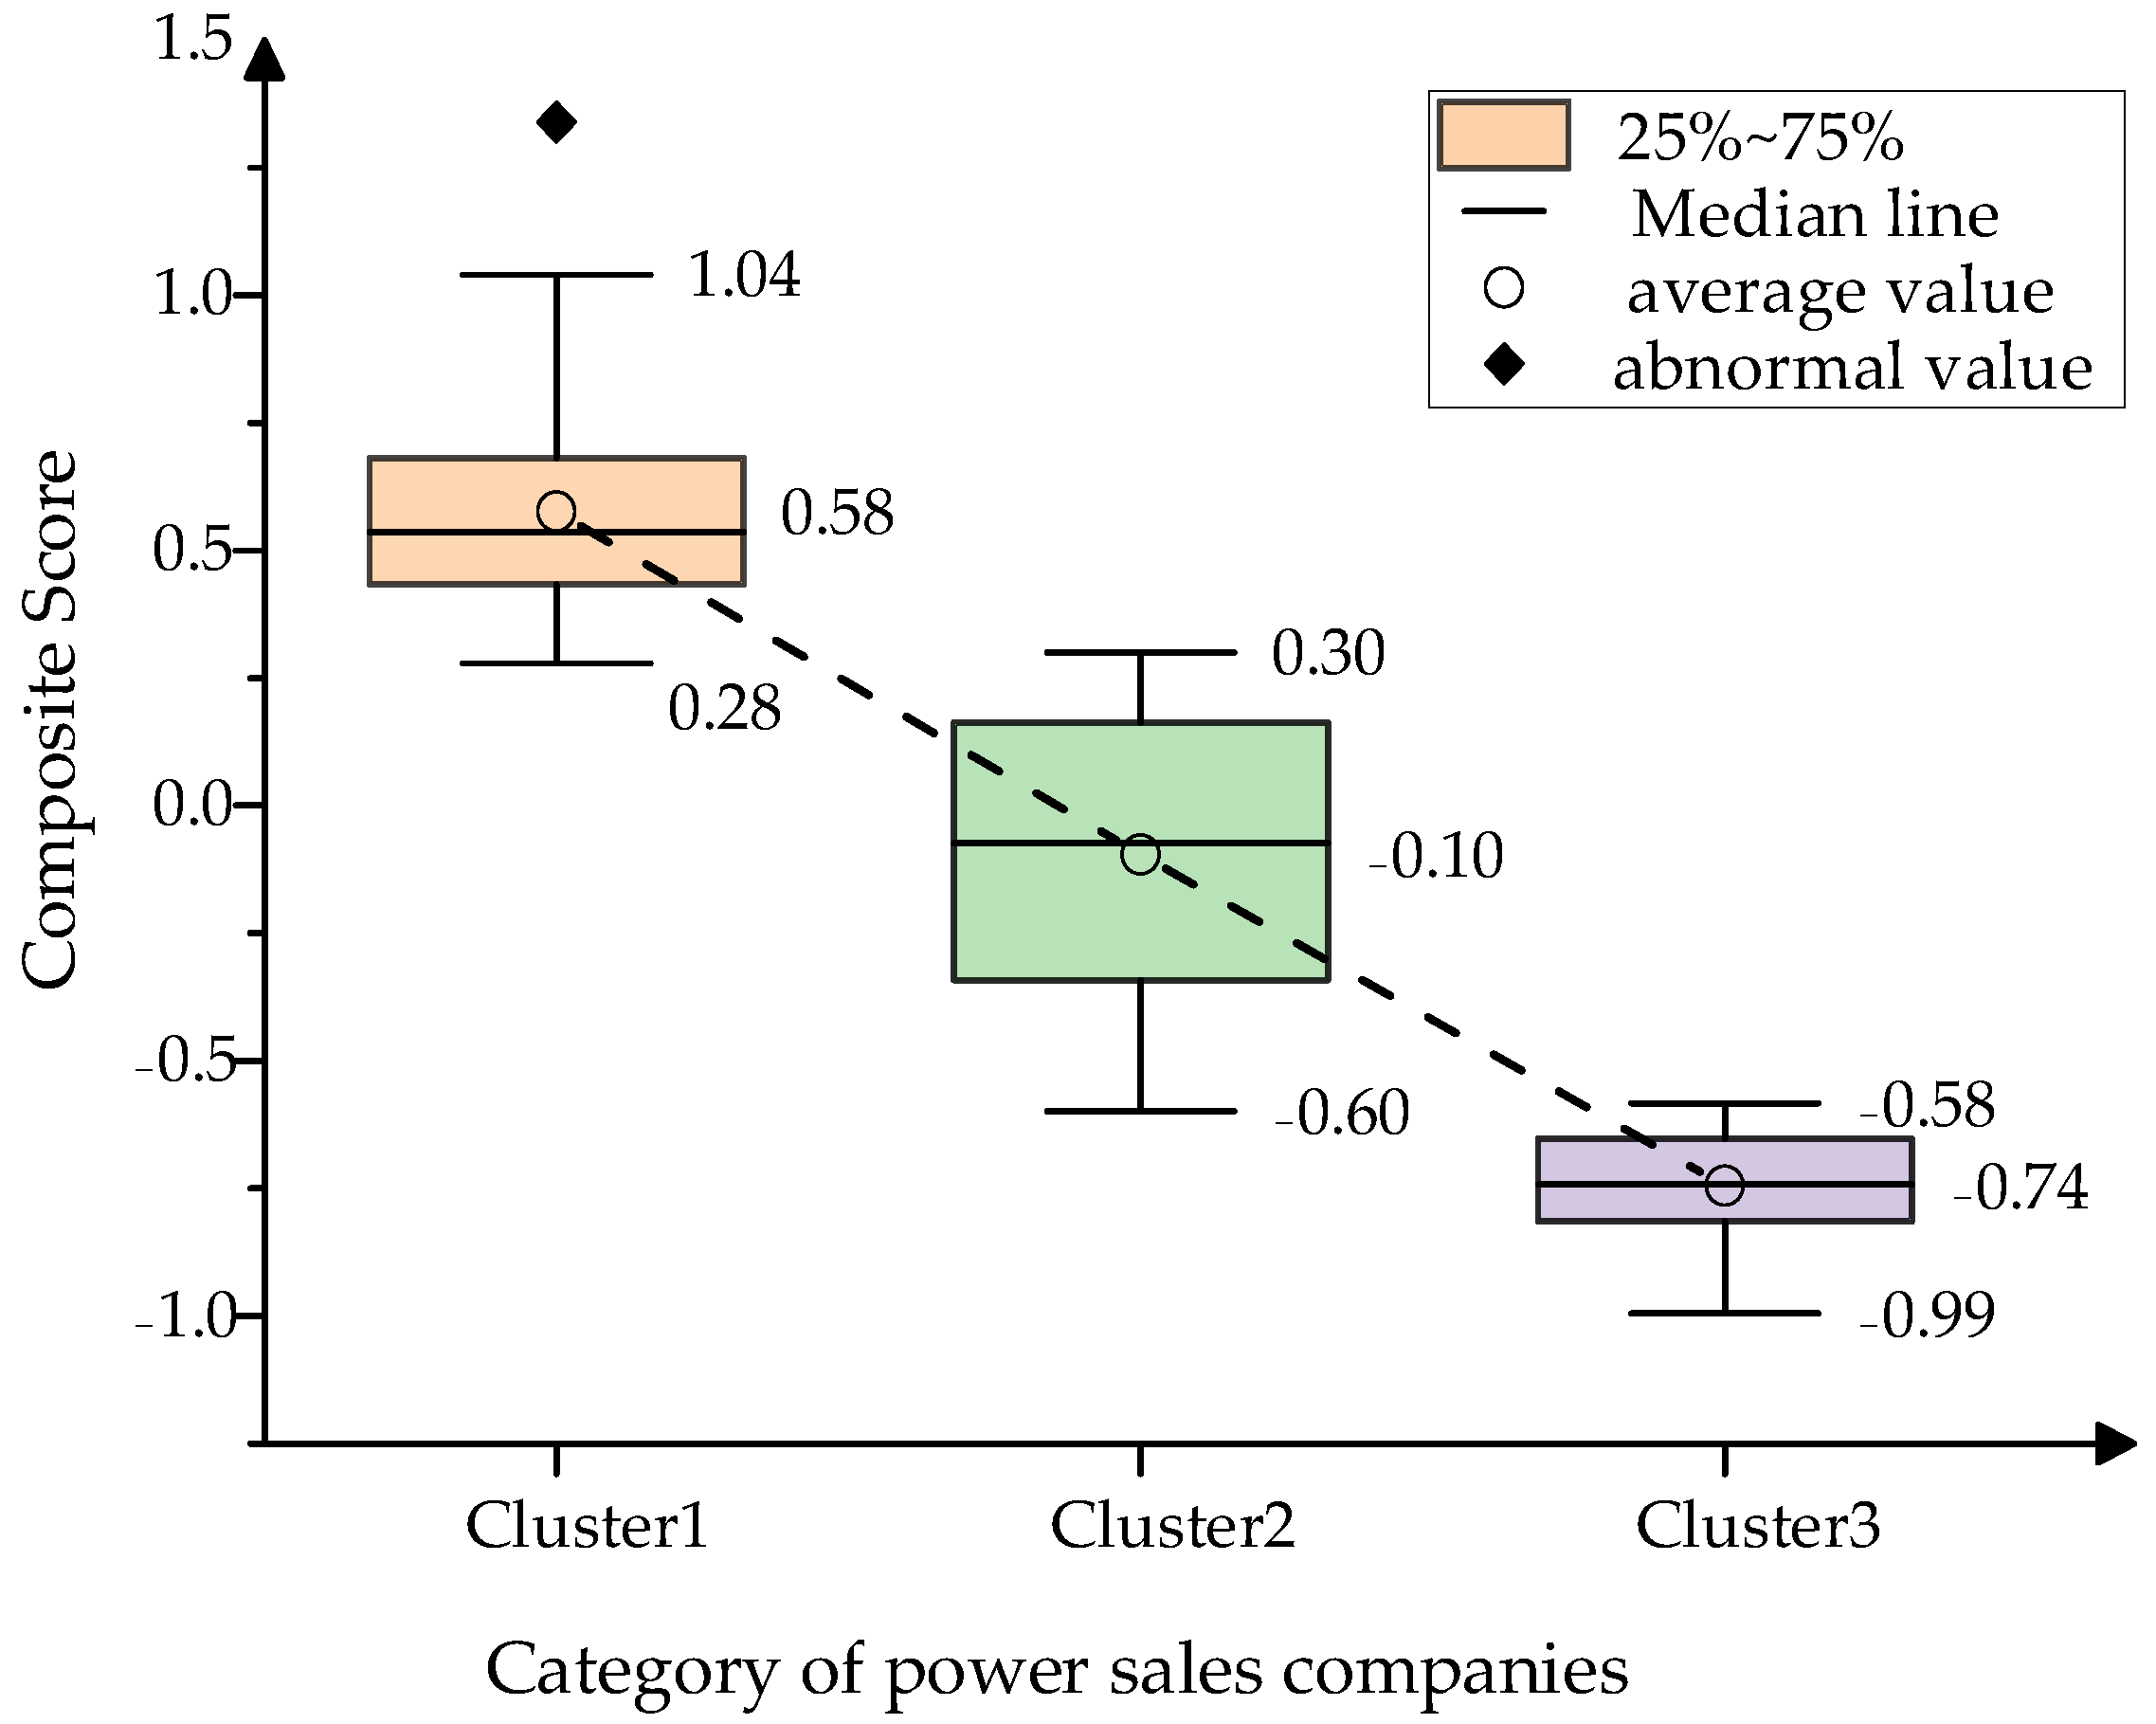
6.2. Risk Clustering of Electricity Sales Companies

The 10 principal component variables, obtained via PCA dimensionality reduction, are used for the cluster analysis of the sample data with the DPC-SSA algorithm. For this analysis, the maximum number of sparrows in SSA is set to 30, with a maximum of 300 iterations. The contour coefficient serves as the fitness value, and its trend with iteration count is shown in Figure 9.
The trend graph shows that as iterations increase, the fitness value gradually improves, reaching an optimal level at the 164th iteration. Compared to manual selection, SSA optimization finds the optimal truncation distance based on input data characteristics, achieving better clustering results.
After identifying the optimal truncation distance, the inflection point discriminant graph of data points is shown in Figure 10. Following the proposed clustering center selection strategy, when i = 3 , the second-order rate of change α is maximized, indicating an optimal cluster count of 3. The first three γ corresponding data points are selected as cluster centers.
To validate this selection strategy, contour coefficients for different cluster counts are calculated, with the results shown in Figure 11. The silhouette coefficient is maximized when the number of clusters is 3, consistent with the proposed strategy. The clustering outcome, shown in Figure 12, divides samples into three distinct clusters with clear boundaries, indicating effective clustering.

6.3. Classification of Risk Warning Levels

After clustering the data samples using the DPC-SSA algorithm, electricity sales companies are divided into three categories. To assess the actual risk implications of each cluster, the distribution of PCA principal component scores is shown in Figure 13. The figure shows clear distinctions in the composite score boundaries across the three categories of electricity sales companies. A boxplot (Figure 14) further analyzes the score distribution for each category of samples. Since the data are normalized, a higher composite score corresponds to a lower risk level.
Cluster 1 electricity sales companies generally score between 0.28 and 1.04, higher than the other categories, indicating the highest composite score and lowest risk. Cluster 2 companies have a more dispersed data distribution, ranging from −0.6 to 0.3, indicating a moderate risk level relative to Cluster 3. Cluster 3 companies, with scores from −0.99 to −0.58, generally score lower than the other clusters, indicating higher risk.
Based on clustering results and PCA scores, using −0.58 and 0.28 as the cut-off points for risk levels, this paper classifies electricity sales companies as low-, moderate-, and high-risk, corresponding to Clusters 1, 2, and 3, respectively. Additionally, samples are randomly selected from high-risk electricity sales companies for further analysis, with normalized data results shown in Figure 15. Principal component values for these high-risk companies occasionally fall below 0.1, indicating potentially serious risk issues.
According to the annual reports, samples 2, 4, and 5 exhibit severe debt issues. Their gearing ratios are 90.17%, 92.36%, and 89.42%, with cash flow ratios of 31.93, 34.37, and 23.29, indicating severe debt issues. The risk assessment results show that Principal Component 1 for these samples is low, indicating significant debt risks for these electricity sales companies. Principal Component 4 primarily represents dishonesty risk. As shown in Figure 15, samples 1, 4, and 5 may face significant dishonesty risks. In the credit evaluation of the province’s electricity sales companies, these companies received a credit rating of C and are listed on the joint dishonesty punishment list, validating the assessment results.
The Principal Component 5 values for the five high-risk samples are less than 0.1, indicating potential arrears risk. According to the arrears list, these companies have accumulated 17.49 million yuan in arrears, with average arrears of 3.49 million yuan, reflecting serious non-payment risk. The seventh principal component values for samples 1, 2, 4, and 5 are notably low, indicating potential customer attrition issues. According to customer satisfaction surveys from the power trading center, these companies’ scores are around 50, with a maximum of 56, substantially lower than typical companies. Sample 2’s customer attrition rate reaches 84.7%, indicating dissatisfaction with pricing and service quality.
When comparing the risk evaluation results of this paper with the provincial power trading center’s risk management list, all high-risk samples identified by the model are included in the risk management list. This finding corroborates the reliability of the proposed model.

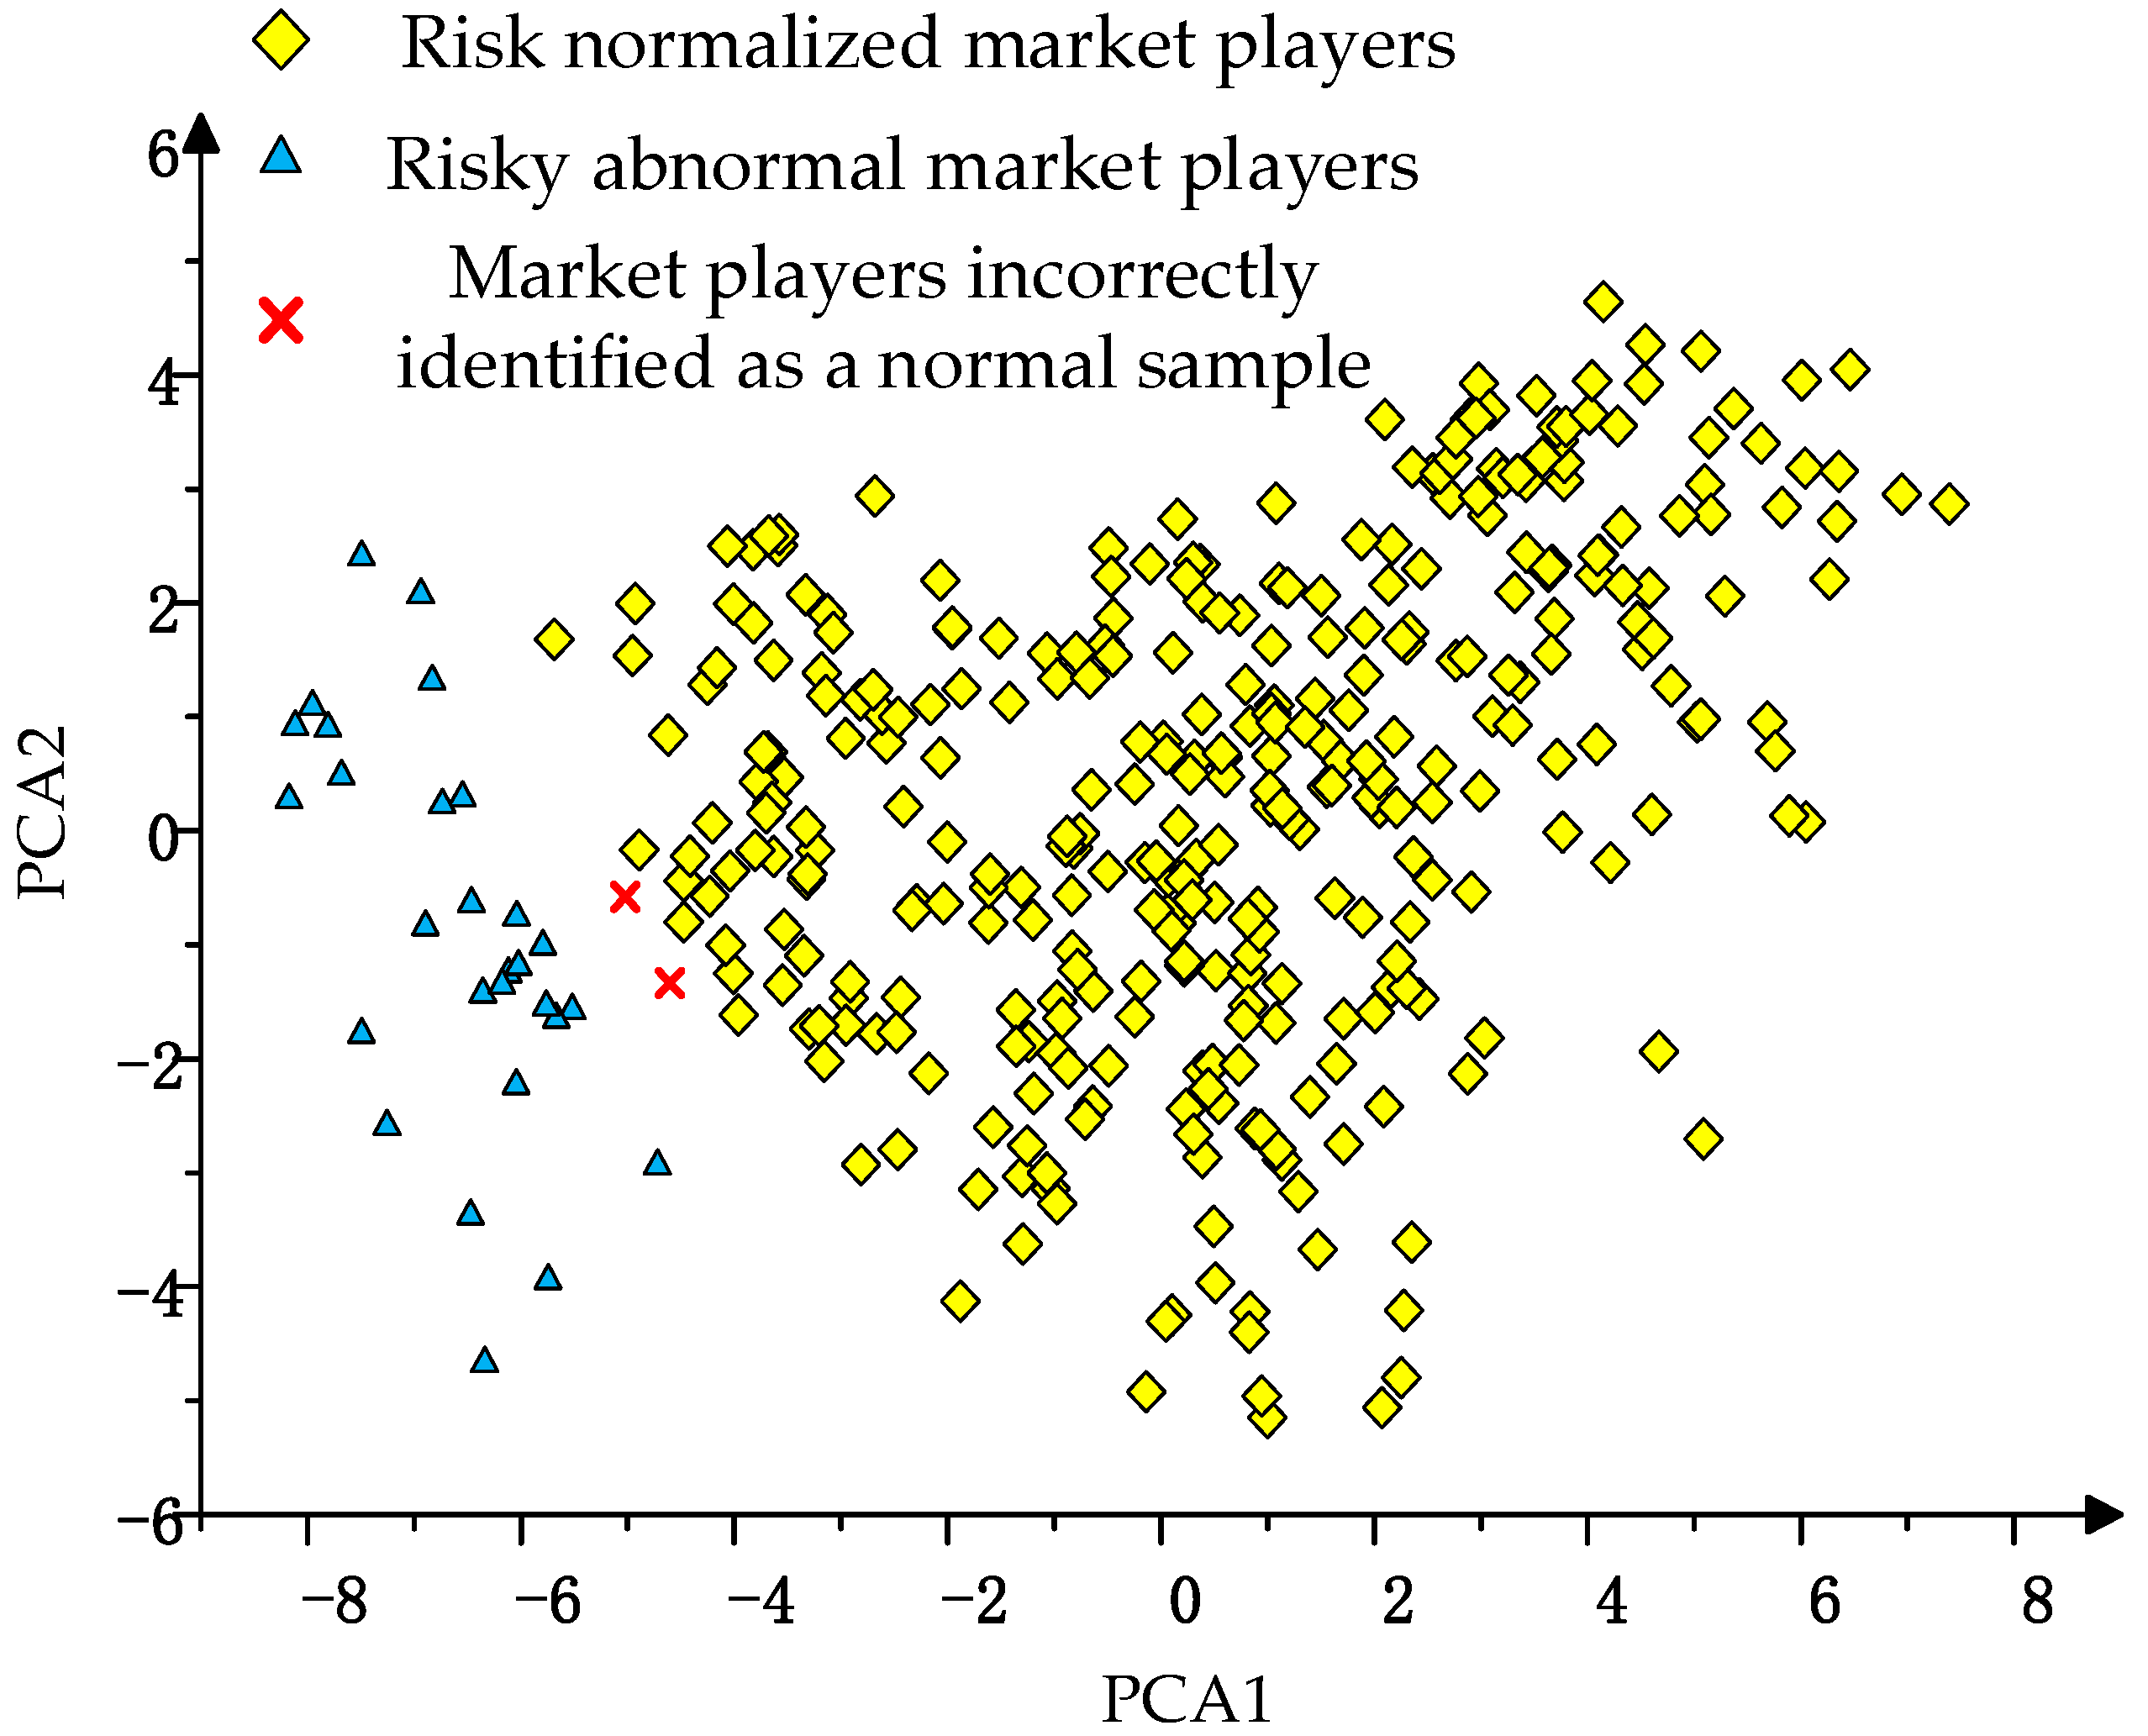
6.4. Analysis of Risk Warning Results

Clustered sample data are divided into positive and negative classes, with low- and medium-risk electricity sales companies as positive samples and high-risk companies as negative samples. The clustered samples are split, with 70% as the training set and 30% as the test set. The accuracy, recall, precision, and F1 score for the risk prediction model are calculated. Comparing the stacking model of this paper with five single classification models, SVM, RF, KNN, XGBOOST, and GBDT, the recognition results of each model are shown in Figure 16. From the figure, it can be observed that stacking is higher than the other single classification models in all the metrics except precision, and compared with the GBDT model, the accuracy of stacking is improved by 9.8%, recall by 6.0%, precision by 2.2%, and F1 score by 4.1, which is a significant improvement compared with the single classification models.
Additionally, Table 2 shows the confusion matrix, with 336 positive samples and 30 negative samples. The stacking model identified 28 negative samples (high-risk electricity sales companies), yielding a false detection rate of only 6.67% for negative samples.
The stacking model’s prediction results are analyzed using two principal component indicators, as shown in Figure 17.
Since the warning model focuses on managing high-risk companies, its ability to identify negative samples requires particular attention. As shown in the figure, the first and second principal components of two misclassified samples are very similar to those of normal samples, leading to their misclassification as positive by the stacking model. Deploying the warning model enables additional risk data collection from electricity sales companies, and ongoing model training improves risk prediction accuracy and minimizes errors.
To demonstrate this warning model’s advantages, this paper compares it to multivariate and neural network warning models. As shown in Table 3, the proposed method provides accurate risk warnings without requiring risk data labels. It requires minimal prior knowledge and can self-update on the basis of transaction data, achieving real-time risk warnings. This method meets practical requirements better than the other two models.

7. Conclusions

This paper proposes a data-driven risk warning method covering the entire business process of electricity sales companies. The method automatically identifies risks and provides dynamic warnings using regulatory data from the business process. Data analysis from a provincial trading center system indicates that:
(1)
PCA facilitates extracting key factors representing risk features from business data, reducing the amount of data for management and processing.
(2)
The proposed DPC-SSA clustering algorithm addresses cutoff distance issues and manual cluster center determination in DPC, providing effective clustering results for risk data.
(3)
Using principal component scores for adaptive risk level classification reduces the impact of subjective human factors, improving classification accuracy.
(4)
The constructed stacking model, applied to risk warning for electricity sales companies, exhibits high warning accuracy and enables dynamic warning and tracking of high-risk companies, allowing them to participate in the electricity market in a sustainable manner.
(5)
This risk warning method does not require risk data labels, can self-update on the basis of transaction data, and provides real-time, effective warnings for high-risk electricity sales companies.
Future research directions of this study may include enhancing the accuracy of the early warning model, such as investing a larger amount of raw data for training, which can be used to solve the problem of identifying some samples incorrectly. Additionally, a distributed computing framework can be employed to assign training tasks to multiple computing nodes for parallel processing, which would accelerate the training process and reduce operational costs. Furthermore, sustainable risk warning for electricity sales companies in the spot electricity market could be a future research direction.

Author Contributions

Conceptualization, B.C. and T.F.; method, T.F.; software, T.F.; validation, B.C., T.F., L.W., R.Z., Z.L. and H.L.; formal analysis, B.C. and T.F.; investigation, T.F.; resources, B.C.; data curation, B.C. and Z.Q.; writing—original draft preparation, T.F.; writing—review and editing, T.F.; visualization, T.F.; supervision, B.C.; project administration, L.W., R.Z. and Z.L. funding acquisition, B.C. All authors have read and agreed to the published version of the manuscript.

Funding

This research was supported by a Grant from the Department of Science and Technology of the Guangxi Zhuang Autonomous Region: ‘Guangxi Natural Science Foundation Project’. Project No. 2021GXNSFAA220042.

Institutional Review Board Statement

Not applicable.

Informed Consent Statement

Not applicable.

Data Availability Statement

Data are contained within the article.

Conflicts of Interest

Authors R.Z. and Z.L. were employed by the company China Southern Power Grid Guangxi Electric Power Trading Center. The remaining authors declare that the research was conducted in the absence of any commercial or financial relationships that could be construed as a potential conflict of interest.

Appendix A

Table A1. Composition of principal components.
Principal ComponentExplanation FactorRisks
1Total asset turnover ratio
Return on net assets
Debt-to-asset ratio
Adequacy of performance bond lines
Cash flow ratio
Kilowatt-hour profit
Power sales revenue
Loss rate
Default risk
Debt risk
Insufficient performance bond risk
2Performance bond amount
Transaction deviation rate
Planned power quantity
Settlement power quantity
Deviation risk
Insufficient performance bond risk
3Wholesale price
Wholesale prices year-on-year
Low selling price ratio
Settlement price
Market power risk
4Score of information filling standardization
Number of missing disclosures
Number of failures
Continued access risk
Credit risk
Non-standard information disclosure risk
5Number of arrears
Amount of arrears
Non-payment risk
6Deviation in power quantity
Number of technical staff
Deviation risk
Continued access risk
7User satisfaction
User attrition rate
User loss risk
8Total assetsContinued access risk
9Number of untimely disclosuresNon-standard information disclosure risk
10Number of disclosure errorsNon-standard information disclosure risk
Table A2. Principal component score coefficient matrix.
12345678910
0.0140.028−0.030−0.015−0.024−0.0420.037−0.5780.013−0.077
0.0090.039−0.008−0.015−0.021−0.0820.3330.445−0.141−0.301
−0.0110.0220.033−0.003−0.0010.0040.508−0.0050.021−0.065
−0.0160.0060.263−0.004−0.0180.0210.0480.016−0.0030.058
0.145−0.0140.038−0.041−0.002−0.106−0.055−0.017−0.036−0.073
−0.0120.0070.271−0.011−0.0090.0150.0570.0180.0030.058
−0.0060.0030.030−0.0050.486−0.0060.0170.029−0.0160.007
0.0040.043−0.013−0.0110.035−0.0630.383−0.0230.0230.498
0.004−0.0030.062−0.0190.493−0.012−0.0220.000−0.0260.001
−0.027−0.016−0.0110.255−0.0160.025−0.0070.0390.0230.018
0.0100.0120.010−0.2620.0080.006−0.011−0.005−0.006−0.014
−0.010−0.012−0.0100.262−0.008−0.0060.0120.0050.0060.014
−0.1400.0130.0430.0200.0070.103−0.0550.0020.005−0.065
−0.0110.0070.267−0.011−0.0230.0140.0550.0170.0040.057
−0.002−0.010−0.0110.251−0.003−0.0280.016−0.0090.0020.007
−0.2230.0080.0520.3730.0060.120−0.066−0.0090.009−0.092
0.145−0.0170.024−0.041−0.002−0.093−0.064−0.013−0.033−0.076
0.140−0.014−0.042−0.021−0.007−0.0960.0550.000−0.0040.065
0.132−0.0370.005−0.0550.009−0.010−0.0310.0230.017−0.043
−0.025−0.0140.2600.0070.2340.0570.0180.0290.006−0.020
0.091−0.003−0.011−0.057−0.0120.1190.0120.026−0.009−0.032
0.132−0.0280.007−0.0630.008−0.0080.0270.039−0.022−0.050
0.117−0.0030.027−0.0360.013−0.104−0.215−0.2000.0090.016
0.100−0.023−0.039−0.0670.0080.0420.0600.0440.073−0.025
−0.021−0.0170.0350.007−0.0050.011−0.1490.034−0.0940.592
−0.065−0.0210.0240.021−0.0050.512−0.0090.007−0.0040.005
−0.055−0.0360.0110.019−0.0040.506−0.0370.013−0.001−0.028
0.0110.103−0.0380.0240.002−0.134−0.117−0.0810.618−0.292
−0.0170.1570.0060.003−0.014−0.190−0.0550.2970.2920.337
0.0090.172−0.0460.0130.031−0.233−0.2380.036−0.645−0.132
−0.0170.181−0.0120.0130.0090.011−0.1480.1290.027−0.009
−0.0160.192−0.0130.006−0.0080.050−0.1510.1410.086−0.010
−0.0520.2950.026−0.009−0.012−0.0190.261−0.246−0.0520.009
−0.0610.2850.033−0.0050.001−0.0010.306−0.308−0.064−0.027
0.0050.172−0.007−0.0230.007−0.084−0.0790.137−0.008−0.004

References

  1. Wang, Y.; Liu, C.; Yuan, W.; Li, L. MRL-Based Model for Diverse Bidding Decision-Makings of Power Retail Company in the Wholesale Electricity Market of China. Axioms 2023, 12, 142. [Google Scholar] [CrossRef]
  2. Wang, H.; Wang, C.; Zhao, W. Decision on Mixed Trading between Medium- and Long-Term Markets and Spot Markets for Electricity Sales Companies under New Electricity Reform Policies. Energies 2022, 15, 9568. [Google Scholar] [CrossRef]
  3. Qi, H.; Lin, Z.; Zheng, R. Construction of An Early Warning Model for Market Power Identification in the Electricity Spot Market Based on Improved BP Neural Networks. In Proceedings of the 2022 9th International Forum on Electrical Engineering and Automation (IFEEA), Zhuhai, China, 4–6 November 2022; pp. 1215–1220. [Google Scholar]
  4. Zhang, C.; Liao, J.; Li, Y.; Zhang, B.; Li, Y.; Li, J. A Data-Driven Risk Identification and Early Warning Model for Electricity Spot Markets. In Proceedings of the 2024 4th Power System and Green Energy Conference (PSGEC), Shanghai, China, 22–24 August 2024; pp. 291–295. [Google Scholar]
  5. Li, X.; Zheng, Z.; Luo, B.; Shi, D.; Han, X. The impact of electricity sales side reform on energy technology innovation: An analysis based on SCP paradigm. Energy Econ. 2024, 136, 107763. [Google Scholar] [CrossRef]
  6. Huang, J.; Chen, F.; Yang, T.; Sun, Y.; Yang, P.; Liu, G. Optimal Operation of Electricity Sales Company with Multiple VPPs Based on Stackelberg Game. In Proceedings of the 2023 5th International Conference on Power and Energy Technology (ICPET), Tianjin, China, 27–30 July 2023; pp. 1194–1199. [Google Scholar]
  7. Xu, X.; Zhang, Z.; Liu, B. Design of medium and long-term power market electricity purchase and sale strategy considering time-sharing power consumption deviation assessment. In Proceedings of the International Conference on Computer Graphics, Artificial Intelligence, and Data Processing (ICCAID 2022), Guangzhou, China, 23–25 December 2023; Volume 12604, pp. 544–550. [Google Scholar]
  8. Fram, P.; Rruka, J.; Sandal, K. Risk Management in Wholesale Electricity Markets: A Signal Processing Approach. In Proceedings of the 2022 International Conference on Renewable Energies and Smart Technologies (REST), Tirana, Albania, 28–29 July 2022; pp. 304–309. [Google Scholar]
  9. Zhang, X. A Long-term price risk early-warning model of electricity company based on EGARCH and VAR. In Proceedings of the 2010 International Conference on Advances in Energy Engineering ICAEE, Beijing, China, 19–20 June 2010; pp. 295–298. [Google Scholar]
  10. Xia, W.; Wang, Z.; Gao, C.; Yang, T.; Ming, H. Multi-angle Risk Identification and Comprehensive Evaluation of Electricity Retailers in the Electricity Sales Market Environment. In Proceedings of the 2022 IEEE International Conference on Power Systems and Electrical Technology (PSET), Aalborg, Denmark, 13–15 October 2022; pp. 415–420. [Google Scholar]
  11. Aghaei, J.; Charwand, M.; Gitizadeh, M. Robust risk management of retail energy service providers in midterm electricity energy markets under unstructured uncertainty. J. Energy Eng. 2017, 143, 04017030. [Google Scholar] [CrossRef]
  12. Charwand, M.; Gitizadeh, M. Risk-based procurement strategy for electricity retailers: Different scenario-based methods. IEEE Trans. Eng. Manag. 2018, 67, 141–151. [Google Scholar] [CrossRef]
  13. Wang, P.; Xu, K.; Dai, Y.; Yu, S. A Systematic Muti-level Evaluation Framework and Approach for Electricity Market Operation Based on Big Data. In Proceedings of the 2022 IEEE/IAS Industrial and Commercial Power System Asia, I&CPS Asia, Shanghai, China, 8–11 July 2022; pp. 1778–1783. [Google Scholar]
  14. Li, Y.; Li, J.; Shang, Y.; Qian, H. Risk Forecast to Electricity Retail Market Based Multiple Risk Factors of Electricity Retail Companies. In Proceedings of the 2020 5th International Conference on Power and Renewable Energy ICPRE, Shanghai, China, 12–14 September 2020; pp. 95–100. [Google Scholar]
  15. Fan, W.; Song, X.; Li, C. Market power evaluation of power retail market based on combination weighting method. In Proceedings of the 2024 3rd International Conference on Energy, Power and Electrical Technology ICEPET, Chengdu, China, 17–19 May 2024; pp. 1373–1377. [Google Scholar]
  16. Adelowo, J.; Bohland, M. Redesigning automated market power mitigation in electricity markets. Int. J. Ind. Organ. IJIO 2024, 97, 103108. [Google Scholar] [CrossRef]
  17. Li, H.; Lan, Q.; Xiong, Q. Methodology for Smooth Transition from Experience-Based to Data-Driven Credit Risk Assessment Modeling under Data Scarcity. Mathematics 2024, 12, 2410. [Google Scholar] [CrossRef]
  18. Cheng, Z.; Li, H.; Xu, H. Identification of market power abuse in China’s electricity market. IOP Conf. Ser. Mater. Sci. Eng. 2020, 740, 012077. [Google Scholar] [CrossRef]
  19. Zhang, L.; Bai, X.; Chen, Y.; Wang, T.; Hu, F.; Li, M. Research on Power Market User Credit Evaluation Based on K-Means Clustering and Contour Coefficient. In Proceedings of the 2020 3rd International Conference on Robotics, Control and Automation Engineering (RCAE), Chongqing, China, 5–8 November 2020; pp. 64–68. [Google Scholar]
  20. De, G.; Tan, Z.; Li, M. A credit risk evaluation based on intuitionistic fuzzy set theory for the sustainable development of electricity retailing companies in China. Energy Sci. Eng. 2019, 7, 2825–2841. [Google Scholar] [CrossRef]
  21. Peng, Y. Construction and Evaluation of Credit Risk Early Warning Indicator System of Internet Financial Enterprises Based On AI and Knowledge Graph Theory. Procedia Comput. Sci. 2024, 243, 918–927. [Google Scholar] [CrossRef]
  22. Wang, W.; An, A. Identification of market power abuse in Chinese electricity market based on an improved cost-sensitive support vector machine. Int. J. Electr. Power Energy Syst. 2024, 158, 109907. [Google Scholar] [CrossRef]
  23. Baldissarro, G.; Bruni, M.E.; Iazzolino, G.; Morea, D.; Veltri, S. Does It Pay Off to Integrate ESG Performance into Bank Investment Portfolio Selection? Empirical Evidence in the European Energy Sector. Sustainability 2024, 16, 10766. [Google Scholar] [CrossRef]
  24. Sotiropoulos, D.N.; Koronakos, G.; Solanakis, S.V. Evolving Transparent Credit Risk Models: A Symbolic Regression Approach Using Genetic Programming. Electronics 2024, 13, 4324. [Google Scholar] [CrossRef]
  25. Zhou, Y.; Chong, C.H.; Ni, W.; Li, Z.; Zhou, X.; Ma, L. Data Modeling and Synchronization Method to Align Power Trading Rules for Integrated Energy Management Systems. Sustainability 2024, 16, 9073. [Google Scholar] [CrossRef]
  26. Samadi, M.; Hajiabadi, M. Assessment of the collusion possibility and profitability in the electricity market: A new analytical approach. Int. J. Electr. Power Energy Syst. 2019, 112, 381–392. [Google Scholar] [CrossRef]
  27. Zhang, Y.; Zhao, H.; Li, B.; Zhao, Y.; Qi, Z. Research on credit rating and risk measurement of electricity retailers based on Bayesian Best Worst Method-Cloud Model and improved Credit Metrics model in China’s power market. Energy 2022, 252, 124088. [Google Scholar] [CrossRef]
  28. Yu, X.; Zheng, D.; Zhou, L. Credit risk analysis of electricity retailers based on cloud model and intuitionistic fuzzy analytic hierarchy process. Int. J. Energy Res. 2021, 45, 4285–4302. [Google Scholar] [CrossRef]
  29. Allen, D.E.; Powell, R.J.; Singh, A.K. Take it to the limit: Innovative CVaR applications to extreme credit risk measurement. Eur. J. Oper. Res. 2016, 249, 465–475. [Google Scholar] [CrossRef]
  30. Dong, J.; Wang, D.; Liu, D.; Ainiwaer, P.; Nie, L. Operation Health Assessment of Power Market Based on Improved Matter-Element Extension Cloud Model. Sustainability 2019, 11, 5470. [Google Scholar] [CrossRef]
  31. Jin, L.; Cheng, C.; Wang, X.; Yu, J.; Long, H. Research on information disclosure strategies of electricity retailers under new electricity reform in China. Sci. Total Environ. 2020, 710, 136382. [Google Scholar] [CrossRef]
  32. Hao, Q.; Wang, S.; Zheng, J.; Zhong, X.; Zhang, J.; Xiao, C. Research on Revenue Risk of Electricity Retailers Considering Demand Response. In Proceedings of the 2022 IEEE 5th International Electrical and Energy Conference (CIEEC), Nangjing, China, 27–29 May 2022; pp. 2950–2955. [Google Scholar]
  33. Xiong, C.; Lv, X.; Li, X.; Zhong, H.; Feng, J. Market power evaluation in the electricity market based on the weighted maintenance object. Energy 2023, 284, 129294. [Google Scholar]
  34. Wang, X.; Huang, H.; Zhao, W.; Yang, X.; Kong, M. Risk Warning System of Market Power Monitoring in Electricity Market. IOP Conf. Ser. Earth Environ. Sci. 2021, 831, 012005. [Google Scholar] [CrossRef]
  35. Liu, D.; Zhang, Q.; Li, X.; Gu, Y.; Tan, Z. Identification of Potential Harmful Behaviors in Electricity Market Based on Cloud Model and Fuzzy Petri Net. Automat. Electric Power Syst. 2019, 43, 25–33. [Google Scholar]
  36. Davut, P.; Elçin, A.; Bilge, K. Introducing the overall risk scoring as an early warning system. Expert Syst. Appl. 2024, 246, 123232. [Google Scholar]
  37. Hua, H.; Chen, X.; Gan, L.; Sun, J.; Dong, N.; Liu, D. Demand-Side Joint Electricity and Carbon Trading Mechanism. IEEE Trans. Ind. Cyber-Phys. Syst. 2024, 2, 14–25. [Google Scholar] [CrossRef]
  38. Wang, L.; Cao, Z.; Li, P. Research on the mechanism of leader-follower product sales competition based on market access restrictions and forward contract considerations. Heliyon 2024, 10, e32372. [Google Scholar] [CrossRef]
  39. Zhou, N.; He, P.; Ding, W. Research on Settlement Risk Control of electricity Sales Company Base on the integration of Margin System and Business Process. In Proceedings of the 2022 China International Conference on Electricity Distribution CICED, Changsha, China, 7–8 September 2022; pp. 87–91. [Google Scholar]
  40. Alahmadi, M. Optimizing Data Quality for Sustainable Development: An Integration of Green Finance with Financial Market Regulations. Sustainability 2024, 16, 10418. [Google Scholar] [CrossRef]
  41. Qiao, K.; Chen, J.; Duan, S. Self-adaptive two-stage density clustering method with fuzzy connectivity. Appl. Soft Comput. 2024, 154, 111355. [Google Scholar] [CrossRef]
  42. Sarvani, A.; Hemalatha, S. Nature inspired-based remora optimisation algorithm for enhancement of density peak clustering. Cogent Eng. 2023, 10, 2278259. [Google Scholar]
  43. Yang, Y.; Wang, L.; Cheng, Z. Density peaks algorithm based on information entropy and merging strategy for power load curve clustering. J. Supercomput. 2023, 80, 8801–8832. [Google Scholar] [CrossRef]
  44. Liu, G.; Shu, C.; Liang, Z.; Peng, B.; Cheng, L. A Modified Sparrow Search Algorithm with Application in 3d Route Planning for UAV. Sensors 2021, 21, 1224. [Google Scholar] [CrossRef]
  45. Guo, L.; Qin, W.; Cai, Z.; Su, X. Hybrid Clustering Algorithm Based on Improved Density Peak Clustering. Appl. Sci. 2024, 14, 715. [Google Scholar] [CrossRef]
  46. Wang, Y.; Sun, Y.; Dan, Y.; Li, Y.; Cao, J.; Han, X. Online load-loss risk assessment based on stacking ensemble learning for power systems. Front. Energy Res. 2023, 11, 1281368. [Google Scholar] [CrossRef]
  47. Abd El Aal, A.K.; GabAllah, H.M.; Megahed, H.A.; Selim, M.K.; Hegab, M.A.; Fadl, M.E.; Rebouh, N.Y.; El-Bagoury, H. Geo-Environmental Risk Assessment of Sand Dunes Encroachment Hazards in Arid Lands Using Machine Learning Techniques. Sustainability 2024, 16, 11139. [Google Scholar] [CrossRef]
  48. Yang, W.; Chen, L.; Ke, T.; He, H.; Li, D.; Liu, K.; Li, H. Carbon Emission Trend Prediction for Regional Cities in Jiangsu Province Based on the Random Forest Model. Sustainability 2024, 16, 10450. [Google Scholar] [CrossRef]
  49. Ekinci, G.; Ozturk, H.K. Forecasting Wind Farm Production in the Short, Medium, and Long Terms Using Various Machine Learning Algorithms. Energies 2025, 18, 1125. [Google Scholar] [CrossRef]
  50. Liu, J.; Chu, Q.; Yuan, W.; Zhang, D.; Yue, W. WQI Improvement Based on XG-BOOST Algorithm and Exploration of Optimal Indicator Set. Sustainability 2024, 16, 10991. [Google Scholar] [CrossRef]
  51. Peng, S.; Feng, C.; Qiu, Z.; Zhang, Q.; Liu, W.; Gao, W. Enhanced Data-Driven Machine Learning Models for Predicting Total Organic Carbon in Marine–Continental Transitional Shale Reservoirs. Sustainability 2025, 17, 2048. [Google Scholar] [CrossRef]
  52. Liu, H.; Cui, Y.; Wang, J.; Yu, H. Analysis and Research on Rice Disease Identification Method Based on Deep Learning. Sustainability 2023, 15, 9321. [Google Scholar] [CrossRef]
Figure 1. Risk warning method of the whole process of electricity sales business.
Sustainability 17 03884 g001
Figure 2. Business process of electricity selling company.
Sustainability 17 03884 g002
Figure 3. Structure of risk warning data sources.
Sustainability 17 03884 g003
Figure 4. Adaptive clustering and risk classification steps.
Sustainability 17 03884 g004
Figure 5. Flowchart of the DPC-SSA algorithm.
Sustainability 17 03884 g005
Figure 6. Structure diagram of the stacking model.
Sustainability 17 03884 g006
Figure 7. Results of principal component analysis of risk characteristics.
Sustainability 17 03884 g007
Figure 8. Factor load heat map.
Sustainability 17 03884 g008
Figure 9. Trend chart of fitness value.
Sustainability 17 03884 g009
Figure 10. Inflection point discriminant diagram.
Sustainability 17 03884 g010
Figure 11. Variation of contour coefficient.
Sustainability 17 03884 g011
Figure 12. Risk clustering effect diagram.
Sustainability 17 03884 g012
Figure 13. Distribution of comprehensive scores of electricity sales companies.
Sustainability 17 03884 g013
Figure 14. The comprehensive score of all kinds of electricity sales companies.
Sustainability 17 03884 g014
Figure 15. Comparison of principal components in the high-risk electricity sales formula.
Sustainability 17 03884 g015
Figure 16. Comparison between the single-classification models and stacking model.
Sustainability 17 03884 g016
Figure 17. Identification results of stacking models.
Sustainability 17 03884 g017
Table 1. Confusion matrix.
Identifying ValuesTrue Values
True Value 1True Value 2
Identifying values 1 N T N N F N
Identifying values 2 N F P N T P
Table 2. Stacking model confusion matrix.
Real ValueIdentifying Value
Positive SampleNegative Sample
Positive sample3306
Negative sample228
Table 3. Comparison of risk warning models.
MethodsNo Data Labels RequiredReal TimeSelf-Update
Z-score warning method××
Neural networks warning methods×
Warning method of this paper
Disclaimer/Publisher’s Note: The statements, opinions and data contained in all publications are solely those of the individual author(s) and contributor(s) and not of MDPI and/or the editor(s). MDPI and/or the editor(s) disclaim responsibility for any injury to people or property resulting from any ideas, methods, instructions or products referred to in the content.

