

Deciphering the Intricate Influence of Greenwashing and Environmental Performance on Financial Outcome Through Panel VAR/GMM Analysis


Abstract
:1. Introduction
2. Literature Review
2.1. The Prevailing Scenario of Greenwashing Practices Within the Context of China
2.2. Importance of Exploring the Intersection Between Greenwashing, Environmental Performance and Financial Performance
3. Hypothesis Development
3.1. The Intersection Between Greenwashing and Financial Performance
3.2. The Correlation Between Environmental Social and Governance (ESG) and Financial Performance
3.3. The Relation Between CO2 Emissions and Financial Performance
3.4. Influence of Firm Size, Board Composition, Firm Age, and Leverage on Financial Performance
3.5. Conceptual Framework
3.6. Overview of Previous Research
3.7. Research Gap
4. Method Application
4.1. Economic Method
4.2. Panel VAR Granger Causality Analysis
4.3. Data Processing
4.4. Measurement of Variables
4.4.1. Dependent Variable
4.4.2. Independent Variable
4.4.3. Control Variables
5. Findings Analysis
5.1. Descriptive Statistics
5.2. Correction Matrix
5.3. Summary Unit Root Test
5.4. VAR Lag Order Selection Criteria
5.5. PVAR/GMM Outcome
5.6. Robustness Check
5.7. VAR Pairwise Granger Causality Tests
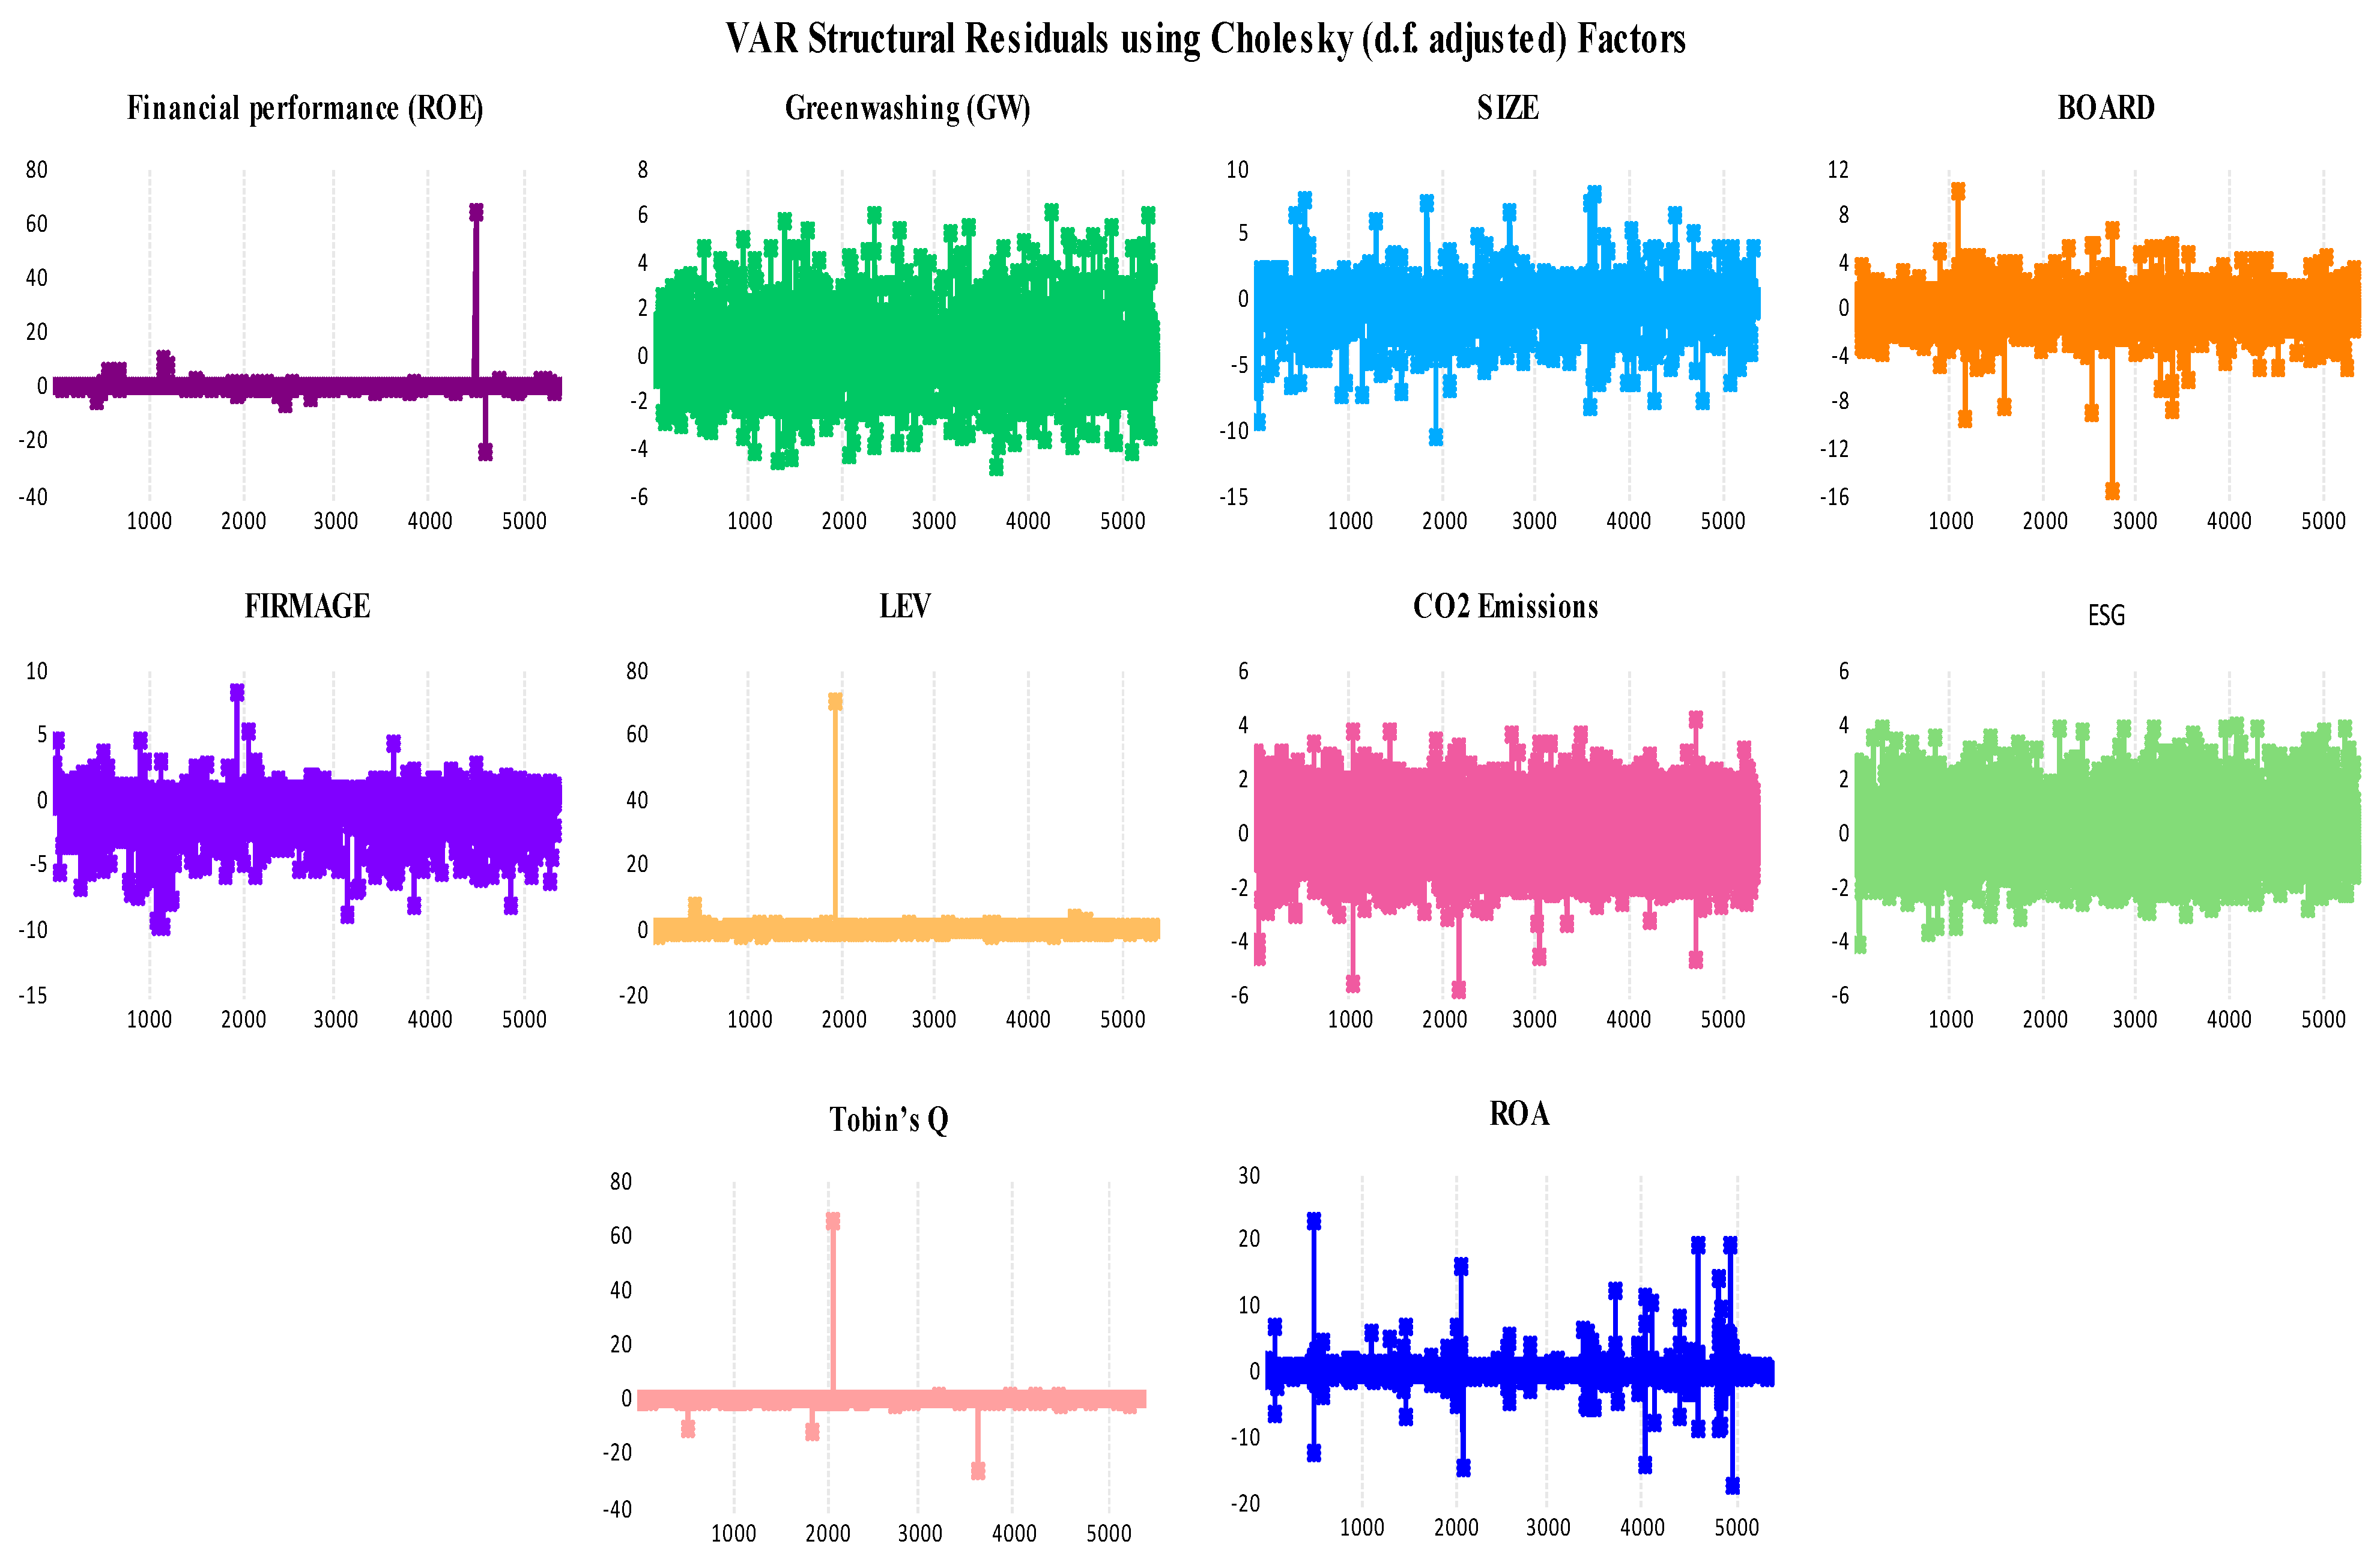
5.8. VAR Stability Test
5.9. Analysis of Impulse Response Functions
6. Discussion
6.1. Financial Performance and Firm Characteristics
6.2. Governance and Firm Structure Dynamics
6.3. ESG, CO2, and Greenwashing and Financial Outcomes
6.4. Market Valuation (Tobin’s Q) and Leverage Effects
7. Conclusions
7.1. Practical Policy Implication
7.2. Limit of the Study
7.3. Future Research Directions
Author Contributions
Funding
Institutional Review Board Statement
Informed Consent Statement
Data Availability Statement
Conflicts of Interest
References
- Chen, S.; Song, Y.; Gao, P. Environmental, social, and governance (ESG) performance and financial outcomes: Analyzing the impact of ESG on financial performance. J. Environ. Manag. 2023, 345, 118829. [Google Scholar] [CrossRef] [PubMed]
- Chiaramonte, L.; Dreassi, A.; Girardone, C.; Piserà, S. Do ESG strategies enhance bank stability during financial turmoil? Evidence from Europe. Eur. J. Financ. 2022, 28, 1173–1211. [Google Scholar] [CrossRef]
- Bambi, P.D.R.; Batatana, M.L.D.; Appiah, M.; Tetteh, D. Governance, institutions, and climate change resilience in Sub-Saharan Africa: Assessing the threshold effects. Front. Environ. Sci. 2024, 12, 1352344. [Google Scholar] [CrossRef]
- de Jong, M.D.; Huluba, G.; Beldad, A.D. Different shades of greenwashing: Consumers’ reactions to environmental lies, half-lies, and organizations taking credit for following legal obligations. J. Bus. Tech. Commun. 2020, 34, 38–76. [Google Scholar] [CrossRef]
- Yang, C.-H.; Chen, K.-H. Are small firms less efficient? Small Bus. Econ. 2009, 32, 375–395. [Google Scholar] [CrossRef]
- Pea-Assounga, J.B.B.; Yao, H.; Bahizire, G.M.; Bambi, P.D.R.; Ngapey, J.D.N. Effect of financial innovation and stakeholders’ satisfaction on investment decisions: Does internet security matter? Heliyon 2024, 10, e27242. [Google Scholar] [CrossRef]
- Boone, A.L.; Field, L.C.; Karpoff, J.M.; Raheja, C.G. The determinants of corporate board size and composition: An empirical analysis. J. Financ. Econ. 2007, 85, 66–101. [Google Scholar] [CrossRef]
- Homroy, S. GHG emissions and firm performance: The role of CEO gender socialization. J. Bank. Financ. 2023, 148, 106721. [Google Scholar] [CrossRef]
- Bambi, P.D.R.; Pea-Assounga, J.B.B. Exploring the dynamic nexus of factors shaping crop production. Renew. Sustain. Energy Rev. 2025, 210, 115162. [Google Scholar] [CrossRef]
- Issa, A. Do emissions reduction initiatives improve financial performance? Empirical analysis of moderating factors. Int. J. Account. Inf. Manag. 2024, 32, 228–257. [Google Scholar] [CrossRef]
- Trinks, A.; Mulder, M.; Scholtens, B. An efficiency perspective on carbon emissions and financial performance. Ecol. Econ. 2020, 175, 106632. [Google Scholar] [CrossRef]
- Holtz-Eakin, D.; Newey, W.; Rosen, H.S. Estimating vector autoregressions with panel data. Econom. J. Econom. Soc. 1988, 56, 1371–1395. [Google Scholar] [CrossRef]
- Arellano, M.; Bover, O. Another look at the instrumental variable estimation of error-components models. J. Econom. 1995, 68, 29–51. [Google Scholar] [CrossRef]
- Love, I.; Zicchino, L. Financial development and dynamic investment behavior: Evidence from panel VAR. Q. Rev. Econ. Financ. 2006, 46, 190–210. [Google Scholar] [CrossRef]
- Hubert, M.; Rousseeuw, P.J.; Vanden Branden, K. ROBPCA: A new approach to robust principal component analysis. Technometrics 2005, 47, 64–79. [Google Scholar] [CrossRef]
- Knez, P.J.; Ready, M.J. On the robustness of size and book-to-market in cross-sectional regressions. J. Financ. 1997, 52, 1355–1382. [Google Scholar]
- Granger, C.W. Investigating causal relations by econometric models and cross-spectral methods. Econom. J. Econom. Soc. 1969, 37, 424–438. [Google Scholar] [CrossRef]
- Chen, Z.; Xie, G. ESG disclosure and financial performance: Moderating role of ESG investors. Int. Rev. Financ. Anal. 2022, 83, 102291. [Google Scholar] [CrossRef]
- Zhou, P.; Leydesdorff, L. The emergence of China as a leading nation in science. Res. Policy 2006, 35, 83–104. [Google Scholar] [CrossRef]
- Jin, X.; Li, D.D.; Wu, S. How will China shape the world economy? China Econ. Rev. 2016, 40, 272–280. [Google Scholar] [CrossRef]
- Zhang, K.-m.; Wen, Z.-g. Review and challenges of policies of environmental protection and sustainable development in China. J. Environ. Manag. 2008, 88, 1249–1261. [Google Scholar] [CrossRef]
- Liu, X.; Cifuentes-Faura, J.; Zhao, S.; Wang, L. The impact of government environmental attention on firms’ ESG performance: Evidence from China. Res. Int. Bus. Financ. 2024, 67, 102124. [Google Scholar] [CrossRef]
- Wu, T.; Wen, L.; Yi, M. Balancing growth targets and environmental regulations: An empirical analysis of dual policy impact on corporate environmental responsibility–insights from China. J. Environ. Manag. 2024, 355, 120500. [Google Scholar] [CrossRef]
- Li, Y.; Zhang, X.; Yao, T.; Sake, A.; Liu, X.; Peng, N. The developing trends and driving factors of environmental information disclosure in China. J. Environ. Manag. 2021, 288, 112386. [Google Scholar] [CrossRef] [PubMed]
- Xu, T.; Sun, Y.; He, W. Government digitalization and corporate greenwashing. J. Clean. Prod. 2024, 452, 142015. [Google Scholar] [CrossRef]
- Modell, S.; Yang, C. Financialisation as a strategic action field: An historically informed field study of governance reforms in Chinese state-owned enterprises. Crit. Perspect. Account. 2018, 54, 41–59. [Google Scholar] [CrossRef]
- Delmas, M.A.; Burbano, V.C. The drivers of greenwashing. Calif. Manag. Rev. 2011, 54, 64–87. [Google Scholar] [CrossRef]
- Lyon, T.P.; Montgomery, A.W. The means and end of greenwash. Organ. Environ. 2015, 28, 223–249. [Google Scholar] [CrossRef]
- Bhattacharya, C.B.; Korschun, D.; Sen, S. Strengthening stakeholder–company relationships through mutually beneficial corporate social responsibility initiatives. J. Bus. Ethics 2009, 85, 257–272. [Google Scholar] [CrossRef]
- Liang, Y.; Gao, X. Greenwashing and financial performance in public health firms: The mechanism of organizational legitimacy erosion. Front. Public Health 2025, 13, 1565703. [Google Scholar] [CrossRef] [PubMed]
- Li, W.; Li, W.; Seppänen, V.; Koivumäki, T. Effects of greenwashing on financial performance: Moderation through local environmental regulation and media coverage. Bus. Strategy Environ. 2023, 32, 820–841. [Google Scholar] [CrossRef]
- Liu, X.; Wang, C.; Wang, X. Greenwashing and corporate market power. J. Clean. Prod. 2025, 486, 144486. [Google Scholar] [CrossRef]
- Zhang, K.; Pan, Z.; Janardhanan, M.; Patel, I. Relationship analysis between greenwashing and environmental performance. Environ. Dev. Sustain. 2023, 25, 7927–7957. [Google Scholar] [CrossRef]
- Ali, S.; Zahid, R.M.A.; Battisti, E.; Vincurova, Z. Environmental innovation and corporate financial performance: The moderating role of greenwashing. Int. J. Emerg. Mark. 2025. ahead-of-print. [Google Scholar] [CrossRef]
- Teichmann, F.M.J.; Wittmann, C.; Sergi, B.S.S. What are the consequences of corporate greenwashing? A look into the consequences of greenwashing in consumer and financial markets. J. Inf. Commun. Ethics Soc. 2023, 21, 290–301. [Google Scholar] [CrossRef]
- Teti, E.; Etro, L.L.; Pausini, L. Does greenwashing affect Company’s stock Price? Evidence from Europe. Int. Rev. Financ. Anal. 2024, 93, 103195. [Google Scholar] [CrossRef]
- Xia, F.; Chen, J.; Yang, X.; Li, X.; Zhang, B. Financial constraints and corporate greenwashing strategies in China. Corp. Soc. Responsib. Environ. Manag. 2023, 30, 1770–1781. [Google Scholar] [CrossRef]
- Sun, Y.; Shi, B. Impact of Greenwashing Perception on Consumers’ Green Purchasing Intentions: A Moderated Mediation Model. Sustainability 2022, 14, 12119. [Google Scholar] [CrossRef]
- Oppong-Tawiah, D.; Webster, J. Corporate Sustainability Communication as ‘Fake News’: Firms’ Greenwashing on Twitter. Sustainability 2023, 15, 6683. [Google Scholar] [CrossRef]
- Freeman, R.E.; Phillips, R.A. Stakeholder theory: A libertarian defense. Bus. Ethics Q. 2002, 12, 331–349. [Google Scholar] [CrossRef]
- Barney, J. Firm resources and sustained competitive advantage. J. Manag. 1991, 17, 99–120. [Google Scholar] [CrossRef]
- Hwang, J.; Kim, H.; Jung, D. The effect of ESG activities on financial performance during the COVID-19 pandemic—Evidence from Korea. Sustainability 2021, 13, 11362. [Google Scholar] [CrossRef]
- Eccles, R.G.; Serafeim, G.; Krzus, M.P. Market interest in nonfinancial information. J. Appl. Corp. Financ. 2011, 23, 113–127. [Google Scholar] [CrossRef]
- Dewi, N.C.; Surasmi, I.A.; Saputra, K.A.K. The Influence of Environmental, Social, and Governance (ESG) Disclosure on Financial Performance. Int. J. Environ. Sustain. Soc. Sci. 2025, 6, 149–161. [Google Scholar] [CrossRef]
- Yanto, S.Y.; Sari, P.I. The Analysis of the Influence of ESG Score and Digital Financial Literacy on Company Financial Performance with Corporate Risk-Taking as a Mediating Variable: Analysis of the Influence of ESG Score and Digital Financial Literacy on Company Financial Performance with Corporate Risk-Taking as a Mediating Variable. Rec. Manag. Syst. J. 2025, 3, 1–10. [Google Scholar]
- Ali, N.B.M.; Ali Hussin, H.A.A.; Mohammed, H.M.F.; Mohmmed, K.A.A.H.; Almutiri, A.A.S.; Ali, M.A. The Effect of Environmental, Social, and Governance (ESG) Disclosure on the Profitability of Saudi-Listed Firms: Insights from Saudi Vision 2030. Sustainability 2025, 17, 2977. [Google Scholar] [CrossRef]
- Rahman, M.J.; Rana, T.; Zhu, H.; He, H. The Impact of Corporate ESG Performance on Financial Performance. In Environmental, Social and Governance Accounting and Auditing; Routledge: Oxfordshire, UK, 2025; pp. 91–107. [Google Scholar]
- Candio, P. The effect of ESG and CSR attitude on financial performance in Europe: A quantitative re-examination. J. Environ. Manag. 2024, 354, 120390. [Google Scholar] [CrossRef] [PubMed]
- Nirino, N.; Santoro, G.; Miglietta, N.; Quaglia, R. Corporate controversies and company’s financial performance: Exploring the moderating role of ESG practices. Technol. Forecast. Soc. Change 2021, 162, 120341. [Google Scholar] [CrossRef]
- DasGupta, R. Financial performance shortfall, ESG controversies, and ESG performance: Evidence from firms around the world. Financ. Res. Lett. 2022, 46, 102487. [Google Scholar] [CrossRef]
- Bambi, P.D.R.; Pea-Assounga, J.B.B. Assessing the influence of land use, agricultural, industrialization, CO2 emissions, and energy intensity on cereal production. J. Environ. Manag. 2024, 370, 122612. [Google Scholar] [CrossRef]
- Pea-Assounga, J.B.B.; Bambi, P.D.R.; Jafarzadeh, E.; Ngapey, J.D.N. Investigating the impact of crude oil prices, CO2 emissions, renewable energy, population growth, trade openness, and FDI on sustainable economic growth. Renew. Energy 2025, 241, 122353. [Google Scholar] [CrossRef]
- Sariannidis, N.; Zafeiriou, E.; Giannarakis, G.; Arabatzis, G. CO2 Emissions and Financial Performance of Socially Responsible Firms: An Empirical Survey. Bus. Strategy Environ. 2013, 22, 109–120. [Google Scholar] [CrossRef]
- Matsumura, E.M.; Prakash, R.; Vera-Muñoz, S.C. Firm-value effects of carbon emissions and carbon disclosures. Account. Rev. 2014, 89, 695–724. [Google Scholar] [CrossRef]
- Delmas, M.A.; Nairn-Birch, N.; Lim, J. Dynamics of environmental and financial performance: The case of greenhouse gas emissions. Organ. Environ. 2015, 28, 374–393. [Google Scholar] [CrossRef]
- Lee, J.-H.; Cho, J.-H. Firm-value effects of carbon emissions and carbon disclosures—Evidence from korea. Int. J. Environ. Res. Public health 2021, 18, 12166. [Google Scholar] [CrossRef]
- Al-Hashimy, H.N.H. The relationship between financial management strategies and firm financial performance: The moderating role of firm size. J. Financ. Manag. Prop. Constr. 2025. ahead-of-print. [Google Scholar] [CrossRef]
- Kijkasiwat, P.; Phuensane, P. Innovation and firm performance: The moderating and mediating roles of firm size and small and medium enterprise finance. J. Risk Financ. Manag. 2020, 13, 97. [Google Scholar] [CrossRef]
- Moeller, S.B.; Schlingemann, F.P.; Stulz, R.M. Firm size and the gains from acquisitions. J. Financ. Econ. 2004, 73, 201–228. [Google Scholar] [CrossRef]
- Khan, I.; Saha, A.K.; Kamal, Y.; Islam, M.S. Do ownership structure and board composition matter in firm performance? Regulatory influence in developing economy. Int. J. Discl. Gov. 2025, 22, 263–283. [Google Scholar] [CrossRef]
- Al-Shaer, H.; Kuzey, C.; Uyar, A.; Karaman, A.S. Corporate strategy, board composition, and firm value. Int. J. Financ. Econ. 2024, 29, 3177–3202. [Google Scholar] [CrossRef]
- Bhagat, S.; Bolton, B. Corporate governance and firm performance. J. Corp. Financ. 2008, 14, 257–273. [Google Scholar] [CrossRef]
- Amanamah, R. The Impact of Firm Age on Independent Audit Committee and Voluntary Disclosure Quality. Afr. J. Appl. Res. 2025, 11, 228–256. [Google Scholar] [CrossRef]
- Matemilola, B.T.; Kijkasiwat, P.; Liew, C.Y. The moderating effect of firm age on capital structure choices: Evidence from emerging markets. J. Ind. Bus. Econ. 2025, 52, 177–199. [Google Scholar] [CrossRef]
- Coad, A.; Holm, J.R.; Krafft, J.; Quatraro, F. Firm age and performance. J. Evol. Econ. 2018, 28, 1–11. [Google Scholar] [CrossRef]
- Rossi, M. The impact of age on firm performance: A literature review. Corp. Ownersh. Control 2016, 13, 217–223. [Google Scholar] [CrossRef]
- Enekwe, C.I.; Agu, C.I.; Eziedo, K.N. The effect of financial leverage on financial performance: Evidence of quoted pharmaceutical companies in Nigeria. IOSR J. Econ. Financ. 2014, 5, 17–25. [Google Scholar]
- Rehman, S. Relationship between financial leverage and financial performance: Empirical evidence of listed sugar companies of Pakistan. Glob. J. Manag. Bus. Res. 2013, 13, 45–53. [Google Scholar]
- Ghardallou, W. The heterogeneous effect of leverage on firm performance: A quantile regression analysis. Int. J. Islam. Middle East. Financ. Manag. 2023, 16, 210–225. [Google Scholar] [CrossRef]
- Birindelli, G.; Chiappini, H.; Jalal, R.N.-U.-D. Greenwashing, bank financial performance and the moderating role of gender diversity. Res. Int. Bus. Financ. 2024, 69, 102235. [Google Scholar] [CrossRef]
- Ioannou, I.; Kassinis, G.; Papagiannakis, G. The Impact of Perceived Greenwashing on Customer Satisfaction and the Contingent Role of Capability Reputation. J. Bus. Ethics 2023, 185, 333–347. [Google Scholar] [CrossRef]
- Pimonenko, T.; Bilan, Y.; Horák, J.; Starchenko, L.; Gajda, W. Green Brand of Companies and Greenwashing under Sustainable Development Goals. Sustainability 2020, 12, 1679. [Google Scholar] [CrossRef]
- Zhang, D. Environmental regulation and firm product quality improvement: How does the greenwashing response? Int. Rev. Financ. Anal. 2022, 80, 102058. [Google Scholar] [CrossRef]
- Purnamasari, P.; Umiyati, I. Greenwashing and financial performance of firms: The moderating role of internal audit quality and digital technologies. Cogent Bus. Manag. 2024, 11, 2404236. [Google Scholar] [CrossRef]
- Lee, M.T.; Raschke, R.L. Stakeholder legitimacy in firm greening and financial performance: What about greenwashing temptations? J. Bus. Res. 2023, 155, 113393. [Google Scholar] [CrossRef]
- Chen, P.; Dagestani, A.A. Greenwashing behavior and firm value—From the perspective of board characteristics. Corp. Soc. Responsib. Environ. Manag. 2023, 30, 2330–2343. [Google Scholar] [CrossRef]
- Zhang, D. Does green finance really inhibit extreme hypocritical ESG risk? A greenwashing perspective exploration. Energy Econ. 2023, 121, 106688. [Google Scholar] [CrossRef]
- Shi, X.; Ma, J.; Jiang, A.; Wei, S.; Yue, L. Green bonds: Green investments or greenwashing? Int. Rev. Financ. Anal. 2023, 90, 102850. [Google Scholar] [CrossRef]
- Blundell, R.; Bond, S. Initial conditions and moment restrictions in dynamic panel data models. J. Econom. 1998, 87, 115–143. [Google Scholar] [CrossRef]
- Albuquerque, R.; Koskinen, Y.; Zhang, C. Corporate social responsibility and firm risk: Theory and empirical evidence. Manag. Sci. 2019, 65, 4451–4469. [Google Scholar] [CrossRef]
- Brealey, R.A.; Myers, S.C.; Marcus, A.J. Fundamentals of Corporate Finance; McGraw-Hill: New York, NY, USA, 2023. [Google Scholar]
- Loderer, C.; Stulz, R.; Waelchli, U. Firm rigidities and the decline in growth opportunities. Manag. Sci. 2017, 63, 3000–3020. [Google Scholar] [CrossRef]


| Authors | Study Period and Country | Methods | Main Findings |
|---|---|---|---|
| [70] | From 2013 to 2020 77 European-listed banks | Feasible generalized least squares (FGLS) | GW negatively affects bank performance. |
| [33] | From 2010 to 2018 Listed companies in China | D-K (Driscoll–Kraay) standard error method | Negative correlation between environmental performance and greenwashing. |
| [71] | From 2008–2016 U.S. companies | GMM | A firm’s capability reputation has a negative effect of greenwashing on customer satisfaction. |
| [72] | From 2014 to 2017 Ukrainian large industrial companies | Partial least-squares structural equation modeling (PLS-PM) | One point increase in greenwashing leads to a 0.56-point decline in the company’s green brand with a load factor of 0.78. |
| [73] | From 2013 and 2015 Chinese-listed firms | D-K (Driscoll–Kraay) | Greenwashing strongly motivates heavy-pollution firms and results in decreasing product quality. |
| [74] | From 2018 to 2022 Indonesian firms | GMM | GW has a significant positive effect on financial performance. |
| [75] | From 2015 to 2021 39 firms | Partial least squares structural equation modeling (PLS-SEM) | ESG performance has a direct and positive affect on firm net profit margin. GW is not associated with firm net profit margin. |
| [38] | From 18 to 55 years old 220 online questionnaires Changsha, China | Stepwise regression | Consumers’ greenwashing perception negatively influences consumers’ green purchasing intentions. |
| [76] | 2018 to 2022 Chinese firm | Two-way fixed effects model | Greenwashing increases firm value. |
| [77] | From 2014 to 2020 Chinese-listed firm | Partial least squares structural equation modeling (PLS-SEM) | Green finance motivates ESG performance by mitigating firms’ reactions in alleviating greenwashing. |
| [78] | From 2013 to 2020 Chinese A-share listed companies | Parallel trend test | Issuance of corporate green bonds leads to an increase in the number of green patent applications. |
| [37] | From 2017 to 2018 Chinese-listed companies | D-K (Driscoll–Kraay) | Greenwashing is widespread, and only 13.6% of environmental penalties have been disclosed by companies. |
| Variables | Symbols | Definition of Variables | Source |
|---|---|---|---|
| “Return on Equity” | ROE | “Relate is a financial ratio that measures a company’s profitability about its shareholders’ equity. It is a key indicator of a company’s financial performance and its ability to generate a return for its shareholders.” | CNRDS |
| “Market value” | Tobin’s Q | “Measured as the ratio of the market value of a firm’s assets (calculated as the market value of equity plus the book value of total liabilities) to the book value of the firm’s total assets.” | CNRDS |
| “Return on Asset” | ROA | “Measured as the ratio of net income to total assets, indicating how efficiently a company utilizes its assets to generate profit.” | CNRDS |
| “Green Washing” | GW | “Refers to a firm’s peer-relative greenwashing score = (a normalized measure representing a firm’s relative position to its peers in the distribution of the Bloomberg Environment disclosure score)—(a normalized measure representing a firm’s relative position to its peers in the distribution of Refinitiv Environmental performance score).” | Bloomberg |
| “Environmental Performance” | ESG | “Evaluating the company’s sustainability practices.” | CNRDS |
| “Firm size | Size | “Measure as the natural logarithm of total assets (SIZE) as a proxy of firm size.” | CNRDS |
| “Board” | Board | “Measure as the total count of board directors, reflecting the governance structure.” | |
| “Firm age” | FA | “Refers to the number of years since the company’s establishment to the present day, reflecting organizational longevity.” | CNRDS |
| “Leverage” | Lev | “Determined as the ratio of total liabilities to total assets, assessing financial risk.” | CNRDS |
| “Carbon Emission” | CO2 | “Represent the overall carbon footprint of Chinese-listed firms.’’ | CNRDS |
| Variables | ROE | GW | FS | Board | FA | LEV | CO2 | ESG | Tobin’s Q | ROA |
|---|---|---|---|---|---|---|---|---|---|---|
| Mean | 0.081133 | 10.70570 | 21.95452 | 2.173519 | 2.879344 | 0.850072 | 31.48236 | 25.57037 | 0.038426 | 0.508477 |
| Median | 0.057761 | 5.328800 | 21.81379 | 2.197225 | 2.995732 | 0.538946 | 29.90740 | 23.74920 | 0.037759 | 0.004700 |
| Maximum | 221.4053 | 90.07250 | 29.30278 | 2.944439 | 3.806663 | 877.2559 | 91.01890 | 79.32240 | 62.78953 | 36.84670 |
| Minimum | −85.64680 | 0.000000 | 12.31425 | 0.000000 | 0.693147 | −0.194698 | 0.000000 | 0.047400 | −24.97394 | 0.000000 |
| Std. Dev. | 3.455447 | 13.51201 | 1.659942 | 0.239986 | 0.445408 | 12.34161 | 11.50289 | 9.821334 | 0.957724 | 2.828014 |
| Skewness | 46.85105 | 2.152137 | 0.383712 | −0.618017 | −0.889733 | 67.52484 | 0.765386 | 0.873980 | 49.15154 | 8.794416 |
| Kurtosis | 3233.471 | 7.741389 | 4.431052 | 7.681254 | 3.789215 | 4771.421 | 4.207787 | 3.945280 | 3569.676 | 91.36242 |
| Jarque–Bera | 2.32 × 10⁹ | 9115.637 | 586.1497 | 5210.944 | 842.3424 | 5.06 × 10⁹ | 845.1557 | 877.8117 | 2.81 × 10⁹ | 1793920 |
| “Probability” | 0.000000 | 0.000000 | 0.000000 | 0.000000 | 0.000000 | 0.000000 | 0.000000 | 0.000000 | 0.000000 | 0.000000 |
| “Obs” | 5335 | 5335 | 5335 | 5335 | 5335 | 5335 | 5335 | 5335 | 5335 | 5335 |
| Variables | (1) | (2) | (3) | (4) | (5) | (6) | (7) | (8) | 9 | 10 |
|---|---|---|---|---|---|---|---|---|---|---|
| (1) ROE | 1.0000 | |||||||||
| (2) GW | −0.0256 | 1.0000 | ||||||||
| (3) FS | 0.0003 | 0.0136 | 1.0000 | |||||||
| (4) Board | −0.0037 | 0.0290 | 0.2143 | 1.0000 | ||||||
| (5) FA | −0.0078 | 0.0071 | 0.3701 | −0.0823 | 1.0000 | |||||
| (6) LEV | −0.0413 | 0.0254 | −0.1139 | 0.0016 | 0.0024 | 1.0000 | ||||
| (7) CO2 | −0.0141 | −0.1272 | 0.0354 | 0.0219 | −0.0081 | −0.0062 | 1.0000 | |||
| (8) ESG | −0.0288 | 0.5913 | 0.0288 | 0.0333 | −0.0180 | 0.0060 | 0.3489 | 1.0000 | ||
| (9) Tobin’s Q | 0.0059 | 0.0341 | −0.0107 | 0.0142 | 0.0003 | 0.0045 | 0.0080 | 0.0147 | 1.0000 | |
| (10) ROA | −0.0312 | 0.0448 | 0.1226 | −0.0398 | 0.1102 | −0.0042 | 0.0007 | 0.0290 | −0.0003 | 1.0000 |
| Series | Level | 1st ∆ |
|---|---|---|
| “LLC” | 0.0000 (−73.5236) | 1.0000 (71.9348) |
| “IPS” | 0.0000 (−71.4952) | 0.0000 (−66.4403) |
| “ADF-Fisher” | 0.0000 (991.845) | 0.0000 (1571.93) |
| “PP-Fisher” | 0.0000 (726.286) | 0.0000 (110.524) |
| “Lag” | “LogL” | “LR” | “FPE” | “AIC” | “SC” | “HQ” |
|---|---|---|---|---|---|---|
| 0 | −107673.1 | NA | 47675926 | 40.38295 | 40.39283 | 40.38640 |
| 1 | −96030.88 | 23245.23 | 620212.4 | 36.04083 | 36.12969 | 36.07188 |
| 2 | −95505.61 | 1047.195 * | 521690.4 * | 35.86785 * | 36.03569 * | 35.92648 * |
| Items | ROE | GW | Size | Board | Firm Age | Lev | CO2 | ESG | Tobin’s Q | ROA |
| ROE(−1) | 0.009109 | −0.018193 | −0.005053 | −0.001275 | 0.002771 | 0.029491 | −0.004324 | 0.024408 | −0.001156 | 0.021166 |
| (0.01379) | (0.04370) | (0.00320) | (0.00067) | (0.00119) | (0.04951) | (0.03601) | (0.03160) | (0.00386) | (0.00609) | |
| [0.66042] | [−0.41628] | [−1.57896] | [−1.91629] | [2.32701] | [0.59561] | [−0.12005] | [0.77236] | [−0.29975] | [3.47516] | |
| GW(−1) | −0.005081 | 0.482588 | 0.000857 | 0.000264 | 0.000657 | 0.001809 | −0.026696 | −0.011642 | 0.003352 | −0.002662 |
| (0.00451) | (0.01428) | (0.00105) | (0.00022) | (0.00039) | (0.01618) | (0.01442) | (0.01032) | (0.00126) | (0.00199) | |
| [−1.12760] | [33.7976] | [0.81940] | [1.21342] | [1.68879] | [0.11180] | [−1.85194] | [−1.12756] | [2.66084] | [−1.33763] | |
| Size(−1) | 0.019084 | −0.132858 | 0.886435 | 0.011575 | −0.014813 | −0.295224 | 0.108177 | 0.018811 | 0.001600 | −0.027222 |
| (0.03229) | (0.10233) | (0.00749) | (0.00156) | (0.00279) | (0.11593) | (0.19860) | (0.07399) | (0.00903) | (0.01426) | |
| [0.59096] | [−1.29836] | [118.295] | [7.42984] | [−5.31378] | [−2.54664] | [0.54469] | [0.25424] | [0.17727] | [−1.90894] | |
| Board(−1) | 0.003608 | 0.318267 | 0.098806 | 0.688781 | 0.019831 | 0.895655 | 0.087888 | 0.576194 | 0.030407 | −0.019204 |
| (0.20599) | (0.65273) | (0.04780) | (0.00994) | (0.01778) | (0.73948) | (0.74729) | (0.47198) | (0.05759) | (0.09096) | |
| [0.01751] | [0.48759] | [2.06710] | [69.3131] | [1.11520] | [1.21119] | [0.11761] | [1.22081] | [0.52801] | [−0.21112] | |
| Firmage(−1) | −0.079739 | −0.220797 | −0.121323 | −0.036328 | 0.761915 | 0.405903 | −0.081461 | −0.477475 | −0.001588 | 0.052495 |
| (0.11686) | (0.37029) | (0.02712) | (0.00564) | (0.01009) | (0.41950) | (0.52543) | (0.26775) | (0.03267) | (0.05160) | |
| [−0.68235] | [−0.59628] | [−4.47419] | [−6.44426] | [75.5287] | [0.96759] | [−0.15504] | [−1.78330] | [−0.04861] | [1.01731] | |
| Lev(−1) | −2.70 × 10⁻⁵ | −0.017105 | 0.001854 | 0.000102 | −7.73 × 10⁻⁵ | 0.106808 | −0.012866 | −0.000870 | −0.000659 | −0.000310 |
| (0.00385) | (0.01219) | (0.00089) | (0.00019) | (0.00033) | (0.01381) | (0.01039) | (0.00882) | (0.00108) | (0.00170) | |
| [−0.00702] | [−1.40296] | [2.07660] | [0.54752] | [−0.23272] | [7.73254] | [−1.23885] | [−0.09869] | [−0.61259] | [−0.18258] | |
| CO2(−1) | −0.000789 | −0.038087 | −0.000612 | −0.000284 | −0.000121 | −0.001694 | 0.491314 | 0.086241 | 0.000130 | −0.003208 |
| (0.00514) | (0.01628) | (0.00119) | (0.00025) | (0.00044) | (0.01844) | (0.01524) | (0.01177) | (0.00144) | (0.00227) | |
| [−0.15353] | [−2.33946] | [−0.51322] | [−1.14611] | [−0.27203] | [−0.09183] | [32.2320] | [7.32602] | [0.09036] | [−1.41403] | |
| ESG(−1) | 0.001486 | 0.235671 | 0.002342 | 0.000199 | −0.000231 | 0.037680 | 0.171138 | 0.521143 | −0.001879 | 0.008319 |
| (0.00808) | (0.02561) | (0.00188) | (0.00039) | (0.00070) | (0.02901) | (0.02340) | (0.01852) | (0.00226) | (0.00357) | |
| [0.18385] | [9.20212] | [1.24866] | [0.50946] | [−0.33145] | [1.29867] | [7.31247] | [28.1419] | [−0.83141] | [2.33084] | |
| Tobin’s Q(−1) | 0.016606 | 0.365388 | 0.071996 | 0.000586 | −0.001671 | −0.088510 | 0.395744 | 0.305424 | 0.004118 | −0.020728 |
| (0.04929) | (0.15619) | (0.01144) | (0.00238) | (0.00426) | (0.17695) | (0.14273) | (0.11294) | (0.01378) | (0.02177) | |
| [0.33690] | [2.33936] | [6.29449] | [0.24657] | [−0.39269] | [−0.50020] | [2.77263] | [2.70433] | [0.29882] | [−0.95230] | |
| ROA(−1) | −0.042965 | 0.103166 | 0.000165 | −0.002434 | 0.000858 | −0.002589 | 0.000571 | 0.064074 | −0.000668 | 0.843210 |
| (0.01691) | (0.05357) | (0.00392) | (0.00082) | (0.00146) | (0.06069) | (0.04895) | (0.03873) | (0.00473) | (0.00746) | |
| [−2.54156] | [1.92594] | [0.04210] | [−2.98449] | [0.58770] | [−0.04266] | [0.01166] | [1.65425] | [−0.14124] | [112.957] | |
| C | −0.067438 | 3.221099 | 2.569205 | 0.527075 | 0.969047 | 3.188436 | 9.089339 | 10.00612 | −0.048374 | 0.455459 |
| (0.72360) | (2.29285) | (0.16790) | (0.03491) | (0.06246) | (2.59757) | (2.09527) | (1.65791) | (0.20229) | (0.31952) | |
| [−0.09320] | [1.40485] | [15.3015] | [15.0996] | [15.5137] | [1.22747] | [4.33804] | [6.03539] | [−0.23913] | [1.42543] |
| Variable | Coefficient | Std. Error | Z-Statistic | Prob. |
|---|---|---|---|---|
| GW | −7.13 × 10⁻⁶ | 0.000104 | −0.068371 | 0.9455 |
| Size | 0.012929 | 0.000746 | 17.33918 | 0.0000 |
| Board | 0.019667 | 0.004760 | 4.131375 | 0.0000 |
| Firm age | −0.014466 | 0.002703 | −5.351865 | 0.0000 |
| Lev | 0.000694 | 8.91 × 10⁻⁵ | 7.789811 | 0.0000 |
| CO2 | −6.77 × 10⁻⁵ | 0.000119 | −0.569734 | 0.5689 |
| ESG | 0.000198 | 0.000187 | 1.060713 | 0.2888 |
| Tobin’s Q | 0.018764 | 0.001142 | 16.43331 | 0.0000 |
| ROA | 0.001599 | 0.000391 | 4.085393 | 0.0000 |
| C | −0.224185 | 0.016702 | −13.42275 | 0.0000 |
| Null Hypothesis | Causal Direction | F-Statistic | Prob. |
|---|---|---|---|
| “GW does not Granger Cause ROE” | No Causal Direction | 1.17930 | 0.3076 |
| “ROE does not Granger Cause GW” | 0.32972 | 0.7191 | |
| “Firm size does not Granger Cause ROE” | Unidirectional Causality | 0.11454 | 0.8918 |
| “ROE does not Granger Cause Firm size” | 16.8121 | 5 × 10⁻⁸ | |
| “Board does not Granger Cause ROE” | No Causal Direction | 0.39865 | 0.6712 |
| “ROE does not Granger Cause Board” | 2.03115 | 0.1313 | |
| “Firmage does not Granger Cause ROE” | Unidirectional Causality | 0.74121 | 0.4766 |
| “ROE does not Granger Cause Firmage” | 2.93564 | 0.0532 | |
| “LEV does not Granger Cause ROE” | Unidirectional Causality | 0.00772 | 0.9923 |
| “ROE does not Granger Cause LEV” | 38.5907 | 2 × 10⁻¹⁷ | |
| “CO2 does not Granger Cause ROE” | No Causal Direction | 0.22339 | 0.7998 |
| “ROE does not Granger Cause CO2” | 0.00948 | 0.9906 | |
| “ESG does not Granger Cause ROE” | No Causal Direction | 0.45039 | 0.6374 |
| “ROE does not Granger Cause ESG” | 0.80649 | 0.4465 | |
| “Tobin’s Q does not Granger Cause ROE” | Unidirectional Causality | 0.03860 | 0.9621 |
| “ROE does not Granger Cause Tobin’s Q” | 2.81038 | 0.0603 | |
| “ROA does not Granger Cause ROE” | Bidirectional Causality | 3.89786 | 0.0203 |
| “ROE does not Granger Cause ROA” | 5.63176 | 0.0036 |
Disclaimer/Publisher’s Note: The statements, opinions and data contained in all publications are solely those of the individual author(s) and contributor(s) and not of MDPI and/or the editor(s). MDPI and/or the editor(s) disclaim responsibility for any injury to people or property resulting from any ideas, methods, instructions or products referred to in the content. |
© 2025 by the authors. Licensee MDPI, Basel, Switzerland. This article is an open access article distributed under the terms and conditions of the Creative Commons Attribution (CC BY) license (https://creativecommons.org/licenses/by/4.0/).
Share and Cite
Sidney, M.T.; Liao, G. Deciphering the Intricate Influence of Greenwashing and Environmental Performance on Financial Outcome Through Panel VAR/GMM Analysis. Sustainability 2025, 17, 3906. https://doi.org/10.3390/su17093906
Sidney MT, Liao G. Deciphering the Intricate Influence of Greenwashing and Environmental Performance on Financial Outcome Through Panel VAR/GMM Analysis. Sustainability. 2025; 17(9):3906. https://doi.org/10.3390/su17093906
Chicago/Turabian StyleSidney, Mangenda Tshiaba, and Gaoke Liao. 2025. "Deciphering the Intricate Influence of Greenwashing and Environmental Performance on Financial Outcome Through Panel VAR/GMM Analysis" Sustainability 17, no. 9: 3906. https://doi.org/10.3390/su17093906
APA StyleSidney, M. T., & Liao, G. (2025). Deciphering the Intricate Influence of Greenwashing and Environmental Performance on Financial Outcome Through Panel VAR/GMM Analysis. Sustainability, 17(9), 3906. https://doi.org/10.3390/su17093906