Article

Impact of Income Inequality on Carbon Emission Efficiency: Evidence from China

School of Management, China University of Mining and Technology-Beijing, Beijing 100083, China
*
Author to whom correspondence should be addressed.
Sustainability 2025, 17(9), 3930; https://doi.org/10.3390/su17093930
Submission received: 25 March 2025 / Revised: 16 April 2025 / Accepted: 23 April 2025 / Published: 27 April 2025

Abstract

:
Alleviating income inequality and improving carbon emission efficiency are essential objective functions of China’s economic transformation and development, and there is an internal connection between them that cannot be ignored. This analysis adopts a fixed-effects model consisting of data from 30 provincial-level regions in China from 2013 to 2022, combined with the adjustment effect and threshold effect models, to empirically test the proposed theoretical hypothesis. The study found the following: (1) Rising income inequality significantly inhibits carbon emission efficiency. (2) Increasing population aging will strengthen the negative correlation between income inequality and carbon emission efficiency. (3) An increase in economic growth will weaken the negative correlation between income inequality and carbon emission efficiency. (4) Due to population aging and economic growth, a non-linear threshold exists between income inequality and carbon emission efficiency. The research provides decision-making references for coordinating the high-quality development of the regional economy.

1. Introduction

With the rapid development of the economy, China has become the world’s largest energy consumer, and carbon emissions continue to rise; under the “double carbon” goal and sustainable development strategy, carbon emission efficiency needs to be improved. Data from the National Bureau of Statistics show that since 2009, China has become the world’s largest energy consumer, and the total energy consumption in 2024 has reached 5.96 billion tons of standard coal, an increase of 4.20%. At the same time, due to the limitation of resource endowment, China’s energy consumption structure has long been dominated by fossil energy represented by coal, and carbon emissions have also increased significantly in parallel with rapid economic development. According to the First Biennial Transparency Report on Climate Change of the People’s Republic of China, China’s total greenhouse gas emissions in 2021 were about 12.42 billion tons of carbon dioxide equivalent, an increase of 67.39 percent over 2005 (7.42 billion tons of carbon dioxide equivalent). The economic growth brought by unit carbon emission is usually measured by carbon emission efficiency. Amid global decarbonization trends and China’s carbon neutrality pledge, improving carbon emission efficiency is a vital connotation and target for achieving high-quality economic transformation and sustainable development [1].
With the economy undergoing rapid growth, China’s economy has developed rapidly since the reform and opening up, and people’s living standards have improved significantly. However, the issue of income inequality persists conspicuously. Alleviating income inequality is essential to achieving high-quality economic development and Chinese-style modernization. China’s economy has achieved “miracle” growth since the reform and opening up, the fight against poverty has achieved significant victories, and residents’ living standards have continued to improve. However, insufficient and unbalanced factors still exist, and income inequality is essential to their embodiment [2]. The latest data released by the National Bureau of Statistics show that as of 2022, China’s Gini coefficient is 0.47, which is still above the international warning line of 0.4, and the problem of income inequality has not been substantively solved [3]. General Secretary Xi Jinping stressed that the core of achieving high-quality economic development and Chinese-style modernization is promoting shared prosperity for all people. Based on promoting higher quality, more efficient, fairer, more sustainable, and safer development of the national economy, it is necessary to promote the reform of production relations and innovation of the distribution system and promote the sharing of the fruits of development by all people [4]. Therefore, reducing income inequality is essential to achieving high-quality economic development and Chinese-style modernization.
Alleviating income inequality and improving carbon emission efficiency, as essential objective functions of China’s economic transformation and development, may have an internal connection between them that cannot be ignored. On the one hand, from a micro perspective, when income inequality increases, the proportion of low-income people increases. Under survival pressure, low-income people may sacrifice the environment to improve their living standards, which might compromise the enhancement of carbon emission efficiency. At the same time, increasing income inequality may also reduce individuals’ sense of social responsibility, negatively impacting residents’ participation in environmental protection [5]. On the other hand, from a macro perspective, when income inequality increases, the government may be forced to relax the control on carbon emissions under the pressure of economic development to alleviate income inequality, which may affect the decline in carbon emission efficiency [6].
The existing literature offers a comprehensive exploration of how income inequality relates to carbon emissions and is primarily divided into two categories. From the perspective of domestic literature, Zhang et al. [7] established a spatial Durbin model to examine the impact and mechanisms of income inequality on carbon emissions at the provincial level in China from 2005 to 2017. The results indicate a significant ‘U’-shaped relationship between income inequality and carbon emissions. Zou et al. [8] conducted a study based on panel data from 13 cities in the Beijing-Tianjin-Hebei region from 2006 to 2019, employing a spatial Durbin model. The results indicate an “inverted U-shaped” relationship between urban–rural income inequality and regional carbon emission efficiency. Regarding international literature, Jiao et al. [9] investigated the relationship between income inequality and carbon emissions in India from 1980–2018. Their analysis revealed that increasing income inequality tends to mitigate carbon emission levels. Using a group fixed-effects estimation approach, Grunewald et al. [10] discovered that the relationship between income inequality and per capita emissions depends on income levels. In low- and middle-income economies, higher income inequality correlates with lower carbon emissions, whereas in middle- and high-income economies, greater income inequality is associated with higher carbon emissions.
Among the existing studies on how income inequality affects carbon emission efficiency, domestic literature mainly discusses the impact of the urban–rural income gap on carbon emission efficiency from the perspective of mechanism. In contrast, foreign literature primarily explores how income inequality affects carbon emission efficiency on the country level. Relevant studies further point out that focusing on the impact of income inequality on carbon emission efficiency from the country level to the domestic and regional level of a country can make the research countermeasures more targeted [1]. Therefore, based on theoretical analysis and panel data of 30 provinces in China from 2013 to 2022, this paper empirically discusses the impact of income inequality on carbon emission efficiency and tests the moderating effect and threshold effect from the two dimensions of population aging and economic growth. This paper expands the mechanisms through which income inequality affects carbon emission efficiency and provides a basis for more targeted countermeasures and suggestions.
The rest of this paper is structured as follows: Section 2 elaborates the theoretical framework and develops testable hypotheses. Section 3 describes the econometric model specification and data sources. Section 4 presents the empirical findings with detailed economic interpretations. Section 5 summarizes key findings and discusses policy implications.

2. Theoretical Mechanism and Hypothesis Proposed

2.1. Analysis of the Impact of Income Inequality on Carbon Emission Efficiency

Micro-level mechanisms and macro-scale effects differentially mediate income inequality’s influence on emission efficiency. From the micro level, Boyce [11] and Torras and Boyce [5] believe that when the income gap is too large, low-income groups may be more inclined to destroy the environment to meet the basic material needs of life. High-income groups may also have environmental shortsightedness and avoid environmental regulation’s negative impact through immigration or rent seeking. Both groups are less willing to actively improve ecological quality, which is not conducive to enhancing carbon emission efficiency. Jia et al. [6] pointed out that low-income groups have relatively low willingness and ability to pay for environmentally friendly products; income inequality will increase the proportion of low-income groups, resulting in insufficient effective demand for low-carbon products in the whole society, which is not conducive to exerting the energy-saving and emission reduction effect of environmental protection innovation. Rising income inequality may also reduce individuals’ sense of social responsibility, negatively impacting residents’ participation in environmental protection.
From the macro level, in economically backward regions, residents have a relatively weak awareness of environmental protection and relatively loose environmental regulations. Under the pressure of economic development, the government may be forced to relax the control on carbon emissions, reducing carbon emission efficiency [12]. In economically developed regions, strong environmental regulations cause industries to consume more energy and transfer substantial pollution to economically backward areas [13]. Although industrial transfer can alleviate the local carbon emission pressure, it may also reduce the motivation for enterprises to engage in environmental innovation to a certain extent, which is not conducive to improving carbon emission efficiency. In addition, the widening income gap between regions is also not conducive to the positive spillover effect of production and environmental protection technologies because advanced production and environmental protection technologies need a specific economic base and human capital to play a role [14]. However, the income gap between regions is too large, so human capital is concentrated in economically developed areas, which is not conducive to the positive spillover effect of technology and will likely inhibit the improvement of carbon emission efficiency. Based on this, the following hypotheses are proposed in this paper.
Hypothesis 1.
Income inequality constrains the enhancement of carbon emission efficiency.

2.2. Analysis of the Adjustment Mechanism of Population Aging and Economic Growth

Based on the above analysis, income inequality significantly impacts carbon emission efficiency. This study further believes that the impact of income inequality on carbon emission efficiency is not homogeneous. Variations in socio-developmental factors—particularly differential levels of population aging and economic growth—can lead to divergent carbon emission efficiency outcomes even under similar income inequality conditions. Based on this, the current section will further explore the moderating effects of population aging and economic growth on how income inequality shapes carbon emission efficiency.

2.2.1. Moderating Effect of Population Aging: Population Aging Strengthens the Influence of How Income Inequality Affects Carbon Emission Efficiency

Population aging is usually expressed as the proportion of the population aged 60 or 65 years and above. According to the Ministry of Civil Affairs “2023 National Aging Cause Development Communique” and the National Bureau of Statistics, data show that by the end of 2023, the elderly aged 60 and above accounted for 21.07% of the total population, and the elderly aged 65 and above accounted for 15.37% of the total population. Our country has entered a medium-aging society, and aging continues to deepen. Generally speaking, the difference in human capital is relatively small in the early stage of a career, which gradually expands with the development of a job and the gradual accumulation of experience by different individuals until human capital exits the labor market [15]. An aging population means that the share of older people in the total population is increasing, which alters the relative population sizes across age cohorts, thereby contributing to the overall rise in income inequality. The primary income sources for the elderly population are family support and social pensions. The intensification of population aging is likely to impose more significant burdens on low-income households, potentially exacerbating existing income distribution disparities. Conversely, Zhang and Tan [16] demonstrated that individuals are less willing to incur environmental improvement costs as they age. Elderly individuals may exhibit more vigorous opposition to stringent environmental regulations because environmental quality improvement constitutes a protracted process; they are unlikely to derive immediate benefits from enhanced environmental conditions [17], which may act as a disincentive to improve carbon emission efficiency. Tong and Zhou [18] posit that compared to other age groups, the elderly population tends to have higher energy demands for heating and cooling due to declining physical functions. This leads to higher energy use, thereby reducing carbon emission efficiency. Therefore, population aging may be a moderating variable affecting how income inequality affects carbon emission efficiency.
This paper proposes the following hypothesis.
Hypothesis 2.
The increasing degree of population aging will strengthen the negative correlation between income inequality and carbon emission efficiency.

2.2.2. Moderating Effect of Economic Growth: Economic Growth Weakens the Impact of Income Inequality on Carbon Emission Efficiency

Relevant studies have pointed out that in economic growth, some people may have abundant capital, technology, and profit opportunities and thus achieve a significant increase in income level. In contrast, some people may miss profit opportunities to some extent because they do not have enough capital or technology, resulting in a relatively low income level [19]. In addition, China’s faster economic growth areas are mainly concentrated in the coastal cities; due to the vast territory and regional differences, the economic spillover effect between regions is limited, and the difference between economically developed and economically backward areas is more prominent. Thus, economic growth will likely lead to widening income inequality [6]. On the other hand, economic growth influences both external and internal determinants of carbon emission efficiency. Externally, it affects energy technologies, research investments, and supporting infrastructure. Internally, it shapes environmental awareness and green capacity [20]. In regions with higher economic growth, the economic volume can relatively easily reach a particular scale. When the economic volume reaches a specific scale, the environmental awareness of all social entities will usually be enhanced, and environmental protection policies at the government level will guide individuals and enterprises to conduct low-carbon behaviors and promote enterprises actively or passively carrying out technological innovation, thus improving carbon emission efficiency [21]. Therefore, economic growth may also be a moderating variable affecting the relationship between income inequality and carbon emission efficiency. This paper proposes the following hypothesis.
Hypothesis 3.
The improvement of economic growth will weaken the negative correlation between income inequality and carbon emission efficiency.

3. Research Design

3.1. Research Samples and Data Sources

Considering the availability and completeness of sample data, this paper selects 30 provinces in China (excluding Tibet and Hong Kong, Macao, and Taiwan) as research objects. The sample period is from 2013 to 2022, and 2013 is the starting point because it is necessary to unify the income caliber of urban and rural residents to calculate the variables explained. Before 2013, the National Bureau of Statistics used per capita disposable income to measure the income of urban residents and per capita net income to measure the income of rural residents. Since 2013, the National Bureau of Statistics has used per capita disposable income to calculate the income of both urban and rural residents. The data are processed as follows: First, to reduce the difference in data levels, the principle of “non-ratio data logarithmic processing” is adopted, and the carbon emission efficiency of the explained variable and the population density of the control variable are logarithmically processed, so that all the data are within 0 to 100. Second, drawing on the methodology of Yang et al. [22], this study employs linear interpolation to impute partial missing values. Third, to avoid the multicollinearity problem, the independent and regulating variables are centralized when conducting the adjustment effect test. The original data came from the National Bureau of Statistics, the China Environmental Statistical Yearbook, and the China Carbon Accounting Database (CEAD).

3.2. Model Setting

3.2.1. Baseline Regression Model

This study investigates how income inequality affects carbon emission efficiency through the baseline regression model (1), where i (i = 1, 2, 3…, n) represents different provinces, t (t = 1, 2, 3…, T) represents time, CE denotes carbon emission efficiency, II represents income inequality degree, C denotes control variable, α represents regression coefficient, μ denotes individual effect, δ represents time effect, and η denotes random disturbance term. To improve the reliability of regression results, the following essential treatments are also carried out in this paper: First, the robust standard misadjusted t statistic is adopted by default in all regression equations. Second, the dummy variables of time (Year) and province (id) are controlled to absorb the fixed effect as much as possible. Third, aging population and economic growth may affect the dependent variable, and omitted variables could lead to estimation bias. Therefore, these two variables—aging population and economic growth—are incorporated into the baseline regression model.
l n CE it = α 1 II it + C α 2 + α 3 A g it + α 4 E G it + Year + id + μ i + δ t + η it

3.2.2. Modulating Effect Model

The moderating effects of population aging and economic growth on how income inequality affects carbon emission efficiency are expressed by the interaction terms of income inequality variables, population aging variables, and economic growth variables, respectively, and regression models (2) and (3) are constructed.
ln CE it = β 1 II it + C β 2 + β 3 II it ×   A g it + A g it + Year + id + μ i + δ t + η it
ln CE it = θ 1 II it + C θ 2 + θ 3 II it ×   E G it + E G it + Year + id + μ i + δ t + η it
Ag stands for population aging and EG for economic growth.

3.2.3. Threshold Effect Model

This study explores how population aging and economic growth nonlinearly shape the mechanism through which income inequality affects carbon emission efficiency. This paper uses the panel threshold regression method to build a threshold regression model, as shown in models (4) and (5).
l n CE it = ω 1 II it ×   I   ( A g it     γ 1 ) + ω 2 II it ×   I   ( A g it   >   γ 1 ) + C ω 3 + μ i + δ t + η it
l n CE it =   ω 1 II it ×   I   ( E G it     γ 2 ) + ω 2 II it ×   I   ( E g it   >   γ 2 ) + C ω 3 + μ i + δ t + η it
where Ag represents population aging, EG denotes economic growth, and γ represents the threshold. I (.) is an indicator function. If A g it γ 1 , then I ( A g it   γ 1 ) = 1 and I ( A g it > γ 1 ) = 0. If A g it > γ 1 , then I ( A g it > γ 1 ) = 1 and I ( A g it γ 1 ) = 0. The indicator function of economic growth corresponds similarly to the indicator function of population aging. The coefficients “ ω 1 and ω 2 ” as well as “ ω 1 and ω 2 ” a and b reflect the differences in the impact of income inequality and its effect on carbon emission efficiency across different threshold intervals. The measurement and interpretation of all the above variables are described below.

3.3. Selection and Description of Variables

3.3.1. Explained Variables

Carbon emission efficiency (CE). Carbon emission efficiency is a critical metric for evaluating the relationship between economic activity and associated carbon emissions, reflecting the economic value generated per unit of carbon emissions. Its primary objective lies in assessing the low-carbon intensity of resource utilization. Following the methodology of Wang et al. [1], carbon emission efficiency is measured by the ratio of provincial gross domestic product (GDP) to carbon emissions (100 million yuan/million tons) across China’s provinces. This integrated ratio incorporates economic and environmental indicators within a unified analytical framework, where higher carbon emission efficiency values indicate greater economic output generated per unit of carbon emissions.

3.3.2. Explanatory Variables

Income inequality (II). Income inequality typically refers to the disproportionate distribution of income among members of a society, manifested as excessive income disparities between different groups or individuals. This phenomenon reflects the degree of equity in the distribution of economic resources within a society. The main measures of income inequality include the Gini Coefficient and the Theil Index [23]. For the following reasons, the Theil Index is chosen as the measure of income inequality in this paper: Since the National Bureau of Statistics only releases the Gini coefficient at the national level and does not release the provincial-level Gini coefficient, the academic circle usually adopts the method of Tian [24] to measure the provincial-level Gini coefficient. However, because the statistical yearbooks of some provinces no longer publish the grouped data of urban and rural areas, there are missing values in the calculation of the Gini coefficient. Therefore, there is no more accurate way to use the Gini coefficient variable to measure income inequality at the provincial level. Accordingly, the Thiel Index is chosen in this paper to measure income inequality in each province. The calculation formula of this index is as follows:
Theil t = i = 1 2 I it I t ×   ln I it I t / P it P t
where Theil t denotes the Thiel Index used to measure income inequality each year, i = 1 denotes the urban population, i = 2 denotes the rural population, I it represents the income of urban residents or rural residents in the t year, I t represents the sum of urban residents’ income and rural residents’ income in the t year, P it represents the sum of urban population or rural population in the t year, P t   represents the sum of urban population and rural population in the t year.

3.3.3. Adjust Variables

Aging population (Ag). Drawing on existing studies [25,26], this paper measures the degree of population aging in a region by counting the proportion of the population aged 65 and above in the total population.
Economic growth (EG). Since per capita GDP can better reflect the level of wealth and economic development of a country or a region than the total GDP to some extent, and we also learn from relevant studies [27], this paper uses per capita GDP (100 million yuan/10,000 people) as an indicator to measure economic growth.

3.3.4. Control Variables

Previous research literature mainly includes the following control variables: (1) Industrial structure (IS), which is measured by the ratio of industrial added value to the province’s total output. With the change in industrial structure, significantly increasing the proportion of tertiary industry in the national economy, carbon emissions may decrease and efficiency increase [28]. (2) Research and Development investment (Ri) was measured as the ratio of provincial government expenditure on science and technology to total general budgetary expenditure [28]. Increased research intensity has been shown to facilitate technological innovation, thereby enhancing both energy use efficiency and carbon emission efficiency through improved production technologies and management practices. (3) Population density (PD), expressed by the ratio of the permanent resident population of the province to the area of the provincial jurisdiction at the end of the year (10,000 people/10,000 square km). Population density can affect carbon emission levels through living consumption and travel modes [29]. (4) Environmental regulation (Es), calculated by the industrial treatment investment per unit of pollutant. Higher environmental regulation intensity may cause enterprises to attach great importance to environmental issues to a certain extent, thus affecting carbon emissions [13]. Specific calculations are as follows:
E s it = S I it TE it = I it / I t - j = 1 n S E ijt
S E ijt = E ijt E ijt -
where E s i t is the environmental regulation intensity of region i in year t; S I i t is the industrial pollution control investment after standardization, the total industrial pollution control investment of region i in t years divided by the average industrial pollution control investment of each province; T E i t is the total pollution emission of region i in t years, which is obtained by adding up the standardized treatment of different pollutant emissions; S E i t is the standardization of industrial wastewater, industrial sulfur dioxide, and industrial smoke (powder) dust emissions in region i in t years, obtained by dividing the annual emissions of the pollutants in region i by the average emissions of the provinces.
The variable definitions and data structure are presented in Table 1.

3.4. Descriptive Statistical Analysis of Main Variables

Table 2 lists the descriptive statistical results of the main variables. The results show that the mean value of lnCE is 4.321, the standard deviation is 0.678, the minimum value is 2.782, and the maximum value is 6.327. Income inequality (II) has a mean of 0.080, a standard deviation of 0.036, a minimum of 0.017, and a maximum of 0.187. Population aging (Ag) has a mean value of 0.116, a standard deviation of 0.029, a minimum value of 0.053, and a maximum value of 0.200. The mean of economic growth (EG) is 6.302, the standard deviation is 3.164, the minimum is 2.195, and the maximum is 19.021. It can be seen that in the variables of carbon emission efficiency, income inequality, population aging, and economic growth, the overall deviation of the sample is large.

4. Empirical Results and Economic Interpretation

4.1. Panel Unit Root and Co-Integration Test

The analysis begins with panel unit root tests to evaluate data stationarity, examine long-run equilibrium dynamics among variables, investigate whether the relevant variables are stable, and avoid the pseudo-regression problem effectively. Table 3 shows that all variables are smooth after second-order difference, and the T-values of different variables are all smaller than the corresponding state values at the three significance levels and the second-order single integral sequence at the 1% significance level.
Refer to the co-integration test proposed by Kao [30] to test whether there is a co-integration relationship between variables. The results are shown in Table 4. The T-value is 146.090, smaller than the critical value at each level, so the null hypothesis is rejected; the residual sequence is considered a stationary sequence without a unit root, indicating a long-term equilibrium relationship between variables. Therefore, this paper uses undifferentiated variables for subsequent empirical tests.

4.2. Testing the Relationship Between Income Inequality and Carbon Emission Efficiency

Considering that panel data may have heteroscedasticity, this paper adopts a fixed-effect regression model and robust standard error to explore how income inequality shapes carbon emission efficiency. It gradually adds the province-fixed and time-fixed effects to the regression process to observe the robustness of the research results. Models (1) and (2) in Table 5 show the estimation results of income inequality on carbon emission efficiency, where model (1) is only fixed provinces, and model (2) has the added time fixed effect based on model (1). The results show that the estimated coefficients of income inequality (II) were significantly negative (coef. = −3.496, p < 0.01; coef. = −2.493, p < 0.05)—that is, the increase in income inequality will lead to the decrease in carbon emission efficiency, so hypothesis 1 in this paper is verified.

4.3. Testing the Moderating Effect of Population Aging and Economic Growth

4.3.1. Moderating Effect of Population Aging: Strengthening the Influence of Income Inequality on Carbon Emission Efficiency

Model (3) in Table 5 analyzes the moderating effect of population aging (Ag) on the relationship between income inequality (II) and carbon emission efficiency (lnCE). The results showed that the coefficient of the interaction term (Ag × II) between population aging and income inequality is significantly negative (coef. = −29.178, p < 0.1). The results demonstrate that population aging serves as a statistically significant moderator in the income inequality–carbon emission efficiency linkage, and it is an enhanced moderating effect. The existence of the improved regulatory effect means that the increasing degree of population aging will strengthen the inhibitory effect of income inequality on carbon emission efficiency, so hypothesis 2 in this paper is verified.

4.3.2. Moderating Effect of Economic Growth: Weakening the Influence of Income Inequality on Carbon Emission Efficiency

Model (4) in Table 5 analyzes the moderating effect of economic growth (EG) on the relationship between income inequality (II) and carbon emission efficiency (lnCE). The results show that the coefficient of the interaction term (EG × II) between economic growth and income inequality is significantly positive (coef. = 0.876, p < 0.01). This means that economic growth moderates how income inequality affects carbon emission efficiency, which is a disturbing moderating effect. The existence of the interference regulation effect means that increasing economic growth will weaken the inhibiting impact of income inequality on carbon emission efficiency, so hypothesis 3 in this paper is verified.

4.4. Threshold Regression Analysis of the Income Inequality–Carbon Efficiency Nexus

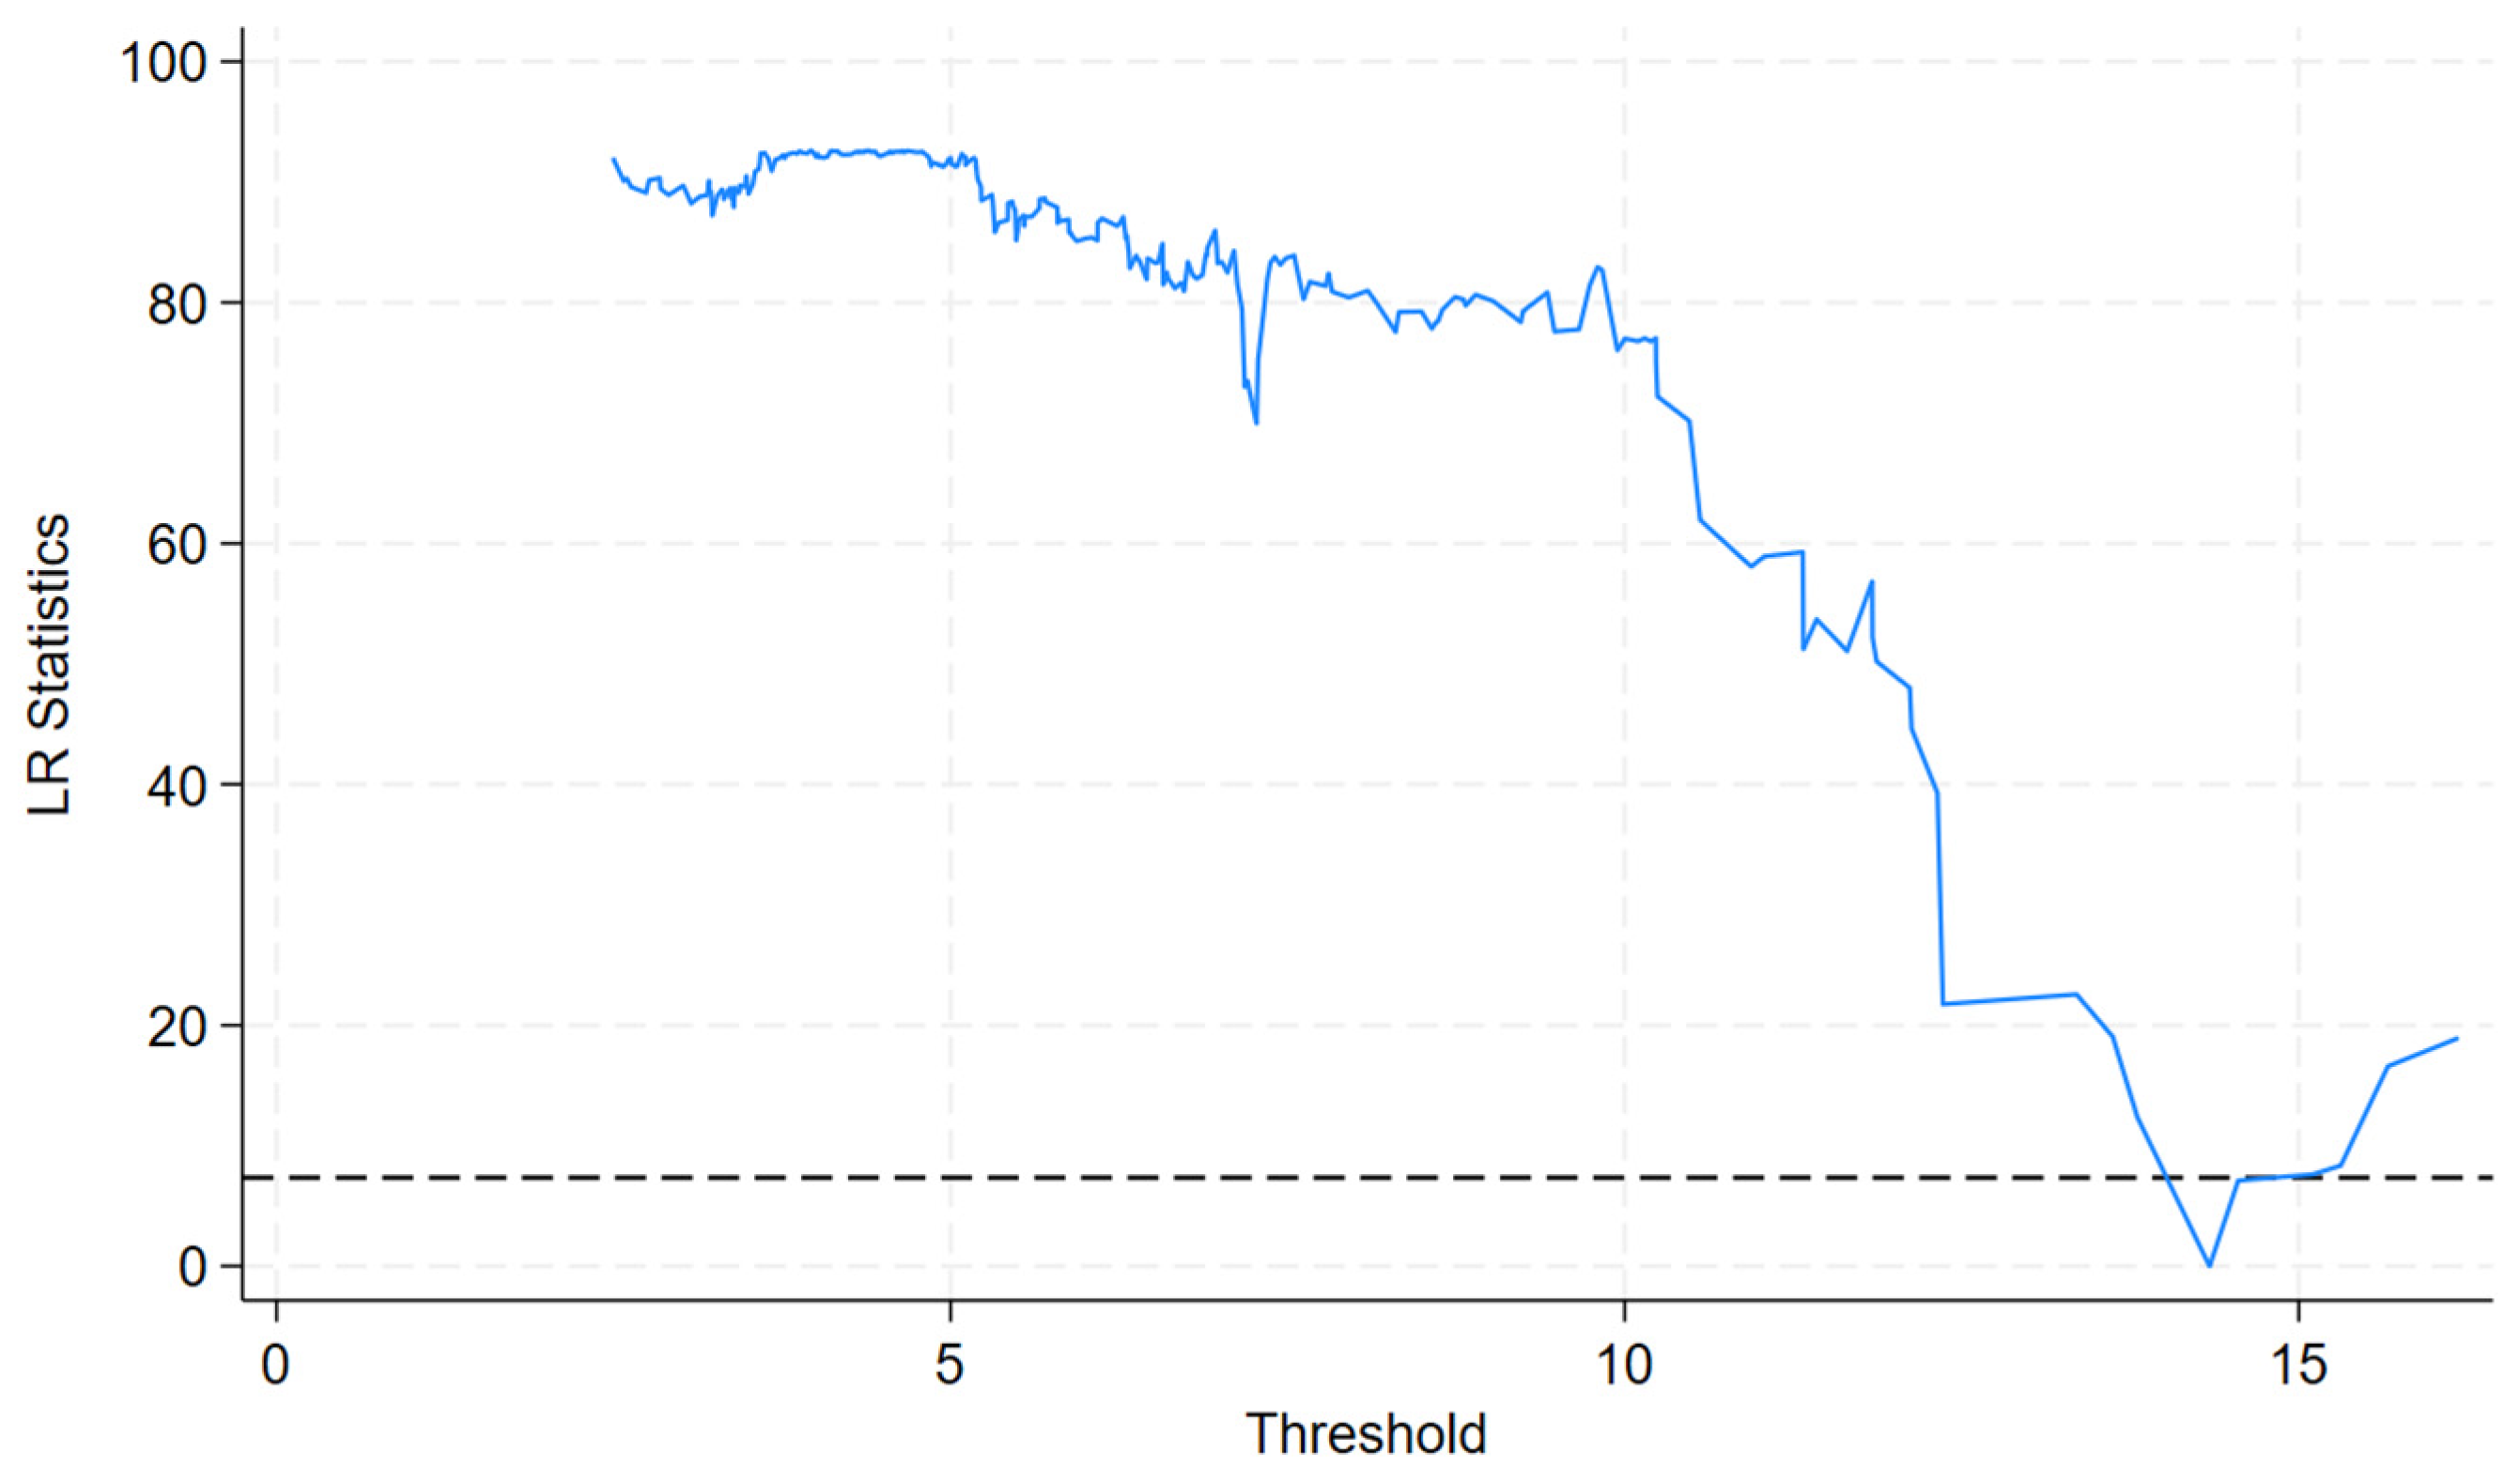
4.4.1. Threshold Effect Test

This study examines the distinct mechanistic pathways by which population aging and economic growth independently moderate the association between income inequality and carbon emission efficiency. With carbon emission efficiency as the dependent variable and income inequality as the core explanatory variable, this study employs population aging and economic growth as respective threshold variables in the analysis to test the threshold effect. The test results are shown in Table 6. Triple-threshold, double-threshold, and single-threshold tests were carried out for the threshold variable population aging. Only the single-threshold test accepted the null hypothesis at the significance level of 10%; the corresponding threshold value was 0.141, and the 95% confidence interval was (0.140, 0.142), indicating that there was only a single threshold for population aging. At the same time, triple-threshold, double-threshold, and single-threshold tests were also conducted to determine the threshold variable of economic growth. Similar to the situation of population aging, only the single-threshold test accepted the null hypothesis at the significance level of 1%; the corresponding threshold value was 14.338, and the 95% confidence interval was (13.803, 14.550), indicating that there was also a single threshold for economic growth.
Next, a threshold test was performed to determine if the threshold was selected correctly. Figure 1 and Figure 2 are likelihood ratio function images with population aging and economic growth as thresholds, respectively. This test maintains its null hypothesis that the estimated threshold is statistically valid, with the dashed line indicating the threshold value at the 95% confidence interval. As evident from Figure 1 and Figure 2, the threshold estimate falls below the dashed line, indicating failure to reject the null hypothesis and consequently validating the correctness of all selected thresholds.

4.4.2. Threshold Effect Regression

Table 7 shows the threshold effect regression results. As mentioned above, population aging and economic growth are single-threshold regressions. Population aging can be divided into a low population aging interval (Ag ≤ 0.141) and a high population aging interval (Ag > 0.141), and economic growth can also be categorized into periods of low growth (EG ≤ 14.338) and high growth (EG > 14.338).
Model (1) in Table 7 shows that in the low population aging range, carbon emission efficiency decreases by 909.8% for every 1-unit increase in income inequality. When the population is in the high aging range, the carbon emission efficiency decreases by 737.8% for every 1-unit increase in income inequality.
This indicates that income inequality makes carbon emission efficiency less constrained as population aging progresses. This may be because older individuals tend to accumulate more divergent human capital, leading to more significant income disparities [15]. With the aging population deepening, older people’s labor activities are gradually reducing, and the demand for daily travel and residence is reducing relatively. Older people are more inclined to use public transportation [31], thus reducing carbon emissions. In addition, older people have a high demand for old-age care, medical care, and other aspects of their daily lives, and the resulting carbon emissions are also gradually increasing. However, various organizations and industries actively introduce advanced technologies and equipment to progressively reduce the carbon emissions of activities for older people, thus promoting improving carbon emission efficiency [32].
Model (2) in Table 7 shows that every 1-unit increase in income inequality in the low economic growth interval reduces carbon emission efficiency by 942.5%. In the high economic growth range, every 1-unit increase in income inequality increases carbon emission efficiency by 610.8%. This demonstrates that income inequality becomes less inhibitory to carbon emission efficiency as economic growth accelerates. This may be because, although economic growth increases income inequality [3], economic growth also promotes the enhancement of market players’ awareness of low-carbon environmental protection to some extent. The government’s environmental protection policies, enterprises’ pollution control, and individuals’ green consumption collectively drive emission abatement while enhancing carbon emission efficiency [33].
With the population aging, income inequality has experienced non-linear changes in two segments of carbon emission efficiency. When population aging exceeds the threshold, income inequality exerts a progressively weaker constraining influence on carbon emission efficiency, which may be attributed to the fact that aging populations, due to their income levels and lifestyle patterns, tend to adopt more low-carbon consumption behaviors [34]. Fan et al. [35] posit that households with higher elderly dependency ratios prioritize subsistence consumption over discretionary spending. This behavioral shift reduces demand for appliance upgrades and decreases electricity utilization, thereby marginally enhancing carbon emission efficiency through lowered energy demand. With the progression of economic growth, income inequality has experienced non-linear changes in two segments of carbon emission efficiency; that is, when economic growth exceeds the threshold, income inequality exerts a progressively weaker constraining influence on carbon emission efficiency. This may be attributed to a sound economic development level that can establish a solid financial foundation for environmental protection, energy conservation, emissions reduction, and green infrastructure construction [36].

4.5. Robustness Test

This paper’s robustness test mainly adopts three methods: replacing the explained variable and the explanatory variable, adjusting the sample period, shrinking the tail, and proving the reliability of the above conclusions.

4.5.1. Replace Explained Variables and Explanatory Variables

As the selection of variables will lead to bias in model results, this study adopts the “Super-SBM model of non-expected output” [36] instead of “GDP/carbon emissions” and “rural-urban income ratio” [23] instead of the “Theil lndex” to measure carbon emission efficiency and income inequality, respectively. The regression results are shown in model (1) in Table 8. The coefficient of income inequality is significantly negative (coef. = −0.291, p < 0.05), which indicates that the conclusion of the negative correlation remains robust when examining how income inequality affects carbon emission efficiency even if the measures of explained variables and explanatory variables are replaced.

4.5.2. Adjust the Sample Period

Considering the impact of COVID-19 in 2020 and beyond, the sample period is adjusted to 2013–2019. The regression results are presented in model (2) in Table 8. The coefficient of income inequality is significantly negative (coef. = −5.715, p < 0.01), which indicates that even after adjusting the sample size, income inequality still maintains a negative relationship with carbon emission efficiency, indicating that the above conclusion remains valid and robust.

4.5.3. Tailing Treatment

To mitigate the influence of outliers on the baseline regression results, this paper conducted regression analysis again after tail shrinking was performed on all variables at the 1% level, and the results were shown in model (3) in Table 8. The coefficient of income inequality was significantly negative (coef. = −2.718, p < 0.05), indicating that even after tail shrinking was performed on the data, the above conclusions are still reliable without changing the negative relationship between income inequality and carbon emission efficiency.

5. Research Conclusions and Policy Implications

Alleviating income inequality and improving carbon emission efficiency are essential objective functions of China’s economic transformation and development; an internal connection between them cannot be ignored. Based on the fixed-effect model composed of data from 30 provincial-level regions in China during 2013–2022, combined with the intermediary effect and threshold effect model, this study systematically examines the mechanisms through which income inequality affects carbon emission efficiency and the moderating roles of population aging and economic growth in this relationship, through both theoretical and empirical lenses. The main conclusions are as follows: (1) Income inequality significantly inhibits improving carbon emission efficiency. For every 1-unit increase in income inequality, carbon efficiency decreases by 249.3% (equivalent to an increase of 0.01 units in X corresponding to 2.49% change in Y. For example, the corresponding interpretation is that when X increases from 0.01 to 0.02 units, Y changes by 2.49%). (2) Increasing population aging will strengthen the negative correlation when examining how income inequality affects carbon emission efficiency. In addition, there is a non-linear single threshold when examining how income inequality affects carbon emission efficiency under the influence of population aging. When the population aging level remains below the threshold of 0.141, carbon emission efficiency will decrease by 909.8% for every 1-unit increase in income inequality. When population aging exceeds the 0.141 threshold, carbon emission efficiency decreases by 737.8% for every 1-unit increase in income inequality. (3) An increase in economic growth will weaken the negative correlation when examining how income inequality affects carbon emission efficiency. Similarly, there is a non-linear single threshold when examining how income inequality affects carbon emission efficiency under the influence of economic growth: When economic growth falls below the threshold of 14.338, the carbon emission efficiency will decrease by 942.5% when the income inequality increases by 1 unit. When economic growth exceeds the 14.338 threshold, the carbon emission efficiency increases by 610.8% for every 0.01-unit increase in income inequality.
Based on the findings mentioned above, this study proposes the following policy implications. (1) Take comprehensive measures to alleviate income inequality effectively. Income inequality negatively impacts the enhancement of carbon emission efficiency. Alleviating income inequality and improving carbon emission efficiency is essential to achieve the goal of shared prosperity and a sustainable development strategy, respectively. The two kinds of policies can achieve the implementation effect of a “perfect combination”. Therefore, macro-control can take multiple measures in tax regulation, social security, poverty alleviation, educational equity, and regional coordinated development, effectively alleviating the problem of income inequality and positively improving carbon emission efficiency. (2) Appropriately control the overall level of population aging, narrow the income gap among the elderly population, and alleviate the strengthening effect of population aging on the negative correlation when examining how income inequality affects carbon emission efficiency.
Compared with provinces with a low aging population, provinces with a high aging population improve carbon emission efficiency to a lesser extent in reducing income inequality. Therefore, macro policies can make efforts to encourage birth, delay retirement, improve pension security, promote scientific and technological innovation, attract immigrants, etc., effectively alleviate the problem of population aging, and help improve carbon emission efficiency. (3) Make every effort to promote high-quality and rapid economic development and give full play to the positive role of economic growth in weakening the negative correlation when examining how income inequality affects carbon emission efficiency. Provinces with higher economic growth exhibit a weaker improvement in carbon emission efficiency when addressing income inequality than provinces with lower economic growth. Therefore, all provinces must continue to deepen market-oriented reform, optimize industrial structure, achieve innovation-driven measures, effectively promote high-quality and rapid economic development, improve carbon emission efficiency, and accelerate sustainable development progress.

Author Contributions

Conceptualization, X.C., Z.N. and Y.X.; methodology, X.C., Z.N. and Y.X.; software, X.C. and Z.N.; validation, X.C. and Z.N.; formal analysis, X.C. and Z.N.; investigation, X.C. and Z.N.; resources, X.C. and Z.N.; data curation, X.C. and Z.N.; writing—original draft preparation, X.C. and Z.N.; writing—review and editing, X.C., Z.N. and Y.X.; visualization, X.C. and Z.N.; supervision, X.C., Z.N. and Y.X. All authors have read and agreed to the published version of the manuscript.

Funding

This research was supported by “the Fundamental Research Funds for the Central Universities” (2024SKPYGL02).

Institutional Review Board Statement

Not applicable.

Informed Consent Statement

Not applicable.

Data Availability Statement

The data used in this study are publicly available and the data sources have been described in this article.

Conflicts of Interest

The authors declare no conflict of interest.

References

  1. Wang, Q.; Li, L.; Li, R. Income inequality and carbon efficiency: The mediating role of population aging in 139 countries. Sci. Total Environ. 2022, 857, 159508. [Google Scholar] [CrossRef]
  2. Wu, W.; Liu, Y.; Xu, L. The Effects of Industrial Structure on Income inequality. Manag. World 2018, 34, 22–33. (In Chinese) [Google Scholar]
  3. Zhou, H.; Fu, C.; Gong, L. How Does Employment Policy Affect Income Distribution? Theoretical Analysis Based on Quantitative Spatial General Equilibrium Mode. Manag. World 2024, 40, 38–63. (In Chinese) [Google Scholar]
  4. Chu, D.; Ji, F.; Liu, F. Tax Competition, Capital Flow and Income Inequality. Econ. Res. J. 2024, 59, 88–106. (In Chinese) [Google Scholar]
  5. Torras, M.; Boyce, J. Income, inequality, and pollution: A reassessment of the environmental Kuznets Curve. Ecol. Econ. 1998, 25, 147–160. [Google Scholar] [CrossRef]
  6. Jia, N.; Xu, H.; Lei, H. Income Inequality and Carbon Emissions: Based on Data of Urban Carbon Emissions. J. Nat. Sci. Hunan Norm. Univ. 2024, 46, 1–9. (In Chinese) [Google Scholar]
  7. Zhang, Y.; Hao, S. Spatiotemporal Analysis of the Impact of Income Gap and Economic Agglomeration on Carbon Emissions. Soft Sci. 2022, 36, 62–67+82. (In Chinese) [Google Scholar]
  8. Zou, X.; Ge, T.; Sun, X.; Xing, S. Rural-urban Income Gap, Consumption Difference and Carbon Emission Efficiency—A Case Study of Beijing-Tianjin-Hebei Region. Soft Sci. 2023, 37, 104–110. (In Chinese) [Google Scholar]
  9. Jiao, Z.; Sharma, R.; Kautish, P.; Hussain, H. Unveiling the asymmetric impact of exports, oil prices, technological innovations, and income inequality on carbon emissions in India. Resour. Policy 2021, 74, 102408. [Google Scholar] [CrossRef]
  10. Grunewald, N.; Klasen, S.; Martinez-Zarzoso, I.; Muris, C. The Trade-off Between Income Inequality and Carbon Dioxide Emissions. Ecol. Econ. 2017, 142, 249–256. [Google Scholar] [CrossRef]
  11. Boyce, J. Inequality as a cause of environmental degradation. Ecol. Econ. 1994, 11, 169–178. [Google Scholar] [CrossRef]
  12. Zhan, H. The Effect of Income Inequality on Environmental Pollution: Reassessment of the Environmental Kuznets Curve of China. Econ. Rev. 2018, 6, 100–112+166. (In Chinese) [Google Scholar]
  13. Shen, Y.; Ren, Y. Spatial spillover effect of environmental regulations and inter-provincial industrial transfer on pollution migration. China Popul. Resour. Environ. 2021, 31, 52–60. (In Chinese) [Google Scholar]
  14. Su, K.; Zhou, C. Human Capital, Technological Innovation and Green Total Factor Productivity: Based on the Data Analysis of Cities in the Yangtze River Economic Belt. On. Econ. Probl. 2021, 5, 71–79. (In Chinese) [Google Scholar]
  15. Dong, Z.; Tang, C.; Wei, X. Does population aging intensify income inequality? Evidence from China. Asia Pac. Econ. 2018, 23, 66–67. [Google Scholar] [CrossRef]
  16. Zhang, C.; Tan, Z. The relationships between population factors and China’s carbon emissions: Does population aging matter? Renew. Sust. Energ. Rev. 2016, 65, 1018–1025. [Google Scholar] [CrossRef]
  17. Heijdra, B.; Kooiman, J.; Ligthart, J. Environmental quality, the macroeconomy, and intergenerational distribution. Resour. Energy Econ. 2006, 28, 74–104. [Google Scholar] [CrossRef]
  18. Tong, Y.; Zhou, W. The Impact of Family Population Aging on Carbon Emissions—An Empirical Study Based on the Micro Perspective of the Family. Popul. J. 2020, 3, 78–88. (In Chinese) [Google Scholar]
  19. Naughton, B. The Chinese: Economy Adaptation and Growth, 2nd ed.; Shanghai People’s Publishing House: Shanghai, China, 2019; p. 249. [Google Scholar]
  20. Wang, Q.; Wang, L. Renewable energy consumption and economic growth in OECD countries: A non-linear panel data analysis. Energy 2020, 207, 118200. [Google Scholar] [CrossRef]
  21. Zhao, X.; Long, L.; Zhou, Y. Green finance, government intervention and regional carbon emission efficiency. Stat. Decis. 2023, 39, 149–154. (In Chinese) [Google Scholar]
  22. Yang, H.; Xiang, N.; Luo, Y. Can Digitization of Agricultural Products Circulation Improve the Living Standards of Rural Residents: An Empirical Evidence from Provincial Panel Data and Spatial Durbin Model. Macroeconomics 2022, 10, 88–102. (In Chinese) [Google Scholar]
  23. Wang, W.; Guo, X. Income inequality and China’s high savings rate: Theoretical and empirical research based on the perspective of targeted consumption. J. Manag. World 2011, 9, 7–25+52. (In Chinese) [Google Scholar]
  24. Tian, W. The Gini coefficient calculation of provincial residents’ income and its changing trend analysis. Econ. Sci. 2012, 2, 48–59. (In Chinese) [Google Scholar]
  25. Wu, Y.; Lu, J.; Liu, L. Aging, Foreign Trade and Economic Growth: An Empirical Analysis Based on China’s Provincial Data. Northwest Popul. J. 2019, 40, 23–35. (In Chinese) [Google Scholar]
  26. Zhong, S.; Yu, Y. An Empirical Analysis of the Impacts of Aging and Human Capital Structure on Regional Industrial Upgrading. Stat. Decis. 2017, 16, 100–104. (In Chinese) [Google Scholar]
  27. Yu, Y.; Zhang, X. The Factor Endowments, the Suitable Innovation Mode Selection and TFP Improvements. Stat. Decis. 2015, 9, 13–31+187. (In Chinese) [Google Scholar]
  28. Wu, H.; Xu, J. Analysis of the impact of green finance on China’s regional carbon emission efficiency-Empirical research based on dynamic spatial panel model. Soc. Sci. Res. 2023, 6, 84–92. (In Chinese) [Google Scholar]
  29. He, W.; Zhang, H.; Chen, X.; Yan, J. An Empirical Study about Population Density, Economic Agglomeration and Carbon Emission State of Chinese Provinces: Based on the Perspective of Agglomeration Economy Effects, Congestion Effects and Spatial Effects. Nankai Econ. Stud. 2019, 2, 207–225. (In Chinese) [Google Scholar]
  30. Kao, C. Spurious regression and residual-based tests for co-integration in panel data. J. Econom. 1990, 90, 1–44. [Google Scholar] [CrossRef]
  31. Yu, Y.; Deng, Y.; Chen, F. Impact of population aging and industrial structure on CO2 emissions and emissions trend prediction in China. Atmos. Pollut. Res. 2018, 9, 446–454. [Google Scholar] [CrossRef]
  32. Wang, L.; Wang, Y.; Lan, Y.; Zhang, J. Research on the Impact of Population Aging on Carbon Emission Performance. Sci. Decis. Mak. 2024, 2, 93–104. (In Chinese) [Google Scholar]
  33. Wang, X.; Shang, J. Digital economy, economic growth and carbon emission performance improvement. Stat. Decis. 2024, 40, 124–129. (In Chinese) [Google Scholar]
  34. Yang, X.; Li, N.; Mu, H.; Pang, J.; Zhao, H.; Ahmad, M. Study on the long-term impact of economic globalization and population aging on CO2 emissions in OECD countries. Sci. Total Environ. 2021, 787, 147625. [Google Scholar] [CrossRef] [PubMed]
  35. Fan, Z.; Wang, Z. Study on the Relationship Between Population Age Structure and Upgrading of Household Consumption: Based on the Test of Mediation Effect. J. Xiangtan Univ. (Philos. Soc. Sci.) 2020, 2, 62–68. (In Chinese) [Google Scholar]
  36. Li, J.; Liu, A. Impact of Digital New-quality Productivity on Carbon Emission Efficiency. Stat. Decis. 2024, 40, 23–28. (In Chinese) [Google Scholar]
Figure 1. Likelihood ratio function image of population aging as threshold.
Sustainability 17 03930 g001
Figure 2. Likelihood ratio function image of economic growth as threshold.
Sustainability 17 03930 g002
Table 1. Variable definitions, measurement methods, and units.
Variable TypeSymbolVariable SymbolVariable Measure
Explained variableCarbon efficiencyCEThe ratio of the GDP of each province to total carbon emissions
Explanatory variableIncome inequalityIITheil Index by province
Regulating variableAgingAgThe ratio of the population aged 65 and over to the total population in each province
Economic growthEgProvincial GDP per capita
Control variableResearch and Development investmentRiThe ratio of provincial government expenditure on science and technology to general budgetary expenditure
Industrial structureISThe ratio of industrial added value to GDP of each province
Population densityPDRatio of permanent resident population to area of provincial jurisdiction at the end of the year
Environmental regulationEsIndustrial treatment investment per unit of pollutant
Table 2. Descriptive statistics of variables.
VariableNMeanSdMinMax
lnCE3004.3210.6782.7826.327
II3000.0800.0360.0170.187
Ag3000.1160.0290.0530.200
EG3006.3033.1642.19519.021
Ri3000.0220.0150.0050.068
IS3000.3220.0750.1000.510
lnPD3005.4631.2922.0688.275
Es3000.4550.6680.0087.202
Table 3. Results of variable unit root test.
VariableADF-Fisher Test
t-Valuep-Value
lnCE239.0190.000
II192.8330.000
Ag249.5810.000
Eg228.3020.000
Ri269.2730.000
IS223.4130.000
lnPD170.2450.000
Es283.5060.000
Table 4. Results of co-integration test.
t-Valuep-Value
ADF-Fisher test146.090 ***0.000
Notes: *** is significant at the levels of 1%.
Table 5. Regression analysis of income inequality’s impact on emission efficiency.
Variable(1)(2)(3)(4)
LnCELnCELnCELnCE
II−3.496 ***−2.493 **−1.0566.646 **
(0.654)(1.240)(1.871)(2.971)
Ag × II −29.178 **
(12.803)
EG × II 0.876 ***
(0.275)
Ag1.144 **1.088 *−1.035
(0.456)(0.607)(0.703)
EG0.066 ***0.056 *** 0.091 ***
(0.005)(0.008) (0.014)
Ri2.599 ***3.175 ***4.851 ***1.391
(0.961)(0.978)(1.096)(1.183)
IS−1.026 ***−0.631 **−0.021−0.700 ***
(0.208)(0.300)(0.331)(0.266)
lnPD0.554 ***0.452 ***−0.0040.810 ***
(0.051)(0.074)(0.028)(0.144)
Es−0.002−0.004−0.001−0.003
(0.005)(0.005)(0.008)(0.006)
Constant1.302 ***1.711 ***4.225 ***0.161
(0.326)(0.409)(0.210)(0.741)
ProvinceYesYesYesYes
YearNoYesYesYes
R-square0.9900.9900.9890.991
F-test232.44612.5014.47115.826
Notes: The numbers in brackets below the regression coefficient are robust standard errors. *, **, and *** indicate significant at 10%, 5%, and 1% respectively.
Table 6. Results of threshold effect test and threshold regression.
Threshold VariablesThreshold NumberF-Valuep-ValueThreshold Value95% Confidence Interval
AgTriple3.6700.704
Double3.2400.932
Single26.2100.0760.141(0.140, 0.142)
EGTriple20.2100.252
Double18.5100.256
Single90.1400.00014.338(13.803, 14.550)
Table 7. Regression results of threshold effect.
(1)
LnCE
(2)
LnCE
Explanatory variable A g γ 1 −9.098 ***
(0.620)
A g > γ 1 −7.378 **
(0.809)
E g γ 2 −9.425 ***
(1.048)
E g > γ 2 6.108 ***
(2.188)
Control variableRi0.009
(0.068)
5.530 ***
(1.917)
IS−1.664 ***
(0.232)
−1.360 ***
(0.438)
lnPD0.047
(0.067)
0.831 ***
(0.135)
Es−0.009
(0.012)
0.034 ***
(0.009)
Constant termConstant 5.319 ***
(0.384)
0.820
(0.801)
Notes: The numbers in brackets below the regression coefficient are robust standard errors. **, and *** indicate significant at 5%, and 1% respectively.
Table 8. Robustness test.
(1)(2)(3)
LnCELnCELnCE
II−0.291 **−5.715 ***−2.718 **
(0.126)(1.594)(1.212)
Ag1.902 ***
(0.677)
0.133
(0.732)
1.064
(0.684)
EG0.049 ***
(0.008)
0.070 ***
(0.010)
0.050 ***
(0.008)
Ri−1.481
(1.180)
1.379
(0.979)
3.029 ***
(1.048)
IS−0.074
(0.306)
−0.460
(0.425)
−0.736 **
(0.319)
lnPD0.303 ***
(0.072)
0.586 ***
(0.096)
0.406 ***
(0.073)
Es−0.002
(0.006)
0.008 *
(0.005)
0.003
(0.009)
Constant−0.606
(0.474)
1.238 ***
(0.440)
2.050 ***
(0.406)
ProvinceYesYesYes
YearYesYesYes
R-square0.7950.9930.990
F-test11.22711.67810.594
Notes: The numbers in brackets below the regression coefficient are robust standard errors. *, **, and *** indicate significant at 10%, 5%, and 1% respectively.
Disclaimer/Publisher’s Note: The statements, opinions and data contained in all publications are solely those of the individual author(s) and contributor(s) and not of MDPI and/or the editor(s). MDPI and/or the editor(s) disclaim responsibility for any injury to people or property resulting from any ideas, methods, instructions or products referred to in the content.

