
Market Opportunities for Differentiated Locally Grown Fresh Produce: Understanding Consumer Preferences


Abstract
:1. Introduction
2. Literature Review
3. Materials and Methods
3.1. Participants
3.2. Choice Experiment
3.3. Attribute Non-Attendance
3.4. Procedure
3.5. Model Specification and Estimation
3.6. Econometric Specification
3.7. Estimation, WTP, and Market Share Calculations
4. Results
4.1. Non-Attendance and Attribute Importance
4.2. Estimation Results
4.3. Economic Results: WTPs and Market Shares
5. Discussion
5.1. Policy and Marketing Implications
5.2. Research Implications
5.3. Study Limitations
6. Conclusions
Author Contributions
Funding
Institutional Review Board Statement
Informed Consent Statement
Data Availability Statement
Acknowledgments
Conflicts of Interest
Abbreviations
| EU | European Union |
| CE | Choice experiment |
| WTP | Willingness to pay |
| ANA | Attribute non-attendance |
| EC-RPL-CORR | Error component random parameter logit model with correlated errors |
| ECLC | Equality constraint latent class model |
Appendix A


Appendix B

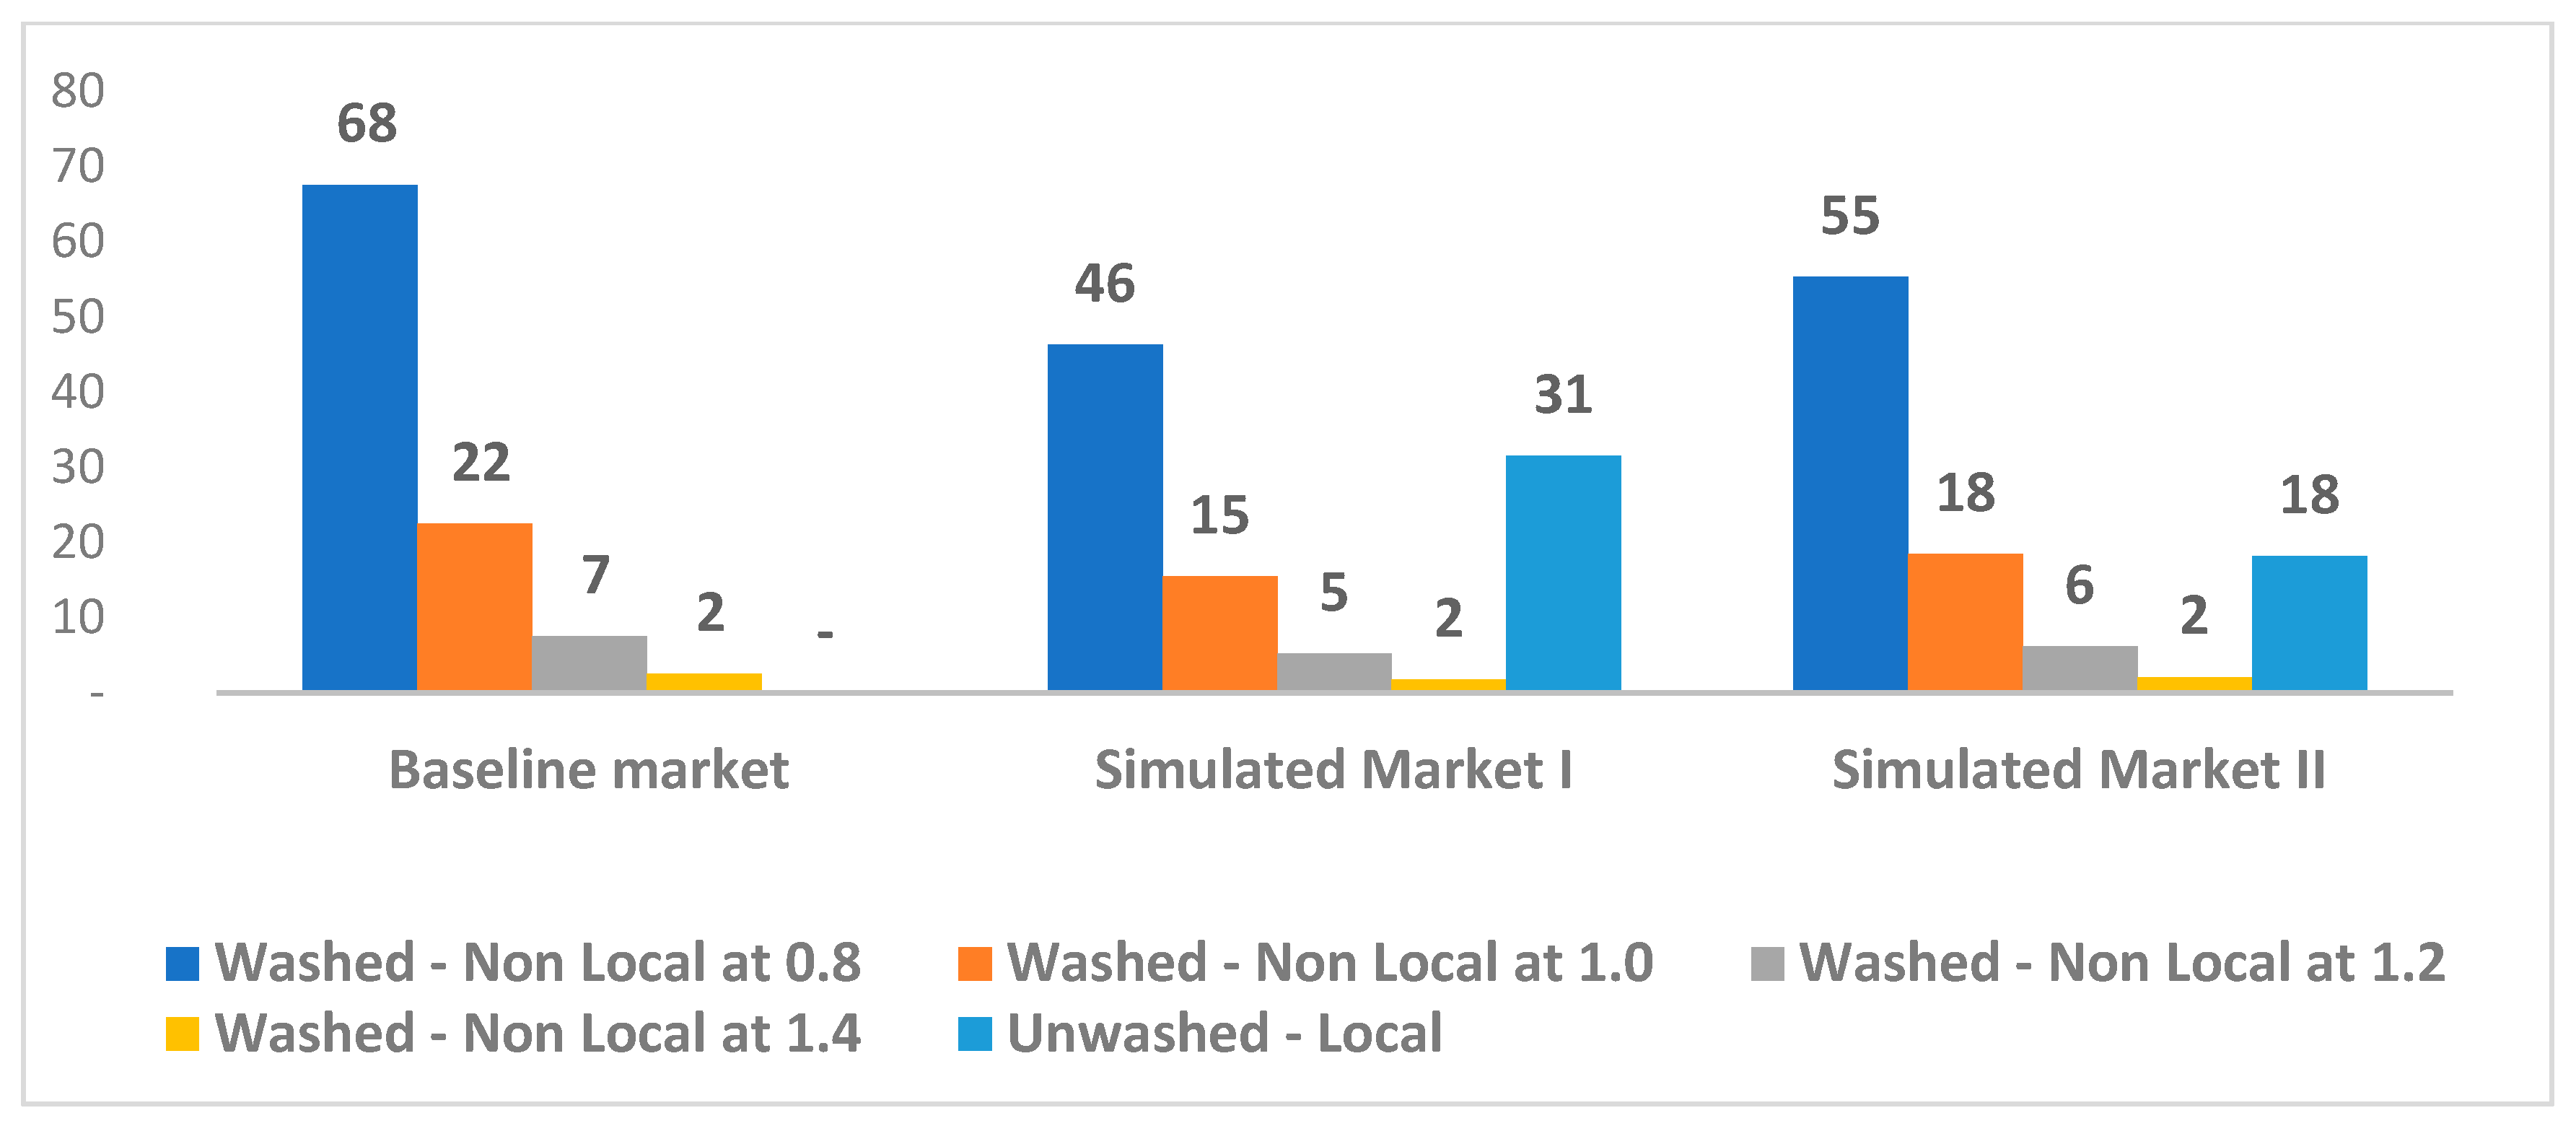
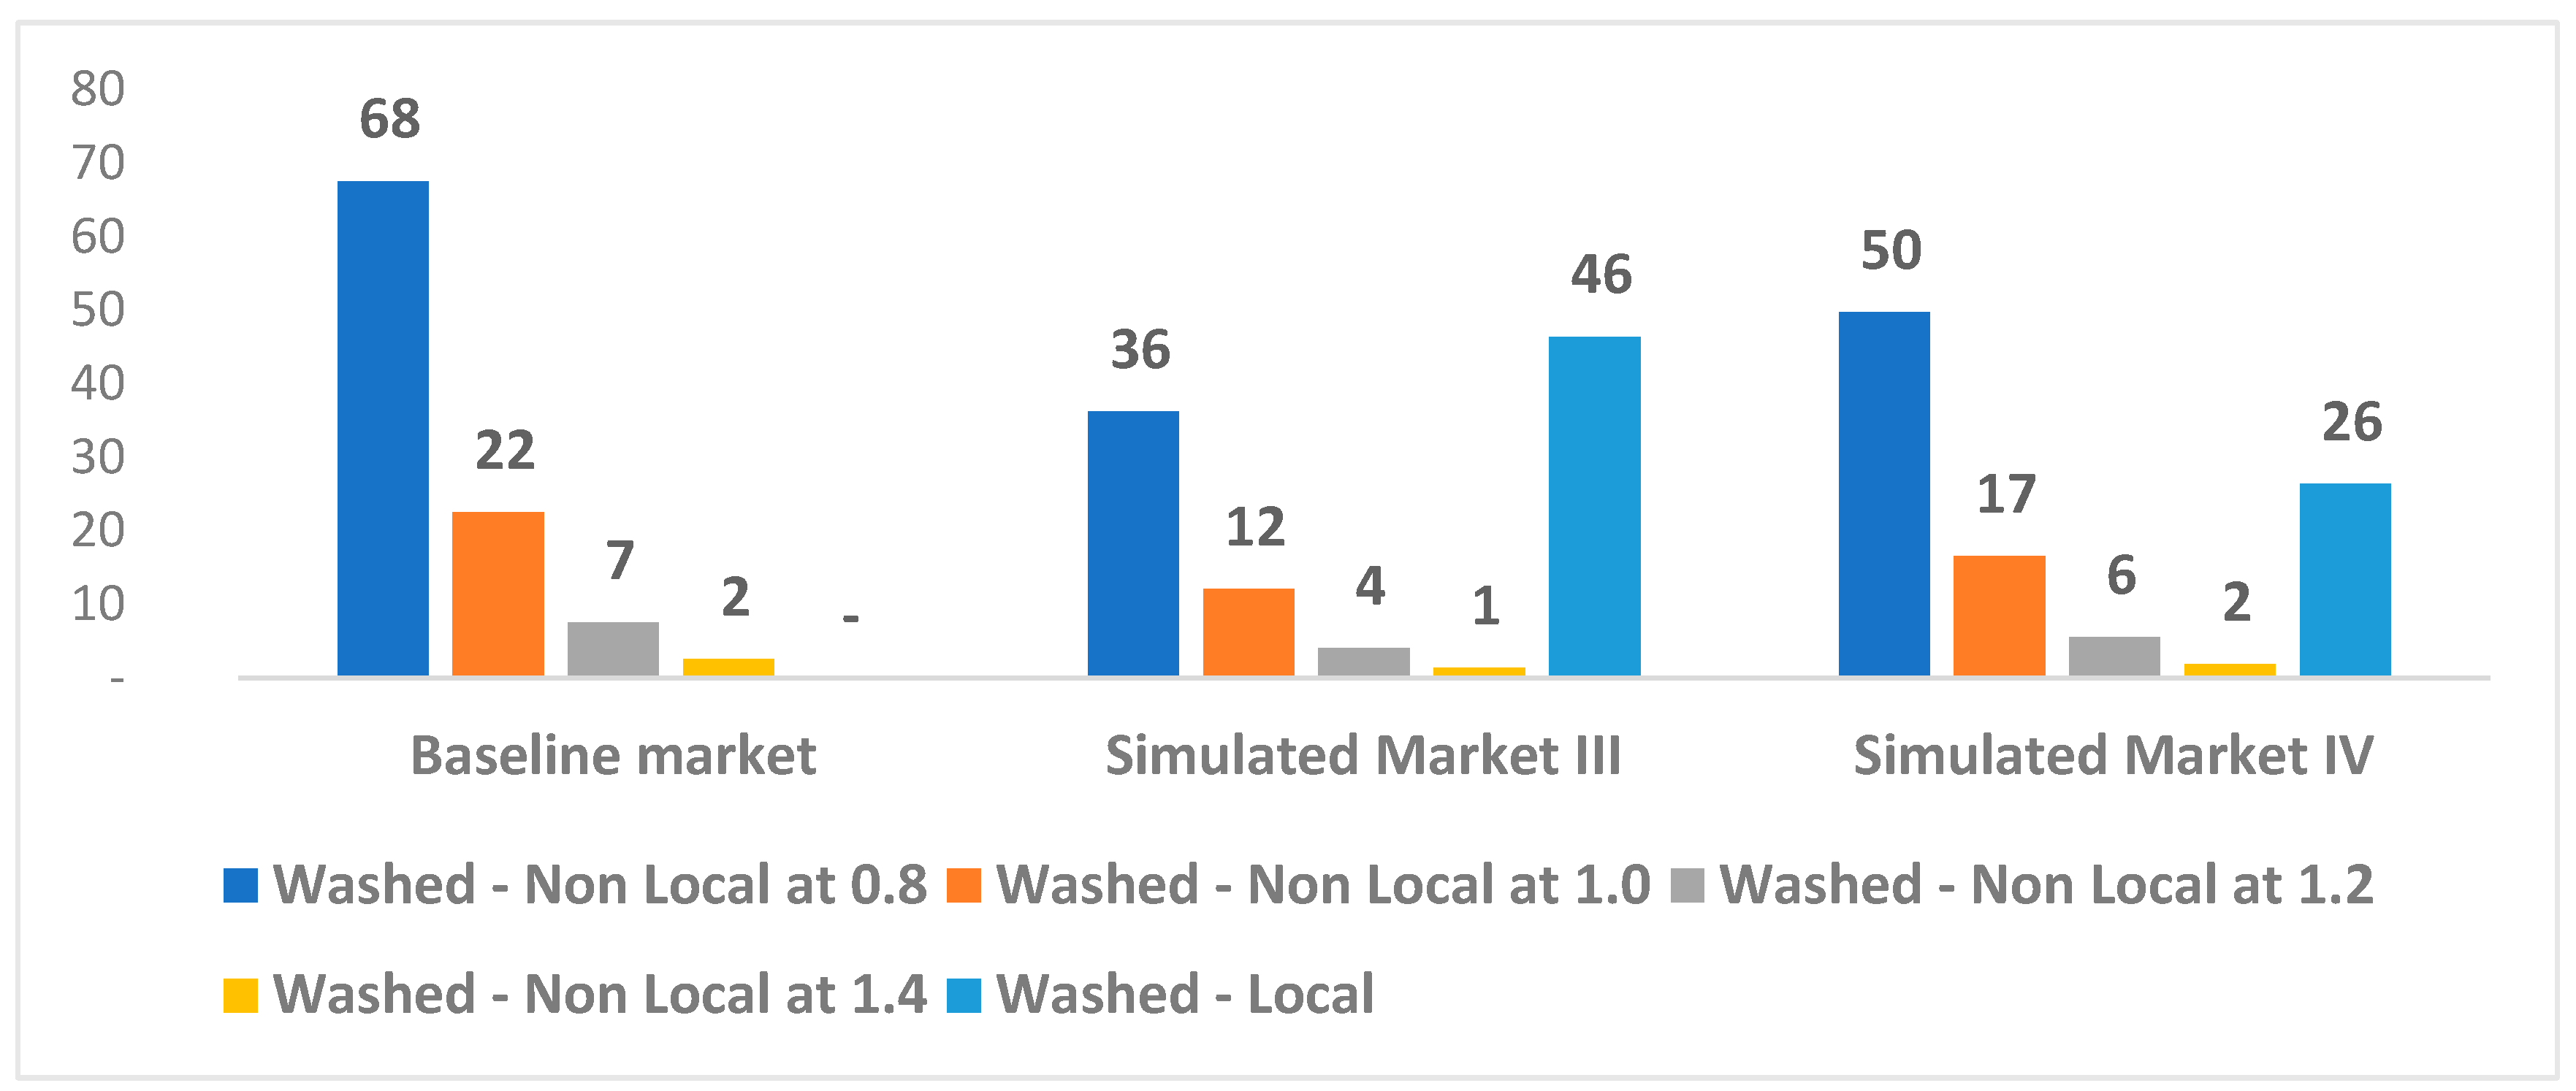
| Baseline Market | Four products: Washed nonlocal potatoes sold at EUR 0.8/kg, EUR 1.0/kg, EUR 1.2/kg, and EUR 1.4/kg. |
| Simulated Market I | Five products: Baseline plus the newly unwashed local potatoes sold at EUR 1.2/kg. |
| Simulated Market II | Five products: Baseline plus the newly unwashed local potatoes sold at EUR 1.4/kg. |
| Simulated Market III | Five products: Baseline plus the newly washed local potatoes sold at EUR 1.2/kg. |
| Simulated Market IV | Five products: Baseline plus the newly washed local potatoes sold at EUR 1.4/kg. |
References
- Bouwman, E.P.; Galama, J.; Onwezen, M.C. Unravelling Consumer Acceptance of Local Food: Physical versus Social Distance and the Important Role of Social Identification. Appetite 2024, 198, 107331. [Google Scholar] [CrossRef] [PubMed]
- Richards, T.J.; Hamilton, S.F.; Gomez, M.; Rabinovich, E. Retail Intermediation and Local Foods. Am. J. Agric. Econ. 2017, 99, 637–659. [Google Scholar] [CrossRef]
- Siddiqui, M.; Chakraborty, D.; Siddiqui, A. Consumers Buying Behaviour towards Agri-Food Products: A Mixed-Method Approach. J. Retail. Consum. Serv. 2023, 73, 103349. [Google Scholar] [CrossRef]
- Kumar, S.; Murphy, M.; Talwar, S.; Kaur, P.; Dhir, A. What Drives Brand Love and Purchase Intentions toward the Local Food Distribution System? A Study of Social Media-Based REKO (Fair Consumption) Groups. J. Retail. Consum. Serv. 2021, 60, 102444. [Google Scholar] [CrossRef]
- Hughes, D.W.; Isengildina-Massa, O. The Economic Impact of Farmers’ Markets and a State Level Locally Grown Campaign. Food Policy 2015, 54, 78–84. [Google Scholar] [CrossRef]
- Enthoven, L.; Van den Broeck, G. Local Food Systems: Reviewing Two Decades of Research. Agric. Syst. 2021, 193, 103226. [Google Scholar] [CrossRef]
- Deppermann, A.; Havlík, P.; Valin, H.; Boere, E.; Herrero, M.; Vervoort, J.; Mathijs, E. The Market Impacts of Shortening Feed Supply Chains in Europe. Food Secur. Sci. Sociol. Econ. Food Prod. Access Food 2018, 10, 1401–1410. [Google Scholar] [CrossRef]
- Donaher, E.; Lynes, J. Is Local Produce More Expensive? Challenging Perceptions of Price in Local Food Systems. Local Environ. 2017, 22, 746–763. [Google Scholar] [CrossRef]
- Feldmann, C.; Hamm, U. Consumers’ Perceptions and Preferences for Local Food: A Review. Food Qual. Prefer. 2015, 40, 152–164. [Google Scholar] [CrossRef]
- Printezis, I.; Grebitus, C. Marketing Channels for Local Food. Ecol. Econ. 2018, 152, 161–171. [Google Scholar] [CrossRef]
- Lynes, J.; Whitney, S.; Murray, D. Developing Benchmark Criteria for Assessing Community-Based Social Marketing Programs: A Look into Jack Johnson’s “All at Once” Campaign. J. Soc. Mark. 2014, 4, 111–132. [Google Scholar] [CrossRef]
- Campbell, J.M. Muy Local: Differentiating Hispanic and Caucasian Shoppers of Locally Produced Foods in US Grocery. J. Retail. Consum. Serv. 2013, 20, 325–333. [Google Scholar] [CrossRef]
- De Fazio, M. Agriculture and Sustainability of the Welfare: The Role of the Short Supply Chain. Agric. Agric. Sci. Procedia 2016, 8, 461–466. [Google Scholar] [CrossRef]
- Mundler, P.; Laughrea, S. The Contributions of Short Food Supply Chains to Territorial Development: A Study of Three Quebec Territories. J. Rural. Stud. 2016, 45, 218–229. [Google Scholar] [CrossRef]
- Hedberg, R.C.; Zimmerer, K.S. What’s the Market Got to Do with It? Social-Ecological Embeddedness and Environmental Practices in a Local Food System Initiative. Geoforum 2020, 110, 35–45. [Google Scholar] [CrossRef]
- Campbell, J.M.; DiPietro, R.B. Sign of the Times: Testing Consumer Response to Local Food Signage within a Casual Dining Restaurant. J. Retail. Consum. Serv. 2014, 21, 812–823. [Google Scholar] [CrossRef]
- Kumar, S.; Talwar, S.; Murphy, M.; Kaur, P.; Dhir, A. A Behavioural Reasoning Perspective on the Consumption of Local Food. A Study on REKO, a Social Media-Based Local Food Distribution System. Food Qual. Prefer. 2021, 93, 104264. [Google Scholar] [CrossRef]
- Jensen, H.; Pérez Domínguez, I.; Fellmann, T.; Lirette, P.; Hristov, J.; Philippidis, G. Economic Impacts of a Low Carbon Economy on Global Agriculture: The Bumpy Road to Paris. Sustainability 2019, 11, 2349. [Google Scholar] [CrossRef]
- Birch, D.; Memery, J.; De Silva Kanakaratne, M. The Mindful Consumer: Balancing Egoistic and Altruistic Motivations to Purchase Local Food. J. Retail. Consum. Serv. 2018, 40, 221–228. [Google Scholar] [CrossRef]
- Bazzani, C.; Caputo, V.; Nayga, R.M.; Canavari, M. Testing Commitment Cost Theory in Choice Experiments. Econ. Inq. 2017, 55, 383–396. [Google Scholar] [CrossRef]
- Casado-Aranda, L.-A.; Sánchez-Fernández, J.; Ibáñez-Zapata, J.-Á.; Liébana-Cabanillas, F.J. How Consumer Ethnocentrism Modulates Neural Processing of Domestic and Foreign Products: A Neuroimaging Study. J. Retail. Consum. Serv. 2020, 53, 101961. [Google Scholar] [CrossRef]
- Colantuoni, F.; Cicia, G.; Del Giudice, T.; Lass, D.; Caracciolo, F.; Lombardi, P. Heterogeneous Preferences for Domestic Fresh Produce: Evidence from German and Italian Early Potato Markets. Agribusiness 2016, 32, 512–530. [Google Scholar] [CrossRef]
- EUROSTAT The EU Potato Sector—Statistics on Production, Prices and Trade. Available online: https://ec.europa.eu/eurostat/statistics-explained/index.php?title=The_EU_potato_sector_-_statistics_on_production,_prices_and_trade (accessed on 18 March 2025).
- Tilman, D.; Fargione, J.; Wolff, B.; D’Antonio, C.; Dobson, A.; Howarth, R.; Schindler, D.; Schlesinger, W.H.; Simberloff, D.; Swackhamer, D. Forecasting Agriculturally Driven Global Environmental Change. Science 2001, 292, 281–284. [Google Scholar] [CrossRef] [PubMed]
- Ritchie, H.; Rosado, P.; Roser, M. Environmental Impacts of Food Production. Our World Data. 2022. Available online: https://ourworldindata.org/environmental-impacts-of-food#article-citation (accessed on 10 April 2025).
- United Nation Sustainable Consumption and Production | Department of Economic and Social Affairs. Available online: https://sdgs.un.org/topics/sustainable-consumption-and-production (accessed on 10 April 2025).
- Grunert, K.G. Sustainability in the Food Sector: A Consumer Behaviour Perspective. Int. J. Food Syst. Dyn. 2011, 2, 207–218. [Google Scholar] [CrossRef]
- Vermeir, I.; Verbeke, W. Sustainable Food Consumption: Exploring the Consumer “Attitude—Behavioral Intention” Gap. J. Agric. Environ. Ethics 2006, 19, 169–194. [Google Scholar] [CrossRef]
- Garnett, T. Where Are the Best Opportunities for Reducing Greenhouse Gas Emissions in the Food System (Including the Food Chain)? Food Policy 2011, 36, S23–S32. [Google Scholar] [CrossRef]
- Gil, M.I.; Allende, A. Minimal Processing. In Decontamination of Fresh and Minimally Processed Produce; John Wiley & Sons, Inc.: Hoboken, NJ, USA, 2012; ISBN 978-1-118-22918-7. [Google Scholar]
- Rico, D.; Martín-Diana, A.B.; Barat, J.M.; Barry-Ryan, C. Extending and Measuring the Quality of Fresh-Cut Fruit and Vegetables: A Review. Trends Food Sci. Technol. 2007, 18, 373–386. [Google Scholar] [CrossRef]
- Ballco, P.; Gomez, M.I.; Gracia, A. Consumers’ Acceptability and Sensory Evaluation of a Traditional Local Fresh Potato Variety. Span. J. Agric. Res. 2023, 21, e0105. [Google Scholar] [CrossRef]
- Willersinn, C.; Mouron, P.; Mack, G.; Siegrist, M. Food Loss Reduction from an Environmental, Socio-Economic and Consumer Perspective—The Case of the Swiss Potato Market. Waste Manag. 2017, 59, 451–464. [Google Scholar] [CrossRef]
- Willersinn, C.; Möbius, S.; Mouron, P.; Lansche, J.; Mack, G. Environmental Impacts of Food Losses along the Entire Swiss Potato Supply Chain—Current Situation and Reduction Potentials. J. Clean. Prod. 2017, 140, 860–870. [Google Scholar] [CrossRef]
- Kneafsey, M.; Venn, L.; Schmutz, U.; Balasz, B.; Trenchard, L.; Eyden-Wood, T.; Bos, E.; Sutton, G.; Blackett, M.; Short Food Supply Chains and Local Food Systems in the EU. A State of Play of Their Socio-Economic Characteristics. Available online: https://publications.jrc.ec.europa.eu/repository/handle/JRC80420 (accessed on 11 July 2022).
- Caputo, V.; Scarpa, R.; Nayga, R.M. Cue versus Independent Food Attributes: The Effect of Adding Attributes in Choice Experiments. Eur. Rev. Agric. Econ. 2017, 44, 211–230. [Google Scholar] [CrossRef]
- Scarpa, R.; Gilbride, T.J.; Campbell, D.; Hensher, D.A. Modelling Attribute Non-Attendance in Choice Experiments for Rural Landscape Valuation. Eur. Rev. Agric. Econ. 2009, 36, 151–174. [Google Scholar] [CrossRef]
- Scarpa, R.; Thiene, M.; Hensher, D.A. Monitoring Choice Task Attribute Attendance in Nonmarket Valuation of Multiple Park Management Services: Does It Matter? Land Econ. 2010, 86, 817–839. [Google Scholar] [CrossRef]
- Campbell, D.; Hensher, D.A.; Scarpa, R. Non-Attendance to Attributes in Environmental Choice Analysis: A Latent Class Specification. J. Environ. Plan. Manag. 2011, 54, 1061–1076. [Google Scholar] [CrossRef]
- Kragt, M.E. Stated and Inferred Attribute Attendance Models: A Comparison with Environmental Choice Experiments. J. Agric. Econ. 2013, 64, 719–736. [Google Scholar] [CrossRef]
- Zhang, T.; Grunert, K.G.; Zhou, Y. A Values—Beliefs—Attitude Model of Local Food Consumption: An Empirical Study in China and Denmark. Food Qual. Prefer. 2020, 83, 103916. [Google Scholar] [CrossRef]
- Gracia, A. Consumers’ Preferences for a Local Food Product: A Real Choice Experiment. Empir. Econ. 2014, 47, 111–128. [Google Scholar] [CrossRef]
- Adalja, A.; Hanson, J.; Towe, C.; Tselepidakis, E. An Examination of Consumer Willingness to Pay for Local Products. Agric. Resour. Econ. Rev. 2015, 44, 253–274. [Google Scholar] [CrossRef]
- Fan, X.; Gómez, M.I.; Coles, P.S. Willingness to Pay, Quality Perception, and Local Foods: The Case of Broccoli. Agric. Resour. Econ. Rev. 2019, 48, 414–432. [Google Scholar] [CrossRef]
- Stein, A.J.; Santini, F. The Sustainability of “Local” Food: A Review for Policy-Makers. Rev. Agric. Food Environ. Stud. 2022, 103, 77–89. [Google Scholar] [CrossRef]
- Adams, M. The Aesthetic Value of Local Food. Monist 2018, 101, 324–339. [Google Scholar] [CrossRef]
- Bavorova, M.; Unay-Gailhard, I.; Lehberger, M. Who Buys from Farmers’ Markets and Farm Shops: The Case of Germany. Int. J. Consum. Stud. 2016, 40, 107–114. [Google Scholar] [CrossRef]
- Skallerud, K.; Wien, A.H. Preference for Local Food as a Matter of Helping Behaviour: Insights from Norway. J. Rural. Stud. 2019, 67, 79–88. [Google Scholar] [CrossRef]
- Hempel, C.; Hamm, U. Local and/or Organic: A Study on Consumer Preferences for Organic Food and Food from Different Origins. Int. J. Consum. Stud. 2016, 40, 732–741. [Google Scholar] [CrossRef]
- Vapa-Tankosić, J.; Ignjatijević, S.; Kiurski, J.; Milenković, J.; Milojević, I. Analysis of Consumers’ Willingness to Pay for Organic and Local Honey in Serbia. Sustainability 2020, 12, 4686. [Google Scholar] [CrossRef]
- Gracia, A.; Barreiro-Hurlé, J.; Galán, B.L. Are Local and Organic Claims Complements or Substitutes? A Consumer Preferences Study for Eggs. J. Agric. Econ. 2014, 65, 49–67. [Google Scholar] [CrossRef]
- Hasselbach, J.L.; Roosen, J. Consumer Heterogeneity in the Willingness to Pay for Local and Organic Food. J. Food Prod. Mark. 2015, 21, 608–625. [Google Scholar] [CrossRef]
- Willis, D.B.; Carpio, C.E.; Boys, K.A. Supporting Local Food System Development Through Food Price Premium Donations: A Policy Proposal. J. Agric. Appl. Econ. 2016, 48, 192–217. [Google Scholar] [CrossRef]
- Kiss, K.; Ruszkai, C.; Szűcs, A.; Koncz, G. Examining the Role of Local Products in Rural Development in the Light of Consumer Preferences—Results of a Consumer Survey from Hungary. Sustainability 2020, 12, 5473. [Google Scholar] [CrossRef]
- Bi, X.; House, L.; Gao, Z.; Gmitter, F. Sensory Evaluation and Experimental Auctions: Measuring Willingness to Pay for Specific Sensory Attributes. Am. J. Agric. Econ. 2012, 94, 562–568. [Google Scholar] [CrossRef]
- Ballco, P.; Gracia, A.; Jurado, J. Consumer Preferences for Extra Virgin Olive Oil with Protected Designation of Origin (PDO); Editorial Universitat Politecnica de Valencia: Córdoba, Spain, 2015; pp. 607–612. [Google Scholar]
- Ballco, P.; Jaafer, F.; de Magistris, T. Investigating the Price Effects of Honey Quality Attributes in a European Country: Evidence from a Hedonic Price Approach. Agribusiness 2022, 38, 885–904. [Google Scholar] [CrossRef]
- Ballco, P.; Gracia, A. Do Market Prices Correspond with Consumer Demands? Combining Market Valuation and Consumer Utility for Extra Virgin Olive Oil Quality Attributes in a Traditional Producing Country. J. Retail. Consum. Serv. 2020, 53, 101999. [Google Scholar] [CrossRef]
- Amato, M.; Ballco, P.; López-Galán, B.; De Magistris, T.; Verneau, F. Exploring Consumers’ Perception and Willingness to Pay for “Non-Added Sulphite” Wines through Experimental Auctions: A Case Study in Italy and Spain. Wine Econ. Policy 2017, 6, 146–154. [Google Scholar] [CrossRef]
- Pérez y Pérez, L.; Gracia, A. Consumer Preferences for Olive Oil in Spain: A Best-Worst Scaling Approach. Sustainability 2023, 15, 11283. [Google Scholar] [CrossRef]
- Pérez y Pérez, L.; Gracia, A.; Barreiro-Hurlé, J. Not Seeing the Forest for the Trees: The Impact of Multiple Labelling on Consumer Choices for Olive Oil. Foods 2020, 9, 186. [Google Scholar] [CrossRef] [PubMed]
- Caputo, V.; Van Loo, E.J.; Scarpa, R.; Nayga, R.M.; Verbeke, W. Comparing Serial, and Choice Task Stated and Inferred Attribute Non-Attendance Methods in Food Choice Experiments. J. Agric. Econ. 2018, 69, 35–57. [Google Scholar] [CrossRef]
- Van Loo, E.J.; Caputo, V.; Nayga, R.M.; Seo, H.-S.; Zhang, B.; Verbeke, W. Sustainability Labels on Coffee: Consumer Preferences, Willingness-to-Pay and Visual Attention to Attributes. Ecol. Econ. 2015, 118, 215–225. [Google Scholar] [CrossRef]
- Gonçalves, T.; Lourenço-Gomes, L.; Pinto, L.M.C. The Role of Attribute Non-Attendance on Consumer Decision-Making: Theoretical Insights and Empirical Evidence. Econ. Anal. Policy 2022, 76, 788–805. [Google Scholar] [CrossRef]
- Hess, S.; Hensher, D.A. Using Conditioning on Observed Choices to Retrieve Individual-Specific Attribute Processing Strategies. Transp. Res. Part B Methodol. 2010, 44, 781–790. [Google Scholar] [CrossRef]
- Balcombe, K.; Bitzios, M.; Fraser, I.M.; Haddock-Fraser, J. Using Attribute Importance Rankings Within Discrete Choice Experiments: An Application to Valuing Bread Attributes. J. Agric. Econ. 2014, 65, 446–462. [Google Scholar] [CrossRef]
- Chalak, A.; Abiad, M.; Balcombe, K. Joint Use of Attribute Importance Rankings and Non-Attendance Data in Choice Experiments. Eur. Rev. Agric. Econ. 2016, 43, 737–760. [Google Scholar] [CrossRef]
- Louviere, J.J.; Hensher, D.A.; Swait, J.D.; Adamowicz, W. Stated Choice Methods: Analysis and Applications; Cambridge University Press: Cambridge, UK, 2000; ISBN 978-0-511-75383-1. [Google Scholar]
- Balcombe, K.; Fraser, I.; Williams, L.; McSorley, E. Examining the Relationship between Visual Attention and Stated Preferences: A Discrete Choice Experiment Using Eye-Tracking. J. Econ. Behav. Organ. 2017, 144, 238–257. [Google Scholar] [CrossRef]
- Chavez, D.; Palma, M.; Collart, A. Using Eye-Tracking to Model Attribute Non-Attendance in Choice Experiments. Appl. Econ. Lett. 2017, 25, 1355–1359. [Google Scholar] [CrossRef]
- Van Loo, E.J.; Nayga, R.M., Jr.; Campbell, D.; Seo, H.-S.; Verbeke, W. Using Eye Tracking to Account for Attribute Non-Attendance in Choice Experiments. Eur. Rev. Agric. Econ. 2018, 45, 333–365. [Google Scholar] [CrossRef]
- Verhoef, P.C. Explaining Purchases of Organic Meat by Dutch Consumers. Eur. Rev. Agric. Econ. 2005, 32, 245–267. [Google Scholar] [CrossRef]
- INE INEbase/Demografía y Población/Cifras de Población y Censos Demográficos/Cifras de Población/Últimos Datos. Available online: http://www.ine.es/dyngs/INEbase/es/operacion.htm?c=Estadistica_C&cid=1254736176951&menu=ultiDatos&idp=1254735572981 (accessed on 21 May 2018).
- OCDE Compare Your Country—Education at a Glance. Available online: http://www.oecd.org/education/Education-at-a-Glance-2014.pdf (accessed on 21 May 2018).
- McFadden, D. Conditional Logit Analysis of Qualitative Choice Behaviour. In Frontiers in Econometrics; Academic Press: New York, NY, USA, 1973; pp. 105–142. [Google Scholar]
- Haghani, M.; Bliemer, M.C.J.; Rose, J.M.; Oppewal, H.; Lancsar, E. Hypothetical Bias in Stated Choice Experiments: Part II. Conceptualisation of External Validity, Sources and Explanations of Bias and Effectiveness of Mitigation Methods. J. Choice Model. 2021, 41, 100322. [Google Scholar] [CrossRef]
- Haghani, M.; Bliemer, M.C.J.; Rose, J.M.; Oppewal, H.; Lancsar, E. Hypothetical Bias in Stated Choice Experiments: Part I. Macro-Scale Analysis of Literature and Integrative Synthesis of Empirical Evidence from Applied Economics, Experimental Psychology and Neuroimaging. J. Choice Model. 2021, 41, 100309. [Google Scholar] [CrossRef]
- Lusk, J.L.; Schroeder, T.C. Are Choice Experiments Incentive Compatible? A Test with Quality Differentiated Beef Steaks. Am. J. Agric. Econ. 2004, 86, 467–482. [Google Scholar] [CrossRef]
- Cummings, R.G.; Taylor, L.O. Unbiased Value Estimates for Environmental Goods: A Cheap Talk Design for the Contingent Valuation Method. Am. Econ. Rev. 1999, 89, 649–665. [Google Scholar] [CrossRef]
- Gascón-Tella, R. Nace Un Grupo Cooperativo Para Fomentar El Consumo de La Patata Aragonesa. Available online: http://historico.aragondigital.es/noticia.asp?notid=160811 (accessed on 11 July 2022).
- Boletin Agrario. Food Prices of Potato in 2018. Available online: https://boletinagrario.com/en/ap39/21/02018/price-potato.html (accessed on 8 April 2025).
- Street, D.J.; Burgess, L. The Construction of Optimal Stated Choice Experiments: Theory and Methods; John Wiley & Sons: Hoboken, NJ, USA, 2007; ISBN 978-0-470-14855-6. [Google Scholar]
- Hess, S.; Hensher, D.A. Making Use of Respondent Reported Processing Information to Understand Attribute Importance: A Latent Variable Scaling Approach. Transportation 2013, 40, 397–412. [Google Scholar] [CrossRef]
- Meyerhoff, J.; Liebe, U. Status Quo Effect in Choice Experiments: Empirical Evidence on Attitudes and Choice Task Complexity. Land Econ. 2009, 85, 515–528. [Google Scholar] [CrossRef]
- Scarpa, R.; Zanoli, R.; Bruschi, V.; Naspetti, S. Inferred and Stated Attribute Non-Attendance in Food Choice Experiments. Am. J. Agric. Econ. 2013, 95, 165–180. [Google Scholar] [CrossRef]
- Lagerkvist, C.J. Consumer Preferences for Food Labelling Attributes: Comparing Direct Ranking and Best–Worst Scaling for Measurement of Attribute Importance, Preference Intensity and Attribute Dominance. Food Qual. Prefer. 2013, 29, 77–88. [Google Scholar] [CrossRef]
- Lancaster, K.J. A New Approach to Consumer Theory. J. Political Econ. 1966, 74, 132–157. [Google Scholar] [CrossRef]
- Carlsson, F.; Kataria, M.; Lampi, E. Dealing with Ignored Attributes in Choice Experiments on Valuation of Sweden’s Environmental Quality Objectives. Environ. Resour. Econ. 2010, 47, 65–89. [Google Scholar] [CrossRef]
- Hensher, D.A.; Rose, J.M.; Greene, W.H. Inferring Attribute Non-Attendance from Stated Choice Data: Implications for Willingness to Pay Estimates and a Warning for Stated Choice Experiment Design. Transportation 2012, 39, 235–245. [Google Scholar] [CrossRef]
- Train, K.E. Discrete Choice Methods with Simulation; Cambridge University Press: Cambridge, UK, 2003. [Google Scholar]
- Barreiro Hurlé, J.; Gracia, A.; de Magistris, T. Market Implications of New Regulations: Impact of Health and Nutrition Information on Consumer Choice. Span. J. Agric. Res. 2009, 7, 257–268. [Google Scholar] [CrossRef]
- Weatherell, C.; Tregear, A.; Allinson, J. In Search of the Concerned Consumer: UK Public Perceptions of Food, Farming and Buying Local. J. Rural. Stud. 2003, 19, 233–244. [Google Scholar] [CrossRef]
- Akaichi, F.; Nayga, R.M., Jr.; Gil, J.M. Assessing Consumers’ Willingness to Pay for Different Units of Organic Milk: Evidence from Multiunit Auctions. Can. J. Agric. Econ. Rev. Can. D’agroecon. 2012, 60, 469–494. [Google Scholar] [CrossRef]
- Adams, D.C.; Salois, M.J. Local versus Organic: A Turn in Consumer Preferences and Willingness-to-Pay. Renew. Agric. Food Syst. 2010, 25, 331–341. [Google Scholar] [CrossRef]
- Brugarolas, M.; Martínez-Carrasco, L.; Martínez Poveda, A.; Ruiz, J.J. A Competitive Strategy for Vegetable Products: Traditional Varieties of Tomato in the Local Market. Span. J. Agric. Res. 2009, 7, 294. [Google Scholar] [CrossRef]
- Song, X.; Bredahl, L.; Diaz Navarro, M.; Pendenza, P.; Stojacic, I.; Mincione, S.; Pellegrini, G.; Schlüter, O.K.; Torrieri, E.; Di Monaco, R.; et al. Factors Affecting Consumer Choice of Novel Non-Thermally Processed Fruit and Vegetables Products: Evidence from a 4-Country Study in Europe. Food Res. Int. 2022, 153, 110975. [Google Scholar] [CrossRef] [PubMed]
- Hole, A.R.; Kolstad, J.R.; Gyrd-Hansen, D. Inferred vs. Stated Attribute Non-Attendance in Choice Experiments: A Study of Doctors’ Prescription Behaviour. J. Econ. Behav. Organ. 2013, 96, 21–31. [Google Scholar] [CrossRef]
- Ballco, P.; de-Magistris, T.; Caputo, V. Consumer Preferences for Nutritional Claims: An Exploration of Attention and Choice Based on an Eye-Tracking Choice Experiment. Food Res. Int. 2019, 116, 37–48. [Google Scholar] [CrossRef]
- Ballco, P.; Caputo, V.; de-Magistris, T. Consumer Valuation of European Nutritional and Health Claims: Do Taste and Attention Matter? Food Qual. Prefer. 2020, 79, 103–793. [Google Scholar] [CrossRef]
| Characteristics | Sample (n = 151) | Spanish Population a,b |
|---|---|---|
| Gender | ||
| Male | 24.0 | 49.1 |
| Female | 76.0 | 50.9 |
| Age (average, standard dev) | 54.4 (13.6) | 42.7 |
| 18–34 | 6.4 | 21.6 |
| 35–44 | 14.4 | 20.9 |
| 45–54 | 29.6 | 19.2 |
| ≥55 | 49.6 | 38.2 |
| Level of education | ||
| Primary | 20.0 | 17.0 |
| Secondary | 24.0 | 50.0 |
| Higher | 56.0 | 33.0 |
| Household monthly income | ||
| ≤EUR 1500/month | 22.4 | N/A |
| EUR 1501–2500/month | 22.4 | N/A |
| EUR 2501–3500/month | 20.0 | N/A |
| >EUR 3500/month | 12.0 | N/A |
| Do not know/refuse to answer | 23.2 | N/A |
| Household size (average, standard dev) | 2.9 (1.0) | 2.53 |
| Children younger than 18 years | ||
| 0 | 69.1 | N/A |
| 1 | 17.9 | N/A |
| 2 | 10.6 | N/A |
| >3 | 2.4 | N/A |
| Vegetarian | 2.4 | N/A |
| Years living in the region (average) | 50.0 | N/A |
| Frequency of shopping for food Always Often | 44.8 50.3 | N/A N/A |
| Frequency of cooking at home Every day Several times a week | 81.5 9.6 | N/A N/A |
| Attributes | Levels |
|---|---|
| Price (Euro/kg) | EUR 0.8 per kilogram (kg), EUR 1.0/kg, EUR 1.2/kg and EUR 1.4/kg |
| Presentation | “Washed” “Unwashed” |
| Origin of production | “Locally grown” “Non-locally grown” |
| Number of Attributes Ignored | % Respondents | Attributes Ignored | % Respondents |
|---|---|---|---|
| 0 | 24.0 | Price | 56.0 |
| 1 | 33.6 | Presentation | 39.2 |
| 2 | 42.4 | Local | 23.2 |
| 3 | 0.0 |
| Attendance | Inferred a | Stated | Price High | Price Low | Washed High | Washed Low | Local High | Local Low |
|---|---|---|---|---|---|---|---|---|
| Full attendance | 22.5 | 24.0 | 53.3 | 33.33 | 50.0 | 36.7 | 20.0 | 46.7 |
| Ignored only Local | 0.0 | 3.2 | 75.0 | 0.0 | 25.0 | 25.0 | 0.0 | 100.0 |
| Ignored only Washed | 12.8 | 12.8 | 56.2 | 25.0 | 6.2 | 81.2 | 68.7 | 6.2 |
| Ignored only price | 0.0 | 17.6 | 18.2 | 63.6 | 63.5 | 18.2 | 45.5 | 27.3 |
| Attend only price | 0.0 | 4.0 | 100.0 | 0.0 | 60.0 | 40.0 | 0.0 | 60.0 |
| Attend only Washed | 15.4 | 16.0 | 20.0 | 40.0 | 85.0 | 5.0 | 25.0 | 65.0 |
| Attend only local | 40.2 | 22.4 | 25.0 | 64.3 | 21.4 | 60.7 | 71.4 | 17.9 |
| Full non-attendance | 9.1 | 0.0 | 0.0 | 0.0 | 0.0 | 0.0 | 0.0 | 0.0 |
| Parameters Estimates | Model 1 | Model 2 | Model 3 a | Model 4 a | ||
|---|---|---|---|---|---|---|
| α | 4.84 *** (9.34) | 5.83 *** (8.51) | 6.37 *** (10.25) | 6.37 *** (10.25) | ||
| PRICE | –3.01 *** (−13.64) | −4.94 *** (−14.19) | −1.50 *** (−4.87) | −1.43 *** (−4.90) | ||
| UNWASHED | −0.55 *** (−3.06) | −0.99 *** (−4.75) | −0.017 (−0.08) | --- (---) | ||
| LOCAL | 1.84 *** (11.45) | 2.22 *** (12.10) | 0.66 *** (3.14) | 0.66 *** (3.14) | ||
| PRICE*DAttPrice | −4.00 *** (−8.93) | −4.01 *** (−9.21) | ||||
| UNWASHED*DAttUnwashed | −1.08 *** (−3.16) | −1.09 *** (−4.45) | ||||
| LOCAL*DAttLocal | 1.73 *** (5.92) | 1.74 *** (5.93) | ||||
| The standard deviation of parameters | ||||||
| UNWASHED*DAttUnwashed | 1.46 *** (8.6) | 1.44 *** (7.14) | 1.58 *** (7.43) | 1.58 *** (7.43) | ||
| LOCAL*DAttLocal | 1.16 *** (5.09) | 0.98 *** (2.77) | 1.02 *** (3.81) | 1.02 *** (3.81) | ||
| σ | 2.35 *** (5.14) | 4.29 *** (8.64) | 3.58 *** (7.9) | 3.58 *** (7.99) | ||
| Log L | −659.21 | −614.61 | −597.15 | −597.16 | ||
| Adj.R2 | 0.397 | 0.438 | 0.453 | 0.456 | ||
| AIC/N | 1.334 | 1.245 | 1.216 | 1.214 | ||
| Marginal WTP estimates | ||||||
| Considered | Ignored | Considered | Ignored | |||
| UNWASHED | −0.18 *** (−2.96) | −0.20 *** (−4.54) | −0.19 *** (−4.31) | −0.01 (−0.08) | −0.19 *** (4.08) | --- |
| LOCAL | 0.61 *** (11.02) | 0.45 *** (10.50) | 0.44 *** (−10.74) | 0.44 *** (2.78) | 0.44 *** (5.39) | 0.44 *** (2.79) |
| Parameters Estimates | Model 5 | Model 6 a | Model 7 b | ||
|---|---|---|---|---|---|
| α | 3.80 *** (4.80) | 5.29 *** (9.41) | 6.64 *** (8.76) | ||
| PRICE | −4.84 *** (−9.77) | −3.79 *** (−14.07) | −1.93 *** (−5.53) | ||
| UNWASHED | −1.85 *** (−6.48) | −1.27 *** (−4.68) | −-- (---) | ||
| LOCAL | 2.01 *** (10.76) | 2.34 *** (11.70) | 1.05 *** (3.79) | ||
| PRICE*DAttPrice | −3.71 *** (−8.44) | ||||
| UNWASHED*DAttUnwashed | −1.09 *** (−4.25) | ||||
| LOCAL*DAttLocal | 1.44 *** (4.60) | ||||
| PRICE*DLowPrice | 1.59 *** (3.58) | 0.80 * (1.82) | |||
| UNWASHED*DLowUnwashed | 1.33 *** (3.62) | --- | |||
| LOCAL*DLowLocal | −1.07 *** (−3.37) | −0.52 * (−1.72) | |||
| The standard deviation of parameters | |||||
| UNWASHED*DAttUnwashed | --- | 1.55 *** (8.00) | 1.70 *** (7.35) | ||
| LOCAL*DAttLocal | --- | 1.07 *** (4.28) | 1.01 *** (4.18) | ||
| σ | --- | 2.82 *** (5.71) | 4.23 *** (6.68) | ||
| Log L | −667.5 | −635.92 | −596.52 | ||
| Adj.R2 | 0.389 | 0.416 | 0.454 | ||
| AIC/N | 1.359 | 1.308 | 1.217 | ||
| Marginal WTP estimates | |||||
| High importance | Low importance | Considered High importance | Ignored Low importance | ||
| UNWASHED | −0.38 *** (−6.28) | −0.33 *** (−4.52) | 0.03 (0.27) | −0.19 *** (−4.13) | --- |
| LOCAL | 0.41 *** (7.31) | 0.61 *** (9.90) | 0.58 *** (3.92) | 0.44 *** (8.89) | 0.46 *** (3.28) |
Disclaimer/Publisher’s Note: The statements, opinions and data contained in all publications are solely those of the individual author(s) and contributor(s) and not of MDPI and/or the editor(s). MDPI and/or the editor(s) disclaim responsibility for any injury to people or property resulting from any ideas, methods, instructions or products referred to in the content. |
© 2025 by the authors. Licensee MDPI, Basel, Switzerland. This article is an open access article distributed under the terms and conditions of the Creative Commons Attribution (CC BY) license (https://creativecommons.org/licenses/by/4.0/).
Share and Cite
Gracia, A.; Gómez, M.I.; Ballco, P. Market Opportunities for Differentiated Locally Grown Fresh Produce: Understanding Consumer Preferences. Sustainability 2025, 17, 3932. https://doi.org/10.3390/su17093932
Gracia A, Gómez MI, Ballco P. Market Opportunities for Differentiated Locally Grown Fresh Produce: Understanding Consumer Preferences. Sustainability. 2025; 17(9):3932. https://doi.org/10.3390/su17093932
Chicago/Turabian StyleGracia, Azucena, Miguel I. Gómez, and Petjon Ballco. 2025. "Market Opportunities for Differentiated Locally Grown Fresh Produce: Understanding Consumer Preferences" Sustainability 17, no. 9: 3932. https://doi.org/10.3390/su17093932
APA StyleGracia, A., Gómez, M. I., & Ballco, P. (2025). Market Opportunities for Differentiated Locally Grown Fresh Produce: Understanding Consumer Preferences. Sustainability, 17(9), 3932. https://doi.org/10.3390/su17093932