1. Introduction
Water scarcity has become a severe constraint to economic growth and a threat to the environment in oasis regions of northwestern China [
1]. The Heihe river basin is a typical oasis region, and the river is the second longest inland river in China. The bulk of the water resources is consumed by the upper-middle reaches through agricultural development, which causes a decrease in runoff to the downstream reaches, leading to severe desertification and ecological degradation [
2,
3]. The conflict of water use between economic sectors and the ecosystem has become a serious threat to sustainable development in the Heihe river basin [
4,
5]. Moreover, increasing water demands for industrial and domestic sectors with industrialization and urbanization has intensified water use conflicts between the upper-middle and downstream reaches. Therefore, an integrated river basin management is needed to deal with water use conflict, with an emphasis on controlling agricultural water demand.
Since 2000, some measures have been implemented to reduce water demand in the Heihe river basin, including controlling total water use and imposing an irrigation water use quota. However, water demand management has not been strictly implemented due to poor enforcement. Farmers either do not comply with the quota or use the saved water to expand irrigated areas. As a consequence, the total water use has increased, rather than decreased, in the past decade. Since 2011, the Chinese government has put forward a new water resource management policy concerning total water use, water use efficiency, and water quality, commonly referred to as “Three Red Lines”. On the national level, a specified control target for total water use was set. Lower level governments are required to set their own water control targets in accordance with the national water control target. For an inland river basin with extremely limited water resources and severe ecosystem degradation due to water over-exploration, the very minimum control target for the Heihe river basin would be to cap the total water use at the allowable withdrawal level under a normal flow year. It is expected that implementing this total water use control policy will have a profound impact on water reallocation across sectors and users in the basin. Some questions arise. How will the water be reallocated among sectors under the total water use control policy? What impact will the control policy have on the economic growth and interests of different sectors? How severe will the loss of farmers’ incomes be under the total water use control policy?
In assessing the economic impact of the restriction of water supply, two approaches are commonly used. One is a top-down approach, which places more emphasis on the impact on the macro level or regional economy. Computable general equilibrium (CGE) models [
6,
7,
8,
9,
10,
11,
12,
13,
14,
15,
16] are frequently used to simulate the operations of market economy and economic consequences in terms of production, trade, growth, water use and welfare caused by policy change by specifying the behavior of relevant “agents” (e.g., producers, households, government) as they interact across markets [
17]. However, one limitation of the top-down approach is that spatial difference of water availability, crop peculiarities and historical practices that vary between regions are not included [
18]. As a cost, the differences in farmers’ responses to water stress such as cropping system changes in different regions are ignored. Also, the top-down approach can only assess the direct economic impacts without taking into account the indirect feedback impacts, which often make the simulation results incomplete or even misleading.
The other approach is the bottom-up in which farm models are often used. Typically, bio-economic (BEM) models are designed with a bottom-up approach. They can specify agricultural economy with local conditions for different irrigation districts, links farmers’ decision making to current and alternative production possibilities, and simulate farmers’ behavior in pursuit of profit maximization under resources constraints [
19,
20,
21,
22,
23]. However, the bottom-up approach also has disadvantages. It cannot specify the broader economic system and form a link between agriculture and macro economy. Therefore, this approach tracks only the impacts on the agricultural system (such as farmers’ decision making in cropping adjustment), but fails to encompass the feedback on the broader economy [
17]. It cannot assess the impacts on economic growth and water reallocation among different sectors.
The integration of top-down modeling and bottom-up modeling is a promising approach to analyze economic impacts of water policy, as it can account for not only local conditions of agricultural systems for different irrigation zones (bottom-up) but also systemic consequences of any changes at an aggregated level (top-down) [
24]. By linking the top-down and bottom-up models, it is possible to simultaneously assess the direct economic impacts of water policy, taking into account spatial heterogeneity, and the indirect feedback effects of micro-economic agents (especially farmers) on the regional economy and water reallocation. This will allow for a more comprehensive evaluation of the economic impacts of the total water use control policy. However, the literature on integration of the top-down and bottom-up models to address river basin management issue is limited [
18,
25,
26,
27]. So far, there is no such research that focuses on the effect of total water use control in China.
This paper aims to develop an integrated modeling approach combined with a top-down CGE model and a bottom-up BEM model to examine the economic impacts of implementing a total water use control policy in the Heihe river basin towards 2020. An integrated CGE-BEM model for the Heihe river basin is built by combining the strengths of the top-down and bottom-up approaches and embedding the feedback between both approaches, which can overcome the disadvantages of a single model approach and provide a better analytical tool for water policy evaluation and river basin management. Based on the integrated CGE-BEM model, the economic impact of controlling the total water use in the Heihe river basin can be simulated and analyzed quantitatively.
2. Research Area and Methodology
2.1. Research Area
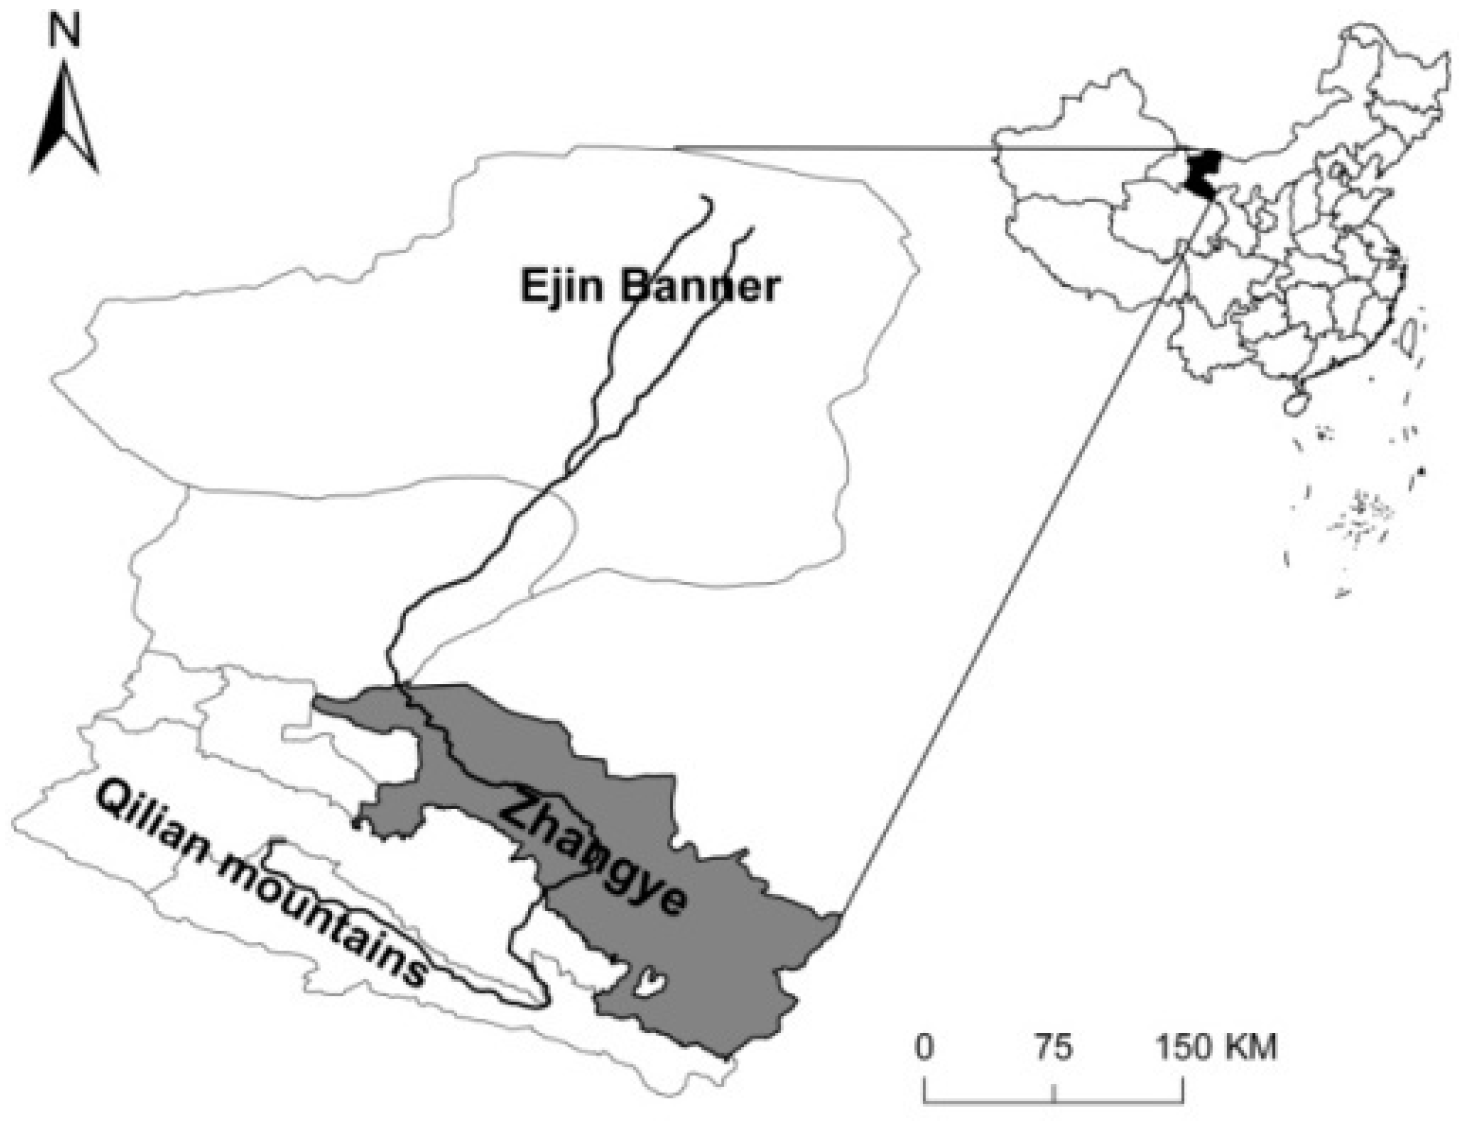
The Heihe River is located in the central part of the Hexi Corridor, northwestern China. The core study area is Zhangye City of Gansu province, located in the middle stream and part of the upstream of the Heihe river basin (
Figure 1). It accounts for 92% of the population, 95% of the farmland, 83% of the GDP and 80% of the water consumption of the Heihe river basin.
Figure 1.
The location of the study area.
Figure 1.
The location of the study area.
Zhangye city, with a population of 1.20 million and a cultivated land area of 239 thousand hectares, comprises six counties: Ganzhou, Shandan, Minle, Gaotai, Linze, and SunanYugur. SunanYugur is a pasturing area and located in the upstream reach, whilst the other five counties are dominated by crop planting and located in the middle stream. Ganzhou, Linze and Gaotai belong to the plain irrigation region, while Shandan and Minle belong to the mountain irrigation region. Zhangye’s GDP was 17.1 billion in 2008, with an annual growth rate of 11.5%. It is a production base of commercial grain in the northwestern China. Agriculture is an important sector, the added value of which was 3.2 billion Yuan, accounting for 19% of Zhangye’s GDP in 2008. By comparison, industrial development is relatively weak. Food processing, petrochemical industry, non-metallic mineral products manufacturing and electricity are the main industries, with a total added value of 6.5 billion Yuan in 2008.
The water consumption of Zhangye amounted to 2.39 billion m
3 in 2010, much higher than the allowable water use amount of about 2.25 billion m
3 under the normal flow year according to Gansu Water Resource Bulletin [
28]. Approximately 94% of all the water is used for agricultural irrigation, whilst only 2% of the water is used for other industries and the rest for households and the environment. Moreover, the irrigation water use efficiency is only 54% in 2010 according to the Water Resource Bureau of Zhangye, much lower than the average water use efficiency of 70%–80% in developed countries [
29]. Industrial and environmental water uses are severely constrained, and economic development and ecosystems are affected.
Zhangye has been experiencing industrialization and urbanization during the past decades and the trend will continue in the coming years. According to the 12th Five-year Plan of Zhangye (2011–2015) [
30], the urbanization rate is projected to increase by 5%, the development of secondary and tertiary industries will be accelerated, and the speed of primary development will slow down. The continuous industrialization and urbanization will generate more demand for water. To meet the increasing industrial and domestic water demand, while controlling the total water use to the allowable level, agricultural water use has to be reduced.
2.2. The CGE Model
The basic dynamic CGE model for Zhangye is built based on the structure developed by Lofgren
et al. and Li
et al. [
31,
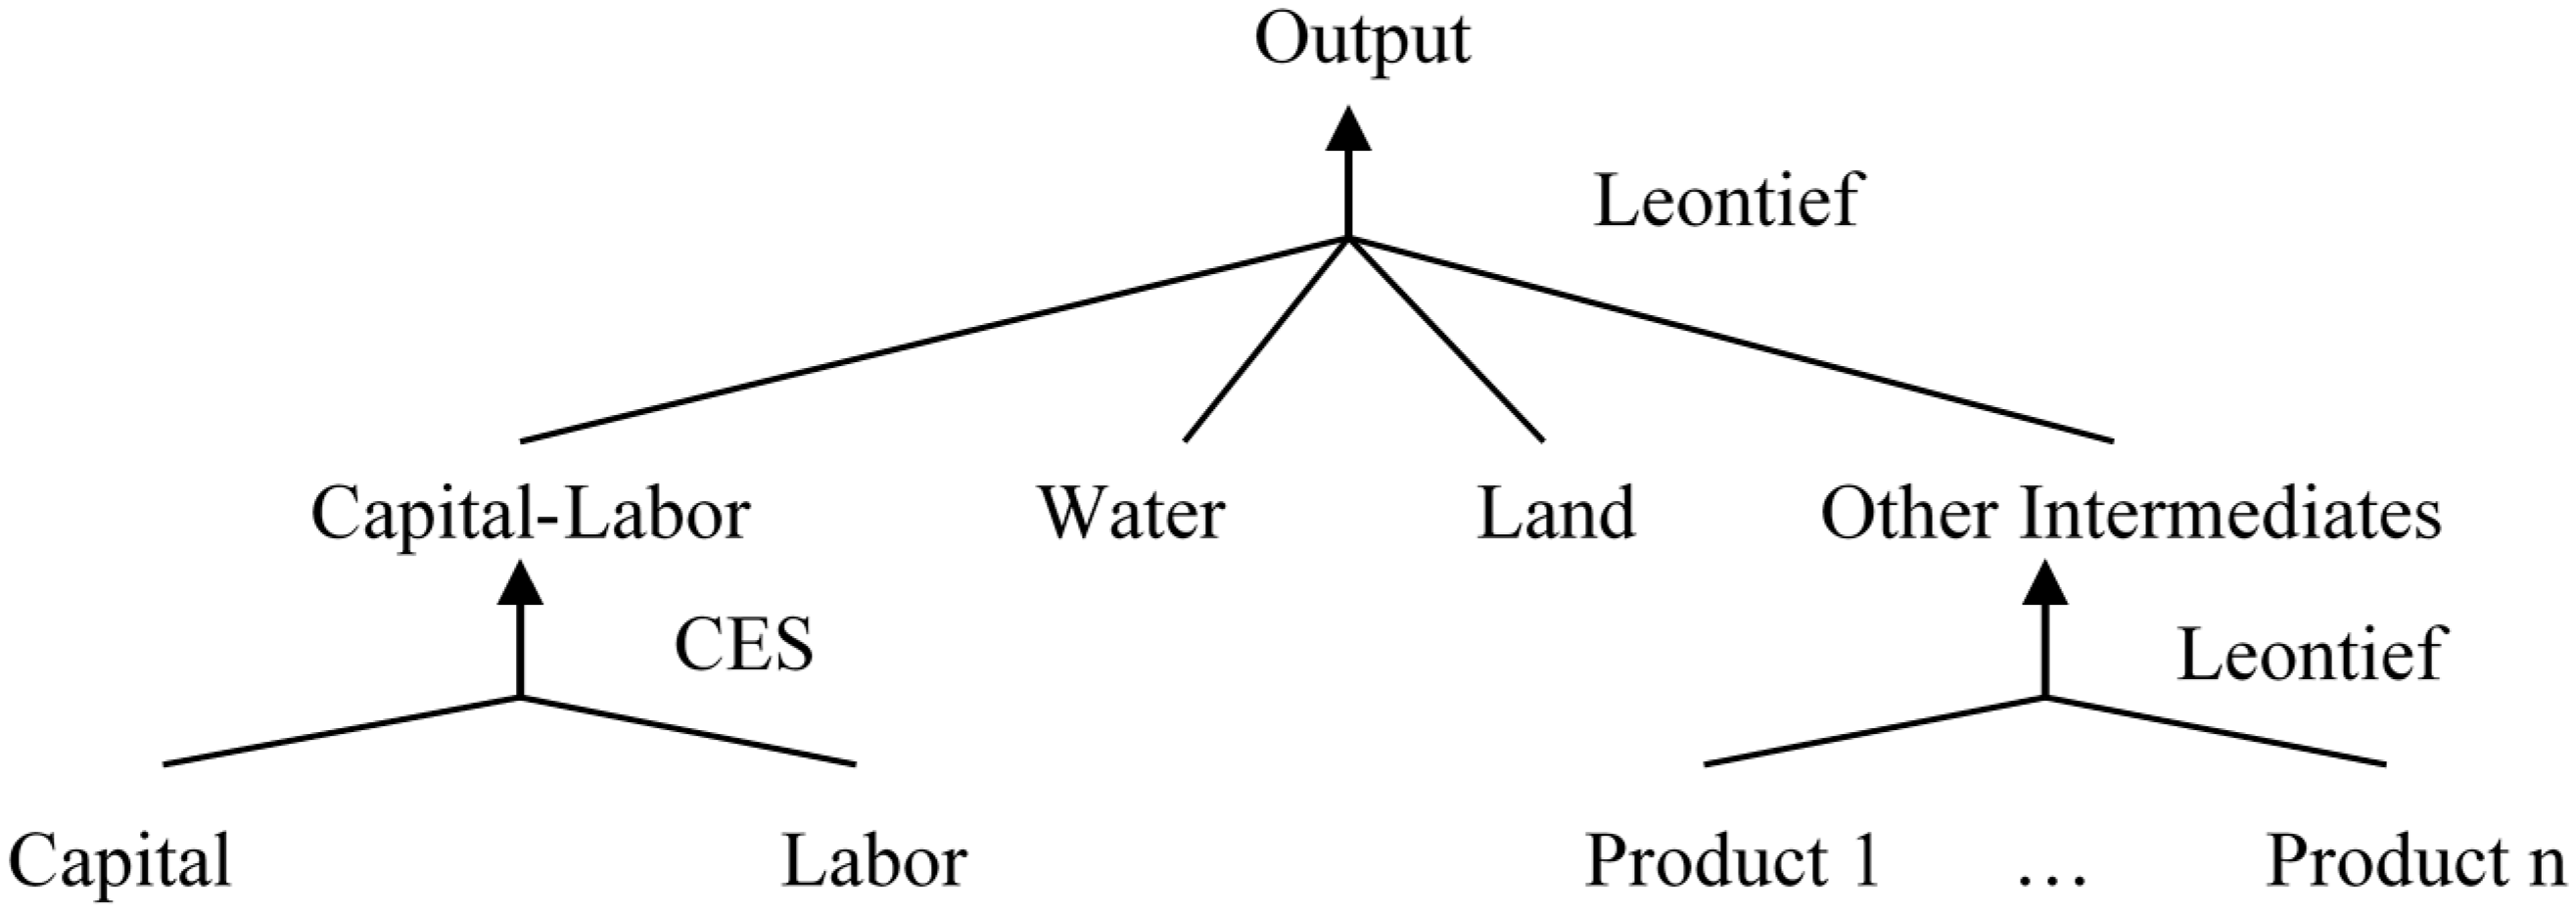
32]. In the production module, capital and labor are treated as primary production factors while water, land and intermediates are treated as intermediate inputs in the sectors’ production functions (
Figure 2). Capital and labor, which can be substituted for each other, are composited together to form a capital-labor bundle through a constant elasticity of substitution (CES) function, as shown in Equation (1). Capital and labor are assumed to be mobile across sectors. Water and land are considered to be non-substitutable by other factors because they are essential intermediate inputs for production in Zhangye (it is assumed that land is only used in the agricultural sector). Likewise, other intermediate inputs and production factors are mutually non-substitutable, as are the intermediate commodities within the intermediate inputs bundles.
Here, we would like to mention that there are two main kinds of practices in dealing with “water” in the CGE model. One is to take water as a production factor (substitutable by other production factors such as capital and labor) [
14,
25]. The other is to take it as an intermediate input (non-substitutable by capital or labor, Leontief relationship) [
11,
15,
33,
34,
35,
36]. It is more important to analyze the specific case before choosing a method. Here, the non-substitution method is used because in the short run the substitution between water and other production factors may be weak in water-scarce arid areas, so that the importance of water for agriculture production is irreplaceable. In the long run, as there are substantial uncertainties on the substitution rates among production factors, setting an arbitrary substitution rate for water may introduce more uncertainty to the results.
Figure 2.
The production structure in the CGE model.
Figure 2.
The production structure in the CGE model.
Leontief functions are used to describe these non-substitutable relationships. The demand for water, land and intermediate commodities are determined by Equations (2)–(4), respectively.
where
QXi denotes the quantity of the output of industry
i,
QKi and
QLi denote the quantity of capital and labor demand, respectively,
Ai denotes the total factor productivity,
BLi and
BKi denote the share parameters of capital and labor, respectively,
Ei denotes the elasticity of substitution,
QWi and
QLAi denote the quantity of water and land demand, respectively,
QAj,i denotes the quantity of intermediate commodity
j demand in industry
i,
Wi, LAi, and
icofj,i represent water, land and intermediate commodity consumption coefficients of per unit output, respectively, and
Gi and
Ti represent the total factor productivity growth rate and water use efficiency improvement rate, respectively.
In the CGE model, investment is determined by savings from household, government, enterprise, and abroad. Household income is used for tax payment, consumption and saving, while government income is expended for transferring payment, subsidy, consumption, and saving. Household and government consumptions are co-determined by income and consumption preference, and they are described through the extended linear expenditure system (ELES). The Armington assumption [
37] is used to distinguish between identical domestic goods and imported goods. World price is exogenous and Zhangye is treated as price taker. The import, export and foreign savings to GDP ratio are set to be endogenous, and the foreign exchange rate is exogenous. The model is recursively dynamic and the simulation period is from 2008–2020. Capital accumulation, labor increases and technology improvements drive the economy to grow and lead to changes in the industrial structure.
The basic dataset of this model is the input-output (IO) table 2008 for Zhangye. The IO table is aggregated into 22 sectors, which includes three agricultural sectors, 15 industrial sectors and four service sectors (
Table 1). The data of water use in different industries are collected from the Gansu Water Resource Bulletin 2009 and the Gansu Statistical Year Book 2009 and provided by the Water Resource Bureau of Zhangye. Water use coefficient or water use per unit of output (value) for individual sectors is calculated based on the IO table and sectoral water use. The details are shown in
Table 1. The elasticities of substitution in CES functions originated from the GTAP Database (version 8) and the work of Li
et al. (2010) [
32]. Other data, including industrial investment, labor, land, tax, flow of funds and so on, are from the Gansu Statistical Year Book 2009 and Zhangye Statistical Year Book 2009.
Table 1.
Sector division and water use per unit of output of Zhangye in 2008.
Table 1.
Sector division and water use per unit of output of Zhangye in 2008.
| Sector Types | Codes | Sectors | Water Use per Unit of Output (m3/10 Thousand yuan) |
|---|
| Primary | 1 | Agriculture | 3896.55 |
| 2 | Animal husbandry | 24.48 |
| 3 | Other agriculture | 292.12 |
| Secondary | 4 | Coal mining, oil and natural gas extraction | 10.97 |
| 5 | Metal minerals mining and dressing | 29.45 |
| 6 | Nonmetal minerals mining and dressing | 9.40 |
| 7 | Food processing and manufacturing | 16.95 |
| 8 | Manufacture of textile wearing apparel and leather | 6.41 |
| 9 | Manufacture of timber, furniture and paper | 3.23 |
| 10 | Petrochemical industry | 14.35 |
| 11 | Manufacture of non-metallic mineral products | 12.24 |
| 12 | Smelting, pressing of metals | 13.35 |
| 13 | Metal products | 1.82 |
| 14 | Manufacture of machinery and electronics | 2.53 |
| 15 | Other manufacture | 1.69 |
| 16 | Electric power, heat power and gas supply | 108.32 |
| 17 | Water production and supply | 14.17 |
| 18 | Construction | 20.31 |
| Tertiary | 19 | Transport, storage and post | 5.82 |
| 20 | Commercial services | 3.36 |
| 21 | Water conservation | 2.02 |
| 22 | Other services | 4.26 |
Water was treated as a necessity for every sector’s production in the CGE model. Each sector’s production has its own ratio to its water consumption (
i.e., water use per unit of output as shown in
Table 1). Therefore, the competition for water is directly related to each sector’s production. A sector’s water consumption increases/decreases with this sector’s production.
2.3. The BEM Model
The BEM model for Zhangye specifies the agriculture system of this area. In the BEM model, agriculture (crop farming) is divided into 10 sub-sectors: food crop, seed corn, greenhouse vegetable, field vegetable, cotton, barley, oil-producing plants, potato, wheat and corn. The five counties, Ganzhou, Linze, Gaotai, Shandan and Minle in Zhangye, are further divided into 31 farming zones based on resource endowments and production activities: 20 farming zones in the plain irrigation regions and 11 farming zones in the mountain irrigation regions. Particularly, every farming zone which consists of several villages has its own crop peculiarity and water use. A tradeoff of water resource allocation exists across irrigation zones. All famers within the same farming type zone are assumed to act similarly in a rational way. They will maximize their profits, assuming the perfect knowledge and foresight.
The BEM model is static and distributed. First, local BEM model is built for each farming zone and we call it a spot BEM. Then, the 31 spot models are integrated into a distributed BEM model at the whole city level of Zhangye. The model is built based on the linear optimization programming structure developed by Shi
et al. and Wang
et al. [
38,
39,
40]. The objective function represents maximization of net income of farmers, and it consisted of crop production, livestock production, cost of crop and livestock production, self-consumption and non-agricultural income. In the static BEM model, production technologies are assumed to be fixed and the available farming activities are not changed (The technological progress over time is reflected in the change in water use efficiency in the agricultural sector in CGE model as shown in
Table 3), so the Leontief functional form is used for the objective function. The constraint functions include available agriculture acreage, family labor, available capital for agriculture production and available water resources. The decision variables include area of each crop, number of each kind of livestock and quantity of resources that is assigned to each kind of crop and livestock.
The data for the BEM model are obtained at first hand by a field survey in 2008. Forty-five villages and 570 households were surveyed based on stratified-random sampling across 31 farming type zones in Zhangye. The data collected for agricultural economy includes crop yield, crop price, and input level such as irrigation water, fertilizer, pesticide, labor, subsidy, consumption and so on. The data for resource constraints of land and labor in each irrigation zone are from statistic year books of each county. The data for water resources of the Heihe river basin are provided by the Water Resource Bureau of Zhangye.
2.4. Coupling of the CGE and BEM Models
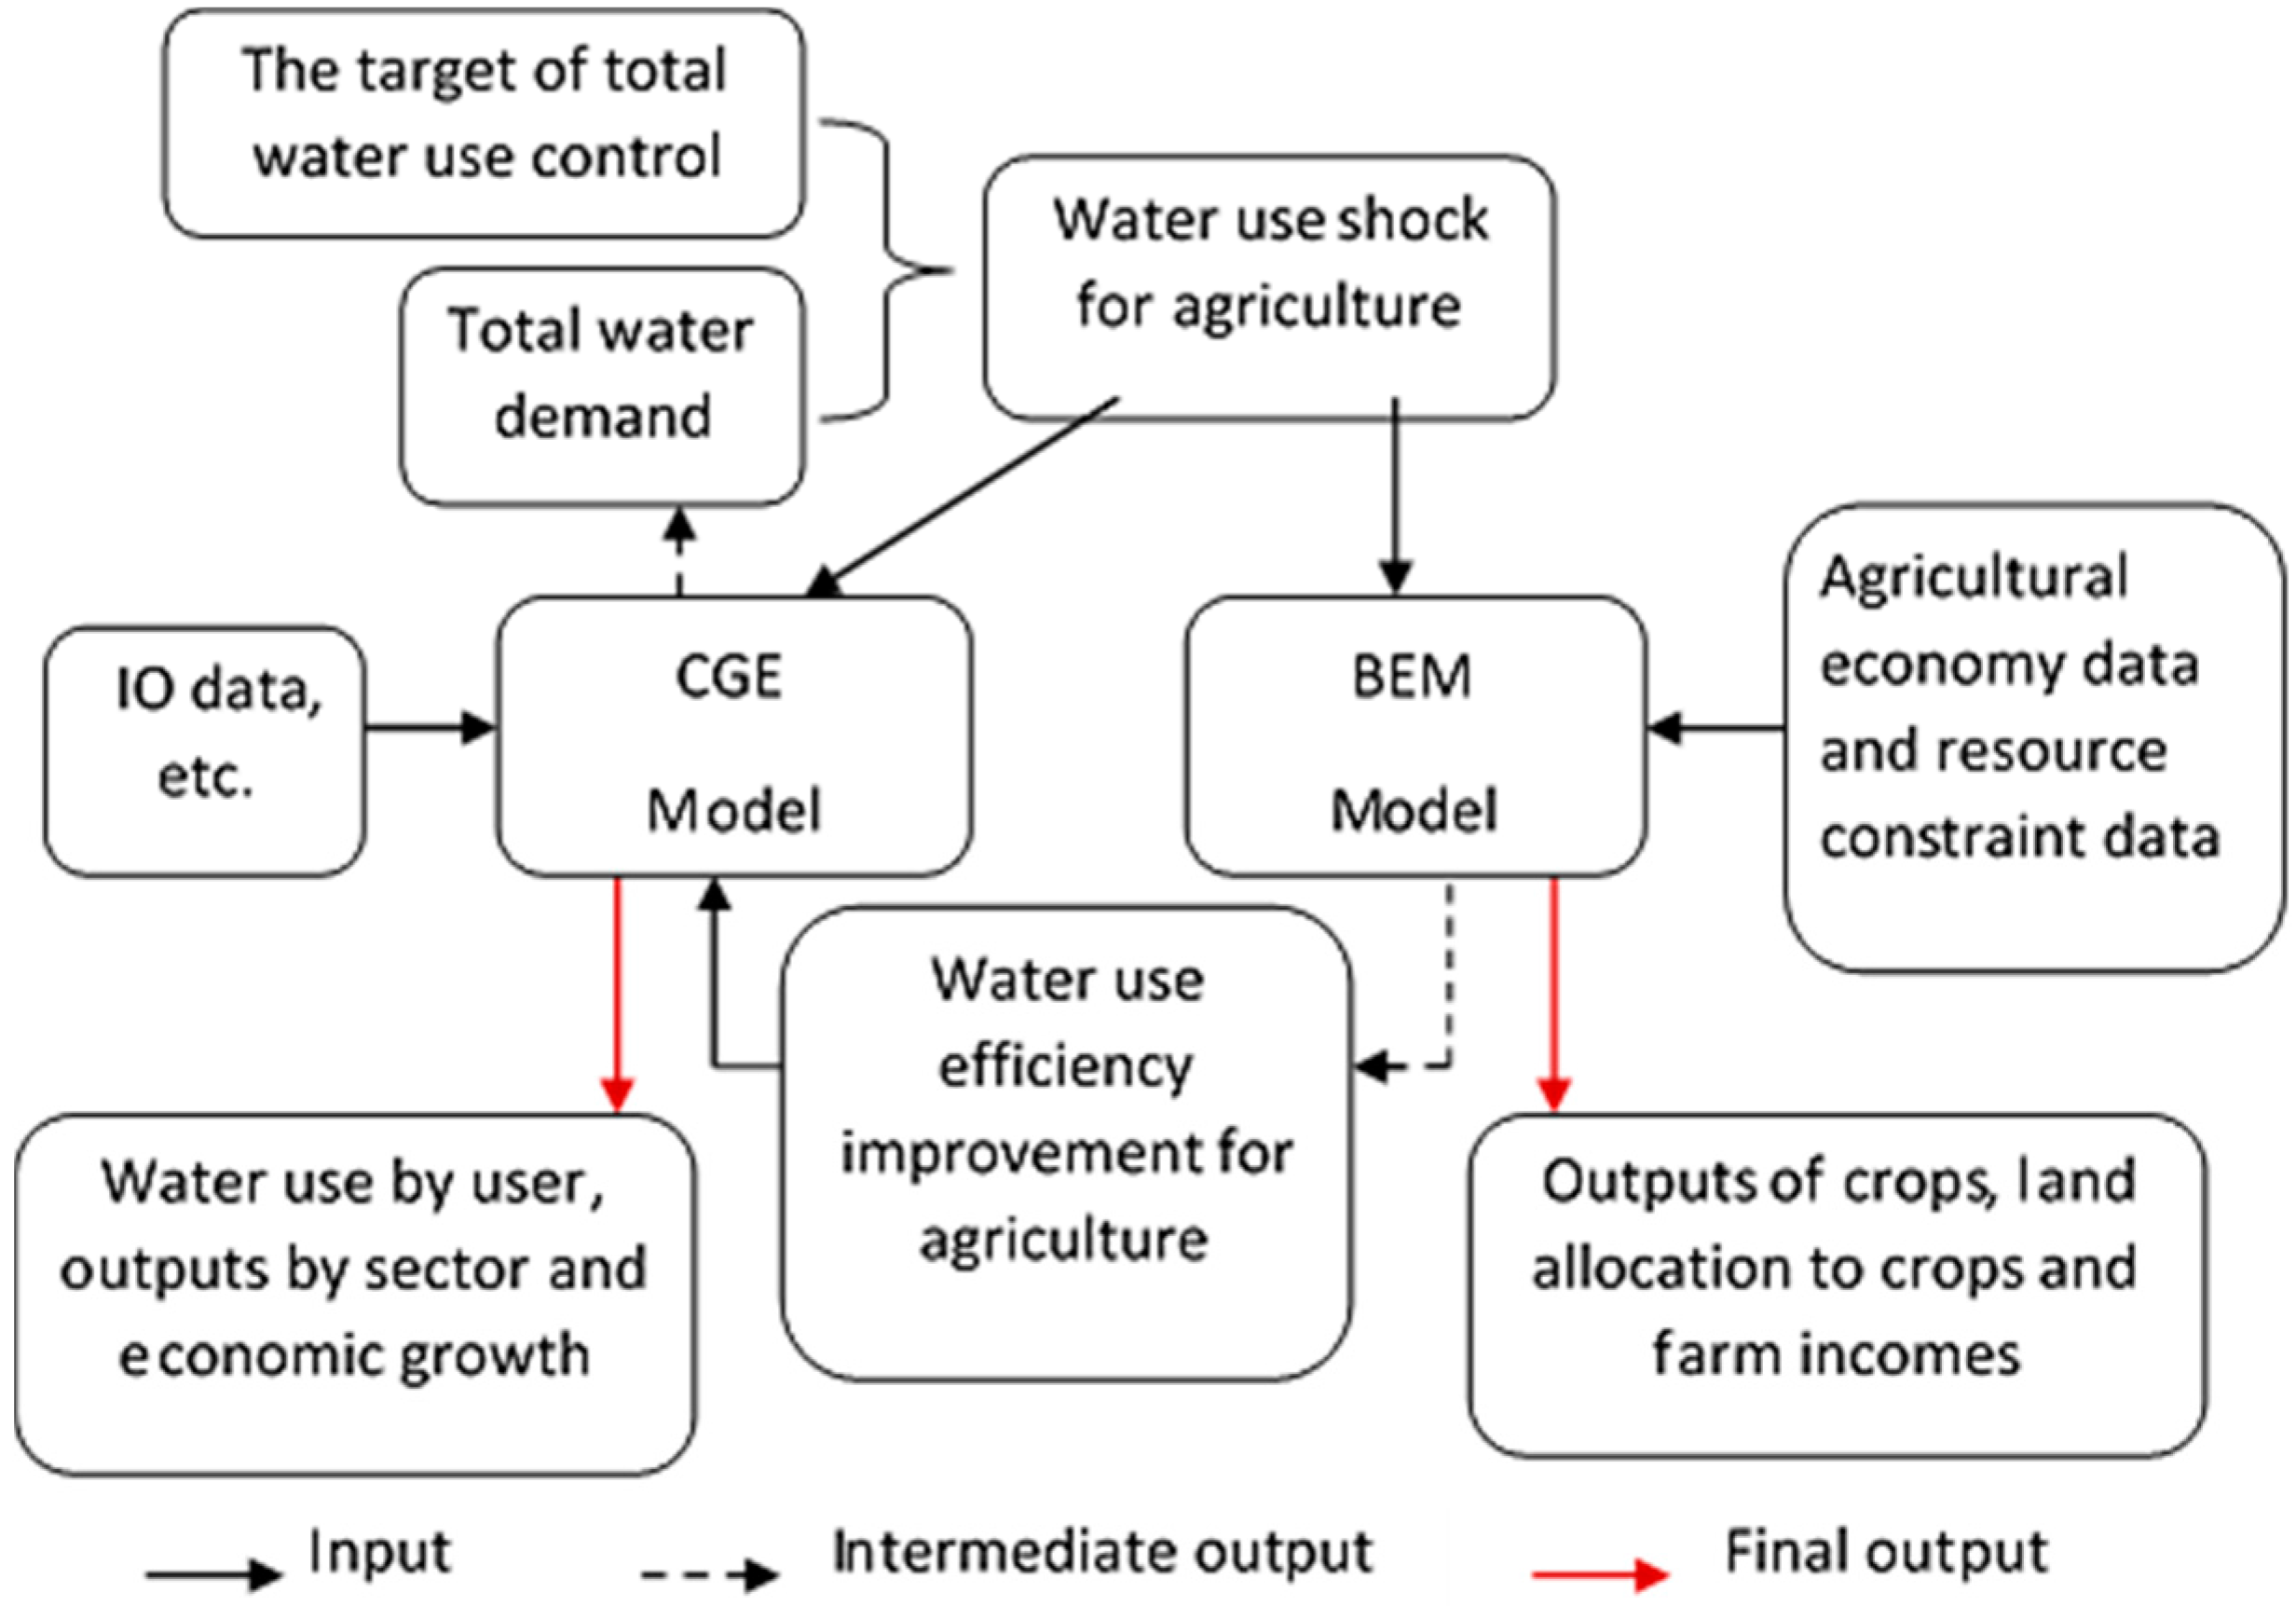
The CGE model and BEM model are loosely coupled (
Figure 3). The CGE model based on the IO data is solved yearly for baseline in which total labor growth rate, total primary factor productivity growth, water use efficiency improvement rates, water demand per capita and ecological water use are set exogenously following the current trends. As a result, outputs by sectors, water demand for sectors and water demand for households are obtained. Furthermore, the yearly total water demand can be calculated in the baseline. The amount which exceeds the target of total water use control for each year needs to be reduced and this amount will be used as the shock of water stress under the control policy. As mentioned in
Section 2.1, the 12th Five-year Plan of Zhangye anticipates an increase in water demands in industrial and domestic sectors with industrialization and urbanization. There is no restriction on industrial and domestic water uses. The agriculture sector which consumes most of the water with low irrigation efficiency in Zhangye is assumed to be the only sector for water use reduction under the total water use control. It means that the shock in agriculture water use for each year is of the same amount of the total reduction. In order to be linked with the static BEM model, the annual average shock under the total water control is taken into the BEM model for further simulation.
Figure 3.
The linkage between the computable general equilibrium (CGE) model and the bio-economic (BEM) model.
Figure 3.
The linkage between the computable general equilibrium (CGE) model and the bio-economic (BEM) model.
The BEM model uses the shock in agriculture water use, along with agricultural economy data and other resource constraint data, to calculate the outputs of crops, allocation of land to crops and farm incomes, which are different from what they are without the shock. The change in agriculture planting structure is expected to promote a change in water use efficiency. Therefore, a new improvement rate of water use efficiency can be deduced. Then, the originally assumed annual improvement rates of water use efficiency in agriculture used in the CGE model are replaced with the new values to perform another round of CGE stimulation.
Finally, the new improvement rate of water use efficiency and the water use shock in the agriculture sector from the BEM model for each year are applied to the CGE model, which is solved for the second time for the final equilibrium. This solution yields final water use by sectors, outputs by sectors, regional economic growth as a whole and so on. After that, the further feedback from CGE to the BEM is no longer considered.
3. Scenario Design
Two scenarios are designed for this study. One is the baseline scenario, standing for business as usual (BAU), which is a simulation of economic development from 2008 to 2020 without total water use control. The other one is the water use control scenario (WUC), which is a simulation scenario under total water use control.
In the BAU and WUC scenarios, some assumptions and parameters are set. It is assumed that the endogenous capital accumulation, exogenous total labor increase and technology improvements are set to drive economic growth and changes in the industrial and water use structure. The average annual growth rate of total labor is set at 0.7% based on the historical trend from the Bureau of Statistics of Zhangye. Technological improvements are assumed to be reflected by total factor productivity (TFP) growth and water use efficiency improvement rates. Sectors’ TFP growth rates are calibrated according to exogenous sectors’ added value in the CGE model. The settings of sectors’ added value used for calibration are shown in
Table 2. After calibration, TFP growth rates are set to be fixed and sectors’ added value changes are endogenous in the model. The water use efficiency is defined as water consumption per unit of output value at constant price. The water use efficiency improvements in different sectors are measured by the reduction of water consumption per unit of output and they are set as shown in
Table 3. As the water use efficiency improvements in agriculture are generated endogenously from the CGE-BEM model for the WUC scenario,
Table 3 only shows the water use efficiency improvement rates in the baseline scenario.
Table 2.
Average growth rates of sectors’ added value at constant prices (%).
Table 2.
Average growth rates of sectors’ added value at constant prices (%).
| Sector Types | Sectors | 2008–2010 | 2011–2020 |
|---|
| Primary | Agriculture | 10 | 6.5 |
| Animal husbandry | −0.8 | 3.5 |
| Other agriculture | 2.5 | 5.8 |
| Secondary | Industry | 16.8 | 18 |
| Construction | 8.7 | 9 |
| Tertiary | Transport, storage and post | 11.3 | 12.3 |
| Commercial services | 9.7 | 10.6 |
| Water conservation | 13.5 | 14.8 |
| Other services | 13.3 | 14.3 |
Table 3.
Average annual improvement rates of water use efficiency (%).
Table 3.
Average annual improvement rates of water use efficiency (%).
| Sector Types | Sectors | 2008–2010 | 2011–2015 | 2016–2020 |
|---|
| Primary | Agriculture | 8.9 | 6.8 | 6.5 |
| Animal husbandry | −3.2 | 3.8 | 3.5 |
| Other agriculture | 0.9 | 6 | 5.8 |
| Secondary | Industry | 11.7 | 3.1a | 2.8 a |
| Construction | 7 | 5 | 5 |
| Tertiary | 10.5 | 8 | 8 |
In addition, the changes in water demand per capita and ecological water use growth over time also need to be set in these two scenarios. With the development of economy in the future, population, urbanization rate and domestic water demand of Zhangye will increase.
Table 4 shows the projected changes. In addition, to prevent a further degradation of ecological environment, the water allocation for the ecological use needs to be increased gradually. According to the Gansu Water Resource Bulletin and the documents of the Zhangye Water Authority, the average annual growth rate of ecological water use is set to be 1.5%.
Table 4.
Population, urbanization rate and domestic water demand of Zhangye.
Table 4.
Population, urbanization rate and domestic water demand of Zhangye.
| Years | Urbanization Rate (%) | Urban Population (10 Thousand People) | Rural Population (10 Thousand People) | Water Demand Per Capita in Urban Area (L/Day/Person) | Water Demand Per Capita in Rural Area (L/Day/Person) |
|---|
| 2010 | 36 | 42 | 78 | 120 | 50 |
| 2015 | 41 | 51 | 73 | 130 | 60 |
| 2020 | 45 | 57 | 70 | 140 | 70 |
There are some different settings between the BAU and WUC scenarios. In the BAU scenario, there is no total water use control for individual sectors. In the WUC scenario, the annual total water use of Zhangye is limited to 2250 million m3. It is assumed that this control target is implemented from 2015, allowing a transition period during 2010–2015 in which the total water use amount could be gradually decreased. The amount of water use reduction in agriculture is determined by the difference between the total water use simulated under the BAU scenario (CGE) and the target of total water use control. In the WUC scenario, the agriculture planting structure change induced by total water use control will improve water use efficiency in the sector. Therefore, the water use efficiency improvement rate for agriculture in this scenario is set at 1.043 times that in the BAU scenario, which can be obtained after the BEM simulation.
4. Results
4.1. Water Reallocation under the Two Scenarios
With the integrated CGE-BEM model, water reallocation among sectors and other users are obtained for both scenarios.
The results show that the total water use in 2015 and 2020 under the BAU scenario are 2366 and 2404 million m
3, respectively; both values are beyond the control target of 2250 million m
3 (
Table 5). Under the WUC scenario, the water use for crop production (Agriculture) in 2015 and 2020 is 115.75 and 153 million m
3, respectively, less than that under the BAU scenario. The water uses for all other sectors, including animal husbandry and other agriculture sectors, differ relatively between WUC and BAU scenario. Water use structure is changed under the WUC scenario: the share of water use for agriculture decrease a little and the share of water use for other sectors increases. By 2015, the shares of water uses for primary, secondary, tertiary, households and environment are 85.34%, 3.95%, 0.27%, 1.78%, and 8.66%, respectively. By 2020, the structure changes to 81.32%, 6.95%, 0.31%, 2.09%, and 9.33%, respectively.
Table 5.
Water consumption by users under the BAU and WUC scenarios (million m3).
Table 5.
Water consumption by users under the BAU and WUC scenarios (million m3).
| Users | 2010 | BAU | WUC | WUC-BAU |
|---|
| 2015 | 2020 | 2015 | 2020 | 2015 | 2020 |
|---|
| Primary | 2115.00 | 2036.00 | 1983.00 | 1920.60 | 1830.26 | −115.40 | −152.74 |
| Agriculture | 2046.00 | 1970.00 | 1917.00 | 1854.25 | 1764.00 | −115.75 | −153.00 |
| Animal husbandry | 19.00 | 18.00 | 18.00 | 18.10 | 18.02 | 0.10 | 0.02 |
| Other agriculture | 50.00 | 48.00 | 48.00 | 48.24 | 48.24 | 0.24 | 0.24 |
| Secondary | 52.00 | 89.00 | 157.00 | 88.98 | 156.41 | −0.02 | −0.59 |
| Industry | 46.00 | 82.00 | 148.00 | 82.10 | 147.68 | 0.10 | −0.32 |
| Construction | 6.00 | 7.00 | 9.00 | 6.88 | 8.73 | −0.12 | −0.27 |
| Tertiary | 5.00 | 6.00 | 7.00 | 6.01 | 6.98 | 0.01 | −0.02 |
| Residents | 37.00 | 40.00 | 47.00 | 40.00 | 47.00 | 0.00 | 0.00 |
| Ecology | 181.00 | 195.00 | 210.00 | 195.00 | 210.00 | 0.00 | 0.00 |
| Total | 2389.00 | 2366.00 | 2404.00 | 2250.59 | 2250.65 | −115.41 | −153.35 |
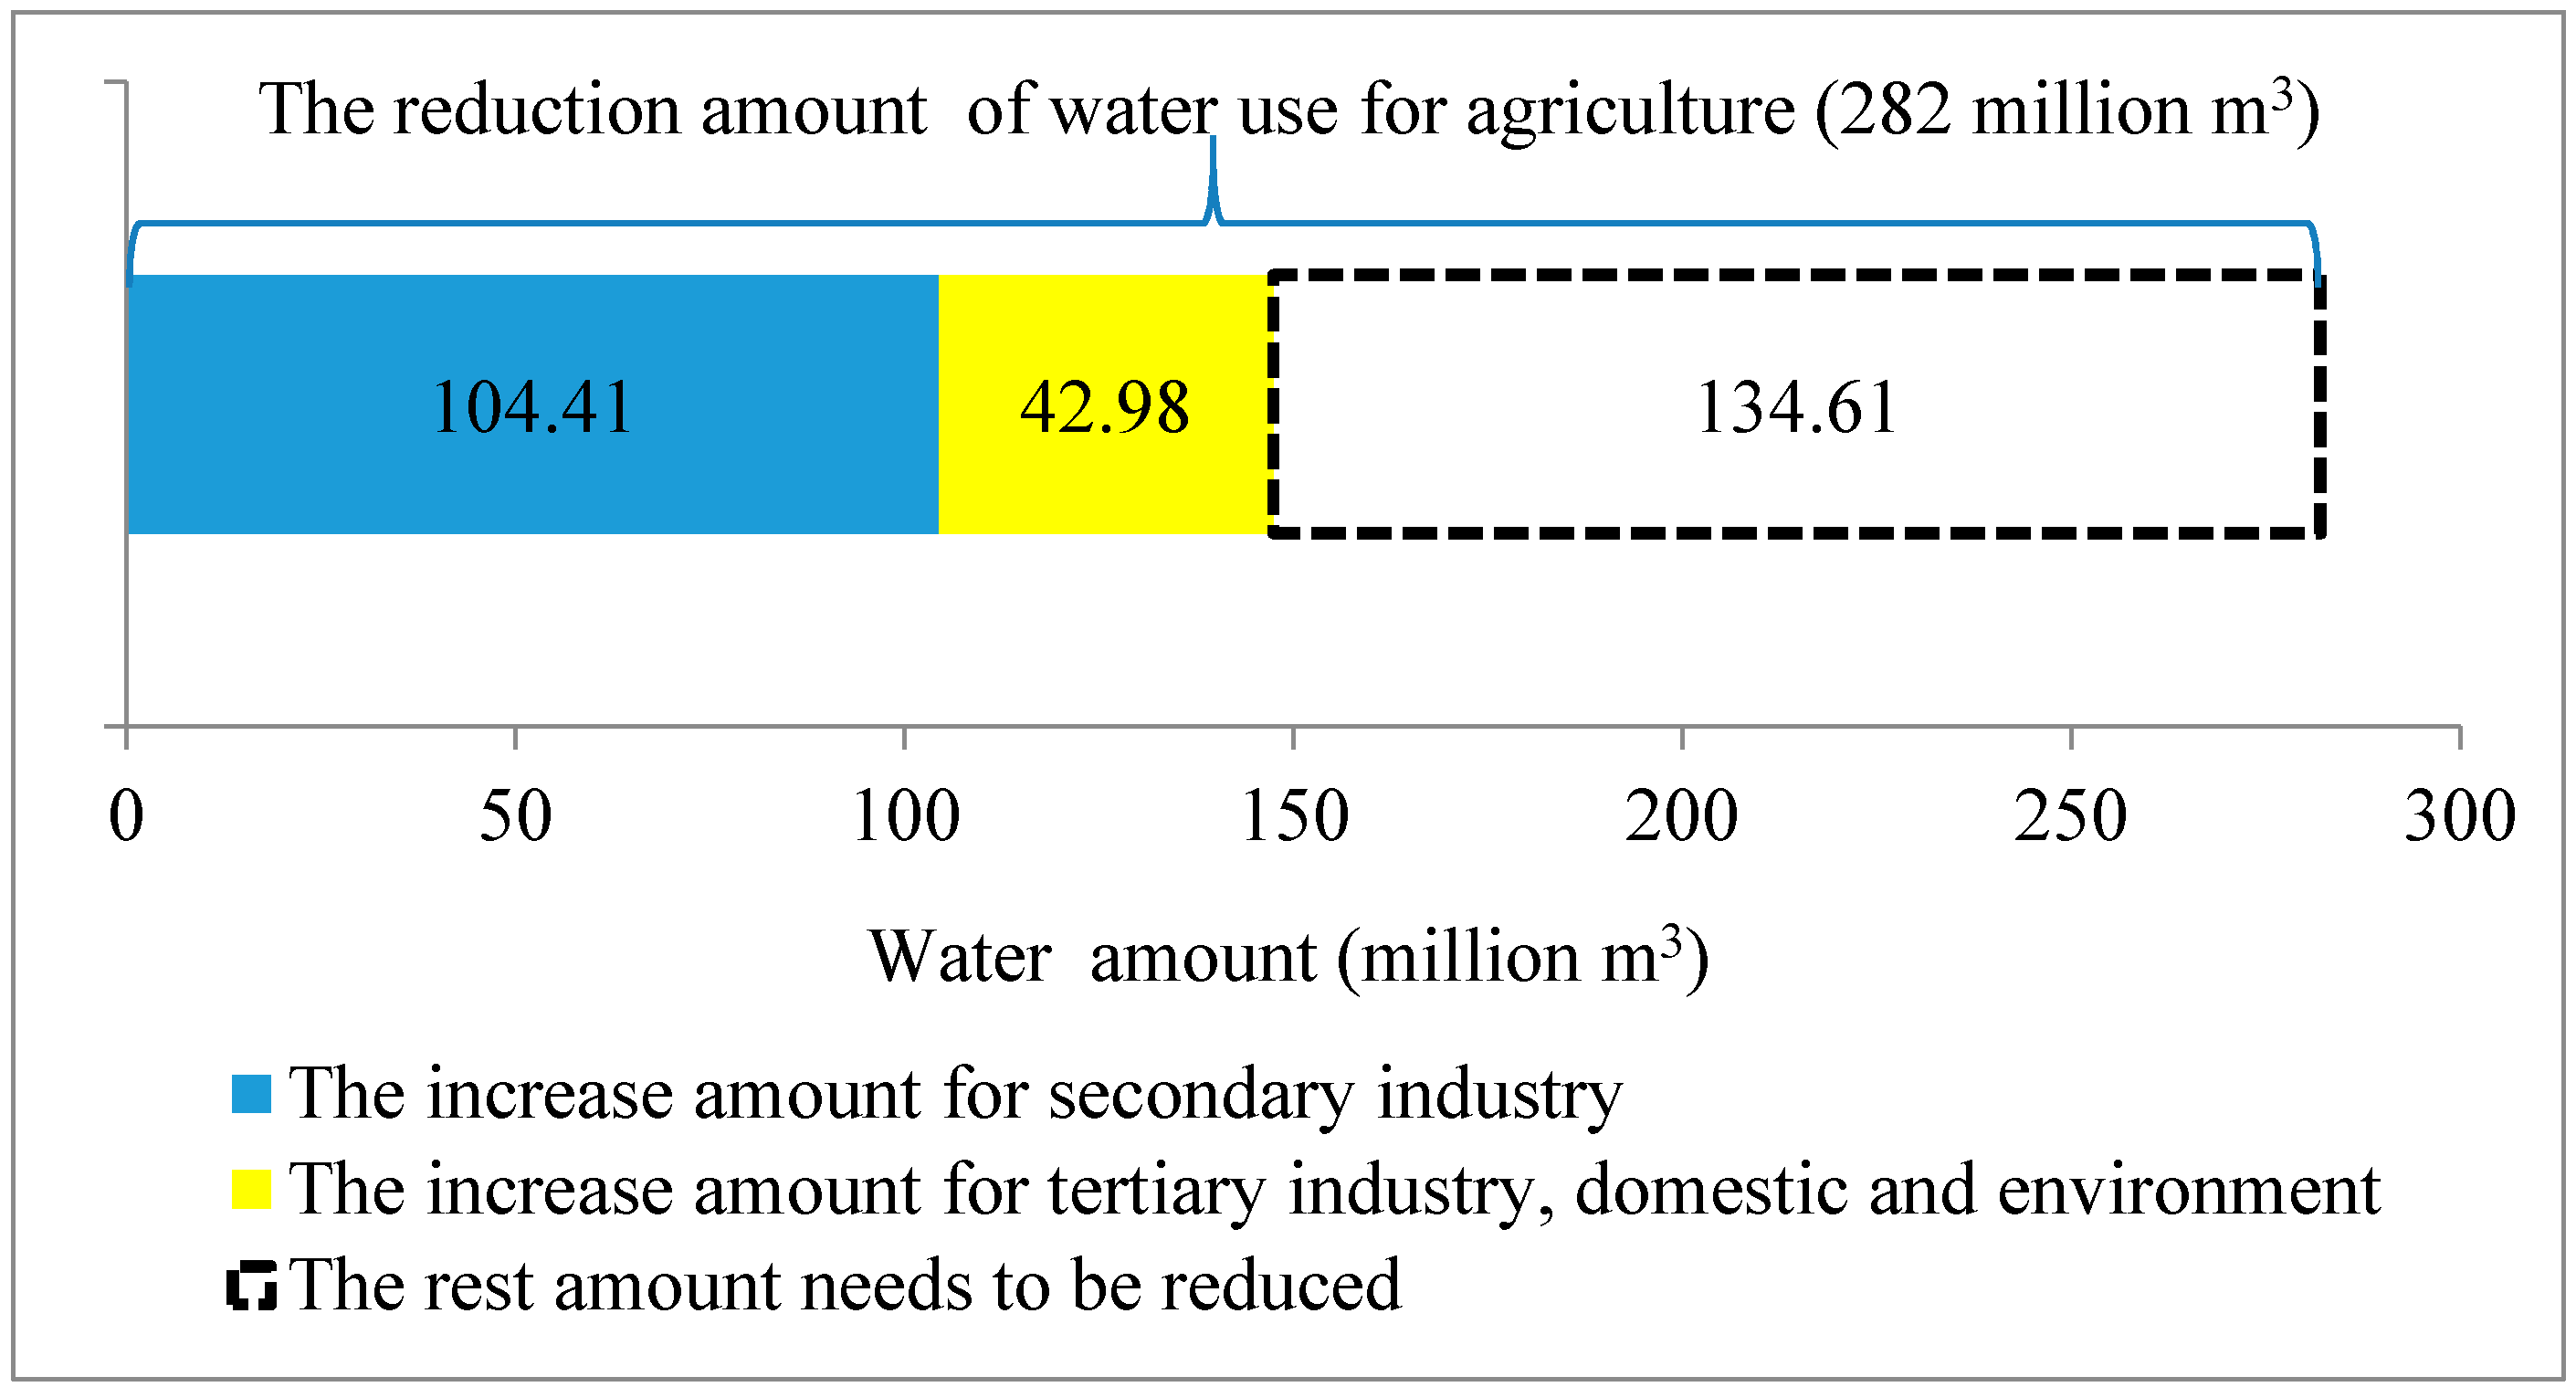
The implementation of total water use control facilitates a speed-up of the transition of water from agriculture to other users. Compared with the year 2010, the water use for agriculture needs to be reduced by 282 million m
3, or 13.78%, in 2020. Of this total amount of reduction in agriculture, 104.41 million m
3 goes to the secondary industry, 42.98 million m
3 to tertiary, domestic and environment, and the remaining 134.61 million m
3 is the amount which must be reduced to meet the target of total water use control of 2250 million m
3 (
Figure 4). This transition greatly improves the total output values of water use in the region, as the secondary and tertiary industries can generally produce more output value with the same amount of water.
Figure 4.
Water use transition from 2010 to 2020 under the total water use control scenario.
Figure 4.
Water use transition from 2010 to 2020 under the total water use control scenario.
4.2. Impacts on Economic Development
Total water use control can induce changes in the agriculture planting structure and raise the water use efficiency in the sector, which further influences the production of agriculture and other sectors. By linking the CGE and BEM models with the water use efficiency change, the impacts on economic development caused by total water use control can be evaluated.
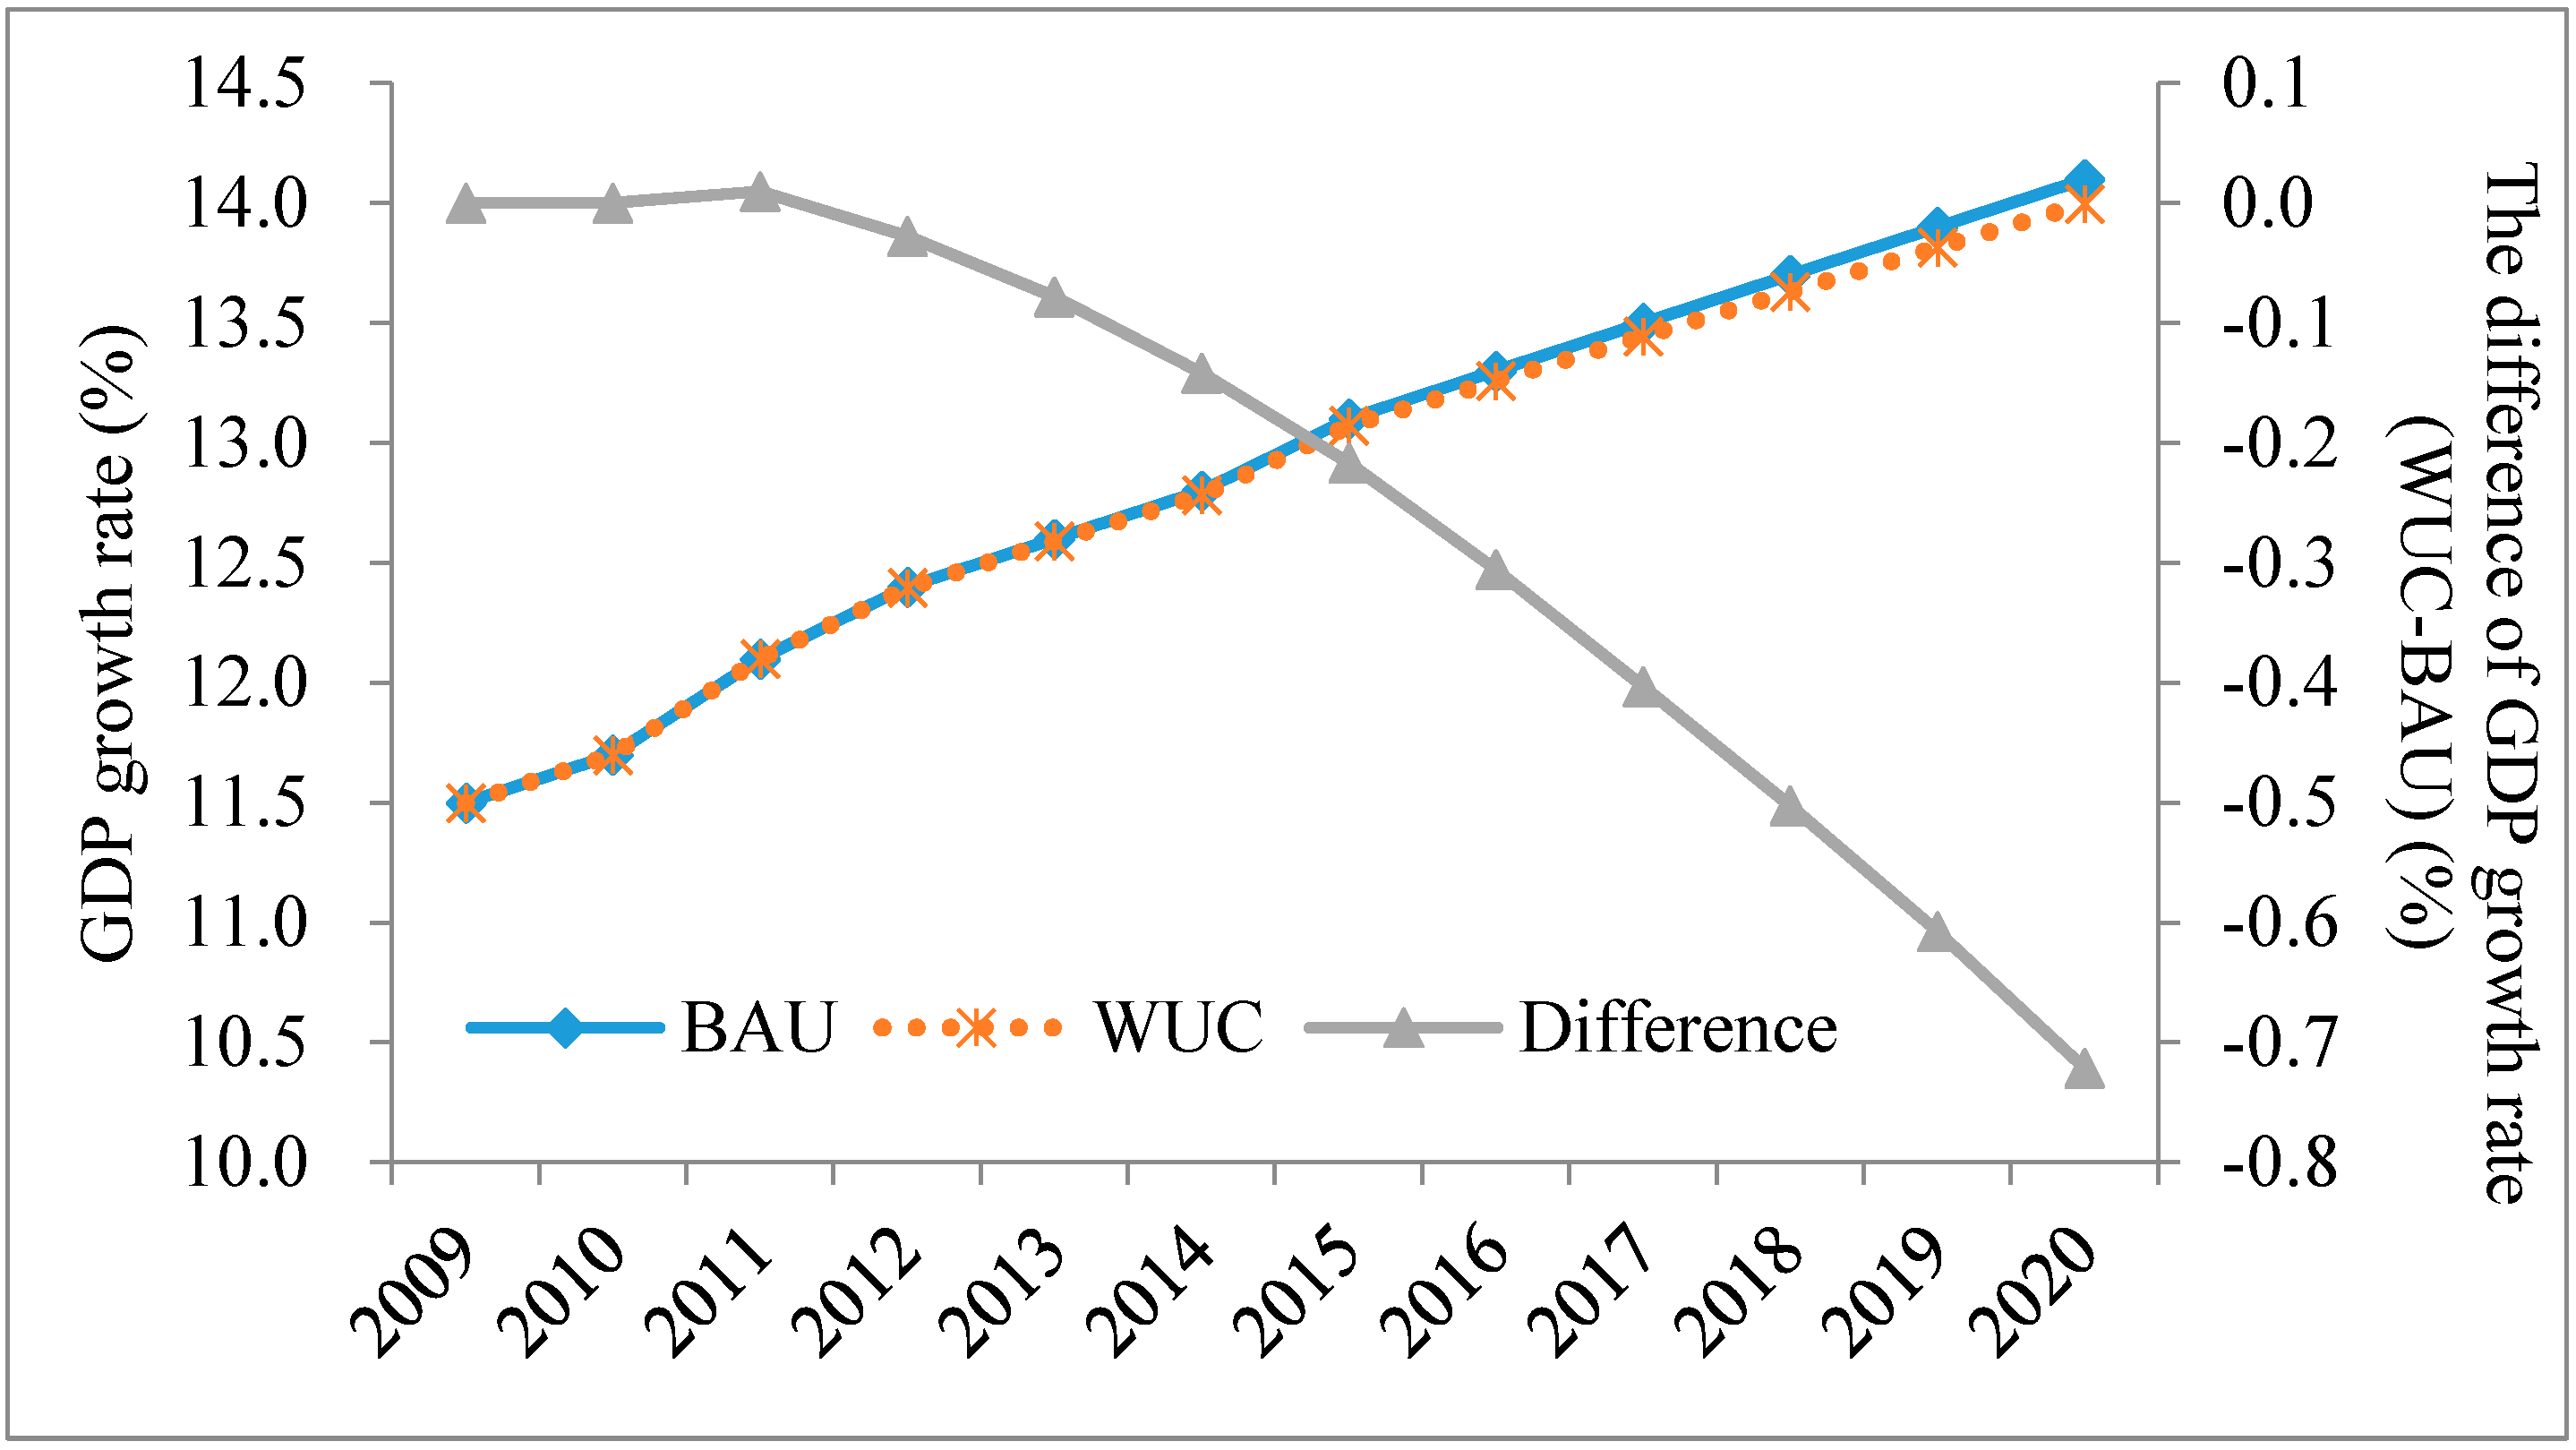
The economic development prospects of Zhangye under the two scenarios are presented in
Figure 5. In the BAU scenario, during 2011–2020, the economic growth of Zhangye could get a double-digit rate every year and in 2020 it reaches 14.1%. In the WUC scenario, the economic growth rate still accelerates but not as quickly as that in the BAU scenario. Furthermore, the gap of the GDP growth rate between the BAU scenario and WUC scenario widens slightly over the years because the reduction of water use for agriculture increases over times under the WUC scenario compared with the BAU scenario as shown in
Figure 5. For example, in 2015, the growth rate of GDP under the WUC scenario is 0.22% lower than that under the BAU scenario, compared to 0.72% in 2020. Nevertheless, the average annual growth rate of GDP of Zhangye is still high during 2011–2020. As a whole, the impact of total water use control on economic growth rate is limited, which adds to the feasibility of implementing total water use control.
Figure 5.
Growth rates of GDP in Zhangye under the BAU and WUC scenarios.
Figure 5.
Growth rates of GDP in Zhangye under the BAU and WUC scenarios.
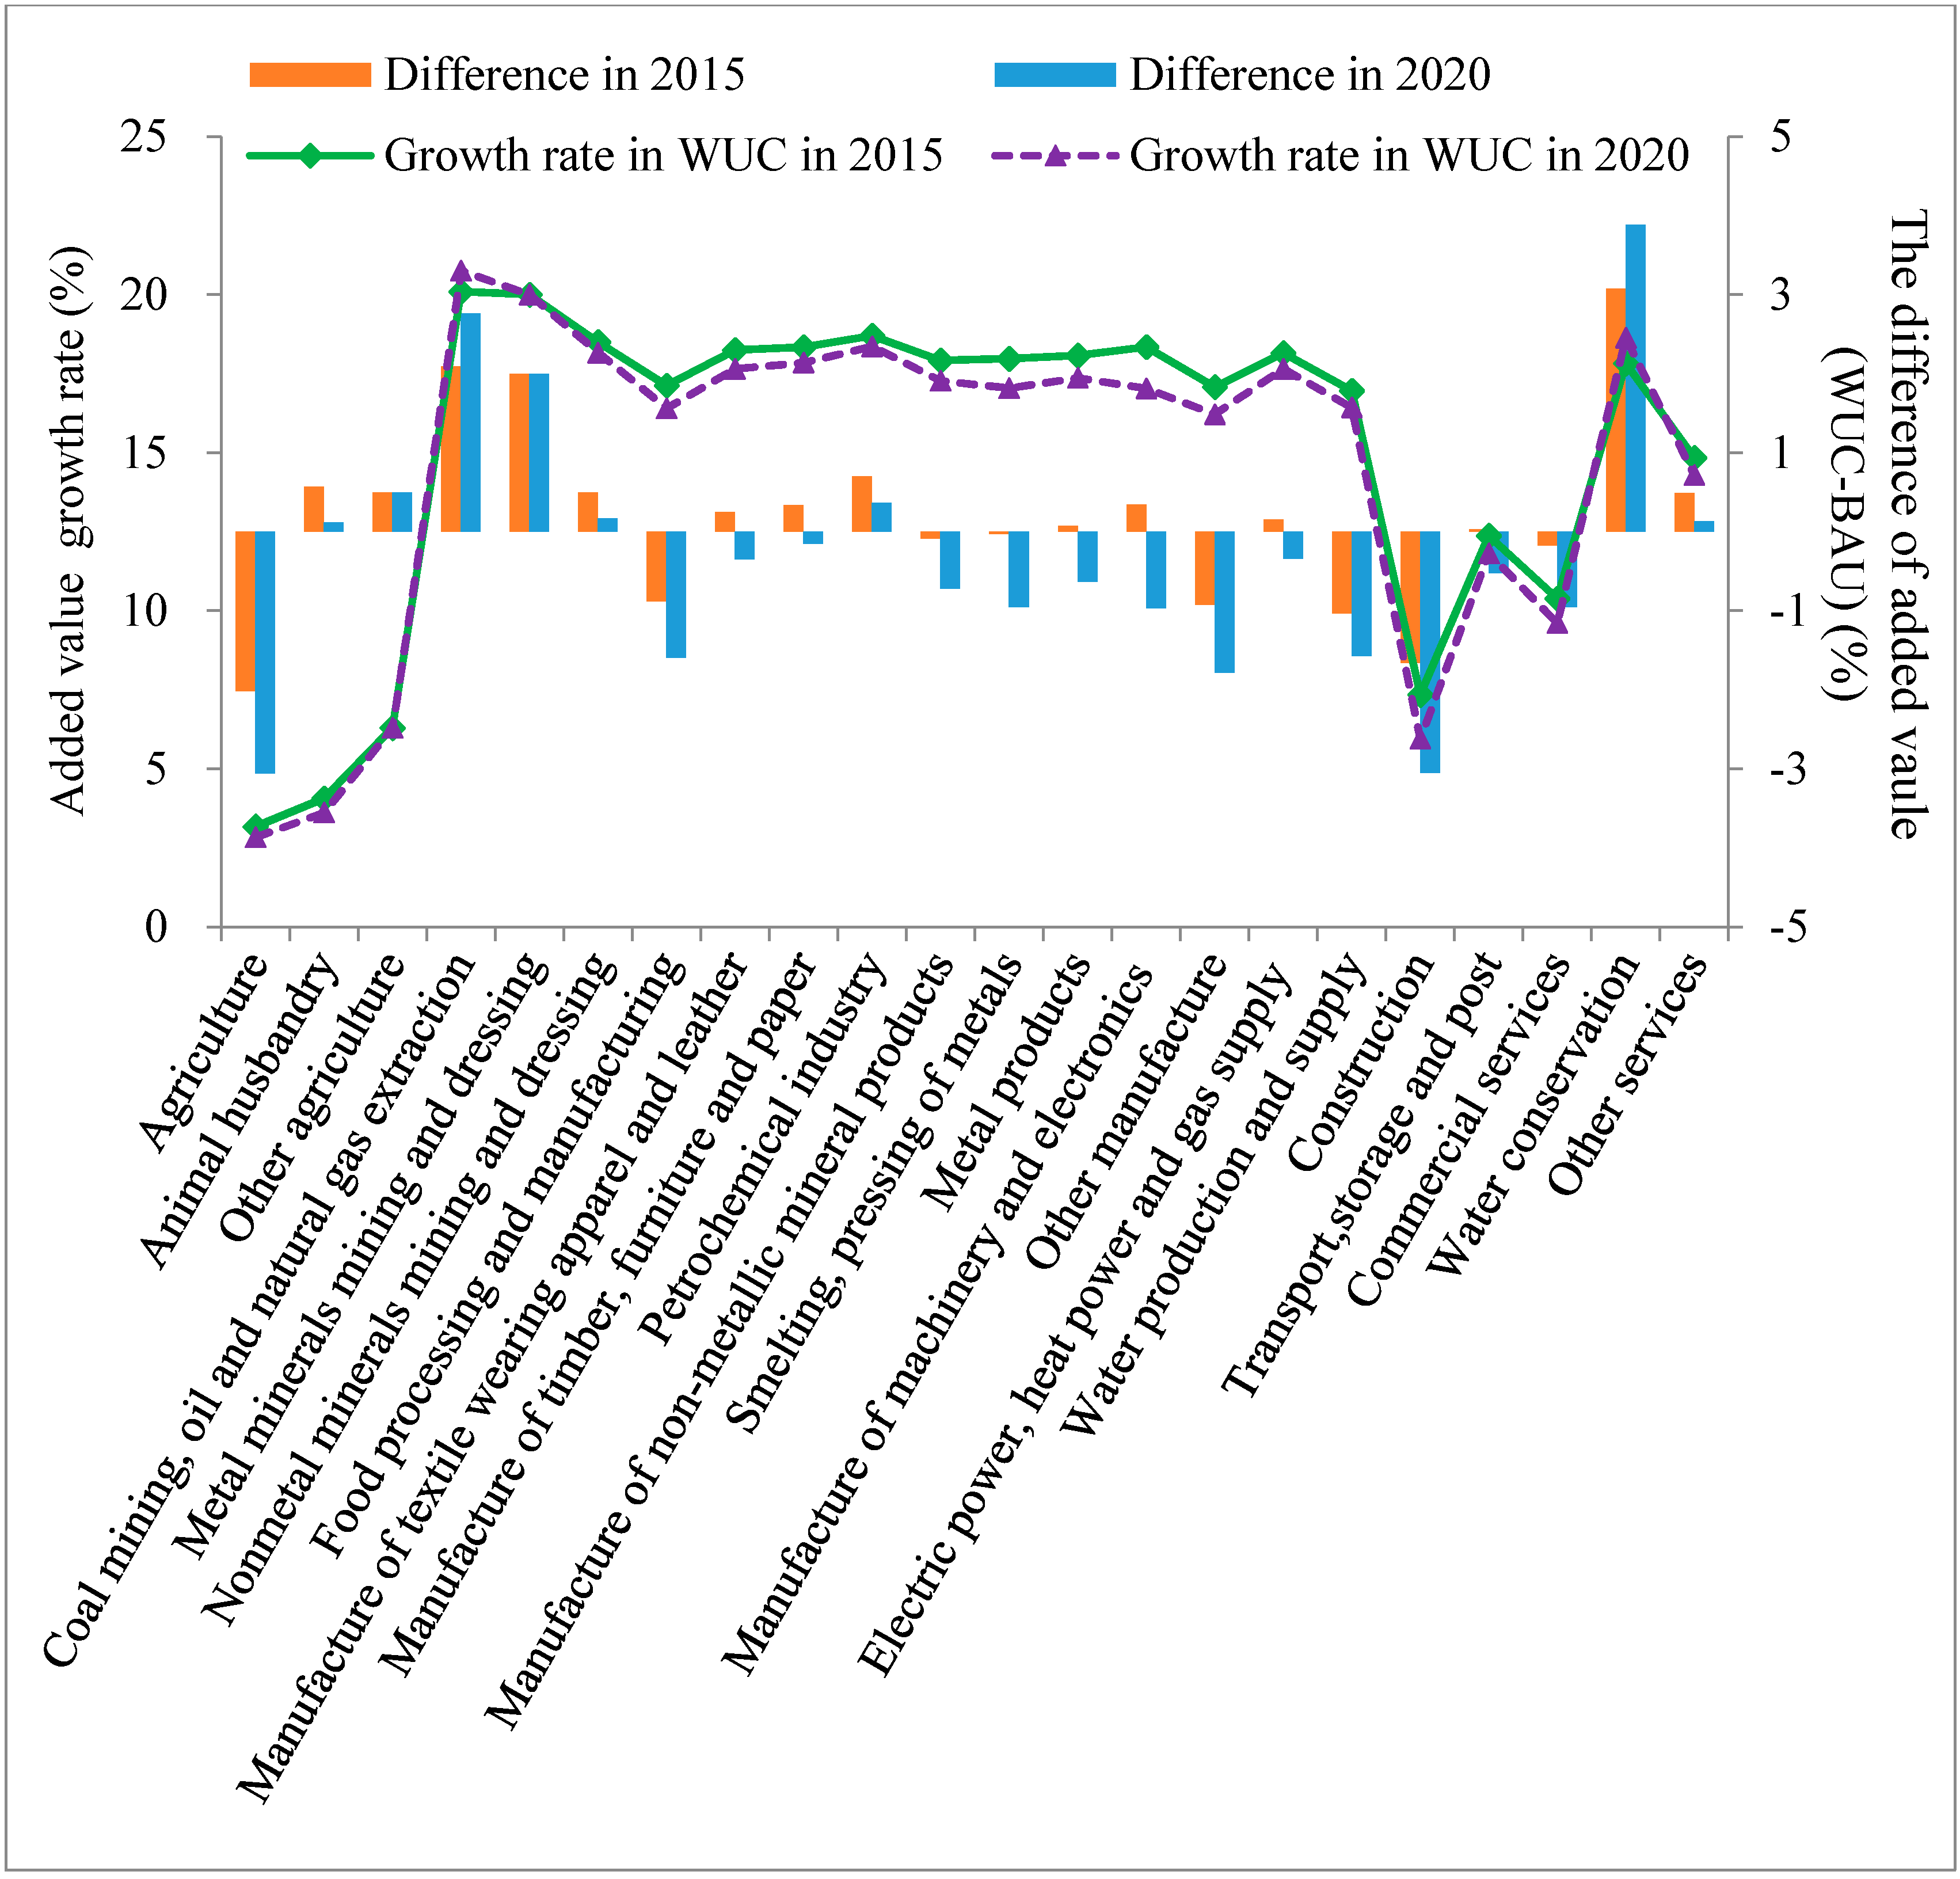
At the sectoral level, the added values in many sectors decline under the total water use control (
Figure 6). The agriculture sector is affected the most in the WUC scenario. In 2020, the growth rate of added value in the agriculture sector is only 3.17%, which is 3.06% lower than the BAU scenario. The sector having the closest relationship with agriculture is food processing and manufacturing. It consumes as many as 40% of agriculture products in Zhangye, and consequently has a decline of 1.59% in added value growth compared to the BAU scenario. In addition, the income and saving for agriculture are reduced with water use control. This can have impacts on some other sectors such as construction, manufacture of non-metallic mineral products, smelting, pressing of metals, manufacture of machinery and electronics, other manufacturing, water production and supply and commercial services (
Figure 6), through, e.g., reduced consumption and drop in investment. As products of the construction sector serve as important investment goods for many other industries, the added value of the sector is heavily reduced compare to the BAU scenario. There are also some “better-off” sectors, including animal husbandry, other agriculture, coal mining, oil and natural gas extraction, metals and nonmetals mining, petrochemical industry, water conservation and other services. The reason for the increase in their added value may be related to the drop of production of agriculture and some other sectors, which released capital and labor resources for these sectors.
Figure 6.
Growth rates of added value by sectors of Zhangye under the WUC scenario and comparisons with the BAU scenario.
Figure 6.
Growth rates of added value by sectors of Zhangye under the WUC scenario and comparisons with the BAU scenario.
4.3. Impact on Agriculture and Farmers’ Incomes
The impacts of total water use control policy on agriculture and farmers’ incomes are simulated from the BEM model. The simulation results show that the water use reduction of agriculture also has a great influence on agriculture planting patterns and a negative impact on farmers’ income.
The total cultivated land in the BAU scenario is 126.97 thousand hectares, whereas it is reduced to 119.16 thousand hectares with a net loss of 7.81 thousand hectares, or 6.2%, in the WUC scenario (
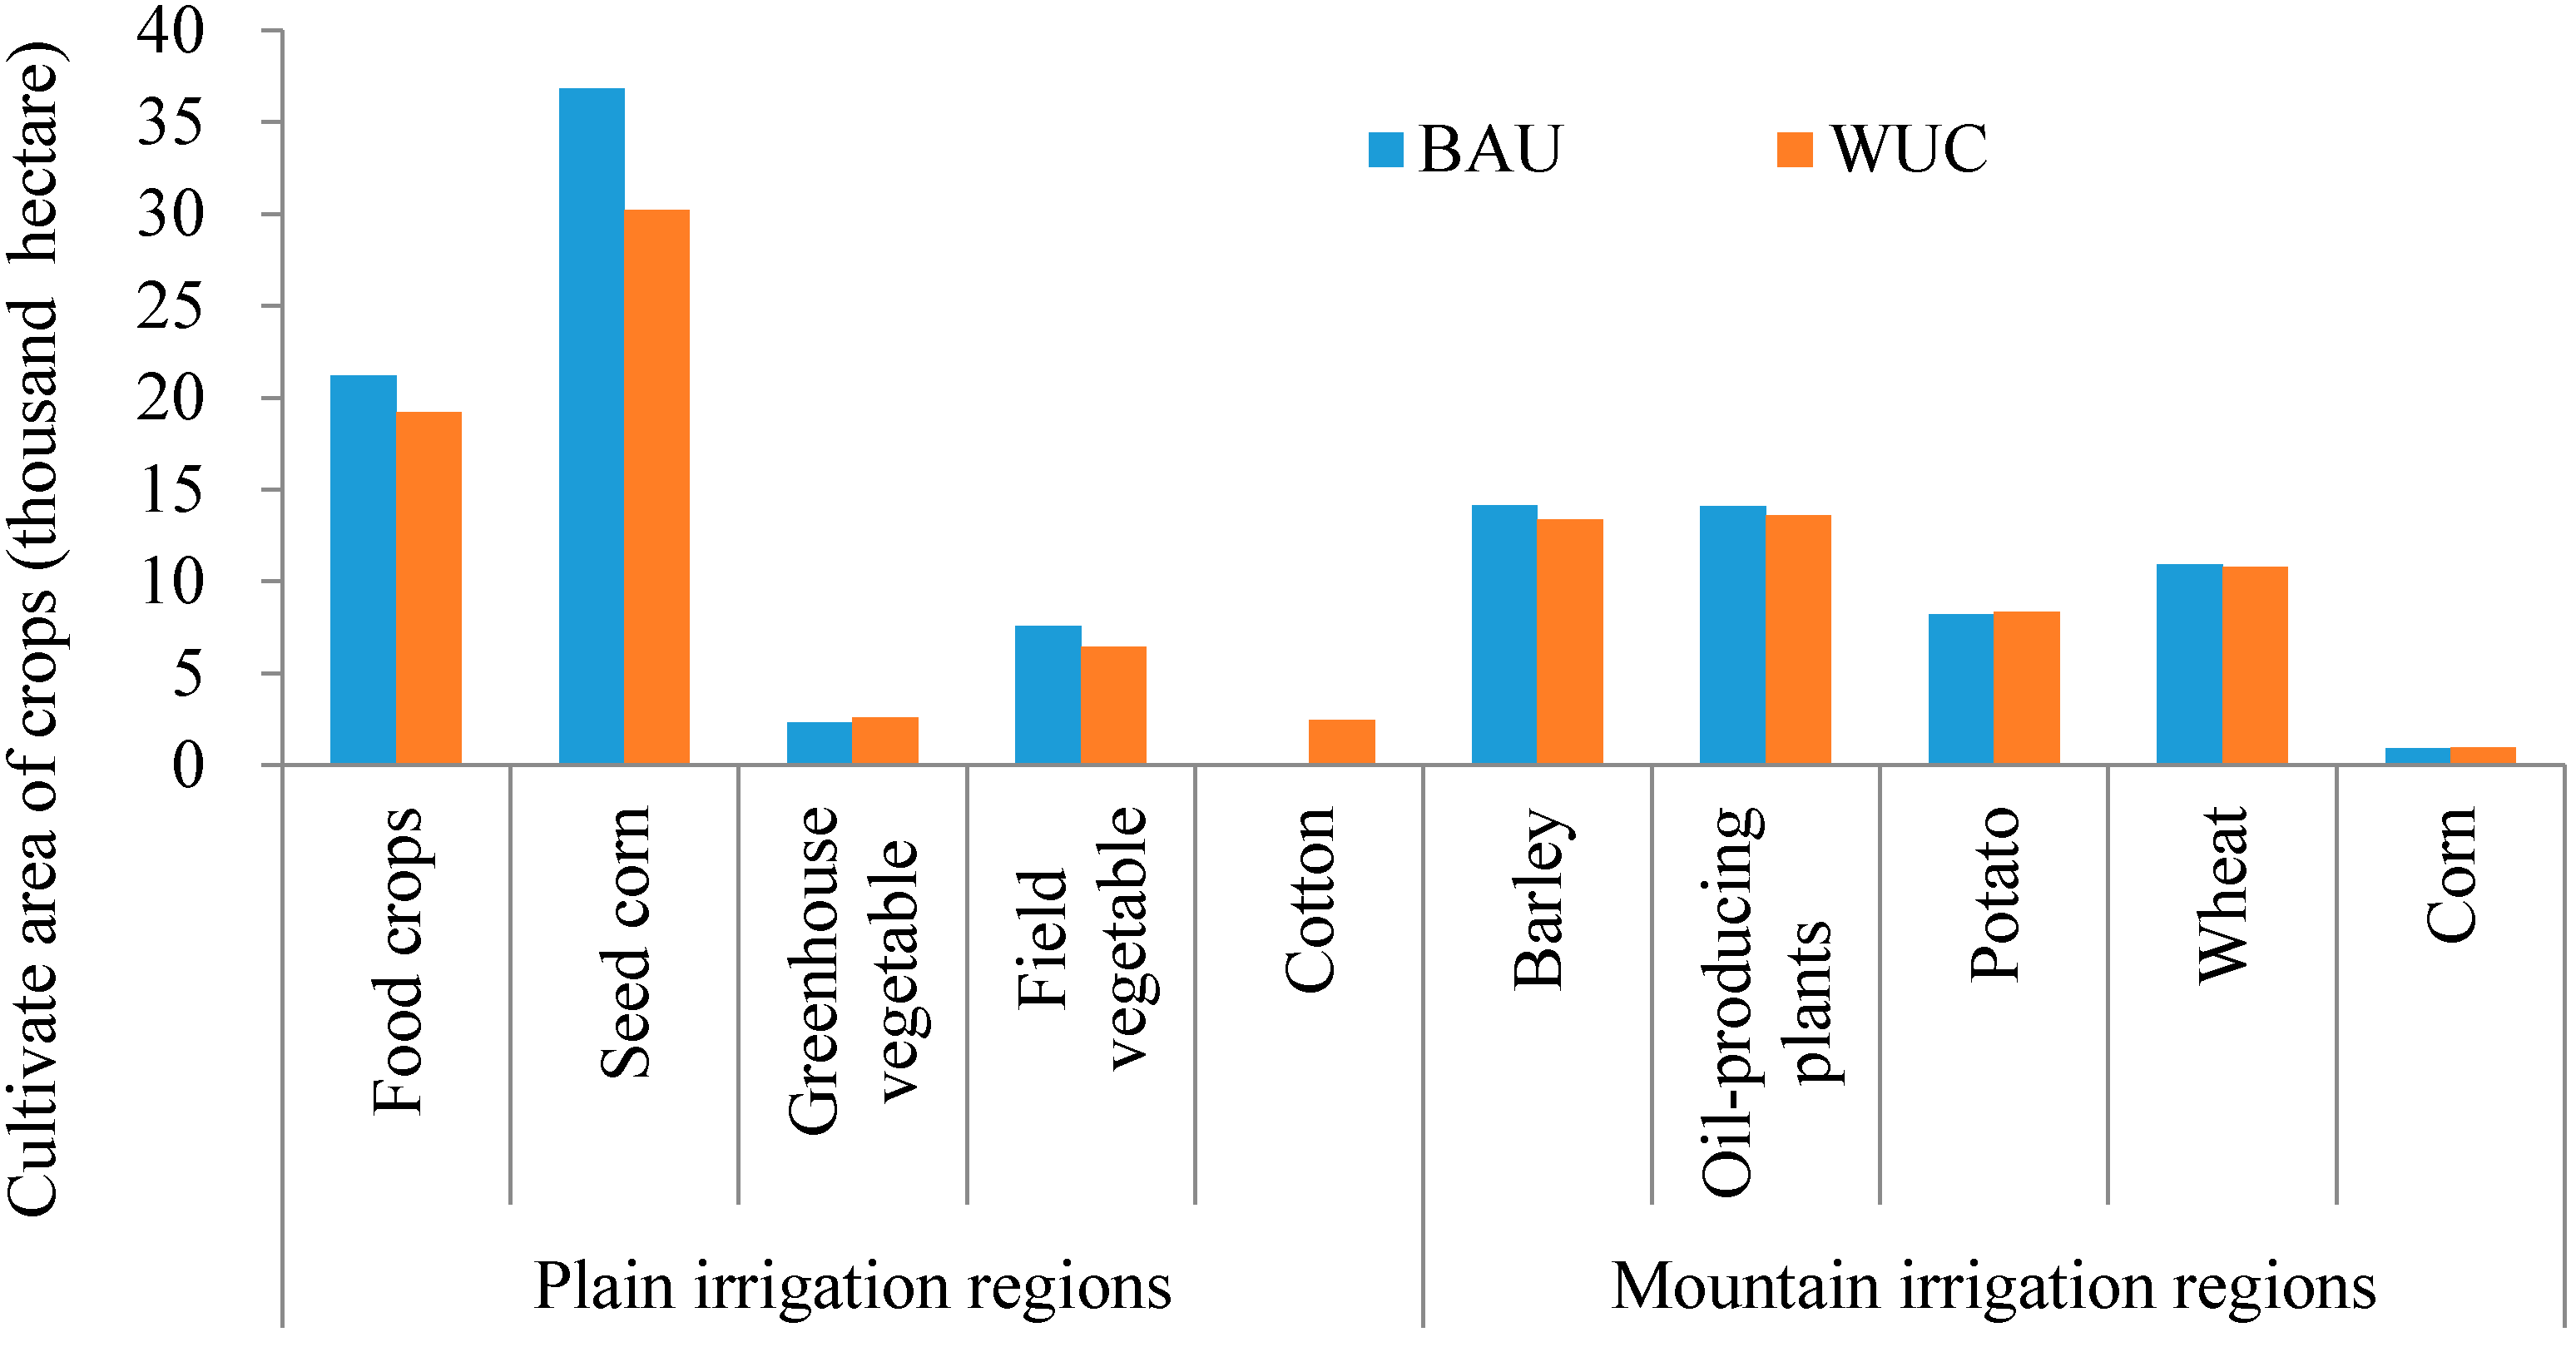
Table 6). This result is not surprising as there is not enough water to support cultivated land. Responding to the reduced water, farmers changed their agriculture planting patterns substantially in order to more efficiently use the available water (
Figure 7). In the plain irrigation regions, the cultivated area of food crops, seed-corn, and field vegetable decreased by 9%, 18%, and 15%, respectively. In contrast, the cultivated area of greenhouse vegetable increased by 11%, and the cultivated area of cotton increased from zero to 2.48 thousand hectares. In the mountain irrigation regions, the cultivated area of barley, oil-producing plants, and wheat decreased by 5%, 3% and 1%, respectively, while potato and corn increased by 2% and 7%, respectively. On the whole, the crop structure has been adjusted by using water-efficient crops to replace water-intensive crops.
Figure 7.
Agriculture planting patterns in the BAU and WUC scenarios.
Figure 7.
Agriculture planting patterns in the BAU and WUC scenarios.
Under the WUC scenario, the water supply cannot meet the water demand in all irrigation zones of Zhangye. This will lead to a decrease in farmers’ income, the average of which is from 3165 Yuan/capita to 3056 Yuan/capita, or 3.14% decrease. Loss of per capita income in the plain irrigation regions is even bigger than that in the mountain irrigation regions (
Table 6). As the net profit of crops in the plain irrigation regions is higher than that in the mountain irrigation regions, reducing the same amount of irrigation water in the middle stream regions will inevitably lead to a greater loss in crop revenue than in the mountain irrigation regions.
Table 6.
Per capita income and cultivated land under the BAU and WUC scenarios.
Table 6.
Per capita income and cultivated land under the BAU and WUC scenarios.
| | Regions | BAU | WUC | WUC-BAU |
|---|
| Per capita income (Yuan/person) | Plain irrigation regions | 3562 | 3432 | −129 |
| Mountain irrigation regions | 2426 | 2371 | −55 |
| Average | 3165 | 3056 | −108 |
| Cultivated land (hectare) | Plain irrigation regions | 75,711 | 69,497 | −6214 |
| Mountain irrigation regions | 51,263 | 49,663 | −1600 |
| Total | 126,974 | 119,160 | −7814 |
4.4. Sensitivity Analysis
In order to test the sensitivity of the simulation results to some key parameters/assumptions, they are intentionally altered and simulation results are compared. First, since water use efficiency is expected to have great influence on total water use and economic development, annual improvement rate of the water use efficiency is increased and decreased by 10% for sensitivity analysis. Not surprisingly, the simulation results confirm that the water use efficiency improvement rate does have substantial effects on the loss rates of GDP, the added value of sectors and farmers’ incomes. Second, another possible reallocation plan for water use reduction is simulated. In the WUC scenario, all water reduction is imposed on agriculture. Now, of all water that must be saved, 95% is allocated to agriculture while the remaining 5% is imposed on other industries. The simulation results show that this plan will cause noticeable reduction of added value of other industries. It will bring net loss to the whole economy. In other words, the simulation result is relatively sensitive to this reallocation plan. As this altered plan can have great negative influence on the economy, it is not likely to be chosen in reality. Finally, what if the 10% increase in domestic and ecological water availability can be attributed to a further reduction of agriculture water use? In this case, it was found that there will be a very small difference in the loss of GDP, the added value of agriculture and other sectors and farmers’ incomes. Therefore, the simulation result is not sensitive to this assumption.
5. Discussions and Conclusions
This paper develops an integrated CGE-BEM model which combines the strengths of top-down and bottom-up models to study the impacts of implementing a total water use control policy on water reallocation, economic development and farmers’ incomes in Zhangye city of northwestern China towards 2020.
According to the simulation results of the integrated CGE-BEM model, under the total water use control scenario, the water use structure is changed and water use efficiency is improved in Zhangye. Water resource allocation is more efficient with respect to the net increase in the added value of total products for the given amount of the water. By 2020, the water use for primary, secondary and tertiary industries accounts for 81.32%, 6.95% and 0.31%, respectively, while domestic and environmental water use accounts for 2.09% and 9.33%, respectively. The results of this study provide a pathway for Zhangye to reach the goal of total water use control.
Total water use control has little impact on the economic growth rate of the whole region and development prospects in Zhangye for it could maintain higher growth rates of GDP during 2011–2020. However, there are more negative impacts on agriculture, food processing and some other sectors. Within the agricultural sector, the planting patterns will change immensely as farmers adjust their crop types. Generally, water-intensive crops will be replaced with water-efficient crops. Nonetheless, farmers’ incomes still suffer a slight loss because the water supply cannot meet the water demand in all the irrigation zones of Zhangye. Furthermore, the regions with higher net profit of crops will suffer a greater loss.
It is worth noting that implementing total water use control is likely to encounter opposition from the most important stakeholders—farmers who will experience a great loss in profits from the reduction of agriculture water use. This may intensify the conflict of water use across different sectors and regions, and then influence the feasibility of implementing a total water use control policy. There are two possible countermeasures that can be taken into consideration in the future. One is accelerating the industrialization and urbanization process and promoting the migration of surplus labor from rural to urban areas. These measures will help to reduce farmers’ dependence on the limited irrigation water, and to expand farmers’ non-agricultural incomes. The other one is to help farmers to improve water use efficiency so that the same amount of crops can be produced with less water. In the present situation, the utilization coefficient of the irrigation water is about 0.54. Agriculture irrigation still has great potential in improving efficiency in Zhangye. Advanced water conservation technologies, including engineering measures, agronomic measures and management measures must be introduced to achieve water-saving goals. In addition, the skills required for planting water-efficient crops should be introduced to farmers and put into practice under specific government programs. It can be expected that the measures to reduce farmers’ income loss come with some costs and will therefore rely on government support and efforts in order to be realized.
The impacts of the countermeasures above under the total water use control scenario would be an interesting research topic for further study. This integrated CGE-BEM framework can also be used for other regions experiencing water shortages by designing pathways based on their own characteristics to support sustainable social economic development.
Acknowledgments
This research was financially supported by the research plans of the National Natural Science Foundation of China (No. 91325302, 71173212, 41101556), and the China National Key project from the Ministry of Science and Technology (No. 2009CB421308). The authors also would like to thank Bingqian Yan from the University of Chinese Academy of Sciences and Zhuoying Zhang from the Academy of Mathematics and Systems Science, Chinese Academy of Sciences, for their contributions on household survey and the compilation of the Input Output Tables used in this paper.
Author Contributions
Na Li develops the integrated model, conducted the CGE model simulations and data analysis, and wrote and revised the paper. Xiaojun Wang conducted household surveys, BEM simulations and data analysis and helped to write the paper. Minjun Shi suggested the research theme and provided expert advice throughout the paper, and revised the paper. Hong Yang revised and polished the paper.
Conflicts of Interest
The authors declare no conflict of interest.
References
- Xiao, H.L.; Chen, G.D. Water Issue and Management at Basin Level in Heihe River, Northwestern China. J. Desert Res. 2006, 26, 1–5. [Google Scholar] [CrossRef]
- Ji, X.B.; Kang, E.S.; Chen, R.S.; Zhao, W.Z.; Zhang, Z.H.; Jin, B.W. The impact of the development of water resources on environment in arid inland river basins of Hexi region, Northwestern China. Environ. Geol. 2006, 50, 793–801. [Google Scholar] [CrossRef]
- Zhang, J.L. Barriers to water markets in the Heihe River basin in northwest China. Agric. Water Manag. 2007, 87, 32–40. [Google Scholar] [CrossRef]
- Cheng, G.D.; Xiao, H.L.; Xu, Z.M.; Li, J.X.; Lu, M.F. Water issue and its countermeasure in the inland river basins of northwest China-A case study in Heihe river basin. J. Glaciol. Geocryol. 2006, 28, 406–413. [Google Scholar]
- Wang, Y.; Xiao, H.L.; Wang, R.F. Water scarcity and water use in economic systems in Zhangye City, Northwestern China. Water Resour. Manag. 2009, 23, 2655–2668. [Google Scholar] [CrossRef]
- Seung, C.K.; Harris, T.R.; Eglin, J.E.; Netusil, N.R. Impacts of water reallocation: A combined computable general equilibrium and recreation demand model approach. Ann. Reg. Sci. 2000, 34, 473–487. [Google Scholar] [CrossRef]
- Goodman, D.J. More reservoir or transfer? A computable general equilibrium analysis of projected water shortages in the Arkansas River Basin. J. Agric. Resour. Econ. 2000, 25, 698–713. [Google Scholar]
- Go´mez, C.M.; Tirado, D.; Rey-Maquieira, J. Water exchange versus water work: Insights from a computable general equilibrium model for the Balearic Islands. Water Resour. Res. 2004. [Google Scholar] [CrossRef]
- Horridge, J.M.; Madden, J.R.; Wittwer, G. The impact of the 2002–2003 drought on Australia. J. Policy Model. 2005, 27, 285–308. [Google Scholar] [CrossRef]
- Smajgl, A.; Greiner, R.; Mayocchi, C. Estimating the implications of water reform for irrigators in a sugar growing region. Environ. Model. Softw. 2006, 21, 1360–1367. [Google Scholar] [CrossRef]
- Berrittella, M.; Hoekstra, A.Y.; Rehdanz, K.; Roson, R.; Tol, R.S. The economic impact of restricted water supply: A computable general equilibrium analysis. Water Res. 2007, 41, 1799–1813. [Google Scholar] [CrossRef] [PubMed] [Green Version]
- Wang, Y.; Xiao, H.L.; Ren, J.; Lu, M.F. Study on water resources utilization in Zhangye City based on CGE Model. Arid Zone Res. 2008, 22, 28–34. [Google Scholar]
- Juana, J.; Strzepek, K.; Kirsten, F. Market efficiency and welfare effects of inter-sectoral water allocation in South Africa. Water Policy 2011, 13, 220–231. [Google Scholar] [CrossRef]
- Calzadilla, A.; Rehdanz, K.; Tol, R. Water scarcity and the impact of improved irrigation management: A CGE analysis. Agric. Econ. 2011, 42, 305–323. [Google Scholar] [CrossRef]
- Wittwer, G. (Ed.) Economic Modeling of Water: The Australian CGE Experience; Springer: New York, NY, USA, 2012.
- Laborde, D.; Valin, H. Modeling land-use changes in a global CGE: Assessing the EU Biofuel mandates with the MIRAGE-BioF model. Clim. Chang. Econ. 2012, 3. [Google Scholar] [CrossRef]
- Robinson, S.; Gueneau, A. CGE-W: An integrated modeling framework for analyzing water-economy links applied to Pakistan. In Proceedings of the 16th Annual Conference on Global Economic Analysis, Shanghai, China, 12–14 June 2013.
- Roe, T.; Dinar, A.; Tsur, Y.; Diao, X.S. Feedback links between economy-wide and farm-level policies: With application to irrigation water management in Morocco. J. Policy Model. 2005, 27, 905–928. [Google Scholar] [CrossRef]
- Anderson, J.; Dillon, J.; Hardaker, J. Socio-economic modelling of farming systems. In Proceedings Series Australian Centre for International Agricultural Research; Agricultural Systems Research for Developing Countries, Proceedings of the International Workshop, Hawkesbury Agricultural College, Richmond, Australia, 2–15 May 1985; Hardaker, J.B., Ed.; pp. 77–88.
- Heerink, N.; Kuyvenhoven, A.; van Wijk, M.S. Economic policy reforms and sustainable land use in development countries Issues and approaches. In Economic Policy and Sustainable Land Use: Recent Advance in Quantitative Analysis for Developing Countries; Heerink, N., van Keulen, H., Kuiper, M., Eds.; Springer-Verlag: Berlin, Germany, 2001; pp. 1–20. [Google Scholar]
- Shi, M.J.; Zhang, Q.Y.; Wang, T. Better access to new technologies and credit service, farmers’ land use decision, and policy for poverty alleviation and rangeland conservation. Jarq-Jpn. Agric. Res. Q. 2005, 39, 181–190. [Google Scholar] [CrossRef]
- Janssen, S.; van Ittersum, M.K. Assessing farm innovations and responses to policies: A review of bio-economic farm models. Agric. Syst. 2007, 94, 622–636. [Google Scholar] [CrossRef]
- Bartolini, F.; Bazzani, G.M.; Gallerani, V.; Raggi, M.; Viaggi, D. The impact of water and agriculture policy scenarios on irrigated farming systems in Italy: An analysis based on farm level multi-attribute linear programming models. Agric. Syst. 2007, 93, 90–114. [Google Scholar] [CrossRef]
- Ponce, R.; Bosello, F.; Giupponi, C. Integrating Water Resources into Computable General Equilibrium Models-A Survey (Issue PR0140); Centro Euro-Mediterraneo sui Cambiamenti Climatici (CMCC): Lecce, Italy, 2012. [Google Scholar]
- Diao, X.S.; Roe, T.L.; Doukkali, R.M. Economy-wide gains from decentralizing water allocation in a spatially heterogeneous agricultural economy. Environ. Dev. Econ. 2005, 10, 249–269. [Google Scholar] [CrossRef]
- Cakmak, E.H.; Dudu, H.; Saracoglu, S.; Diao, X.S.; Roe, T.; Tsur, Y. Macro-Micro Feedback Links of Irrigation Water Management in Turkey (No.4781); The World Bank Policy Research Working Paper; The World Bank: Washington, DC, USA, 2008. [Google Scholar]
- Hassan, R.; Thurlow, J. Macro-micro feedback links of water management in South Africa: CGE analyses of selected policy regimes. Agric. Econ. 2011, 42, 235–247. [Google Scholar] [CrossRef]
- Gansu Water Resources Department. Gansu Water Resource Bulletin; Official documents: 2000–2012; Gansu Water Resources Department: Lanzhou, China, 2000–2012.
- Gao, X.M. The trend of current situation and the existing problems of national water-saving irrigation. Tianjin Agric. Sci. 2012, 18, 54–56. [Google Scholar]
- Zhangye Municipal Government. Zhangye Outline of the 12th Five-Year Plan for Economic and Social Development; Governmental Report; Zhangye Municipal Government: Zhangye, China, 2010.
- Lofgren, H.; Harris, R.L.; Robinson, S. A Standard Computable General Equilibrium (CGE) Model in GAMS; International Food Policy Research Institute (IFPRI): Washington, DC, USA, 2001. [Google Scholar]
- Li, N.; Shi, M.J.; Yuan, Y.N. Impacts of carbon tax policy on regional development in China: A dynamic simulation based on China multi-regional CGE model. Acta Geogr. Sin. 2010, 65, 1572–1584. [Google Scholar]
- Li, S.T. (Ed.) Computable General Equilibrium Model for China and Its Application; Economic Science Press: Beijing, China, 2010.
- Xia, J; Deng, Q.; Sun, Y.B. Integrated water and CGE model of the impacts of water policy on the Beijing’s economy and output. Chin. J. Popul. Resour. Environ. 2010, 8, 61–67. [Google Scholar]
- Cardenete, M.A.; Hewings, G.J.D. Water price and water sectoral reallocation in Andalusia: A computable general equilibrium approach. Environ. Econ. 2011, 2, 17–27. [Google Scholar]
- Qureshi, M.E.; Proctor, W.; Yong, M.D.; Wittwer, G. The economic impact of increased water demand in Australia: A computable general equilibrium analysis. Econ. Pap. 2012, 31, 87–102. [Google Scholar] [CrossRef]
- Armington, P.S. A theory of demand for products distinguished by place of Produefion. Int. Monet. Fund Staff Pap. 1969, 1, 170–201. [Google Scholar]
- Shi, M.J.; Wang, X.J.; Yang, H.; Wang, T. Pricing or quota? A solution to water scarcity in oasis regions in China: A case study in the Heihe River Basin. Sustainability 2014, 6, 7601–7620. [Google Scholar] [CrossRef]
- Shi, M.J.; Tao, W.C.; Zhao, X.T.; Song, X.F. Spatial allocation of water resource and environmental rehabilitation in Shiyang River Basin, Gansu Province, China-Application of a distributed water resource management model. J. Nat. Resour. 2009, 24, 1133–1145. [Google Scholar]
- Wang, X.J.; Shi, M.J.; Wang, L. Solutions to water scarcity in arid regions: Effectiveness of water demand management policy. J. Nat. Resour. 2013, 28, 1117–1129. [Google Scholar]
© 2015 by the authors; licensee MDPI, Basel, Switzerland. This article is an open access article distributed under the terms and conditions of the Creative Commons Attribution license (http://creativecommons.org/licenses/by/4.0/).


