2.3.1. Psychological Security Coefficient
The psychological security coefficient (F) is meant to better mirror the conflict between citizens’ feelings of safety and references to actual urban water resource availability and accessibility. It is a measure reflecting the ratio of the actual water resource environment and the citizens’ safety concerns. For the city population, the whole psychological security of a given study area is affected by their surrounding environment, including changes in city importance, the economy, politics and culture. Thus for a given city with a certain population and with the same background, psychological security does not change substantially. Here, we set the hypothesis that the psychological security coefficient does not change substantially in a short time if the economy, politics and culture did not experience huge changes. Because we conducted the assessment of Dalian from 2010–2012, which is the nearest time for which data is available in the context of the Twelfth Five-Year Plan, we can define the coefficient F as a constant during the study year, and the actual water supply and security status is the average of these years. Figures indicating the water quantity, water quality and the risk are different.
In the following section, F is the generalization of the coefficients Fqt, Fql and Fr. Thus, in our research, according to the criteria layer, we separately reflect the citizens’ feeling of safety coefficient for water quantity, water quality and water-related risk with the indicators of Fqt, Fql and Fr. For the calculation of Fqt, we use the ratio of domestic water consumption to the water quota for domestic use that is acceptable for a citizen’s normal life; Fql is the ratio of the drinking water quality standard to the drinking water quality standard that residents can accept in daily life; Fr is the ratio of the amount of flooding time that residents can endure to the actual flooding occurrence in the study area. In this case, the flooding time indicator is a negative indicator. Thus, coefficient F (including Fqt, Fql and Fr.) is always more than 0, but it has different meanings when it is greater than, less than or equal to the constant 1:
When F = 1, it means that the actual urban water security status of this element can meet the psychological safety demand, which is at the equilibrium state;
When F > 1, it means that the actual urban water security status of this element is good enough to meet and even greater than the psychological safety demand standard, and the assessment score of this element will be greater than before the assessment;
When 0 < F < 1, it means that the actual urban water security status of this element is not good enough to meet the psychological safety demand standard and the assessment score of this element will be less than before the assessment. It also tells us that we should do more to solve and improve the situation to achieve harmony with people's safety demands.
We obtained the real residents’ water safety feeling standard and specific data for F using an urban water security assessment questionnaire survey. The questionnaire was designed to obtain the standard line of water resource supply that people can accept while feeling safe and satisfied, namely, the sufficient water consumption volume, clear and standard water quality and acceptable risk degree (disaster frequency). Given that our questionnaire was designed for residents, we selected three specific elements, which were based on the following principles: intuitive, common, quantifiable, easy to answer, comparable and calculable. Water quantity is indicated by the daily domestic water consumption availability. Water quality is shown by drinking water to an abnormal degree, and flooding frequency is the reflection of the degree of water-related risk. Based on the three aspects, we selected three scenarios, and each scenario was divided into several levels to let participants select the appropriate level they can accept and feel safe.
These three scenarios are “the lowest number of times it is acceptable to bathe every week,” “annual drinking water problem occurrence times” and “urban flooding frequency during the flood season,” which can be transformed into water quantity, water quality and the risk condition. These three indices were quantified and divided into four or five levels according to their happening times. Components were asked to mark the proper level of problem occurrences according to their lifestyle and mental security demands. Specific questionnaire table were as follows (
Table 2).
Table 2.
People’s psychological security standard questionnaire design.
Table 2.
People’s psychological security standard questionnaire design.
| Alternative level (k) | Lowest number of times acceptable to bathe every week | Whether you can accept or not | Annual drinking water problem occurrence times | Whether you can accept or not | Urban flooding frequency during the flood season | Whether you can accept or not |
|---|
| 1 | [0, 2] | | (10, +∞) | | (10, +∞) | |
| 2 | (2, 4] | | (5, 10] | | (5, 10] | |
| 3 | (4, 6] | | (4, 5] | | (4, 5] | |
| 4 | (6, +∞) | | (0, 3] | | (0, 3] | |
| 5 | | | 0 | | 0 | |
Here, we designed the questionnaire to get the data for bathing times with one week as a period, so that the respondents could understand and answer questions easier. In the calculation of Fqt, we can transform the bathing time every week to daily domestic water consumption per capita; bathing time is used as the numerator and the domestic water quota is used as the denominator. The calculation equations of F
qt are as follows:
Where, n
k is the average alternative bathing times for the k
th level of
Table 2, r
k is the rate of people who chose the k
th level to be their psychological security standard, c is the average water consumption for each bathing per capita, unit L, λ is the ratio of average water consumption for every bathing to total domestic consumption per capita per day, and Q is the water quota for domestic consumption per capita per day. k = 1, 2, 3, 4, and accordingly n
k = 1, 3, 5, 7.
For the calculation of Fql and Fr, both the data of the numerator and denominator were obtained from the questionnaire, and for the availability and uniformity, we gave different levels different scores from 0−1, while the score per level for the numerator and denominator were consistent. The basic principle is to multiply scores for each given level and its ratio of population who choose this level to total questionnaire respondents.
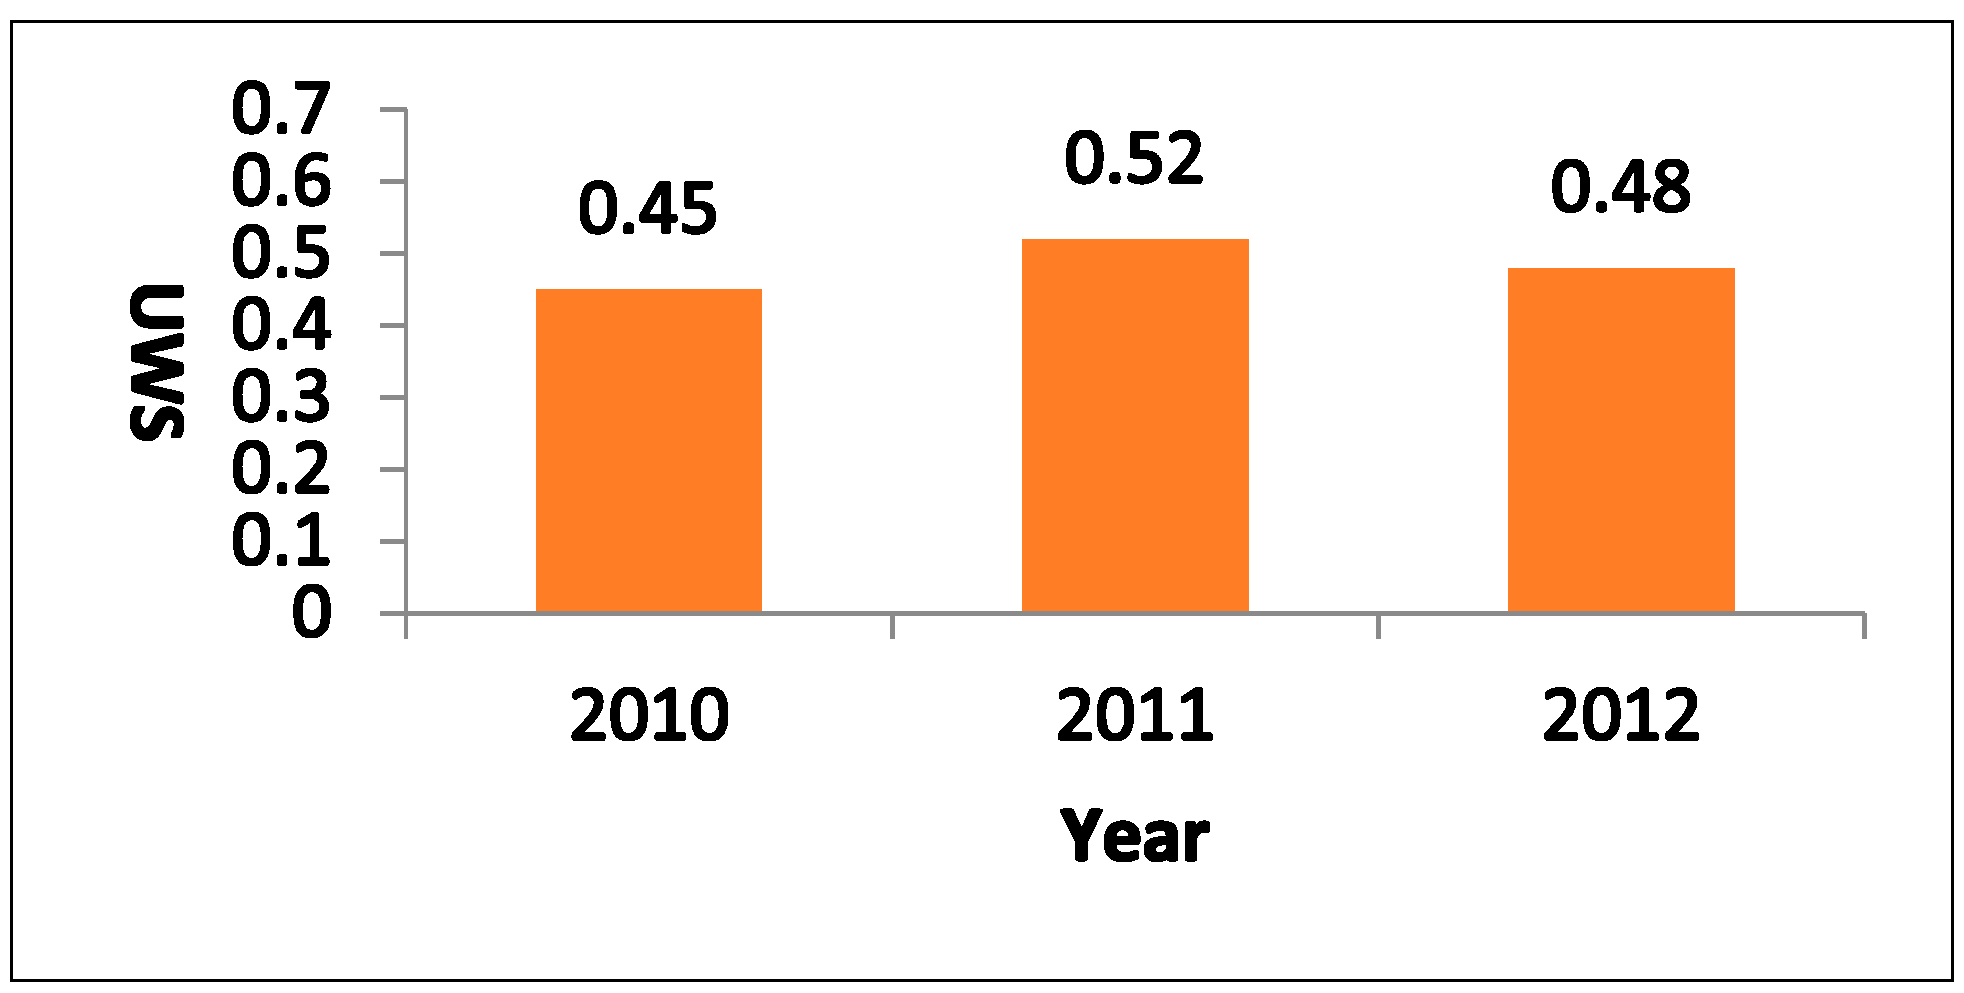
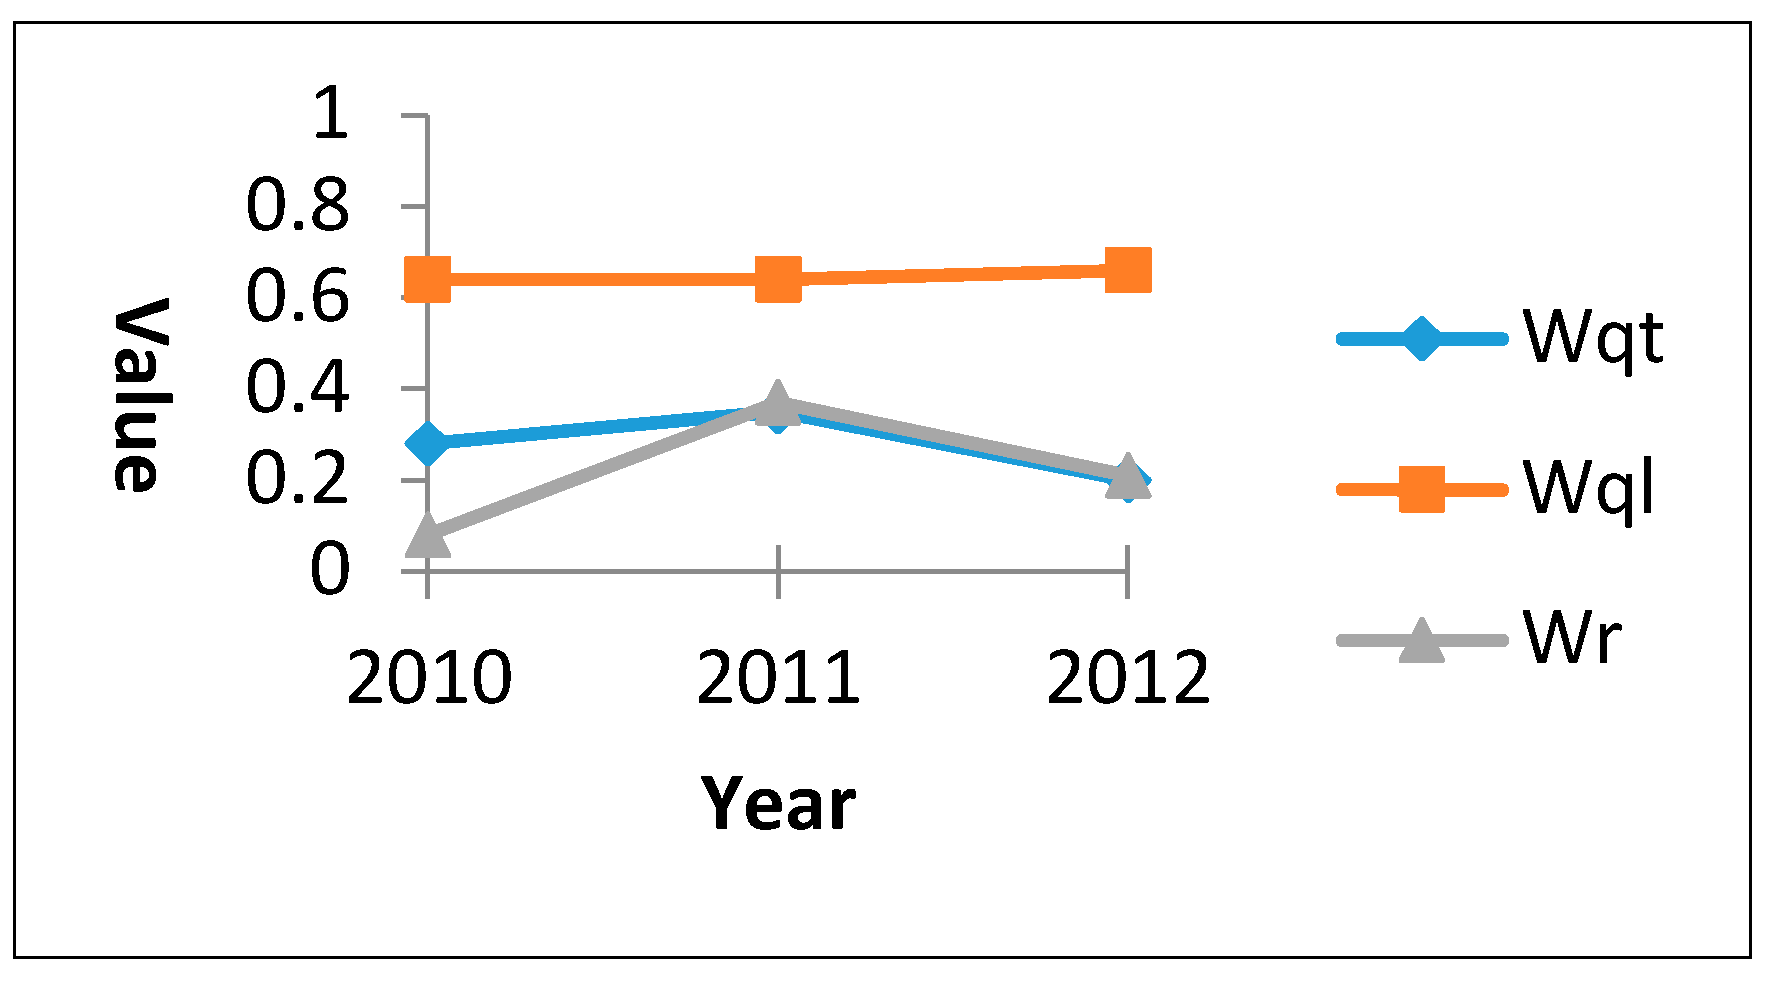
2.3.2. Urban Water Security Assessment Model
Urban water security (
UWS) indices were calculated using the weighted average method, with the following equations:
Where Wqt, Wql and Wr are, respectively, water quantity , water quality and the risk index of urban water security; Vj is the normalized element value of the jth water security indicators; Rj is the weight of the jth water security indicator; Fqt, Fql, and Fr are respectively the psychological security coefficients for water quantity, water quality and the risk; α, β, γ are respectively the weights of water quantity, water quality and the risk; UWS is the urban water security index with the combination of material and psychological security assessment; and j = 1, 2…, 12.
From this equation, we can see that the introduction of the psychological security coefficient F is appropriate to adjust and revise general water security without the consideration of citizens’ psychological feelings. The value of this variable indicates the gap between the current water status and peoples’ mental security feelings, and it would appropriately adjust the assessment score and make the result better or worse.
2.3.3. Data Collection and Normalization
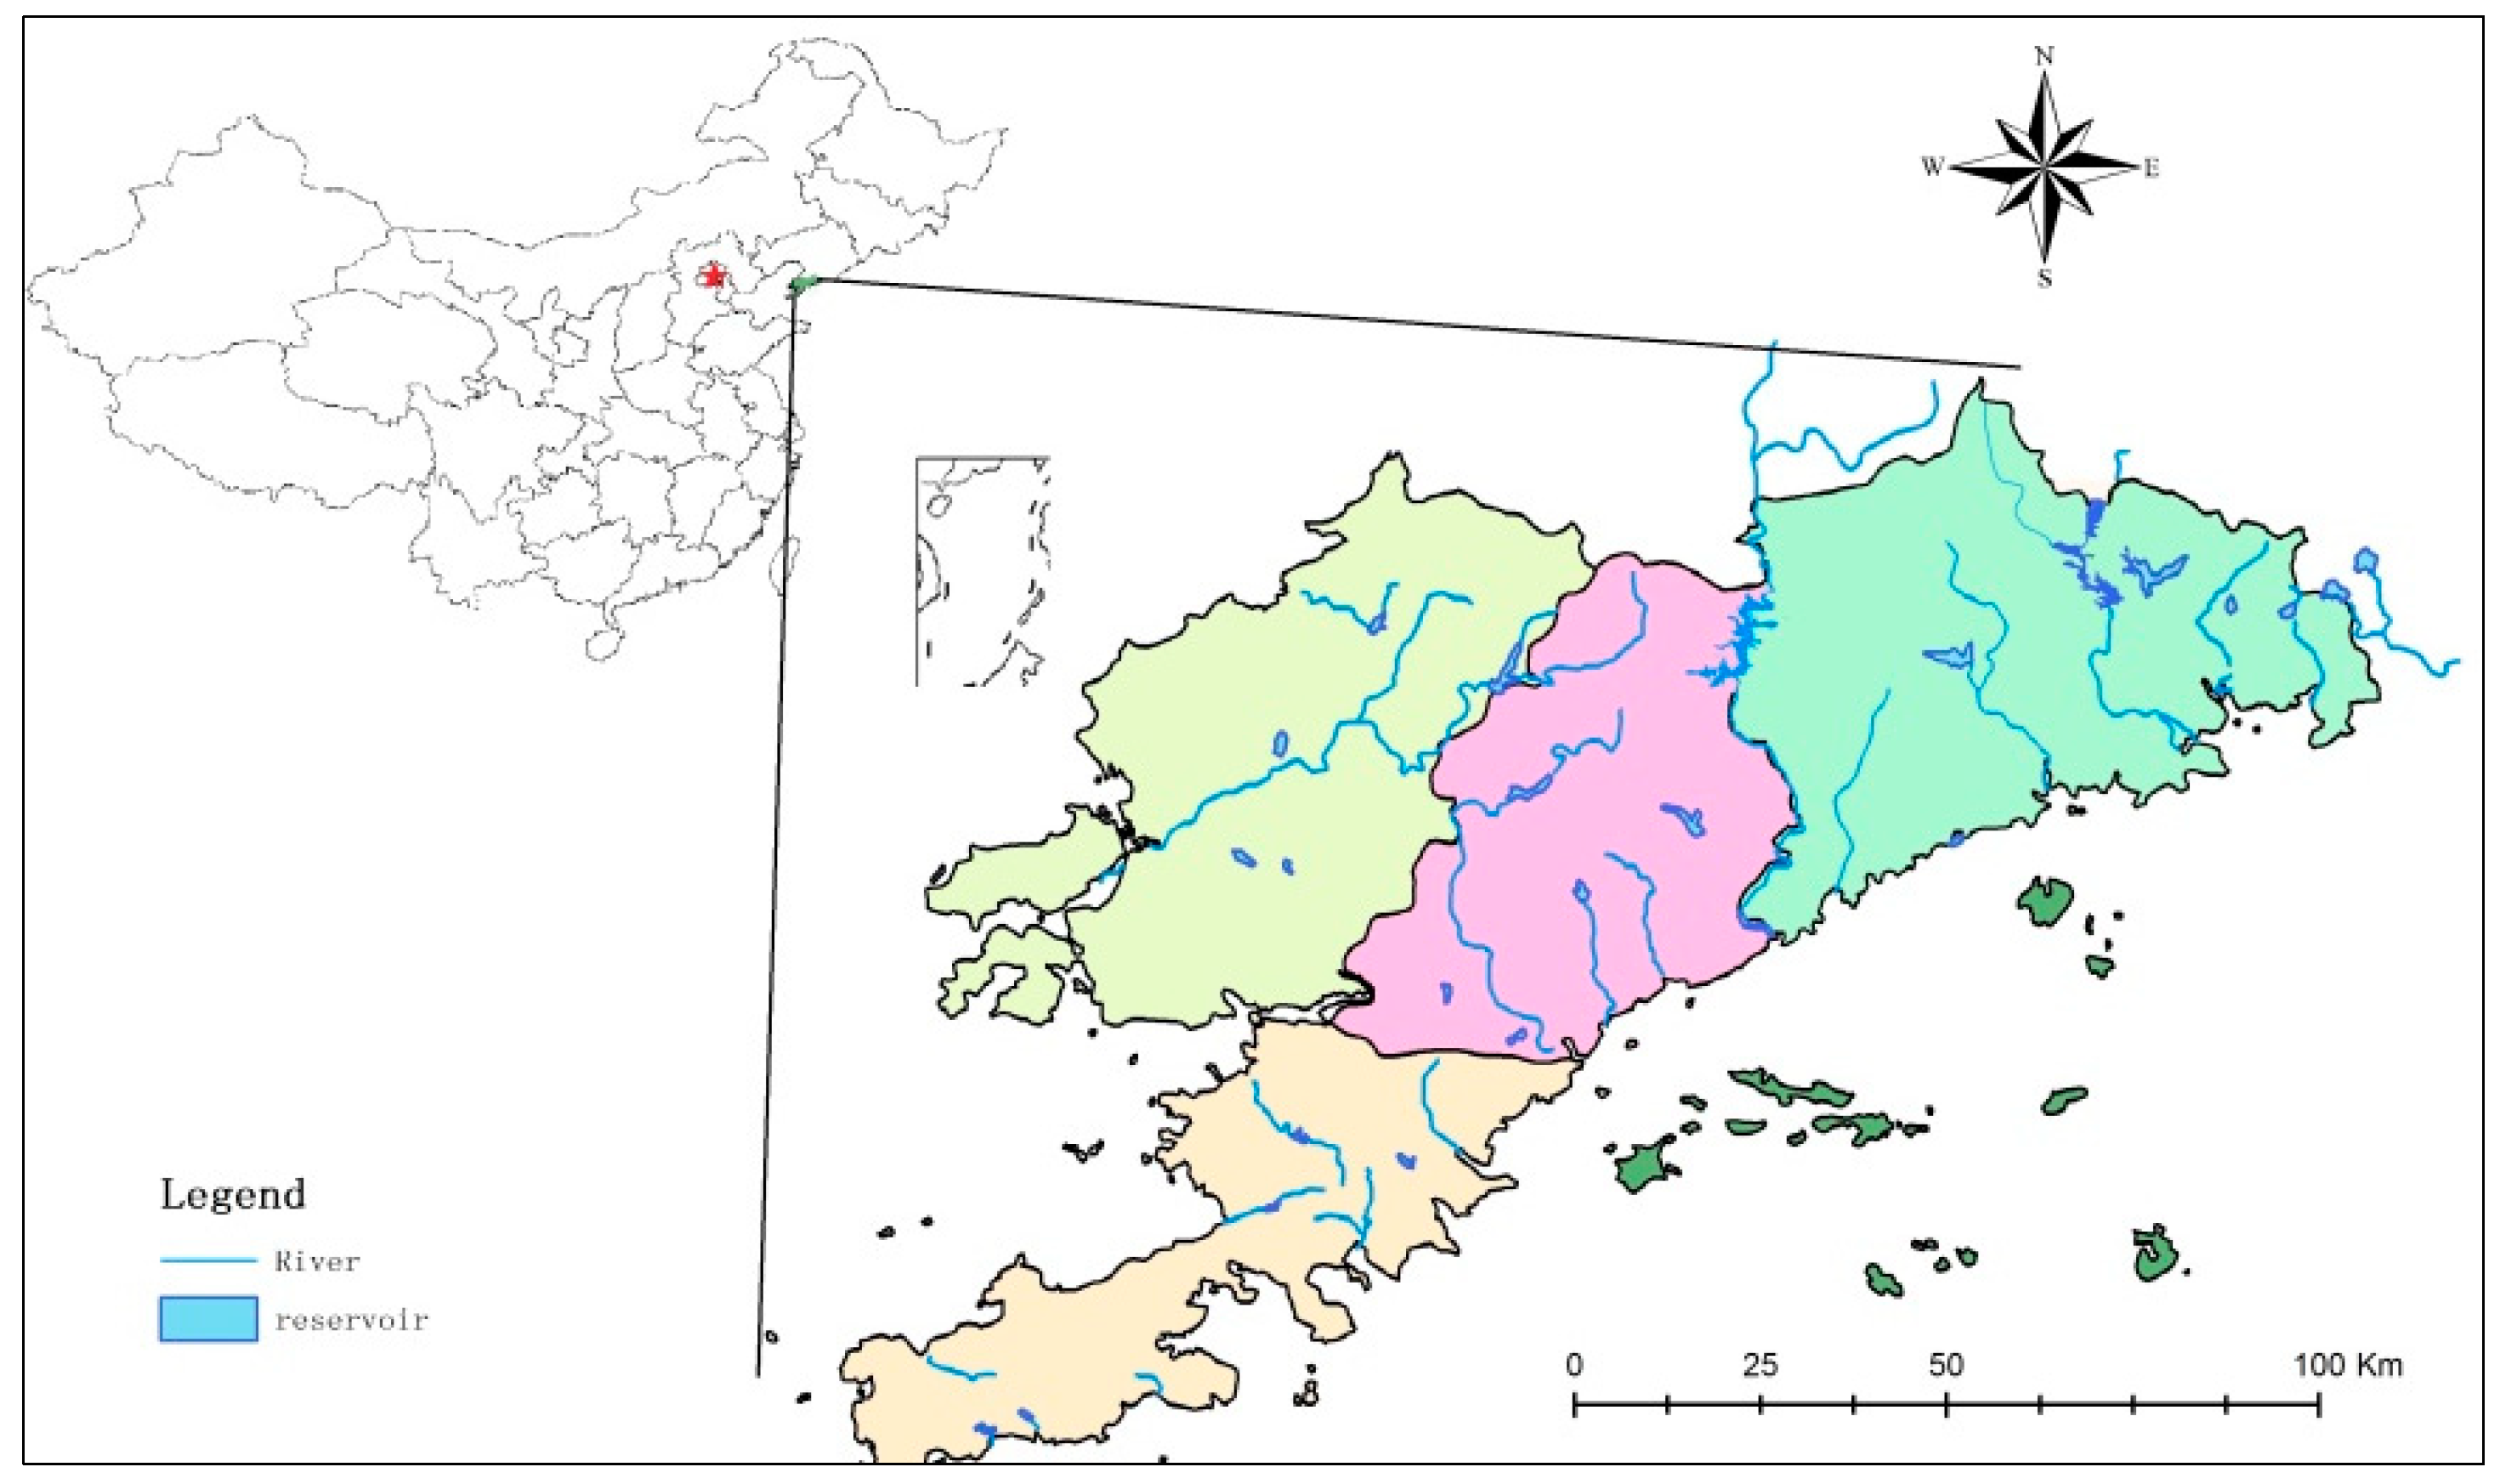
Here, we took a typical water-stressed coastal city in China (Dalian) as a case study. By looking up the statistics and literature, we obtained the water security assessment indicator data of Dalian from 2010–2012 (
Table 2). Data sources included the Dalian Water Resources Bulletin, Dalian statistical yearbook, Disaster Bulletin and some authoritative reports on the Internet.
Having obtained all of the data, we normalized the data to eliminate the effects of different properties and dimensions. The score of the material security indices could be normalized using the efficacy coefficient method.
For a positive indicator, the normalization equation is:
For a negative indicator, the normalization equation is:
Where v
ij is the efficacy coefficient of year i and indicator j; x
ij is the actual value of year i and indicator j; x
jmax and x
jmin are the upper and lower bounds. In a practical evaluation, a value 10% lower than the maximum value of a quantitative indicator is considered to be its upper bound and a value 10% higher than the minimum value of a quantitative indicator is considered to be its lower bound [
4].
We conducted a questionnaire survey about Dalian urban water security. In order to analyse the result according to the distribution character and population traits, we made a survey plan before we carried out the questionnaire survey. The plan made clear the survey population and survey areas. The survey population should include at least 30% female or 30% male; 20% older people and 20% children; 20% high income and 20% low income. We also designed questions in the questionnaire related to the weights among water quantity, water quality and the risk index: “Of the following items, which do you think has a greater effect on the assessment of water security?” According to the questionnaire results, we obtained their weight rates.
The survey was taken in four crowded districts (Zhongshan District, Xigang District, Shahekou District and Ganjingzi District) of Dalian to assess its water security status from the perspective of the residents. In each district we sent out about 80 questionnaires by face-to-face communication. The survey area covered different functional zones of the city, which can represent people with living conditions, lifestyles and education levels, including: (1) living zones, where urban river quality problems were severe and many citizens lived there for a long time; (2) greening zones, for example the park, crowded with people and convenient for communicating with city dwellers; (3) teaching zones, for example schools and Dalian Library, where respondents were always highly educated and could give more objective answers and deeper thinking; and (4) high and new technology zones, with many company staff. Finally we sent out 315 questionnaires and obtained 275 valid questionnaires (valid return rate is 87.3%).
The questionnaire content was divided into three parts: basic information, water security status survey and the security demand determination. The first part was designed to determine basic information about the residents answering the questionnaire. The second part was to determine the current security status of water in Dalian and to let residents choose water resource indicators that they found more critical. The third part of the questionnaire was set to assess the psychological security perception of the criteria layer of the assessment index: water quantity, water quality and the risk, designed for the calculation of psychological security coefficients.
According to our survey, about 95.1% of total respondents had lived in Dalian for more than half a year, which matched the condition of resident population, and they were familiar with Dalian’s water security status. A total of 96.4% of them had high school degrees or beyond, ensuring the outcomes were effective enough. As to their occupations, 35% respondents were students, 30% were company staff, 10% teachers, 10% worked in administrative institutions, 10% were workers and 5% had retired.
2.3.4. Indicator Weight Calculation
Generally, methods to determine indicator weights can be divided into two or three methods: subjective or objective determination, or a combination thereof. The analytic hierarchy process (AHP) is a widely-used method for multi criteria decision support based on the hierarchical decomposition of objectives, evaluation of preferences through pair wise comparisons, and subsequent aggregation into global evaluations [
31,
32]. Based on mathematics and psychology, it has been widely applied to decision making in various areas. Some scholars employed questionnaire surveys to determine the importance of assessment elements in the study area to make assessment indicators and results more targeted and accurate [
16,
33].
The indicator weights of the criteria and index layers were calculated using the AHP method and integrating the willingness of residents, which was obtained via their questionnaire voting results. We have designed questions in the questionnaire related to the weights among water quantity, water quality and the risk index: “Of the following items, which do you think have a greater effect on the assessment of water security?” Options are quantity, water quality and the risk. According to the questionnaire results, we got their weight rates. According to the questionnaire results, we found that approximately 20% of the respondents chose water quantity, 60% chose water quality and 20% chose the risk. This provides the weights for water quantity, water quality and the risk, 0.20, 0.60 and 0.20, respectively.
Finally, we asked 8 scholars in the water resource field to measure the importance rate between every two indicators in the same criteria layer, got the average and formalized them as integers. According to the 1 to 9 scale method, we made comparisons of all of the indicators in each criteria layer and then used AHP method to determine the weights. An indicator importance matrix was constructed based on MATLAB software to calculate the weight and check the consistency, and CR values less than 0.1 indicated that the results all passed the consistency test. All of the data from Dalian for 2010–2012, including the normalized data and their weights, are shown in
Table 3.
Table 3.
Urban water security assessment data and weights for Dalian, China from 2010–2012.
Table 3.
Urban water security assessment data and weights for Dalian, China from 2010–2012.
| Indicator | Weights | Original data of different years | Normalized data of different years |
|---|
| 2010 | 2011 | 2012 | 2010 | 2011 | 2012 |
|---|
| Water quantity (B1) 0.20 * | Water resources per capita (C1, m³) | 0.3542 | 511.6 | 569.8 | 493.0 | 0.37 | 0.69 | 0.27 |
| Water resources utilization rate (C2, %) | 0.3542 | 39.35 | 42.38 | 55.15 | 0.84 | 0.72 | 0.22 |
| Other water supply proportion (C3, %) | 0.1632 | 7.0 | 9.2 | 9.2 | 0.18 | 0.76 | 0.76 |
| Rate of rejuvenated water reuse (C4, %) | 0.0484 | 40 | 38 | 42 | 0.48 | 0.32 | 0.65 |
| Water penetration rate (C5, %) | 0.0800 | 100 | 100 | 100 | 1 | 1 | 1 |
| Water quality (B2) 0.60 * | Water quality standard-reaching rate of drinking water sources (C6, %) | 0.3800 | 100 | 100 | 100 | 1 | 1 | 1 |
| Ratio of the river length with water quality in Class III to the total assessed river length(C7, km/km) | 0.0948 | 60.3 | 68.7 | 85.7 | 0.15 | 0.36 | 0.79 |
| Rate of class I~IV groundwater quality reaching standard (C8, %) | 0.2024 | 93.3 | 87.5 | 87.5 | 0.61 | 0.37 | 0.37 |
| Ratio of seawater intrusion area to the administrative area (C9, hm2/hm2) | 0.1267 | 5.1 | 5.2 | 5.3 | 0.59 | 0.51 | 0.43 |
| Waste water treatment rate (C10, %) | 0.1962 | 90.4 | 95.05 | 95.1 | 0.39 | 0.59 | 0.59 |
| The risk (B3) 0.20 * | Ratio of the population influenced by flooding and flooding to the total population (C11, %) | 0.8333 | 10.5 | 1.4 | 6.3 | 0.10 | 0.99 | 0.51 |
| Ratio of the water reserved in dams at the end of the year to the total water utilization (C12, m3/m3) | 0.1667 | 97.4 | 87.0 | 91.4 | 0.66 | 0.30 | 0.45 |


