2.1. Study Area
Even though the Inland River Basin of China is a place with a low speed of development in comparison to the national average, the fragile ecosystem has suffered greatly from economic development recently [
32]. In this study, we focus our case study on the northwest region, which is an arid and half arid area and is one of the three physical geographic regions of China. It covers five provinces, including Shaanxi, Qinghai, Gansu, Ningxia and Xinjiang, with an area of about 30.93 million square kilometers, and accounts for 32.2% of the total area of China. This region is sparsely populated, arid and lacking water with a fragile ecological environment. However, this region is rich in land, energy and mineral resources, with huge potentials for development. Especially, the land, coal, oil, natural gas, nonferrous metals and salt lake resources share large proportions of those in the whole nation, making this region an important reserve base for guaranteeing the sustained development of the national economy.
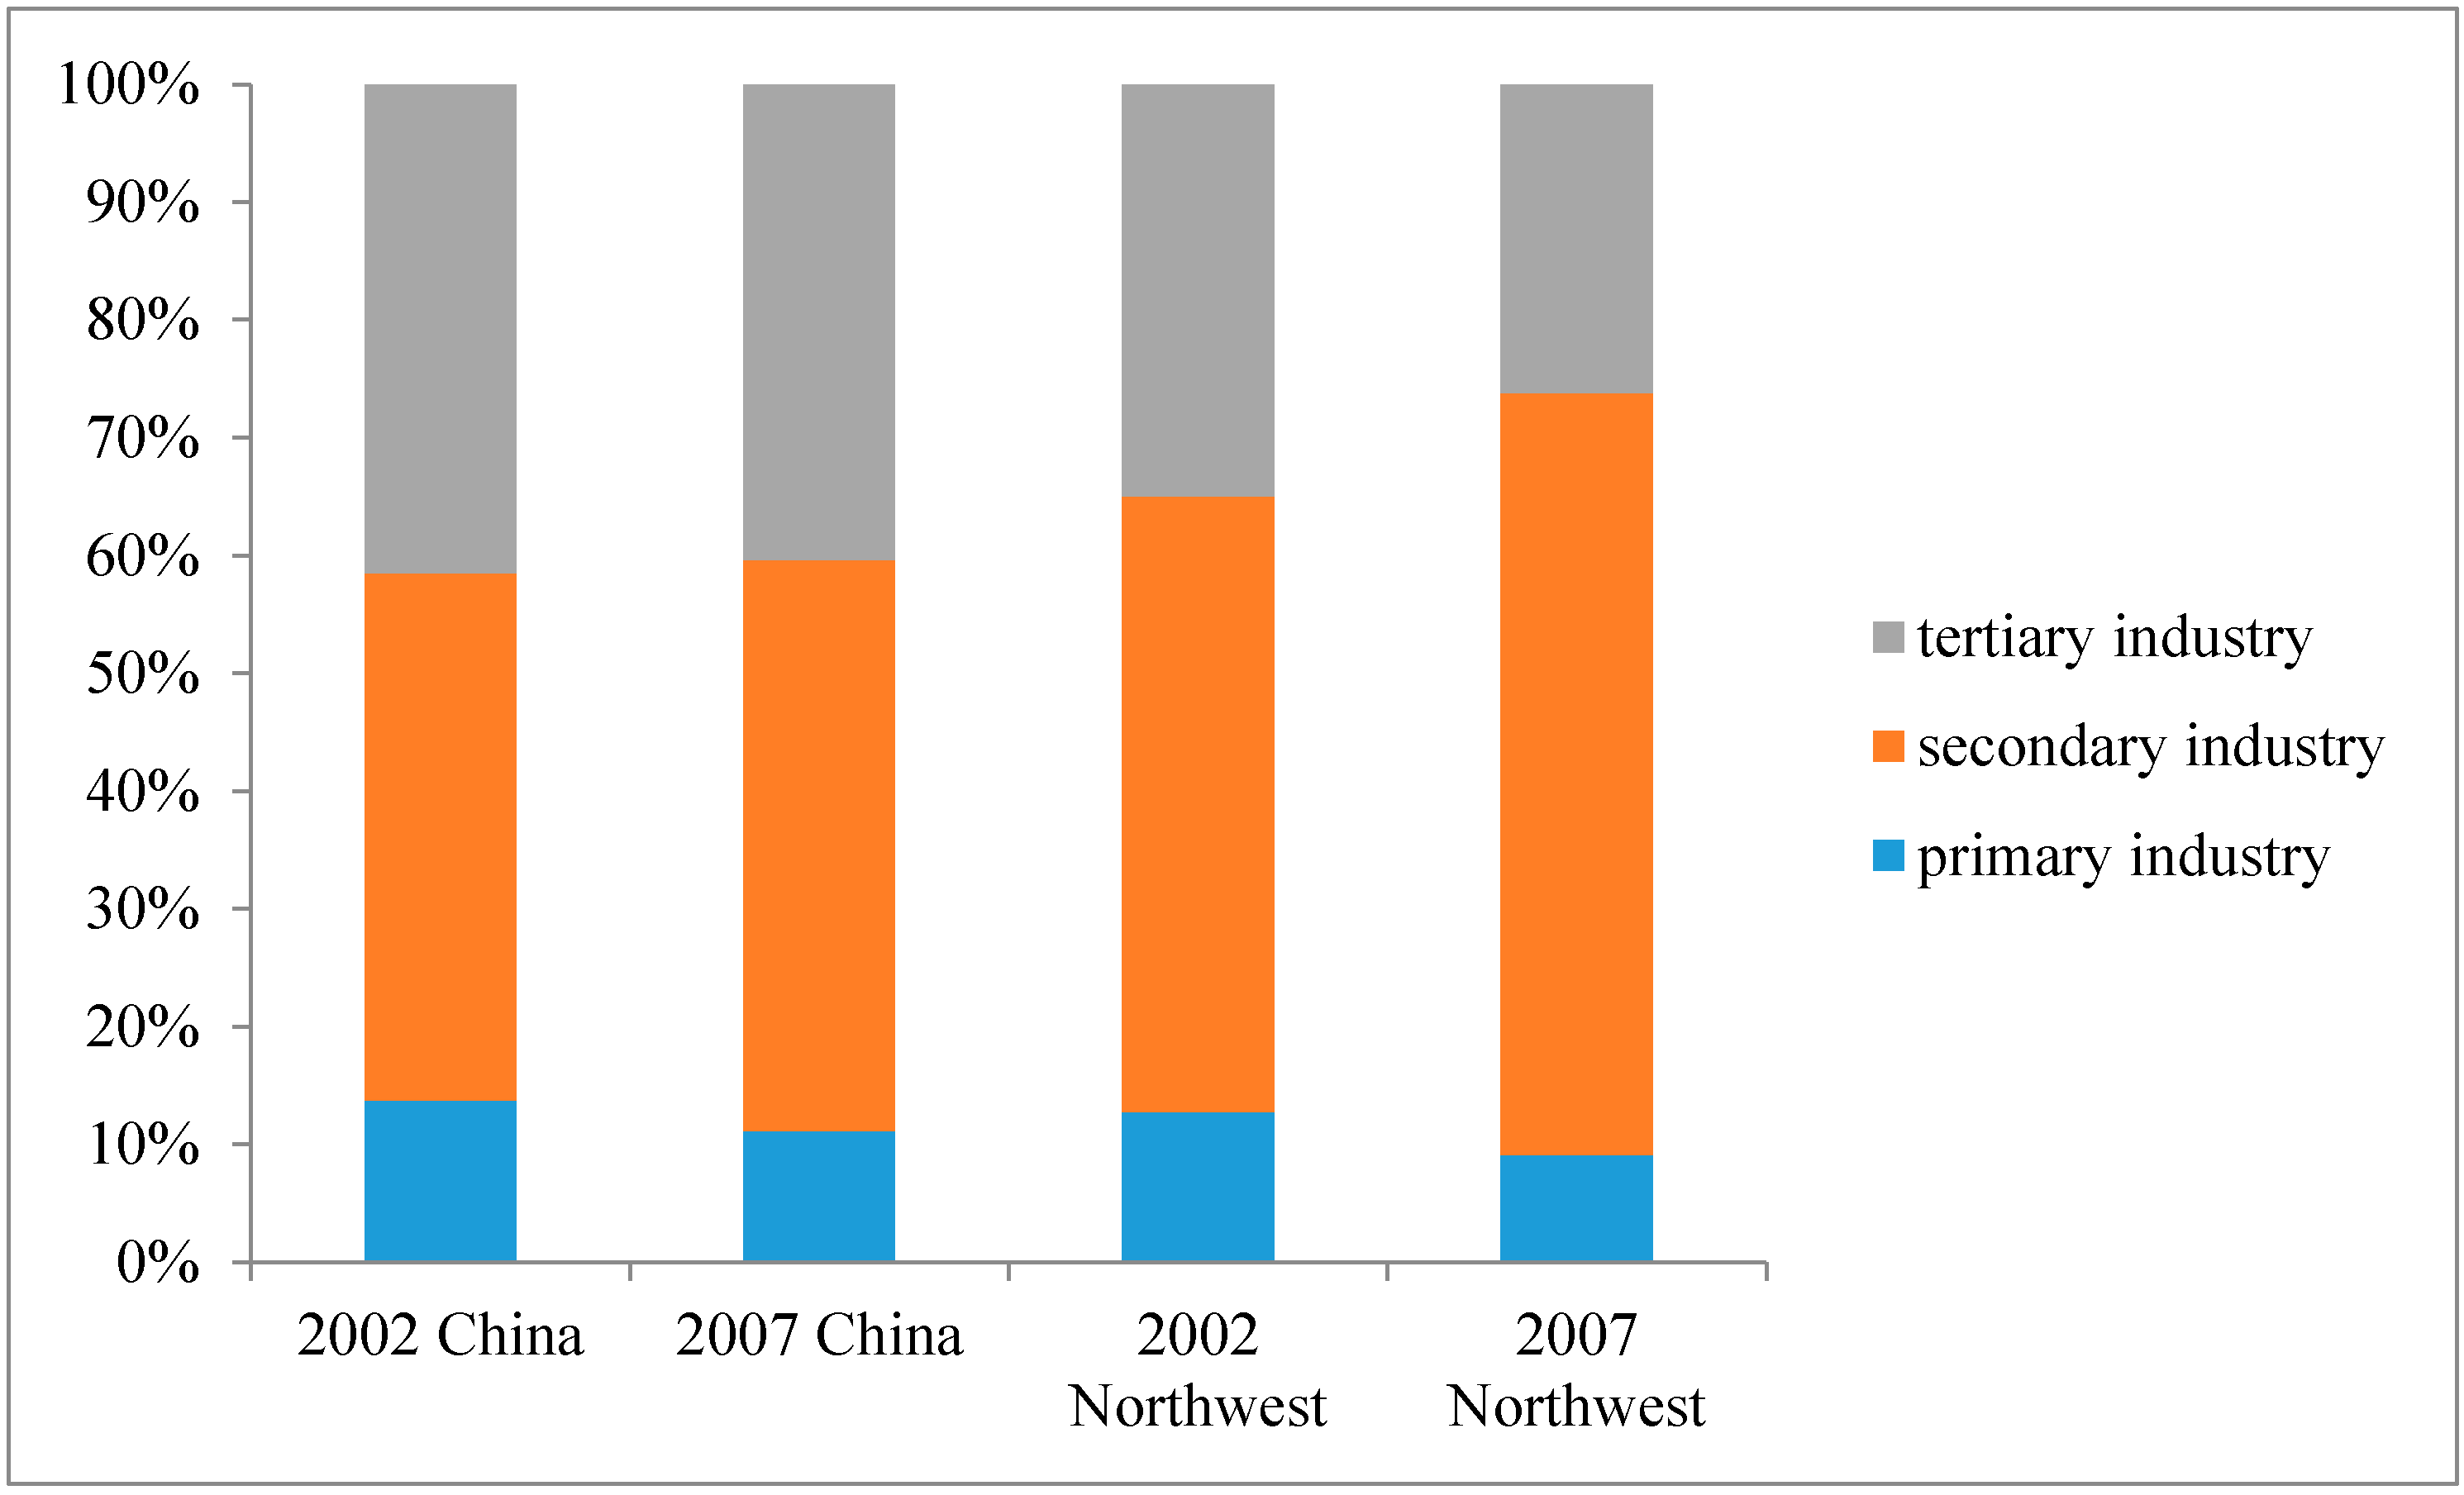
The industrial structure in the northwest region is characterized by a “231” mode, with the secondary industry taking the larger proportion and still increasing. From 2002 to 2007, the proportion of secondary industry in the northwest region increased from 52% to 65%, which is higher than the proportion at the national level (
Figure 1); while the proportions of the primary and tertiary industries were both decreasing by 9% and 4% in 2002 and 2007, respectively. The proportions are lower than those of the primary and tertiary industry at the national level. The nation presents a “231” industrial structure mode on the whole, with no obvious change from 2002 to 2007.
Figure 1.
Industrial structure in China and the northwest region, 2002 and 2007.
Figure 1.
Industrial structure in China and the northwest region, 2002 and 2007.
We further divided the secondary industry into 14 sectors, acquiring an industrial structure with 16 sectors (
Figure 2). In the secondary industry, the GDP of some sectors was increased, while in other sectors, decreased. Among them, the most obvious increase occurred in the mining and quarrying sector, metal products sector and industrial chemicals sector, with an increase of 4.3%, 3.9% and 2.4%, respectively. Besides, the GDP proportion of the electricity, gas and water production and supply sector, food, beverages and tobacco and transport equipment sector increased to different extents; while the most obvious decrease occurred in the construction sector, decreasing by 1.5%. There are also minute decreases in the paper, paper products and printing sector and electric apparatus and communication equipment and other manufacturing sector.
Figure 2.
Percentage change of the industrial structures (%) in northwest China, 2002 to 2007. Note: the 16 numbers in the horizontal axis represent the 16 industrial sectors respectively. 1 for primary industry; 2 for mining and quarrying sector; 3 for food, beverages and tobacco sector; 4 for textiles, apparel and leather sector; 5 for wood products and furniture sector; 6 for paper, paper products and printing sector; 7 for industrial chemicals sector; 8 for non-metallic mineral products sector; 9 for metal products sector; 10 for machinery and equipment sector; 11 for transport equipment sector; 12 for electric apparatus and communication equipment sector; 13 for other manufacturing sector; 14 for electricity, gas and water production and supply sector; 15 for construction sector; and 16 for tertiary industry.
The five provinces of northwest China are geopolitically adjacent to each other. They are all rich in resources with a similar industrial structure. There is rapid economic development in the five provinces. The current economic development structure is between the level of the low-income countries and middle-income countries of the world. Ever since China’s western development, the industrial structure of the five provinces have been characterized by agricultural labor form the majority of the population; the secondary industry contributes most to the output value, and the service industry is enlarging.
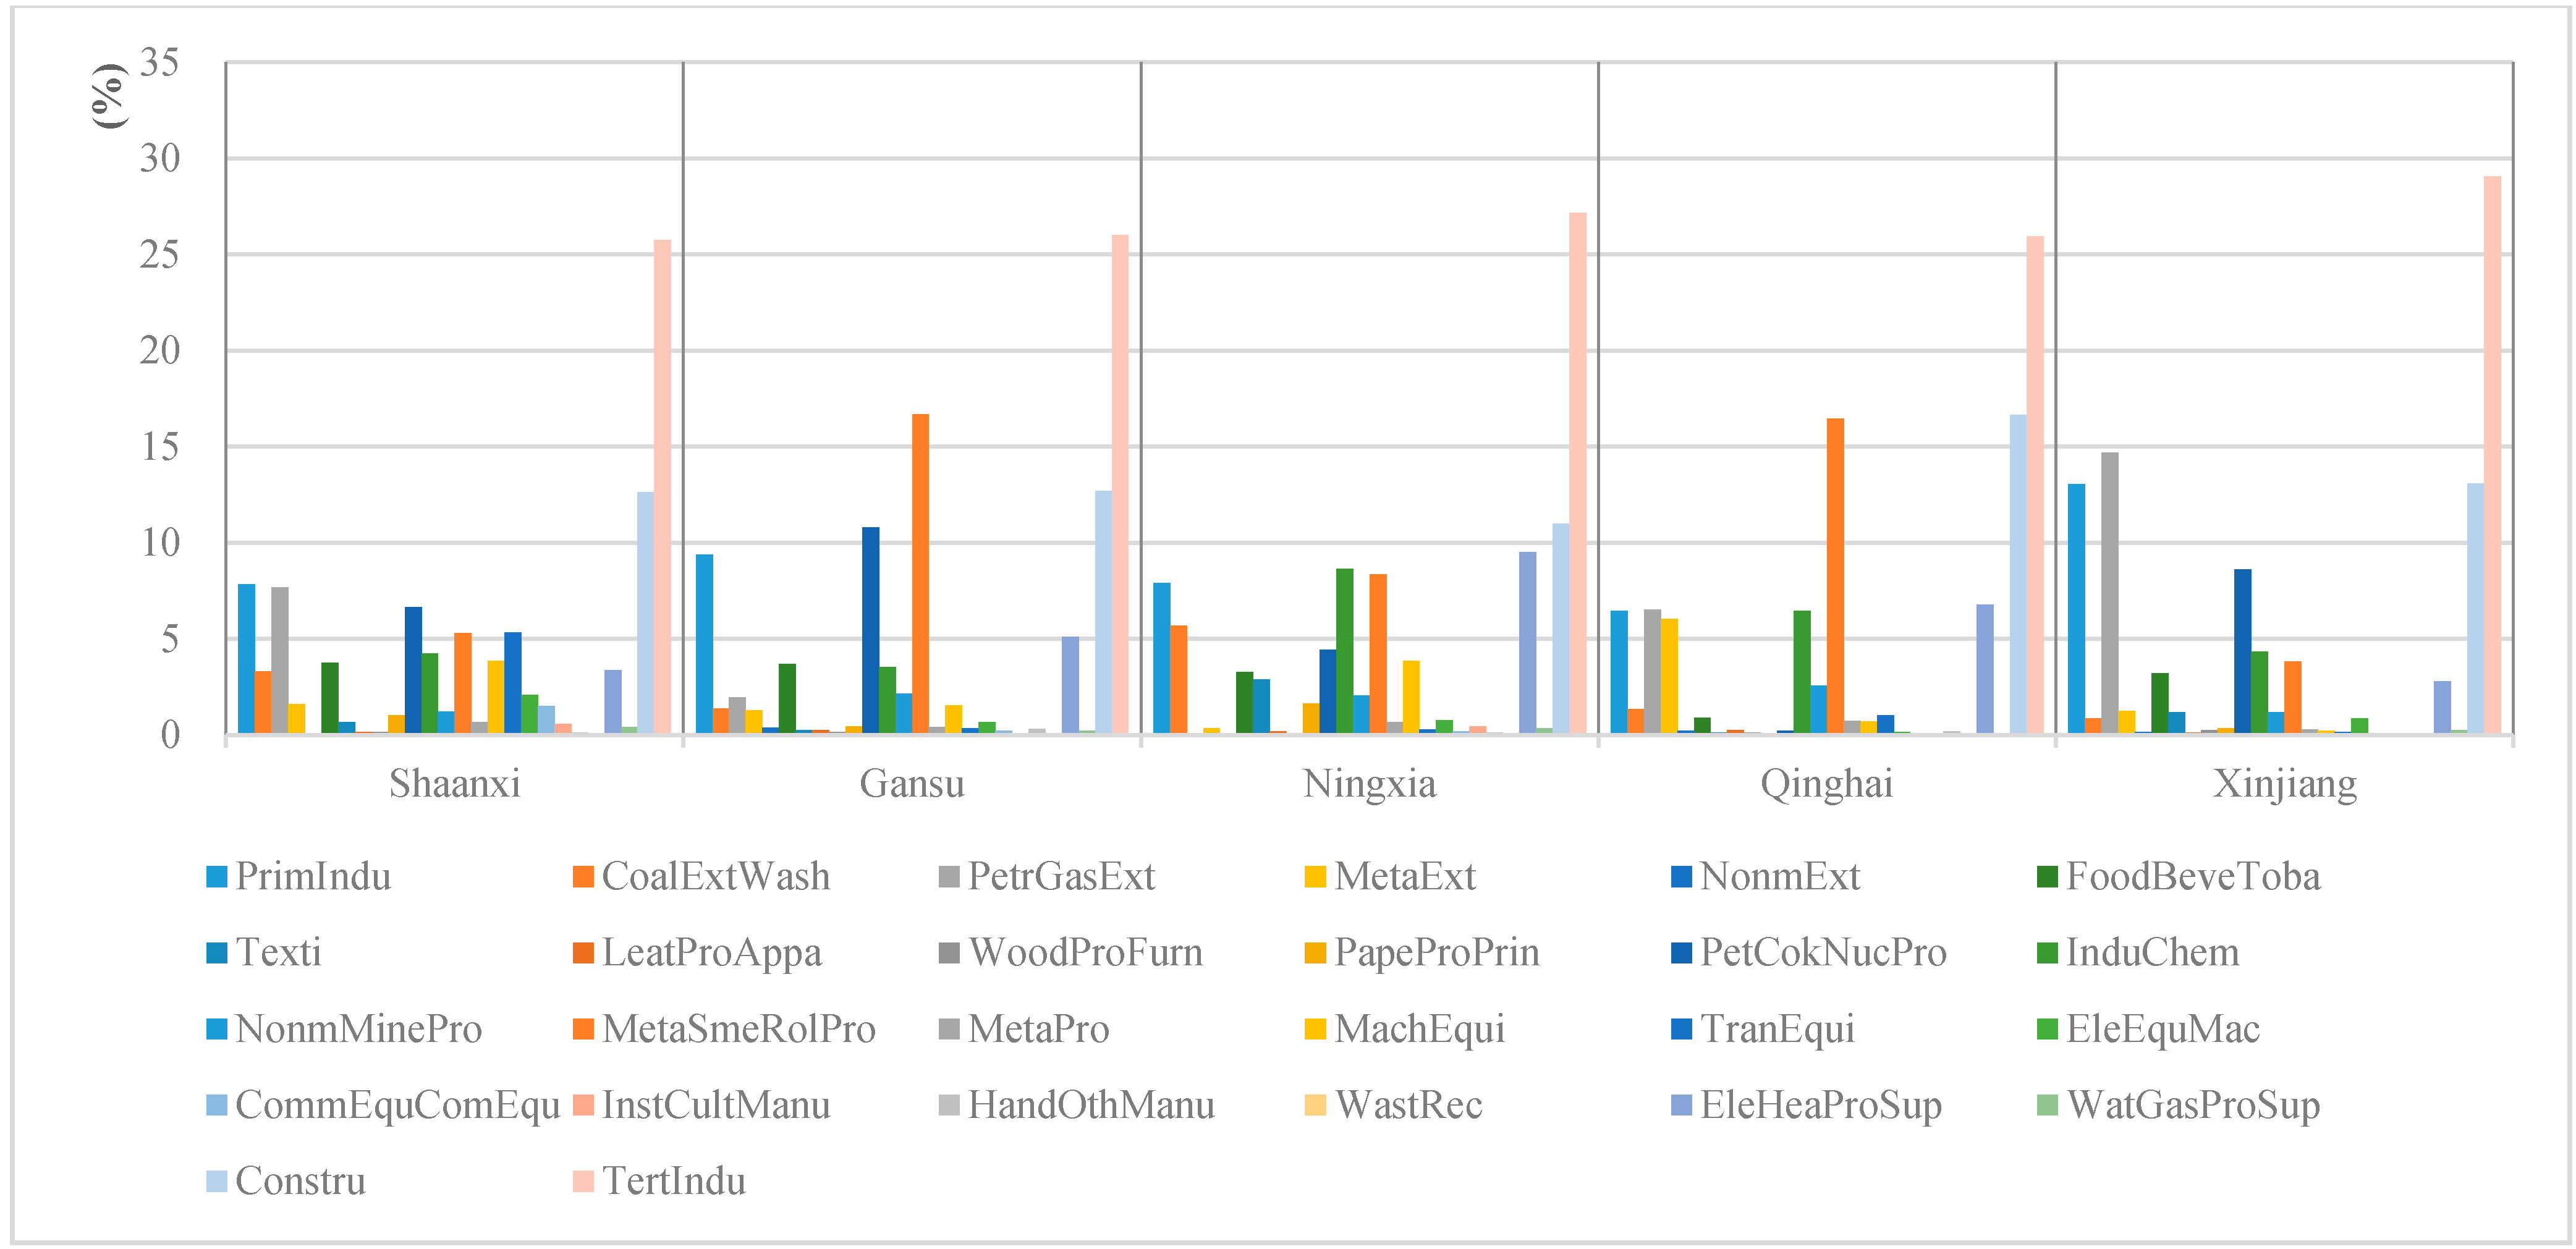
Figure 3 shows the industrial structure of the five provinces with 26 sectors in 2007. The industrial structure in all five provinces presents the “231” mode. Among all of the sectors in the secondary industry, the construction sector took the largest proportion in Shaanxi, Ningxia and Qinghai. In Gansu, the metal smelting and rolling products sector took the largest GDP proportion; while in Xinjiang, the petroleum and gas extraction sector took the lead.
Figure 3.
Percentage of the industrial structure (%) of the five provinces of northwest China in 2007. Note: The 26 abbreviations in the horizontal axis are short for the 26 industrial sectors, respectively. PrimIndu represents for primary industry; CoalExtWash represents for coal extraction and washing sector; PetrGasExt represents for petroleum and gas extraction sector; MetaExt represents for metal extraction sector; NonmExt represents for non-metal extraction sector; FoodBeveToba represents for food; beverages and tobacco sector; Texti represents for textile sector; LeatProAppa represents for leather products and apparel sector; WoodProFurn represents for wood products and furniture sector; PapeProPrin represents for paper; paper products and printing sector; PetCokNucPro represents for petroleum; coking and nuclear fuel products sector; InduChem represents for industrial chemicals sector; NonmMinePro represents for non-metallic mineral products sector; MetaSmeRolPro represents for metal smelting and rolling products sector; MetaPro represents for metal products sector; MachEqui represents for machinery and equipment sector; TranEqui represents for transport equipment sector; EleEquMac represents for electric equipment and machinery sector; CommEquComEqu represents for communication equipment; computers and other electronic equipment sector; InstCultManu represents for instrumentation and cultural office machinery manufacturing sector; HandOthManu represents for handicrafts and other manufacturing sector; WastRec represents for waste recycling sector; EleHeaProSup represents for electricity and heat production and supply sector; WatGasProSup represents for water and gas production and supply sector; Constru represents for construction sector; TertIndu represents for tertiary industry. The categories are different from
Figure 2 because we used the refined data industries of the five provinces.
![Sustainability 07 04323 g003]()
2.2. Data
In order to make a comparative analysis, two kinds of I-O tables are used in this study, the regional ones and the provincial ones. The regional I-O tables of 2002 and 2007 are used to analyze the industrial structural transformation and the sustainable development in the whole of northwest China, which are compiled by the State Information Center [
33]. Sixteen sectors are include in the regional I-O tables: 1 is in primary industry; 1 is in the mining and quarrying sector; 4 of them are in light industry; 7 of them are in heavy industry; 1 in the electricity, gas and water production and supply sector; 1 in the construction sector; and 1 in another tertiary sector. China is divided into eight regions based on geographic, agro-climatic and demographic characteristic and economic development levels, while the regionalization is consolidated with provincial-level administrative boundaries in the regional input-output tables.
The provincial I-O tables of the five provinces of northwest China are also used in our study; they are used to make a similar analysis at the level of each province, which are compiled by the State Statistical Bureau of China [
34]. Within the regional I-O tables of each province of northeast China, categories of the industrial sectors are kept consistent and comparable with each other based on the system of national accounts. There are 42 sectors in the provincial I-O tables, and among these sectors, 1 is in primary industry, 24 are in secondary industry, 1 in the construction sector, 1 in the transport and communication and warehousing sector and 15 are in other tertiary sectors. For the need of analysis and for the convenience of calculation, we merger the 16 service sectors into 1 tertiary sector and combine the 24 sectors and 1 construction sector into 24 secondary industry sectors; therefore, we got 5 provincial I-O tables with 26 industrial sectors.
2.3. I-O Table Analysis
The I-O table analysis method is a comprehensive research method. It assimilates the core idea of the correlation among economic activities in the general equilibrium theory and mainly analyzes the quantified ratio technical economic ties among different economic sectors. It depicts the dynamic flow of a product or service in a given area of economic sectors. Through compiling a checkerboard type I-O table and setting up a corresponding system of linear algebraic equations, this method builds an economic mathematical model to simulate the social reproduction process in the real national economic system. It analyzes the detailed statistics of the whole economic system under an economic theory framework and reveals quantified ratio technical economic ties among different economic sectors.
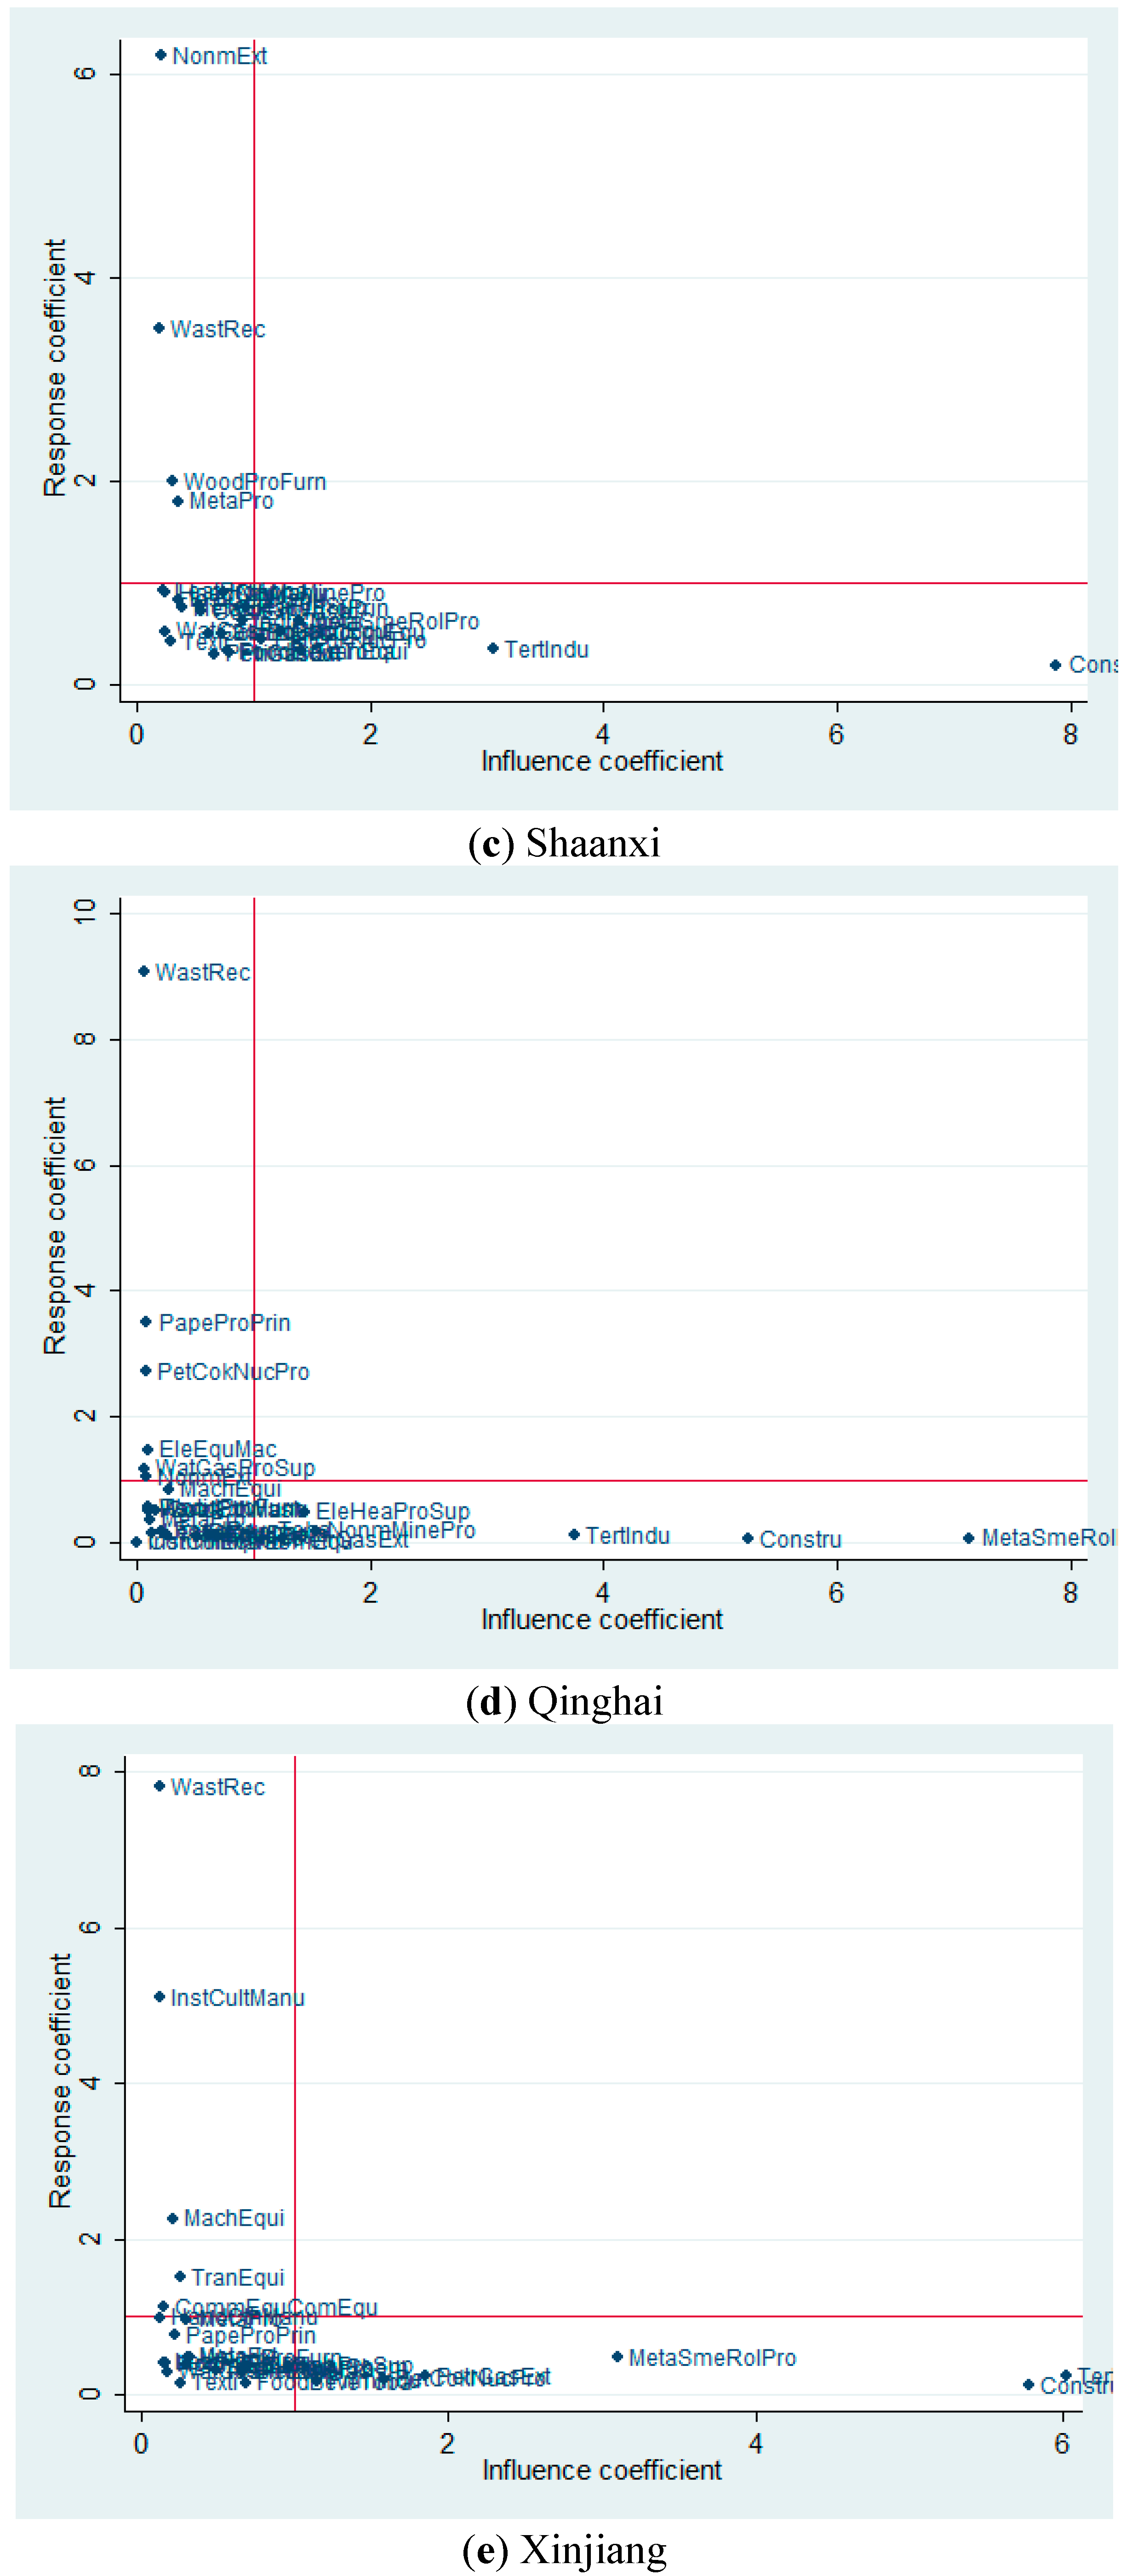
The influence coefficient and response coefficient are the two important coefficients in the I-O table analysis. In the research of modern industry, it is one of the classical methods to analyze the response and influence coefficient from the perspective of the industrial chain based on the I-O table. In this study, we define the status of the sector according to its response and influence coefficient. Taking the output value proportion factor and the contribution to the national economy via units of output into comprehensive consideration could better reflect the status of industrial sectors in the whole national economy and the pulling effect on other industries.
In this study, based on the traditional input-output table (
Table 1), we built the input-output analysis model. Four kinds of coefficients are calculated in the process of I-analysis in order to analyze the relationship between industries and sustainable development, the direct consumption coefficient, the full demand coefficient, the influence coefficient and the response coefficient.
Table 1.
The fundamental form of the I-O table.
Table 1.
The fundamental form of the I-O table.
| | | Intermediate use | Final demand | Gross output |
|---|
| | | 1 | 2 | …… | n |
|---|
| Intermediate input | 1 | Xij Quadrant I | Yi Quadrant II | Xi |
| 2 |
| …… |
| n |
| Value added | Nj Quadrant III | Quadrant IV | |
| gross input | Xj | | |
The direct consumption coefficient is calculated by the following formula:
while the direct consumption coefficient matrix is expressed as:
Equation (3) establishes the connection between production and gross output:
Then, we fit the direct consumption coefficient in Equation (3) and express (3) in matrix form; we get:
Therefore, Equation (4) can be written as:
where
I is the unit matrix, and
(I − A) is the so-called Leontief multiplier matrix.
From further deformation of Equation (5), we get the fowling equation:
where
(I − A)−1 is the full demand coefficient matrix (B matrix), which means the gross demand value of gross output from the unit of final production; it can be expressed as:
2.4. Inter-Industrial Linkage Analysis
As we know, the essence of inter-industrial linkage is the demand and supply relationship among different sectors. Hence, in this study, we conducted the inter-industrial analysis by analyzing the backward linkages and the forward linkages. Backward linkages are linked with other industrial sectors through demand, and forward linkages are through supply to connect with other sectors in the whole of the national sectors. They are key indicators to evaluate the interdependence among sectors. For convenience, we normalized the backward linkages and forward linkages in the process of inter-industrial linkage analysis.
The normalized backward linkages in the I-O analysis are defined as follow:
where
(j = 1, 2, …n) represents the influence of j industry sector, which means the demand for the gross output of the national economic sectors from j industry sector per increase of the unit of final output. Additionally, (j = 1, 2,…n) means the social average influence. The backward linkages, which are also known as influence coefficients, are often used in analyzing the pulling effect of industrial association. The greater the value of , the stronger the influence j industry sector holds. If = 1, then the influence of j industry sector is equal to the social average influence, which means the influence of j industry sector is neutral; if > 1, then the influence of j industry sector is greater than the social average influence, which means the influence of j industry sector is promoted; If < 1, then the influence of j industry sector is less than the social average influence, which means the influence of j industry sector is slackened.
Similarly, the forward linkages are defined as follows:
where
represents the response of
i industry sector, which means the increase output of
I industry sector when the gross final output of the national economic sectors increases by a unit. Additionally,
(
j = 1, 2, …n) means the social average response. The forward linkages, which are also known as the response coefficient, can be used to analyze the industrial correlation pulling effect. The more intermediate use value an industry sector can supply to other sectors, the greater value of the response it holds. If
= 1, then the response of
i industry sector is equal to the social average response, which means the response of
i industry sector is neutral; if
> 1, then the response of
i industry sector is greater than the social average response, which means the response of
i industry sector is a strong restriction; if
< 1, then the response of
i industry sector is less than the social average response, which means the response of
i industry sector is a weak restriction.
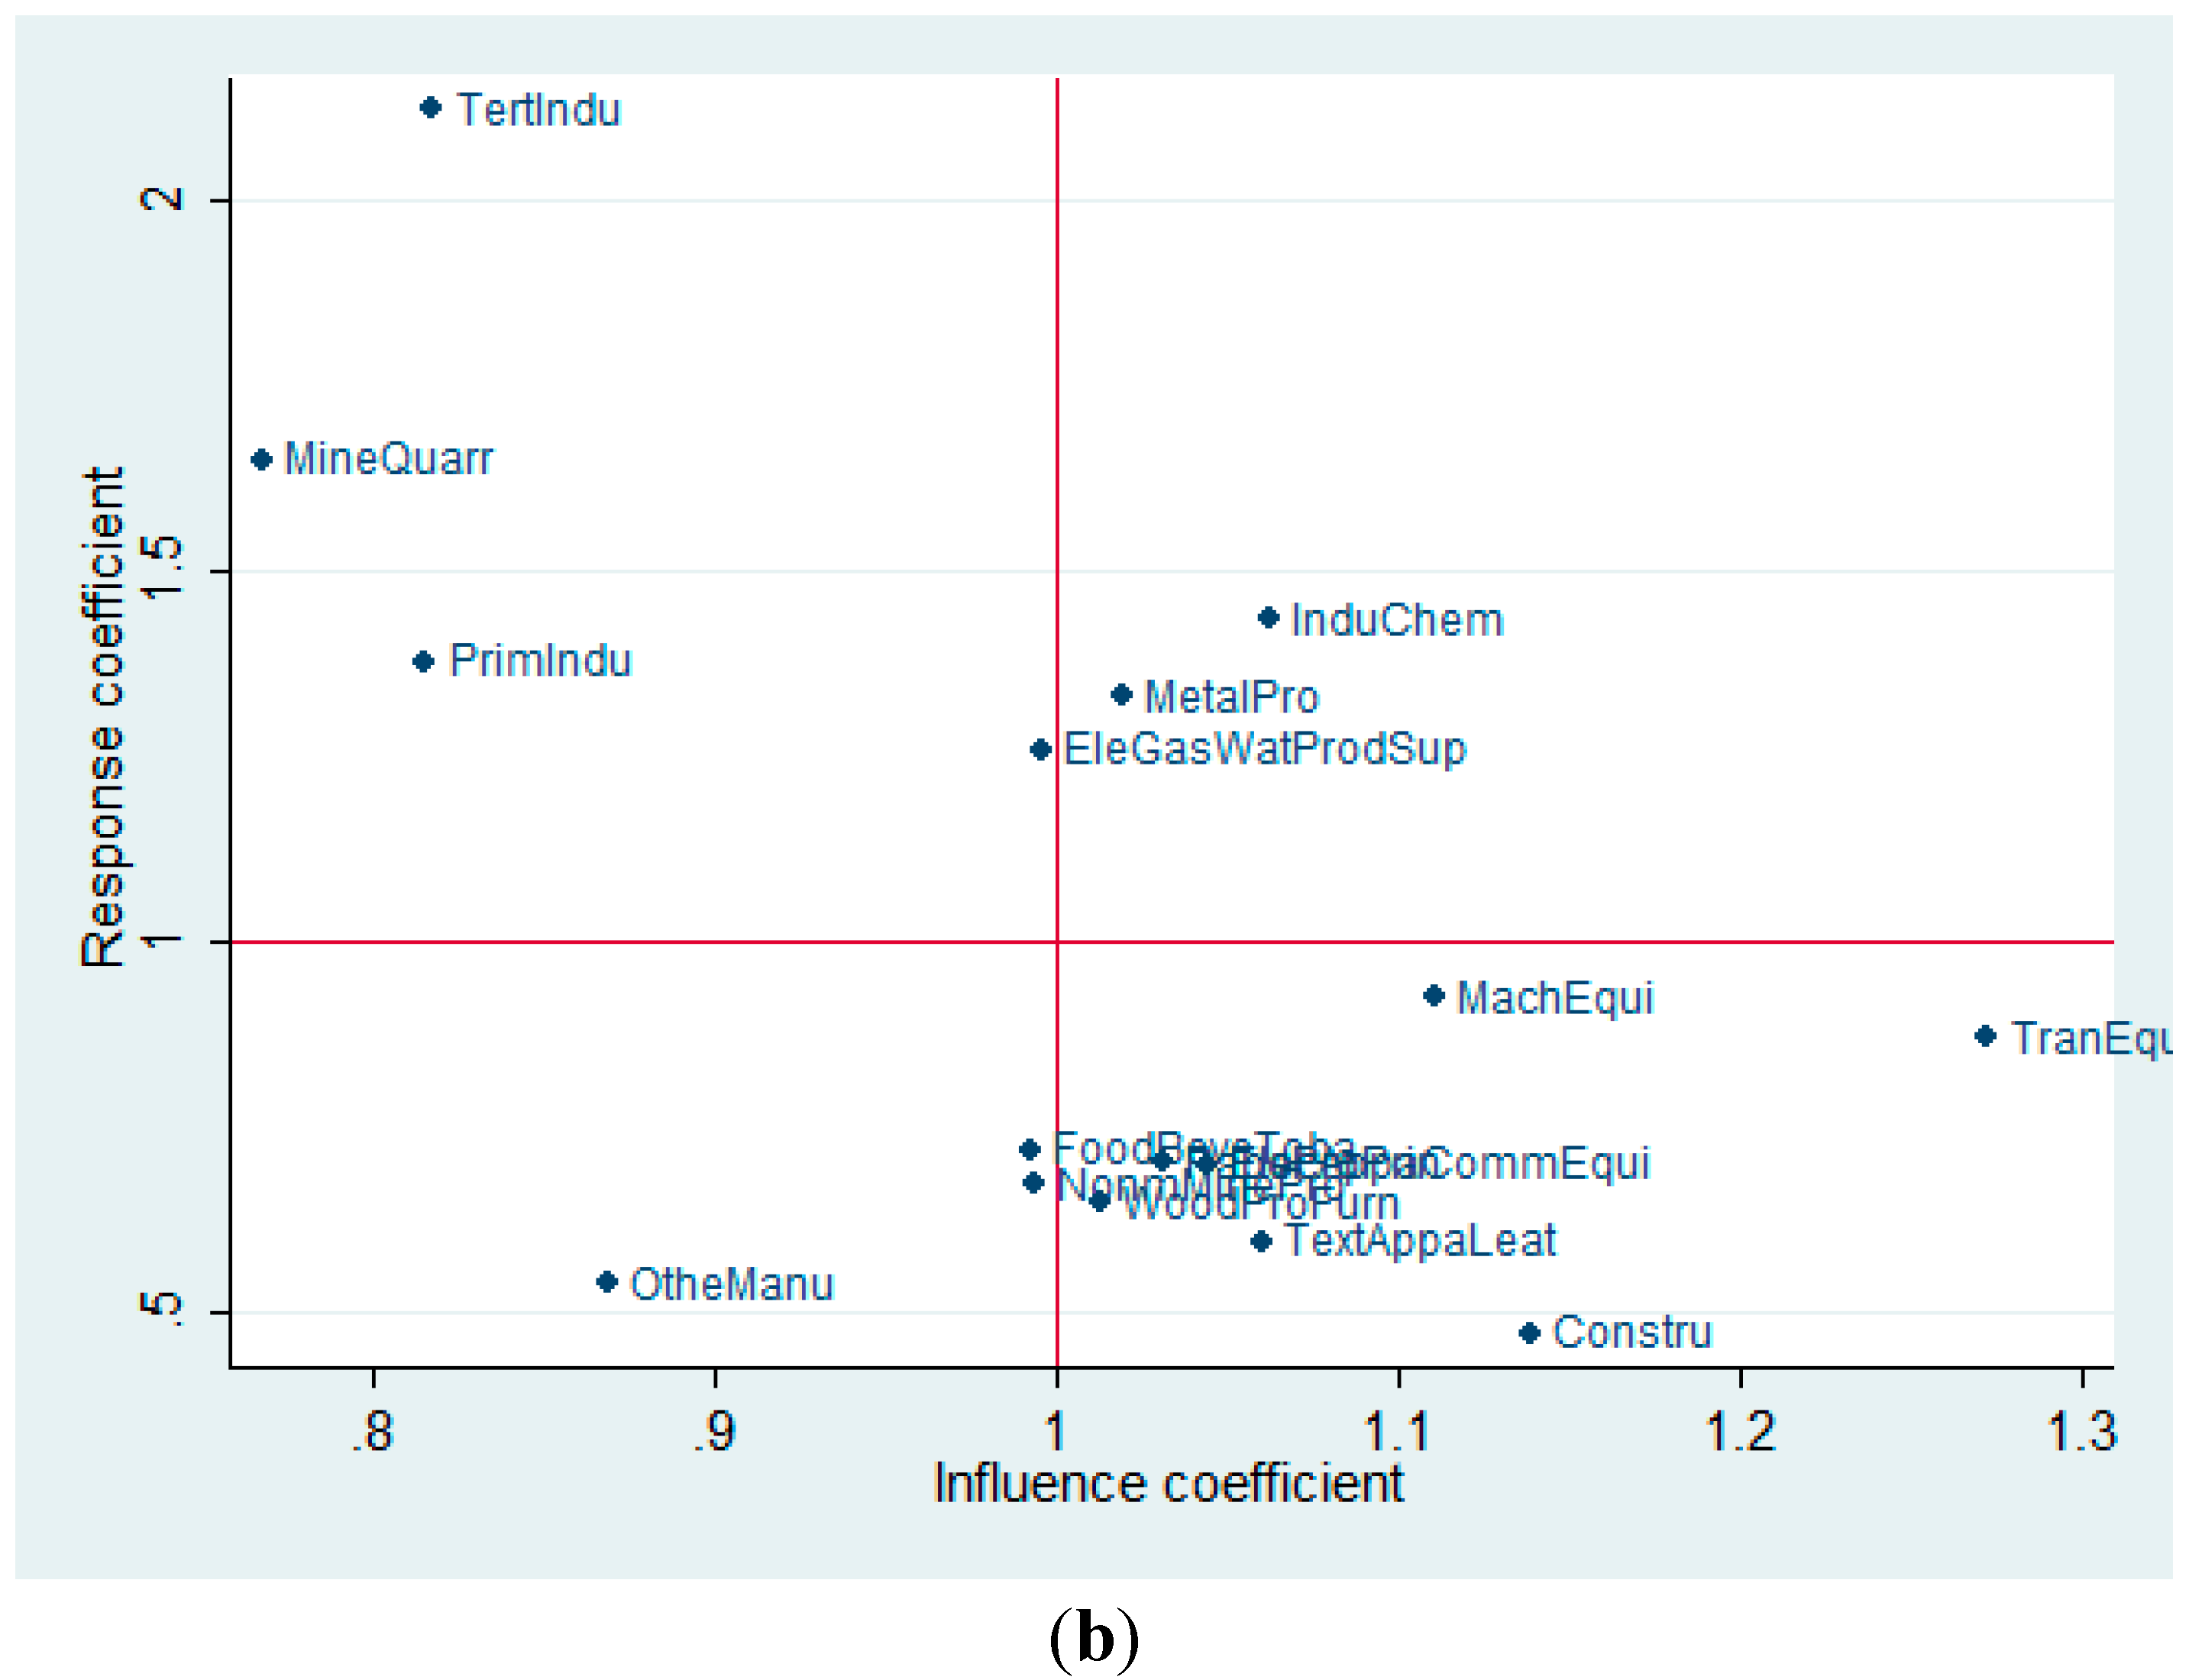
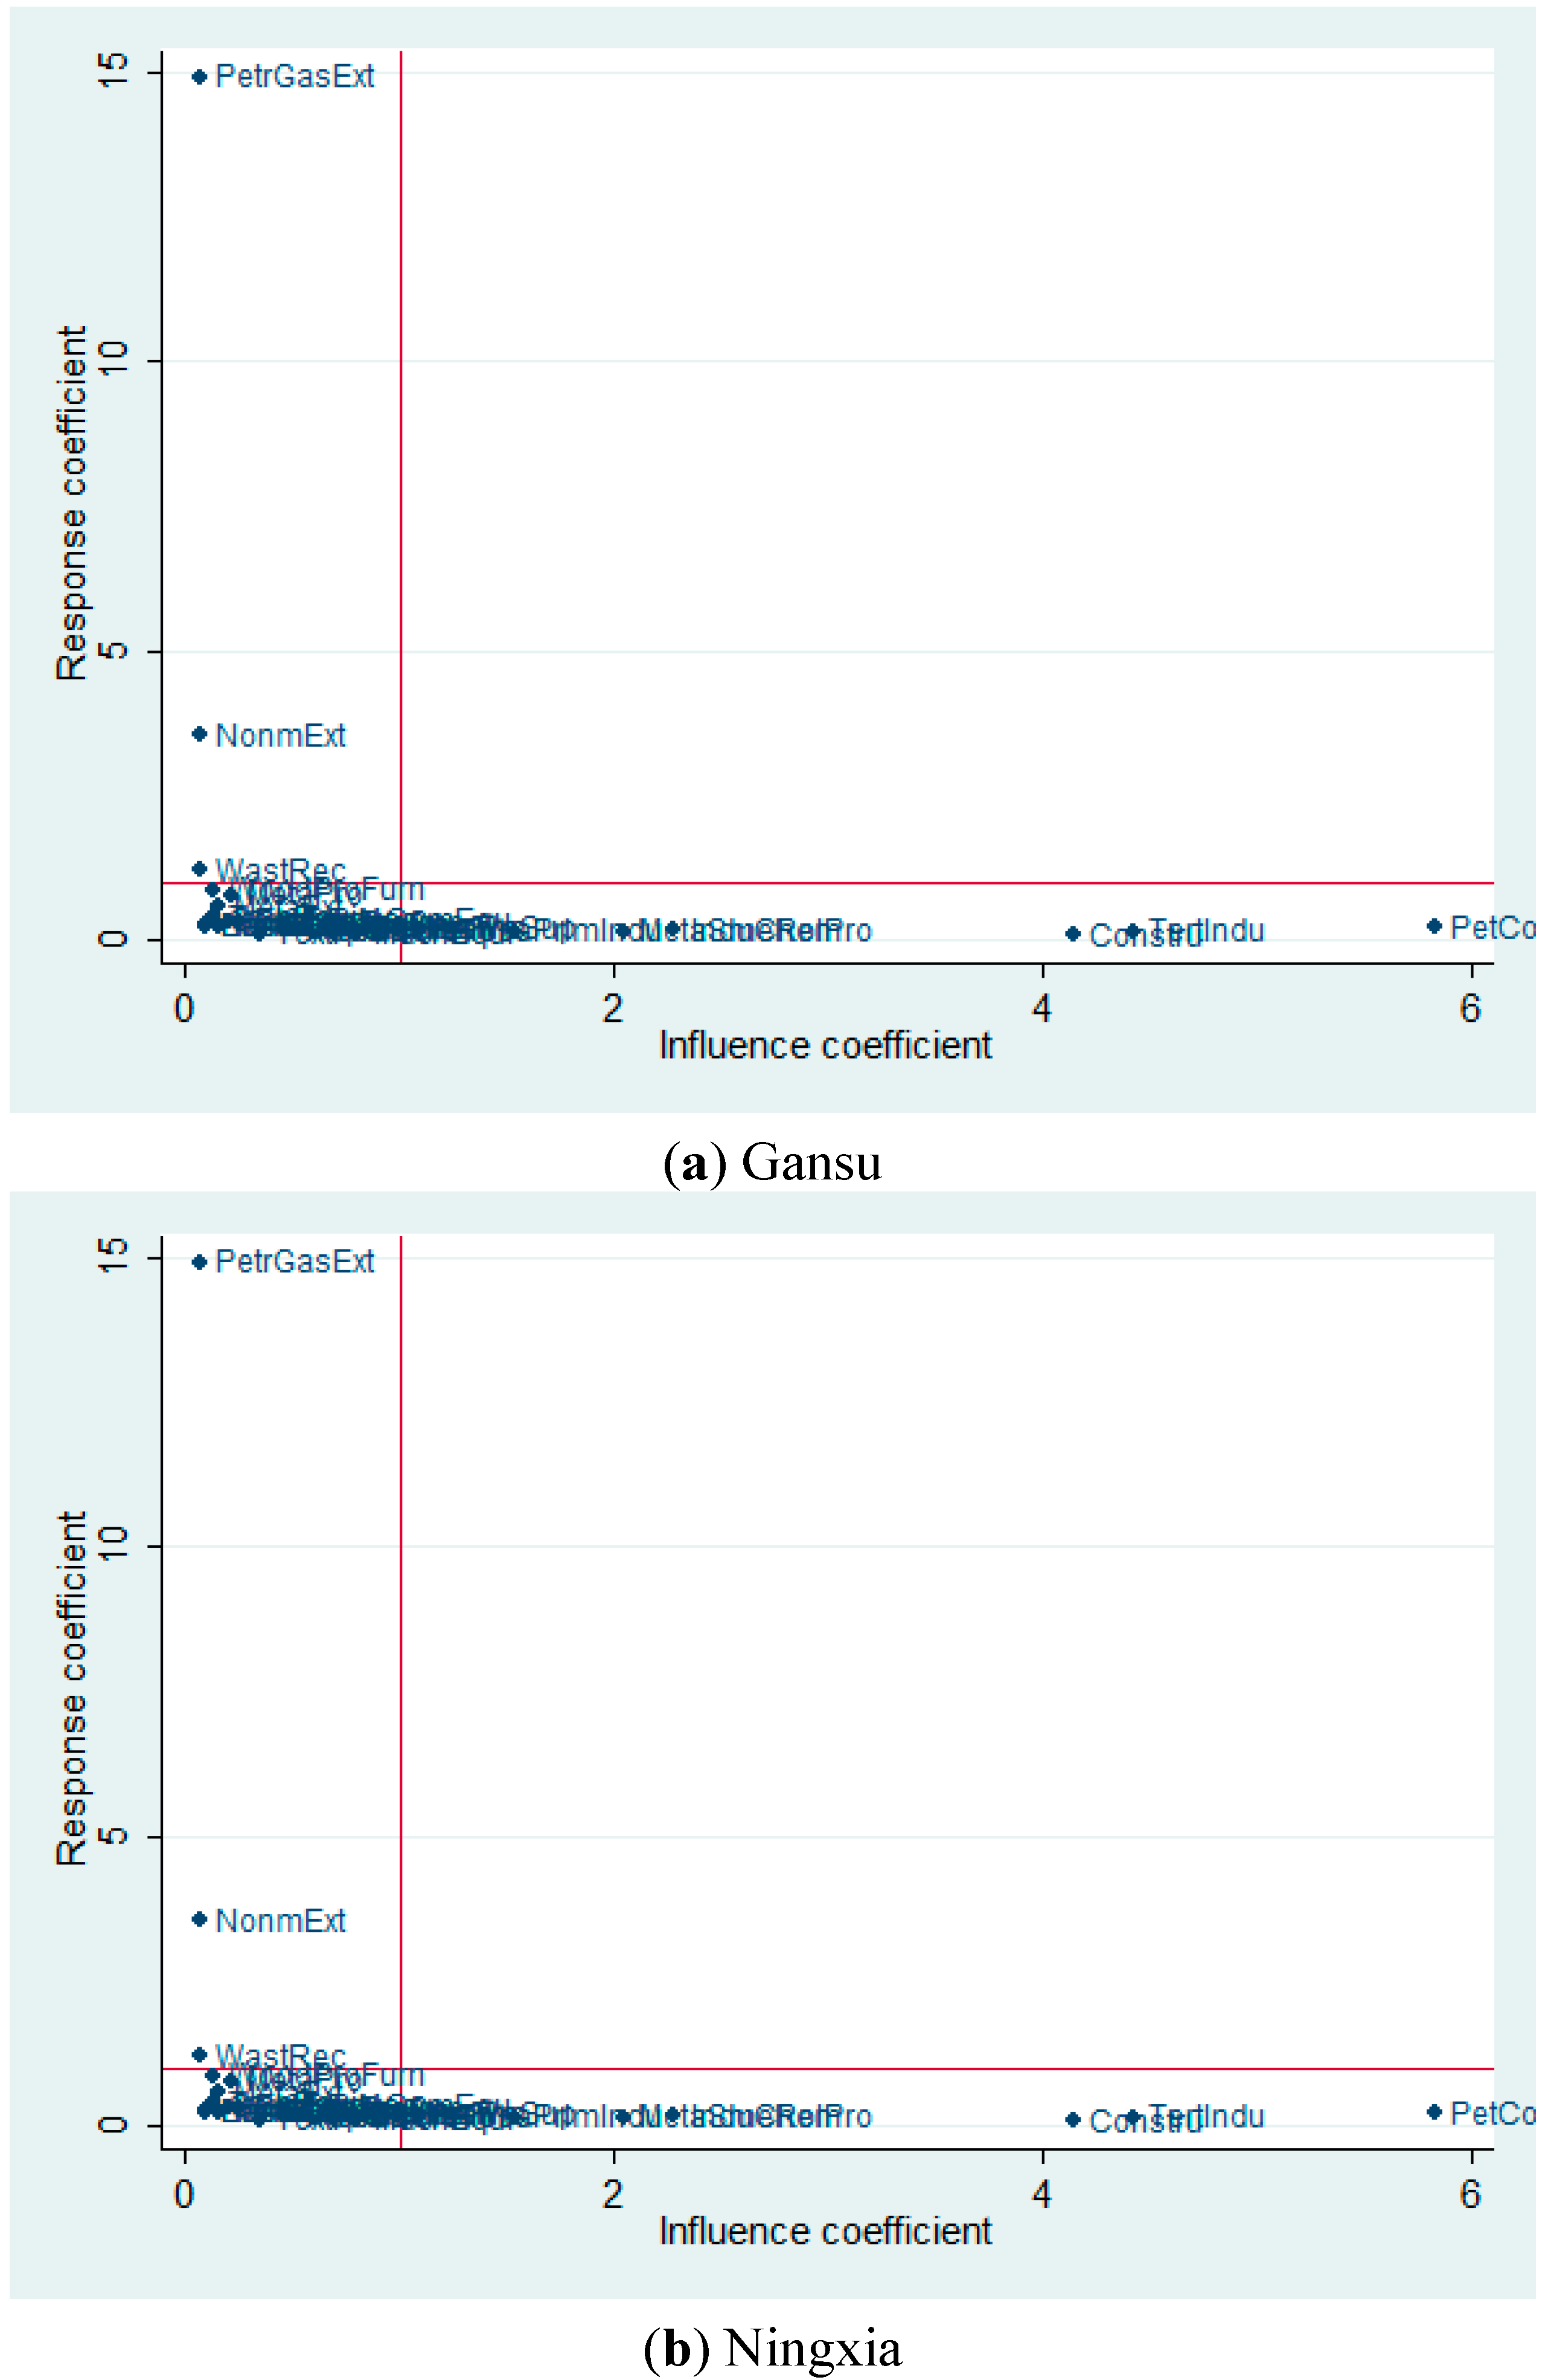
If we took the influence coefficients and response coefficients of one sector comprehensively into consideration, we can get the pulling effect and the sustaining effect of this sector on the whole national economy. There are four kinds of effects:
- (1)
> 1, > 1: This kind of sector is highly radioactive and crucial and has both a pulling and sustaining effect on the national economy. One example might be the construction sector.
- (2)
> 1, < 1: This kind of sector is highly radioactive and less conditional, which has a high pulling effect and a low sustaining effect. Examples might be the consumer and food sectors.
- (3)
< 1, > 1: This kind of sector is less radioactive and highly conditional, which has a high sustaining effect and little pulling effect. Those sectors are likely to be in the upstream link in the industrial chain, like electricity, coal, petroleum and steel sectors, etc.
- (4)
< 1, < 1: This kind of sector is less radioactive and conditional and has both a low sustaining and pulling effect. One example might be the science-education-culture-health sector.
Above is the I-O analysis model of northwest China that we built through the I-O table with the water withdrawal account, which we can use to analyze the mutual influence between the national economy increase and the water use efficiency of industry sectors and to research the input-output relationship between the gross output and gross demand of the macro-economy and the water use efficiency of industry sectors.


