Article

The Impact of Land Cover Change on Ecosystem Service Values in Urban Agglomerations along the Coast of the Bohai Rim, China

1
School of Geography, Beijing Normal University, Beijing 100875, China
2
Faculty of Geosciences and Environmental Engineering, Southwest Jiaotong University, Chengdu 610031, China
3
School of Business Pan-Asia, Yunnan Normal University, Kunming 650092, China
*
Author to whom correspondence should be addressed.
Sustainability 2015, 7(8), 10365-10387; https://doi.org/10.3390/su70810365
Submission received: 12 June 2015 / Revised: 27 July 2015 / Accepted: 29 July 2015 / Published: 5 August 2015
(This article belongs to the Section Environmental Sustainability and Applications)

Abstract

:
Local ecosystem services have been significantly affected by land cover changes associated with rapid urbanization in China. Based on the 2000 and 2010 land cover data products with 30-m resolution, we examined the similarities and differences in the impacts of land cover change on ecosystem service values (ESV) at three coastal urban agglomerations in China between 2000 and 2010 (Liaodong Peninsula (LP), Jing-Jin-Ji (JJJ) and Shandong Peninsula (SP)). A rapid evaluation method developed by Xie et al. (2008) was used to derive an ecosystem service value coefficient. The most significant change was an increase in artificial surfaces, due to urban expansion, which mainly occurred on cultivated land. The greatest loss in total ESV (2273 million Chinese Yuan) occurred in SP, due to the large decrease in wetland areas, because this service has the highest estimated coefficient. The second greatest loss in ESV (893 million Yuan) occurred in JJJ, due to the urban expansion of major cities. In contrast, ESV increased (72 million Yuan) in LP. This study demonstrates that urban expansion does not necessarily lead to a net decline in ESV. In conclusion, land use and land cover policymaking should consider the sustainability of ecosystem services in relation to economic growth.

1. Introduction

Ecosystems provide a variety of direct and indirect products and services for human survival, health and welfare [1], which form the foundation of human society [2,3,4]. The quality and quantity of provisions generated by ecosystem services depend on the structure, process and function of the surrounding natural ecosystem [5]. Yet, global population growth, economic development and urban expansion have placed pressure on ecosystems, resulting in their being substantially degraded, destroyed or transformed. As a result, the effectiveness of ecosystem services has been impeded at multiple scales. Studies on ecosystem services have become increasingly popular to evaluate environmental change, resource management and sustainable development, because these services incorporate society benefits [6]. Assessing the value of ecosystem services that influence human well-being by market price or non-market value is regarded as an important tool to promote the importance of ecosystems and encourage sustainable economic growth.
Costanza et al. [1] provided the first classification of the global biosphere into 16 types of ecosystems and 17 types of service functions, from which they estimated the ecosystem service values (ESV) for each category. Subsequently, Costanza et al. [7] updated their ecosystem service value coefficient table using current ESV units and land cover change estimates based on data collected between 1997 and 2011. These coefficient values have been widely applied in estimating ESV. Xie et al. [8] modified the coefficient values based on those of Costanza et al. [1] in 1997 to formulate an accurate ESV-per-hectare for the terrestrial ecosystems in China by surveying approximately 200 Chinese ecologists. The coefficient values were directly applied to several ecosystem service studies in China, in addition to being adjusted for the unique land cover types of China’s internal regions [9,10,11,12]. Most studies evaluating ESV in China have been primarily based on the method of Costanza et al. [1] and Xie et al. [8].
In the past five years, most studies have evaluated the ESV of one type of single [13,14] or whole ecosystem in relation to changes at global [15,16], national [17,18] and local [19,20] scales. Several studies have used land cover types as proxies for ecosystems, by matching the land cover types to equivalent biomes, because different biomes have different land cover benefit transfer values [21,22]. At large scales, land cover change represents one of the clearest and most informative indicators of ecosystem impacts at state- and province-level scales [23]. Consequently, several studies have focused on the relationship between ESV and land cover types to determine how land cover change affects the provision of ecosystem services [24,25]. These studies have validated that land cover affects ESV globally, especially in urbanized regions. For instance, land cover change in urban sites is detrimental for several ecosystems [26,27].
Human activities have an unavoidable impact on natural and semi-natural ecosystems in urban agglomerations. Examples of such activities include urban expansion, industrialization and economic growth. As rapid urbanization by the Chinese population continues [28,29], a large number of urban agglomerations have emerged. Urban agglomeration is a modern spatial pattern formed by functional connections between cities or metropolitan areas [30]. It has become the principal economic and urbanization unit for countries to participate in globalization. Unfortunately, some urban agglomerations have caused major changes to land cover due to urban expansion, leading to ecological damage, especially during the process of urbanization in China. Critics have warned that urban expansion has created a Chinese version of urban sprawl and the loss of natural ecosystems [31]. Indeed, a large proportion of land made up of natural ecosystems has been converted to artificial uses to meet the demands of housing, industry and commerce around the cities of China [32], particularly in economically-developed coastal urban agglomerations [33,34].
Our study focuses on the three urban agglomerations along the coast of the Bohai Rim, China. These cities were selected because increasingly noticeable and rapid changes in land cover have had important ramifications on coastal urban agglomerations [
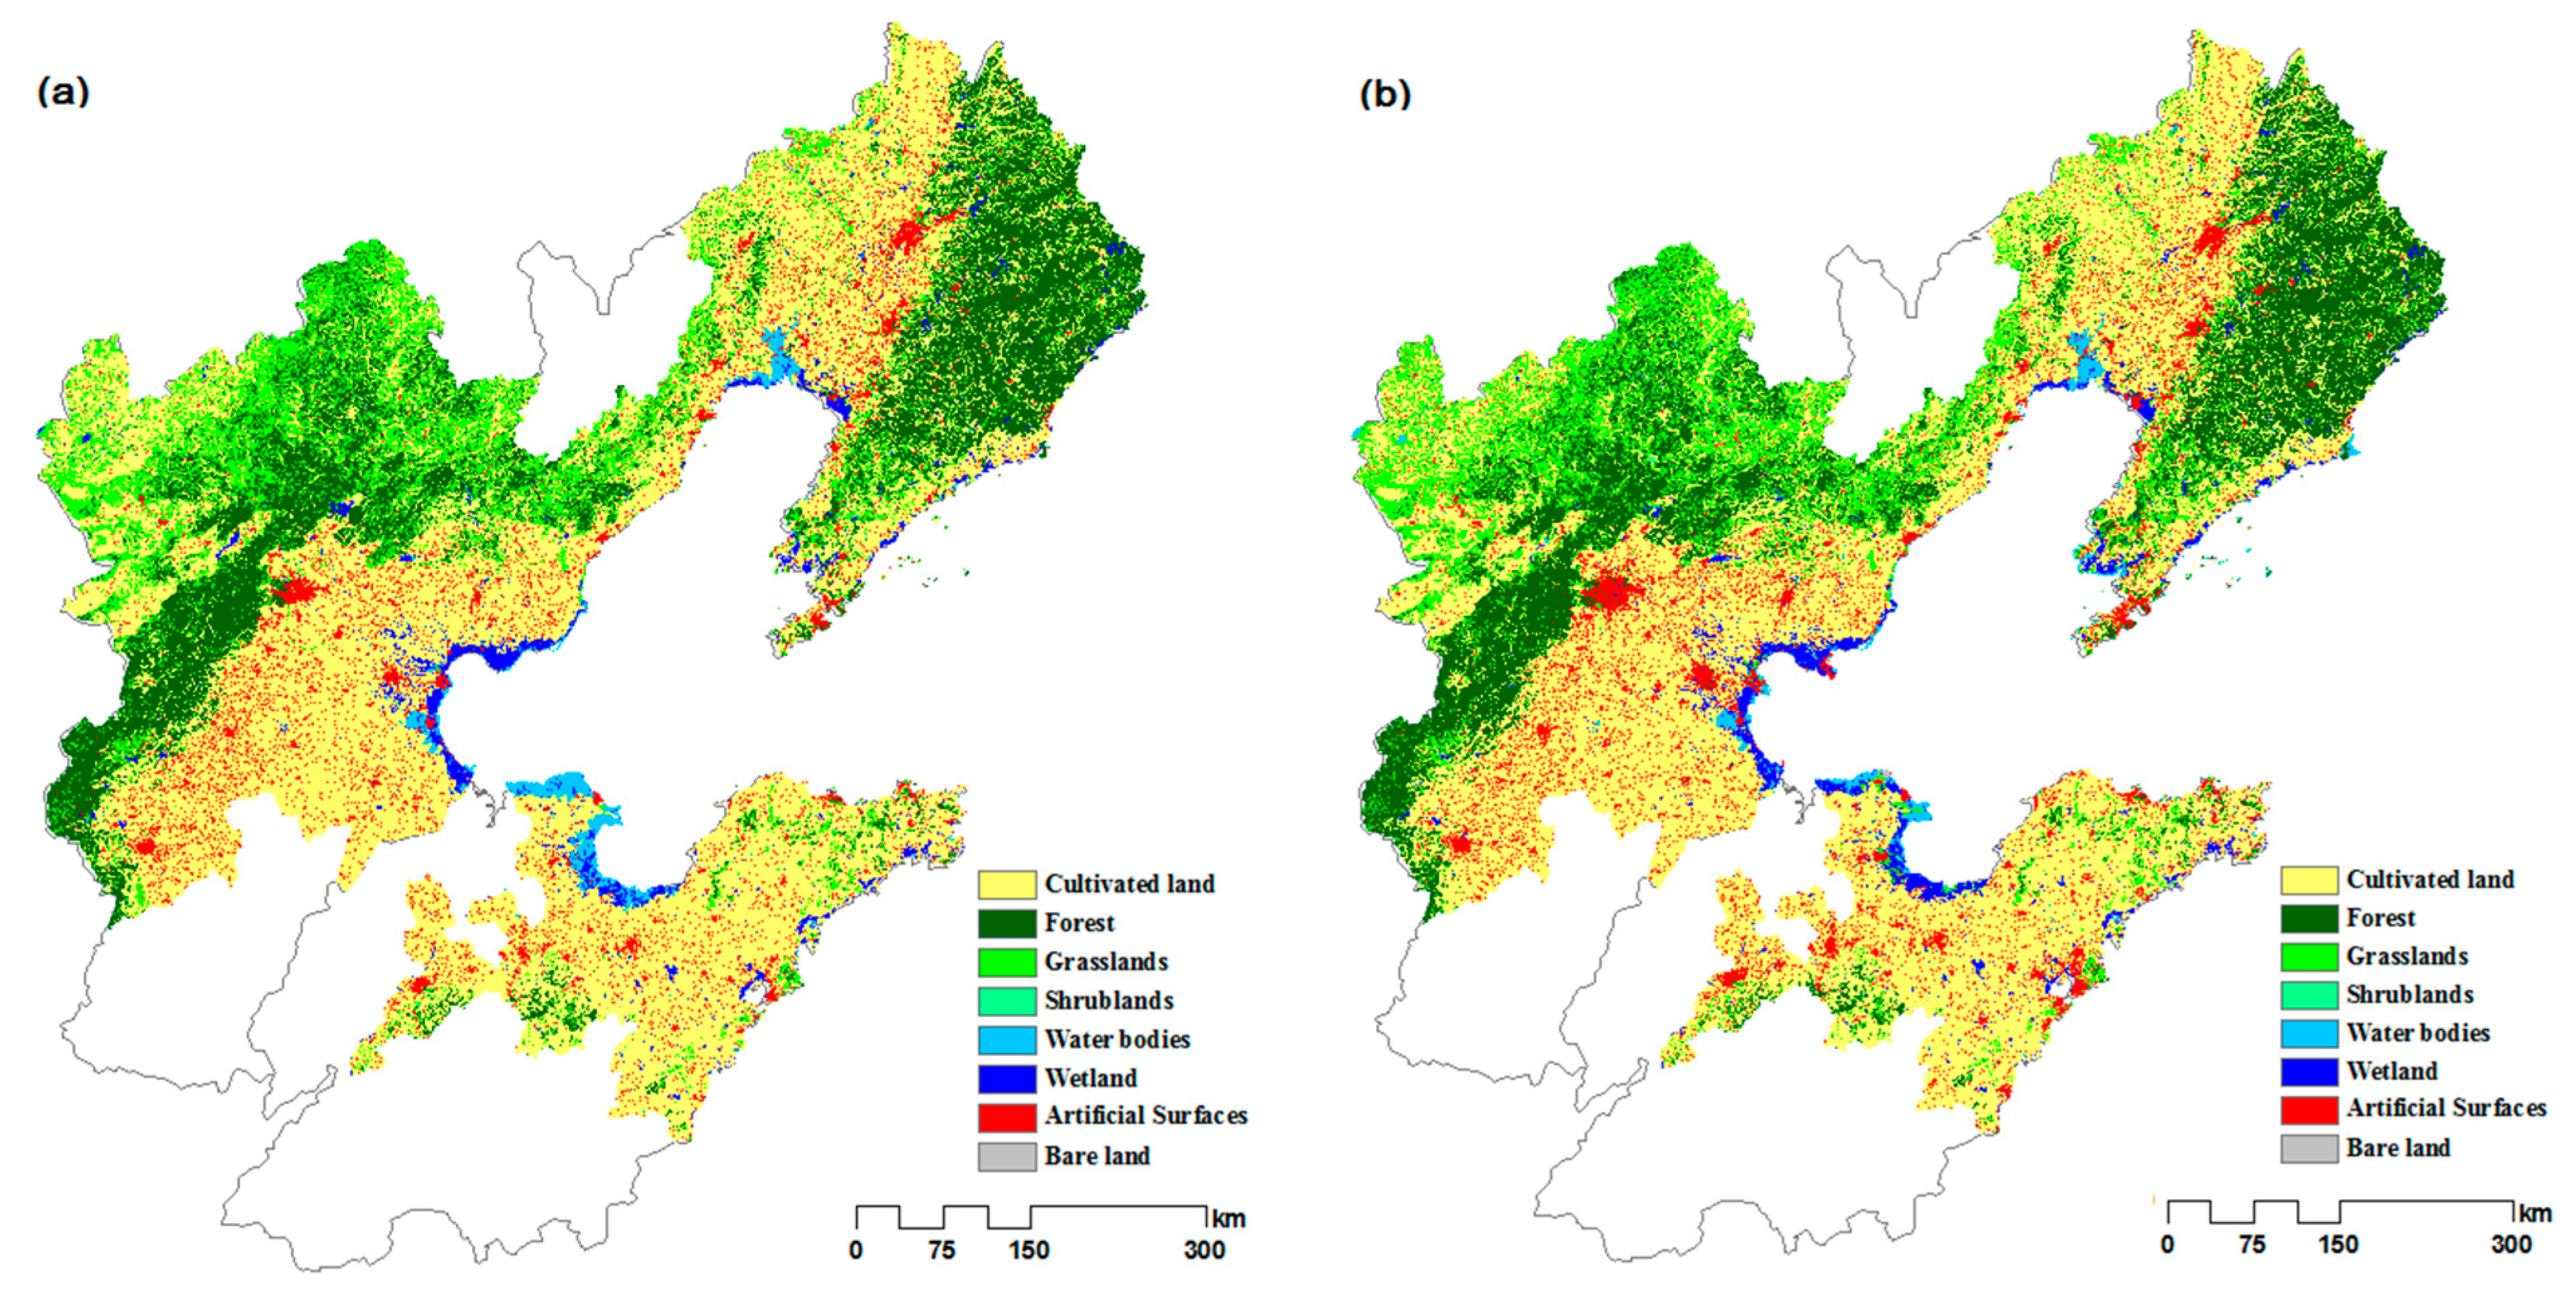
35]. The Bohai Rim is the third-largest economic zone in China, after the Yangtze River Delta and the Pearl River Delta. The three urban agglomerations of this study are affected by excessive land reclamation and natural resource exploitation, along with rapid urbanization. For example, groundwater was exploited excessively for domestic, industrial use and agriculture in the three agglomeration region, which have resulted in seriously short supply of water resources and affected the sustainability of the three study areas. All three urban agglomerations are of economic and ecological significance; however, differences exist in the characteristics of land cover change and associated ESV changes. However, few studies have investigated such differences among cities. We aimed to: (1) characterize and compare the change in land cover for these three coastal urban agglomerations from 2000 to 2010 in the context of rapid urbanization; (2) evaluate and compare changes in ESV caused by land cover changes; and (3) provide suggestions for policymaking to mitigate ESV loss by adjusting land cover composition and encouraging sustainable development of coastal urban agglomerations.

2. Materials and Method

2.1. Study Area

The Bohai Rim area is located in the northern part of China’s eastern coast (Figure 1). It is an important economic growth area because of its advantageous location and open economic environment. Consequently, this area also has one of the most important concentrations of industry and trade in China [36], in addition to quite high agricultural productivity. The coastal region of the Bohai Rim is a transitional environment between the terrestrial and marine ecosystem. Therefore, the area contains highly diverse ecosystems, including coastal wetlands, shoals, fishponds, saltpans, croplands, forests and grasslands. In the coastal urban agglomerations, rapid urban expansion has generated the occupation, pollution and overexploitation of natural resources. With the continued increase in human demand for space and resources, the cultivated land around the cities, in addition to the coastal and riparian wetlands, is being degraded and transformed by various human activities.
We selected three urban agglomerations along the coast of the Bohai Rim that had contrasting urban expansion and industrial activity; specifically, Liaodong Peninsula (LP), Jing-Jin-Ji (JJJ) and Shandong Peninsula (SP) (Figure 1, Table 1). LP is located in the Liaoning Province to the north of the Bohai Rim. This province was an important heavy industry hub of China and is currently under transformation pressure to a new stage of development. JJJ is located to the west of the Bohai Rim. This area includes Beijing, Tianjin and eight municipalities in Hebei Province. JJJ is dominated by commercial and cultural activities, particularly in Beijing and Tianjin. This area has had the greatest economic growth out of the three study sites. SP is located in Shandong Province to the south of the Bohai Rim. This area encompasses eight municipalities in the coastal area of Shandong Province. It has primarily been subject to urban expansion and includes large urban infrastructure.
Figure 1. Location of the three urban agglomerations along the coast of the Bohai Rim: Liaodong Peninsula, Jing-Jin-Ji and Shandong Peninsula.
Sustainability 07 10365 g001
Table 1. Location, natural conditions and social features of the three urban agglomerations. LP, Liaodong Peninsula; JJJ, Jing-Jin-Ji; SP, Shandong Peninsula.
LPJJJSP
Latitude38°43′N to 43°29′N36°01′N to 42°37′N35°5′N to 38°9′N
Longitude119°12′E to 125°47′E113°04′E to 119°53′E116°11′E to 122°41′E
Area (km2)127,200185,00073,000
Climatemonsoon climate of warm temperate zonemonsoon climate of warm temperate zonemonsoon climate of warm temperate zone and mid-temperate zone
RiversLiao, Dayang, Yingna, Biliu, DashaHaihe, LuanheYellow river, Jiaolai, Wei, Dagu
Major citiesShenyang, DalianBeijing, TianjinJinan, Qingdao
Main activitiesheavy industry, commerce, fishery, tourismcommerce, culture, industry, agriculturefishery, salt industry, aquaculture industry, agriculture, tourism
Population density (per square kilometer)307401553
GDP/per capita (USD)11,739.19525.911,457.0
National nature reserveYYY

2.2. Land Cover Datasets

The land cover datasets for LP, JJJ and SP in 2000 and 2010 were derived from China’s Global Land Cover data product with a resolution of 30 m (GLC30) [37]. The datasets contain 10 land cover types, seven of which were used for the study. The land cover types included cultivated land, forest, grassland, wetland, water bodies, artificial surfaces and bare land (see Table 2 for full definitions).
Table 2. Explanation of land cover type.
Land Cover TypeDefinition
Cultivated landSingle-cropping wheat, wheat/corn, single-cropping rice, double-cropping rice, corn, greenhouses, pasture
ForestEvergreen broadleaf, deciduous broadleaf, evergreen needleleaf, deciduous needle leaf, mixed forests
GrasslandNon-Arctic C3 grasslands, C4 grasslands, scrub grasslands
WetlandMarsh, forested wetlands, other wetlands
Water bodiesLakes, reservoirs/ponds and rivers
Artificial surfacesImpervious area
Bare landSalt and alkali, sand, gravel, rock, temporally-bare croplands, biological crust
The average overall accuracy of classification over the study period was 79.6% and 83.3% in 2000 and 2010, respectively. The kappa coefficients were 0.78 and 0.81 in 2000 and 2010, respectively. The analysis on changes to land cover type were performed using ArcGIS version 10.0 software. A cross-tabulation detection method was employed to quantify the change in land cover type. A land cover transfer matrix was produced by two-raster layer stacking in each study area between 2000 and 2010. The proportional rate of change for each land cover type in the three study areas was calculated from Equation (1):
R = ( A 2010 A 2000 ) / A 2000 × 100
where R represents the proportional change in a given land cover type and A2000 and A2010 represent the area of the given land cover type in the years of 2000 and 2010.
In addition to the land cover datasets, a 1:4,000,000 Chinese administrative map was used as a reference. The location and extent of the three urban agglomerations was derived from this map based on the methods of Fang et al. [36]. In addition, because reclaimed land is changing the coastline, most of the peripheral buildings that extended to the Bohai Rim in 2010 were treated as coastline in 2000 and 2010. Figure 2 presents the final land cover maps.
Figure 2. Land cover maps of the three urban agglomerations in 2000 (a) and 2010 (b).
Sustainability 07 10365 g002

2.3. Assessment of Ecosystem Service Values

To calculate the mean economic value of the ecosystem services, we used the market value of ecosystem services per unit area developed for application in China by Xie et al. [8]. Table A1 provides the classification and definition of each of the ecosystem services. In this method, cropland is the reference value for all ecosystems. Although the method has some potential conceptual and empirical problems, it has been widely used to value China’s ecosystem services [38,39]. For the purpose of broadly analyzing the impact of land cover changes on ESV in the three study areas, this valuation method is still considered useful. The assessment of ESV across the three urban agglomerations was computed as follows:
E S V = k f A k × V C k f
E S V f = k A k × V C k f
E S V k = f A k × V C k f
where ESV is the total ecosystem service value, ESVf, is the value of ecosystem service function type “f” and ESVk is the ecosystem service value of land cover category “k”. Ak is the area (ha) of land cover “k”; VCkf is the value coefficient for land cover category “k” and ecosystem service function type “f”.
Not all of the land cover types in the study areas were assigned a value using this method. The value coefficient for artificial surfaces is not defined in the scheme of Xie et al. [8], because perfect matches are not available for the biomes and the land cover types in every case provided by Xie et al. [8]. It is not yet possible to determine the value of urban ecosystem services accurately at a global or national level, with smaller scales being recommended (e.g., city level). Because this study was conducted at a regional scale, ecosystem services and their values for artificial surfaces were considered as zero. Table 3 provides an excerpt of the ecosystem services and their market values in Chinese Yuan (CNY), as proposed by Xie et al. [8].
Table 3. Excerpt of ecosystem service value per unit area (Yuan ha−1) of different land cover types in China as proposed by Xie et al. (2008) [8].
CategorySub-CategoryWetlandWater BodiesForestGrasslandCultivated LandBare LandTotal
ProvisioningFood production16223814819344991199
Raw materials production1081571338162175181958
RegulatingGas regulation10822291940674323274275
Climate regulation608592518287014365810,033
Hydrological regulation6036843018376833463117,362
Waste treatment6467666977259362411715,242
SupportingSoil formation and conservation89418418051006660764626
Biodiversity maintenance1657154020258404581806701
CulturalProviding aesthetic values21061994934391761085609
Total 24,59720,36712,6295241354862467,006
To describe the spatial heterogeneity of ESV visually, 1 km × 1 km grid cells were defined for the study areas. We first integrated the land cover images with the empty basic grid cells to compute the area of each land cover type. We then calculated variation in ESV for each grid cell and mapped the results.

3. Results

3.1. Change in Land Cover

To understand how land cover is changing in the three urban agglomerations, we calculated the change in area of the different land cover types (Figure 3) and the percentage change (Figure 4) according to Equation (1) between 2000 and 2010. We detected a significant change in land cover from 2000 to 2010 in all three urban agglomerations (Figure 5), which was characterized by an increase in artificial surfaces and a decrease in cultivated land. Thus, cultivated land was lost due to pressure for an increase in artificial surfaces.
Figure 3. Change in the area of the land cover types in the three urban agglomerations between 2000 and 2010.
Sustainability 07 10365 g003
Figure 4. Rate of change in area of the land cover types in the three urban agglomerations between 2000 and 2010.
Sustainability 07 10365 g004
Figure 5. Examples of land cover transitions in LP, JJJ and SP. Left and right columns represent the years 2000 and 2010, respectively. (a) Wetlands in LP (wetland to cultivated land); (b) urban expansion in Beijing, JJJ (cultivated land to artificial surfaces); (c) wetland degradation in Laizhou Bay, SP (wetland to water bodies). Data source: GlobeLand30 [37].
Sustainability 07 10365 g005
There was a net increase in artificial surfaces and a large reduction in cultivated land in LP. The artificial surfaces of urban areas increased by 8.3% (68,199 ha), from 820,003 ha in 2000 to 888,202 ha in 2010. In contrast, cultivated land decreased by 90,446 ha. Wetlands, which are one of the most important ecosystems for regulating services, decreased by 12.3% over the 10-year period. Forest and grassland increased by 19,943 ha and 30,037 ha over the study period, respectively. The transition matrix reveals that 100,823 ha (1.6%) of cultivated land converted to artificial surfaces, mainly involving the creation of construction from the urban-rural fringe; while a large area (65,740 ha, 60,267 ha and 12,648 ha, respectively) of forest, grassland and water bodies were transformed into cultivated land, respectively (Table A2).
A similar trend in land cover change was detected in JJJ compared to LP. JJJ had the largest changes in cultivated land, artificial surfaces, forest and grassland cover compared to the other two areas. The artificial surfaces expanded very quickly, with an increase of 285,960 ha, representing a growth rate of 24.3%. In contrast, cultivated land decreased from 8,915,849 ha total land area to 8,573,052 ha over the 10-year period. However, forest and grassland increased by 0.9% (37,560 ha) and 1.7% (64,022 ha), respectively, during the 10-year period. The transition matrix showed that artificial surfaces primarily increased at the expense of cultivated land (Table A3). This result demonstrates the urbanization trend, particularly in the peripheral area around the major cities and the marine reclamation area in the coastal region.
Out of all three urban agglomerations, the greatest loss in wetland cover was detected in SP, at a rate of 66.7% (180,473 ha) (Table A4). A large percentage of wetlands (73,083 ha, representing 27% of total land area) was converted to water bodies for aquaculture and saltpans at the interface between seawater and land in the Laizhou Bay. SP also had a large reduction in cultivated land and a significant increase in artificial surfaces over the 10-year period (Figure 3). SP had the highest rate of change in land cover, with the exception of cultivated land, for all three urban agglomerations (Figure 4). The expansion of urban areas occurred at the expense of cultivated land and wetlands in SP, which shrank by 221,472 ha and 11,493 ha, respectively (Table A4).

3.2. Estimation of Change in Ecosystem Service Values

Using the estimated change in the size of each land cover type, together with the ESV coefficients reported by Xie et al. (2008) [8] (Table 2), we calculated the total ESV and its variation according to Equation (2) for 2000 and 2010 (Figure 6 and Figure 7). Based on Equations (3) and (4), the variation in the values was calculated between the two years for each ecosystem service category and each land cover type in our study areas (Figure 8, Figure 9, Figure 10 and Figure 11, Table A5, Table A6 and Table A7). We found that forest produced the largest proportion of the total ESV in LP and JJJ (57% and 46%, respectively). This result indicates that forests are important in these two urban agglomerations. Unlike LP and JJJ, cultivated land was the primary land cover type for ESV in SP.
Between 2000 and 2010, the total ESV in LP slightly increased from 86,657 million Yuan in 2000 to 86,729 million Yuan in 2010(Figure 6), with a net increase of 72 million Yuan (Figure 7). There was an increase in almost all ecosystem services in LP, except food production (Figure 8a). Hydrological regulation was the dominant function and had the largest increase in LP. The net ESV gains from increased forest, grassland and water body coverage were 252 million Yuan, 158 million Yuan and 246.2 million Yuan, respectively. These gains were higher than the losses caused by a decrease in cultivated land and wetland, explaining the increased ESV increased in in LP (Figure 10a).
Figure 6. Total value of ecosystem services in LP, JJJ and SP in 2000 and 2010.
Sustainability 07 10365 g006
Figure 7. Changes in the total ecosystem service value in LP, JJJ and SP in 2000−2010.
Sustainability 07 10365 g007
Figure 8. Value of ecosystem service category (ESVf) in LP (a), JJJ (b) and SP (c) in 2000 and 2010.
Sustainability 07 10365 g008aSustainability 07 10365 g008b
Figure 9. Changes in the value of the ecosystem service category (ESVf) in 2000−2010.
Sustainability 07 10365 g009
Figure 10. Value of land cover types (ESVk) in LP (a); JJJ (b) and SP (c) in 2000 and 2010.
Sustainability 07 10365 g010
Figure 11. Changes in value of land cover types (ESVk) in 2000−2010.
Sustainability 07 10365 g011
In contrast to LP, the total ESV of JJJ significantly declined over the 10-year period, with a net decrease of 893 million Yuan (Figure 7). All of the ecosystem service categories decreased in JJJ, except for a minor gain in landscape aesthetics. The decline was caused by a major decrease in the ESV of cultivated land (Figure 10a), which caused 1216 million Yuan in ESV losses. During the study period, the largest decline in cultivated land occurred in JJJ, most of which was converted to artificial surfaces for urban expansion. The coefficient value of the ecosystem services for artificial surfaces was considered to be zero for the purposes of our study; therefore, the transition yielded a relatively high contribution to ESV losses. There was only a minor decrease in ESV for wetland and water bodies, because their areas did not change much in JJJ.
Similar significant losses in ESV were detected for SP, like JJJ. Total ESV declined from 35,674 million Yuan in 2000 to 33,402 million Yuan in 2010 (Figure 6), with a decrease of 2273 million Yuan (Figure 7). This decline was 2.5-times greater than that recorded in JJJ. All of the ecosystem service categories were subject to losses in ESV (Figure 8c). The climate regulation function value decreased the most (1006 million Yuan), primarily due to the large decline in wetland ESV (4439 million Yuan), with a very high coefficient value. Although there was a major increase in water bodies (114,409 ha), this contribution towards improving ESV could not compensate the losses caused by the decrease in wetlands, which was responsible for the decrease in total ESV in SP (Figure 10c).
Overall, land cover change from 2000 to 2010 resulted in a net change in ESV in all three urban agglomerations. LP showed minor gains in total ESV, while, JJJ showed significant ESV losses because of the transition from cultivated land to artificial surface. SP showed the greatest ESV losses, mainly because of the conversion of wetlands, which are very valuable ecosystems (in terms of the estimated coefficient in this study), to water bodies and artificial surfaces with relatively low and zero estimated coefficient values.

3.3. Spatial Distribution of the Change in Ecosystem Service Values

Based on the grid cells, we obtained the spatial distribution in the variation of total ESV change for LP, JJJ and SP between 2000 and 2010 (Figure 12). This confirmed that the coastal regions and the urban periphery had more ESV losses than other areas in the three study areas in general. The major decline in ESV in the hinterlands was mainly caused by cultivated land being replaced with artificial surfaces in all three study areas, particularly on the periphery of Beijing and Tianjin in JJJ (Figure 12b). ESV loss was caused by coastal wetlands being converted to artificial surfaces with low service levels in Caofeidian District and New Binhai District of Tianjin in JJJ. However, the large loss of ESV in the coastal areas of Laizhou Bay in SP (Figure 12c) was caused by coastal wetlands being converted to emerging artificial water bodies (saltpans and aquaculture), with lower ESV coefficients.
Figure 12. Spatial distribution in the variation of total ESV in LP (a); JJJ (b) and SP (c) between 2000 and 2010.
Sustainability 07 10365 g012

4. Discussion

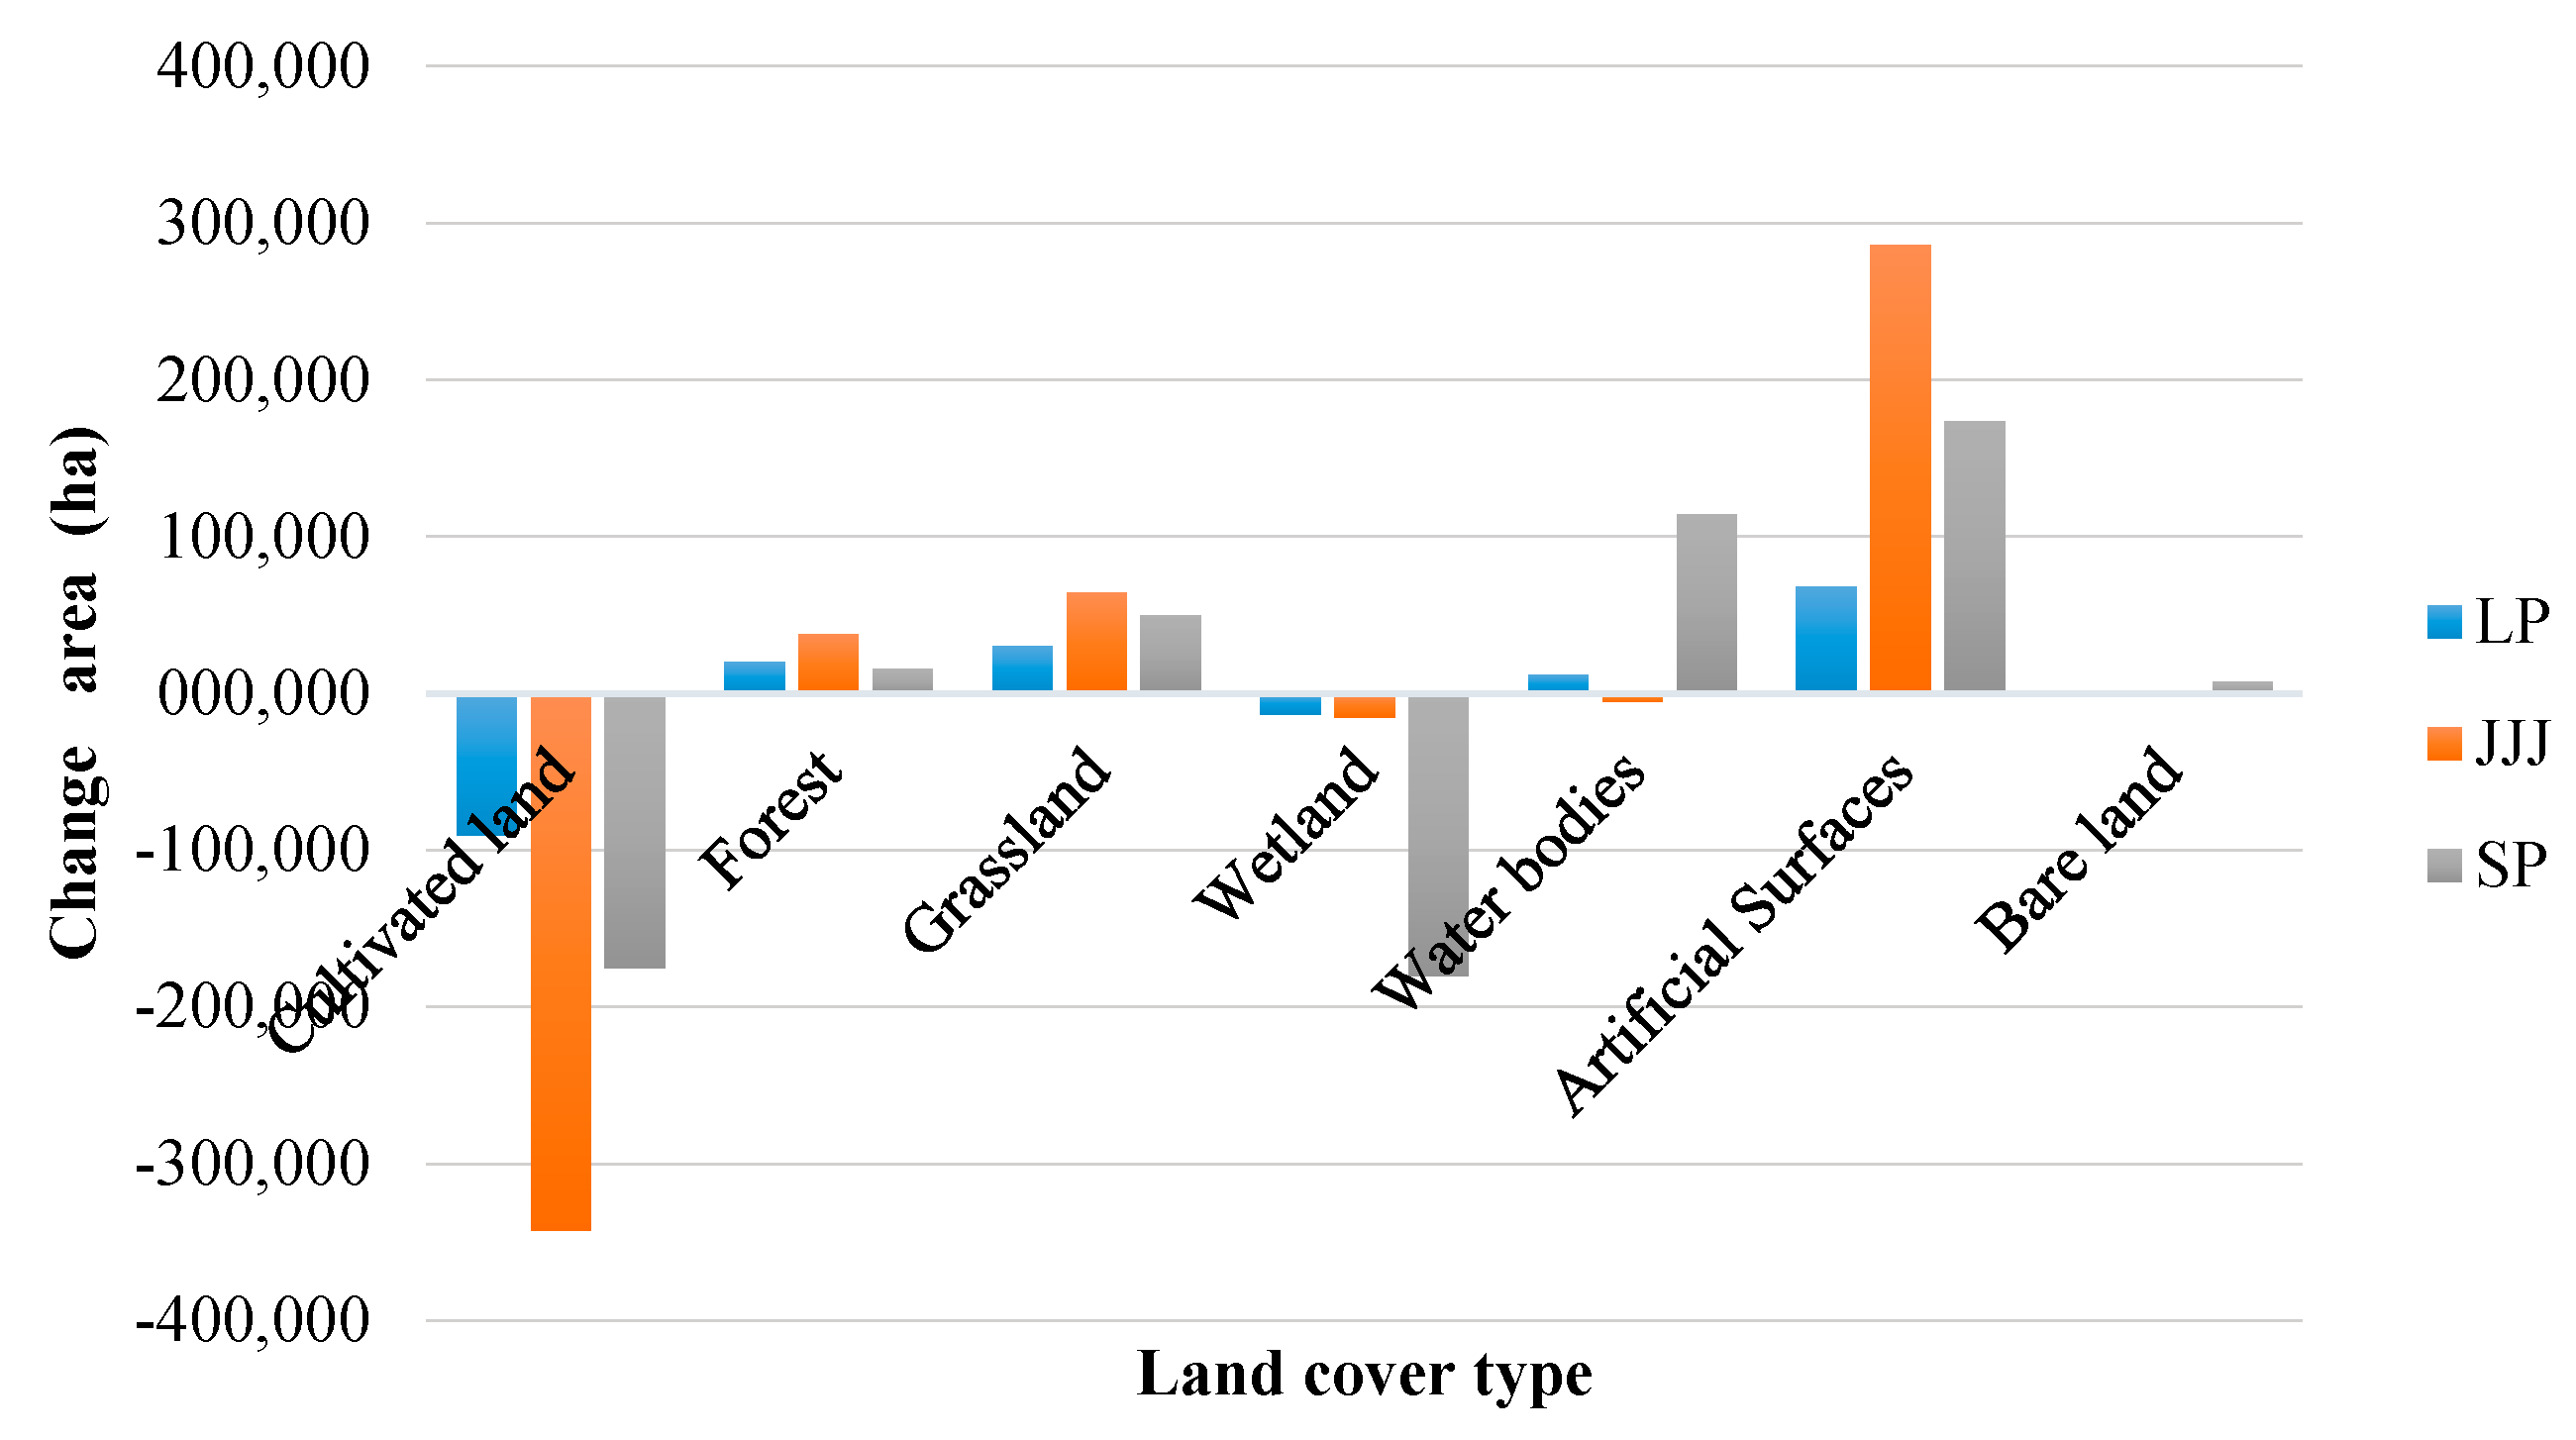
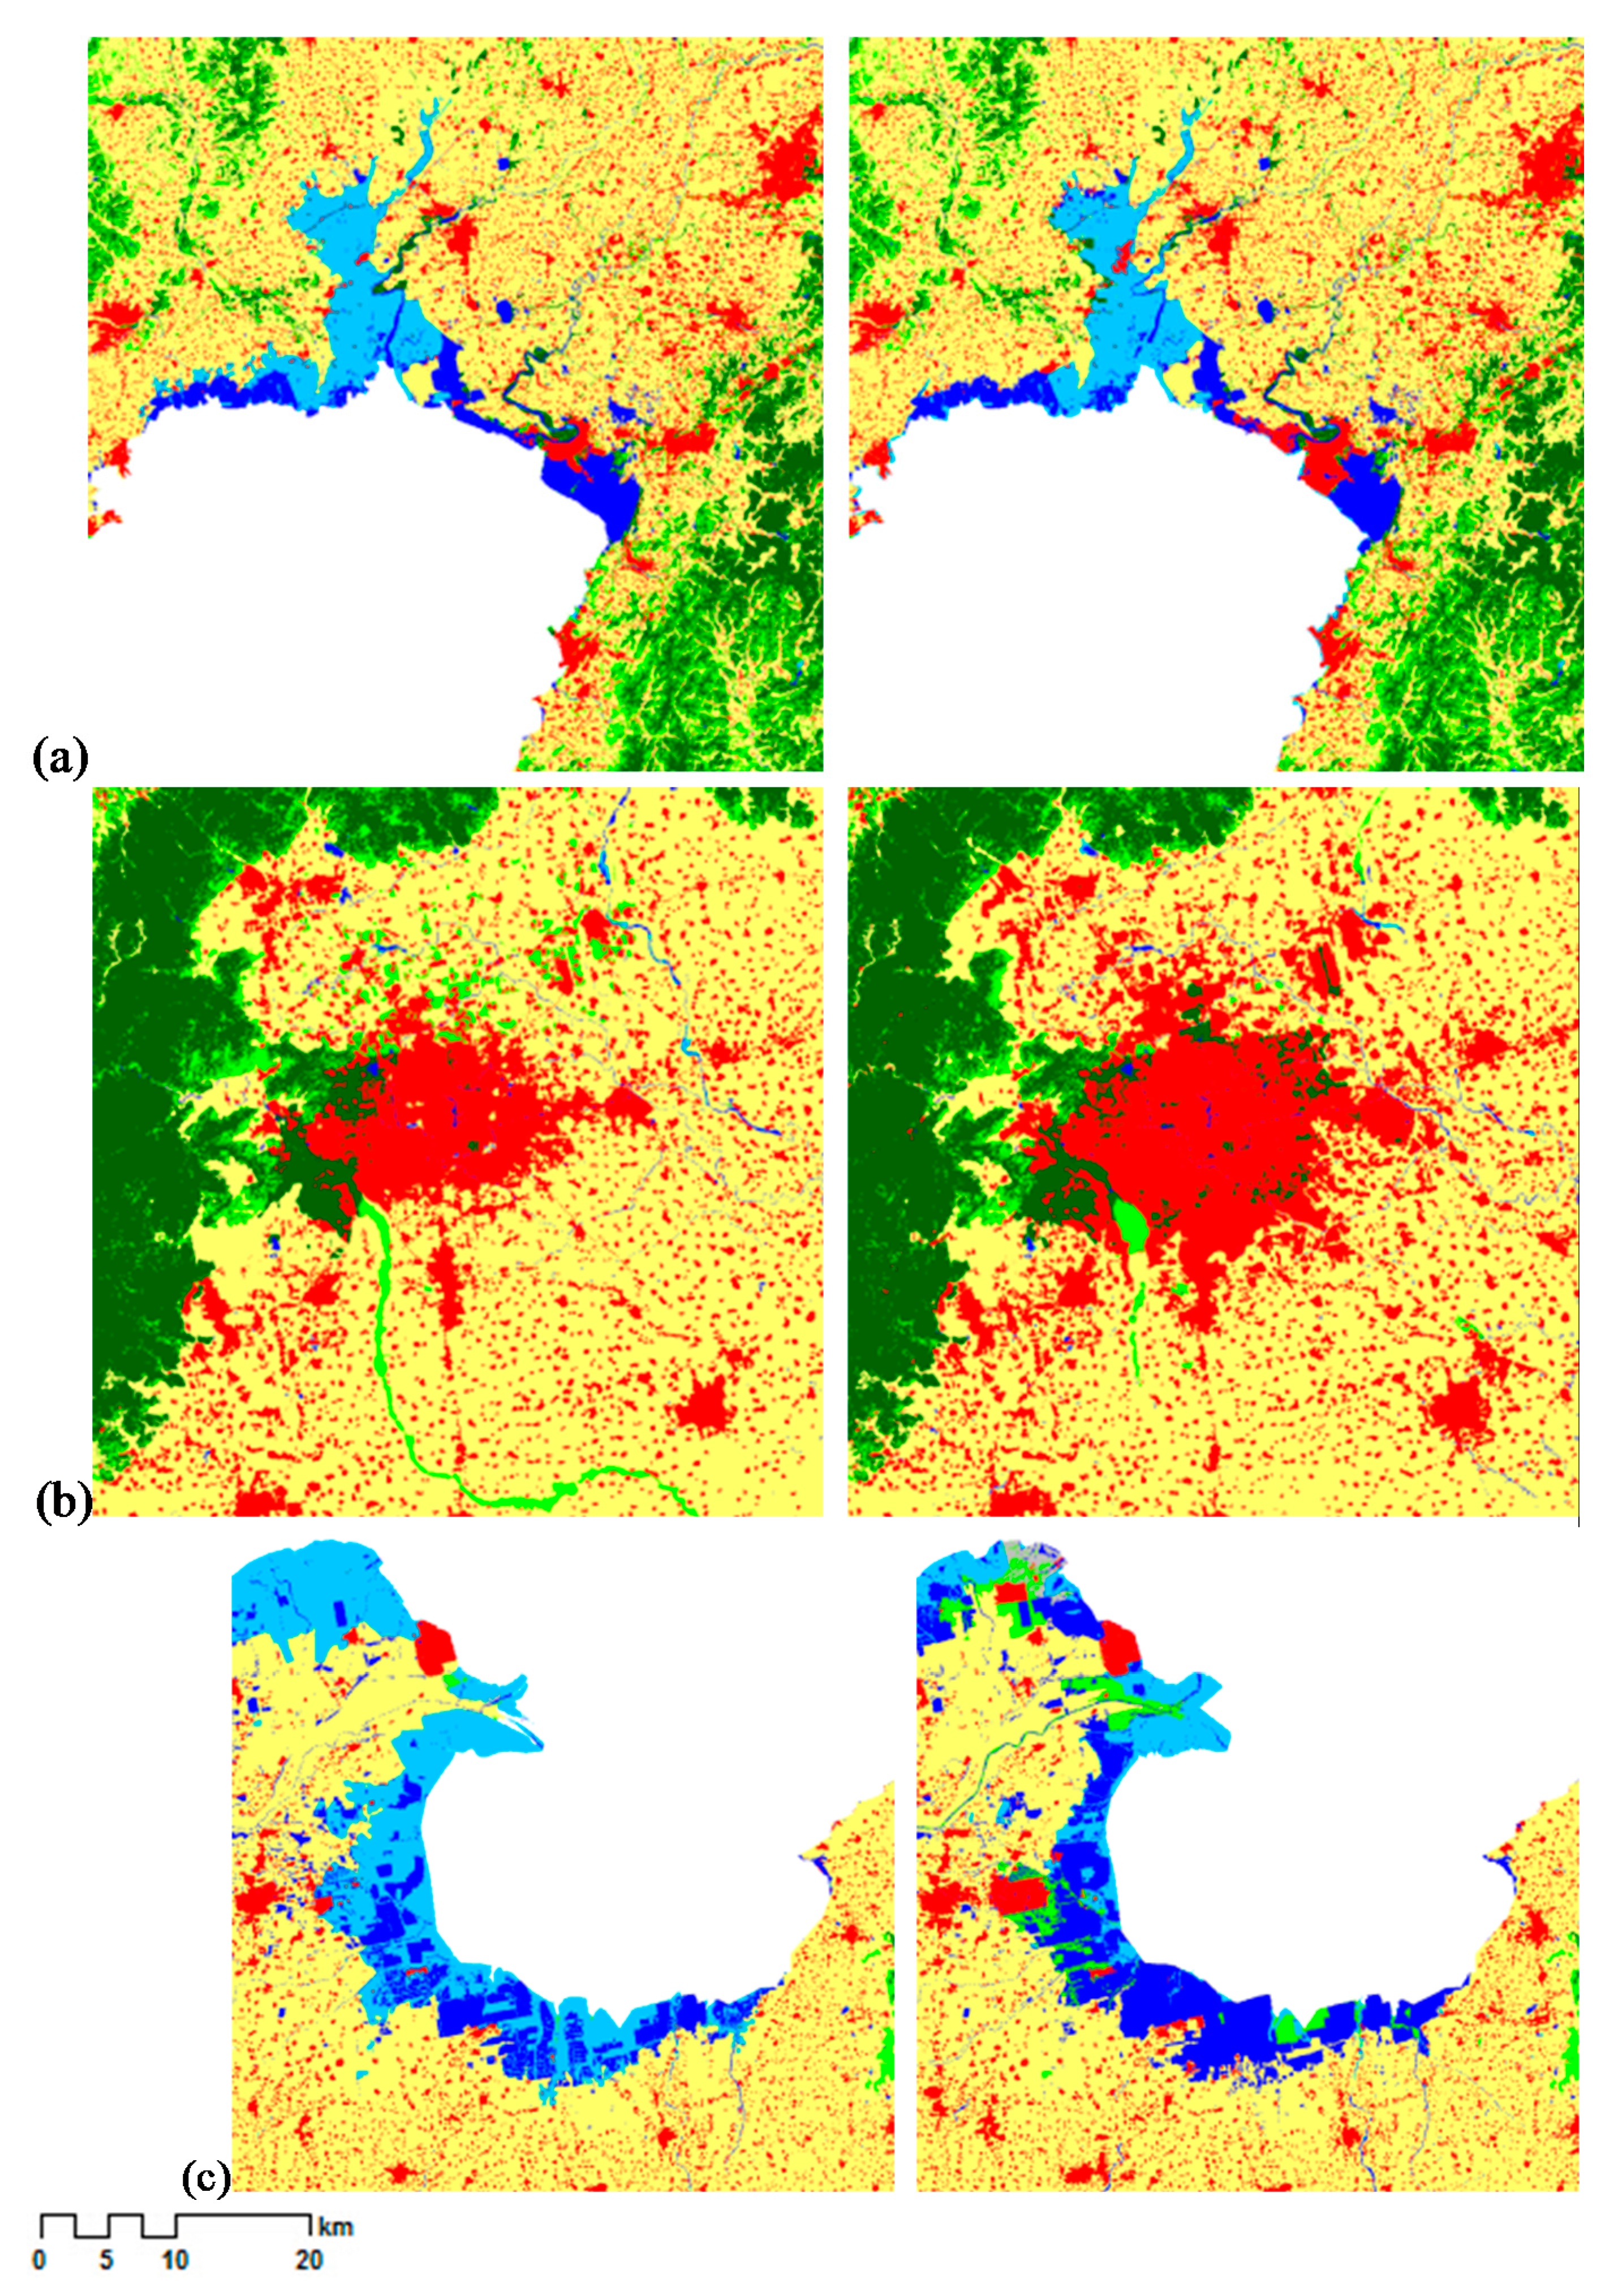
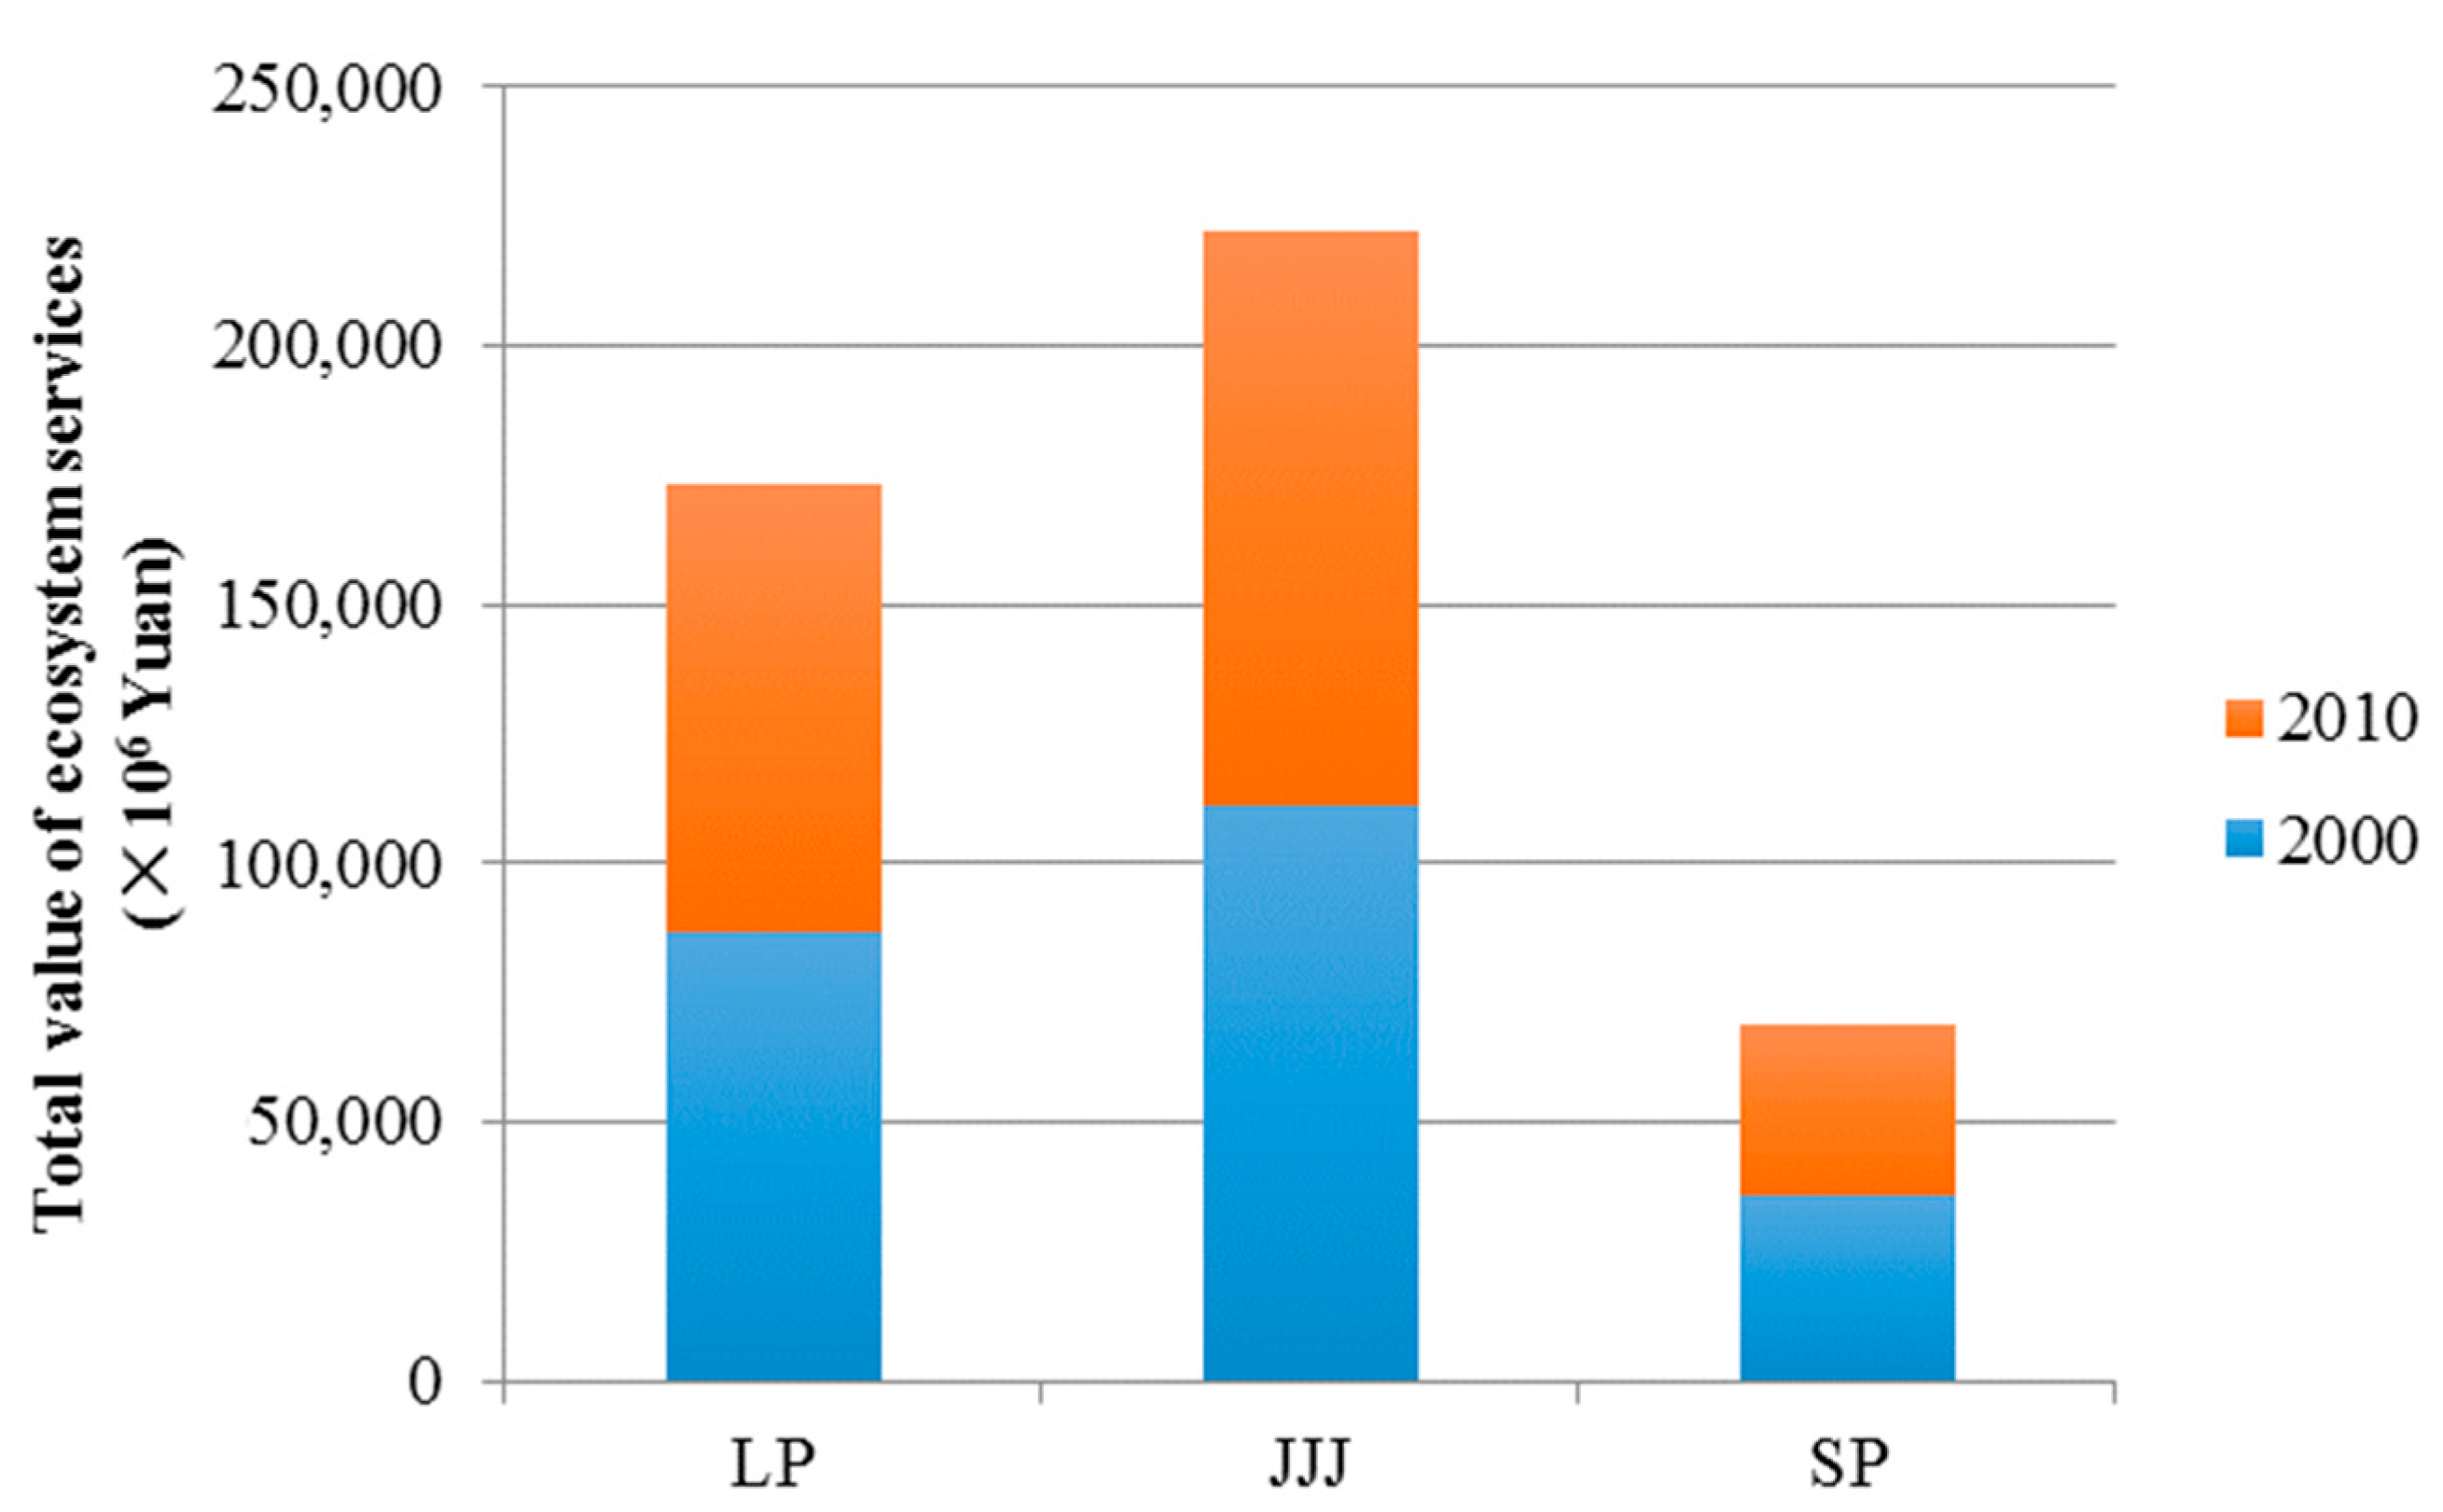
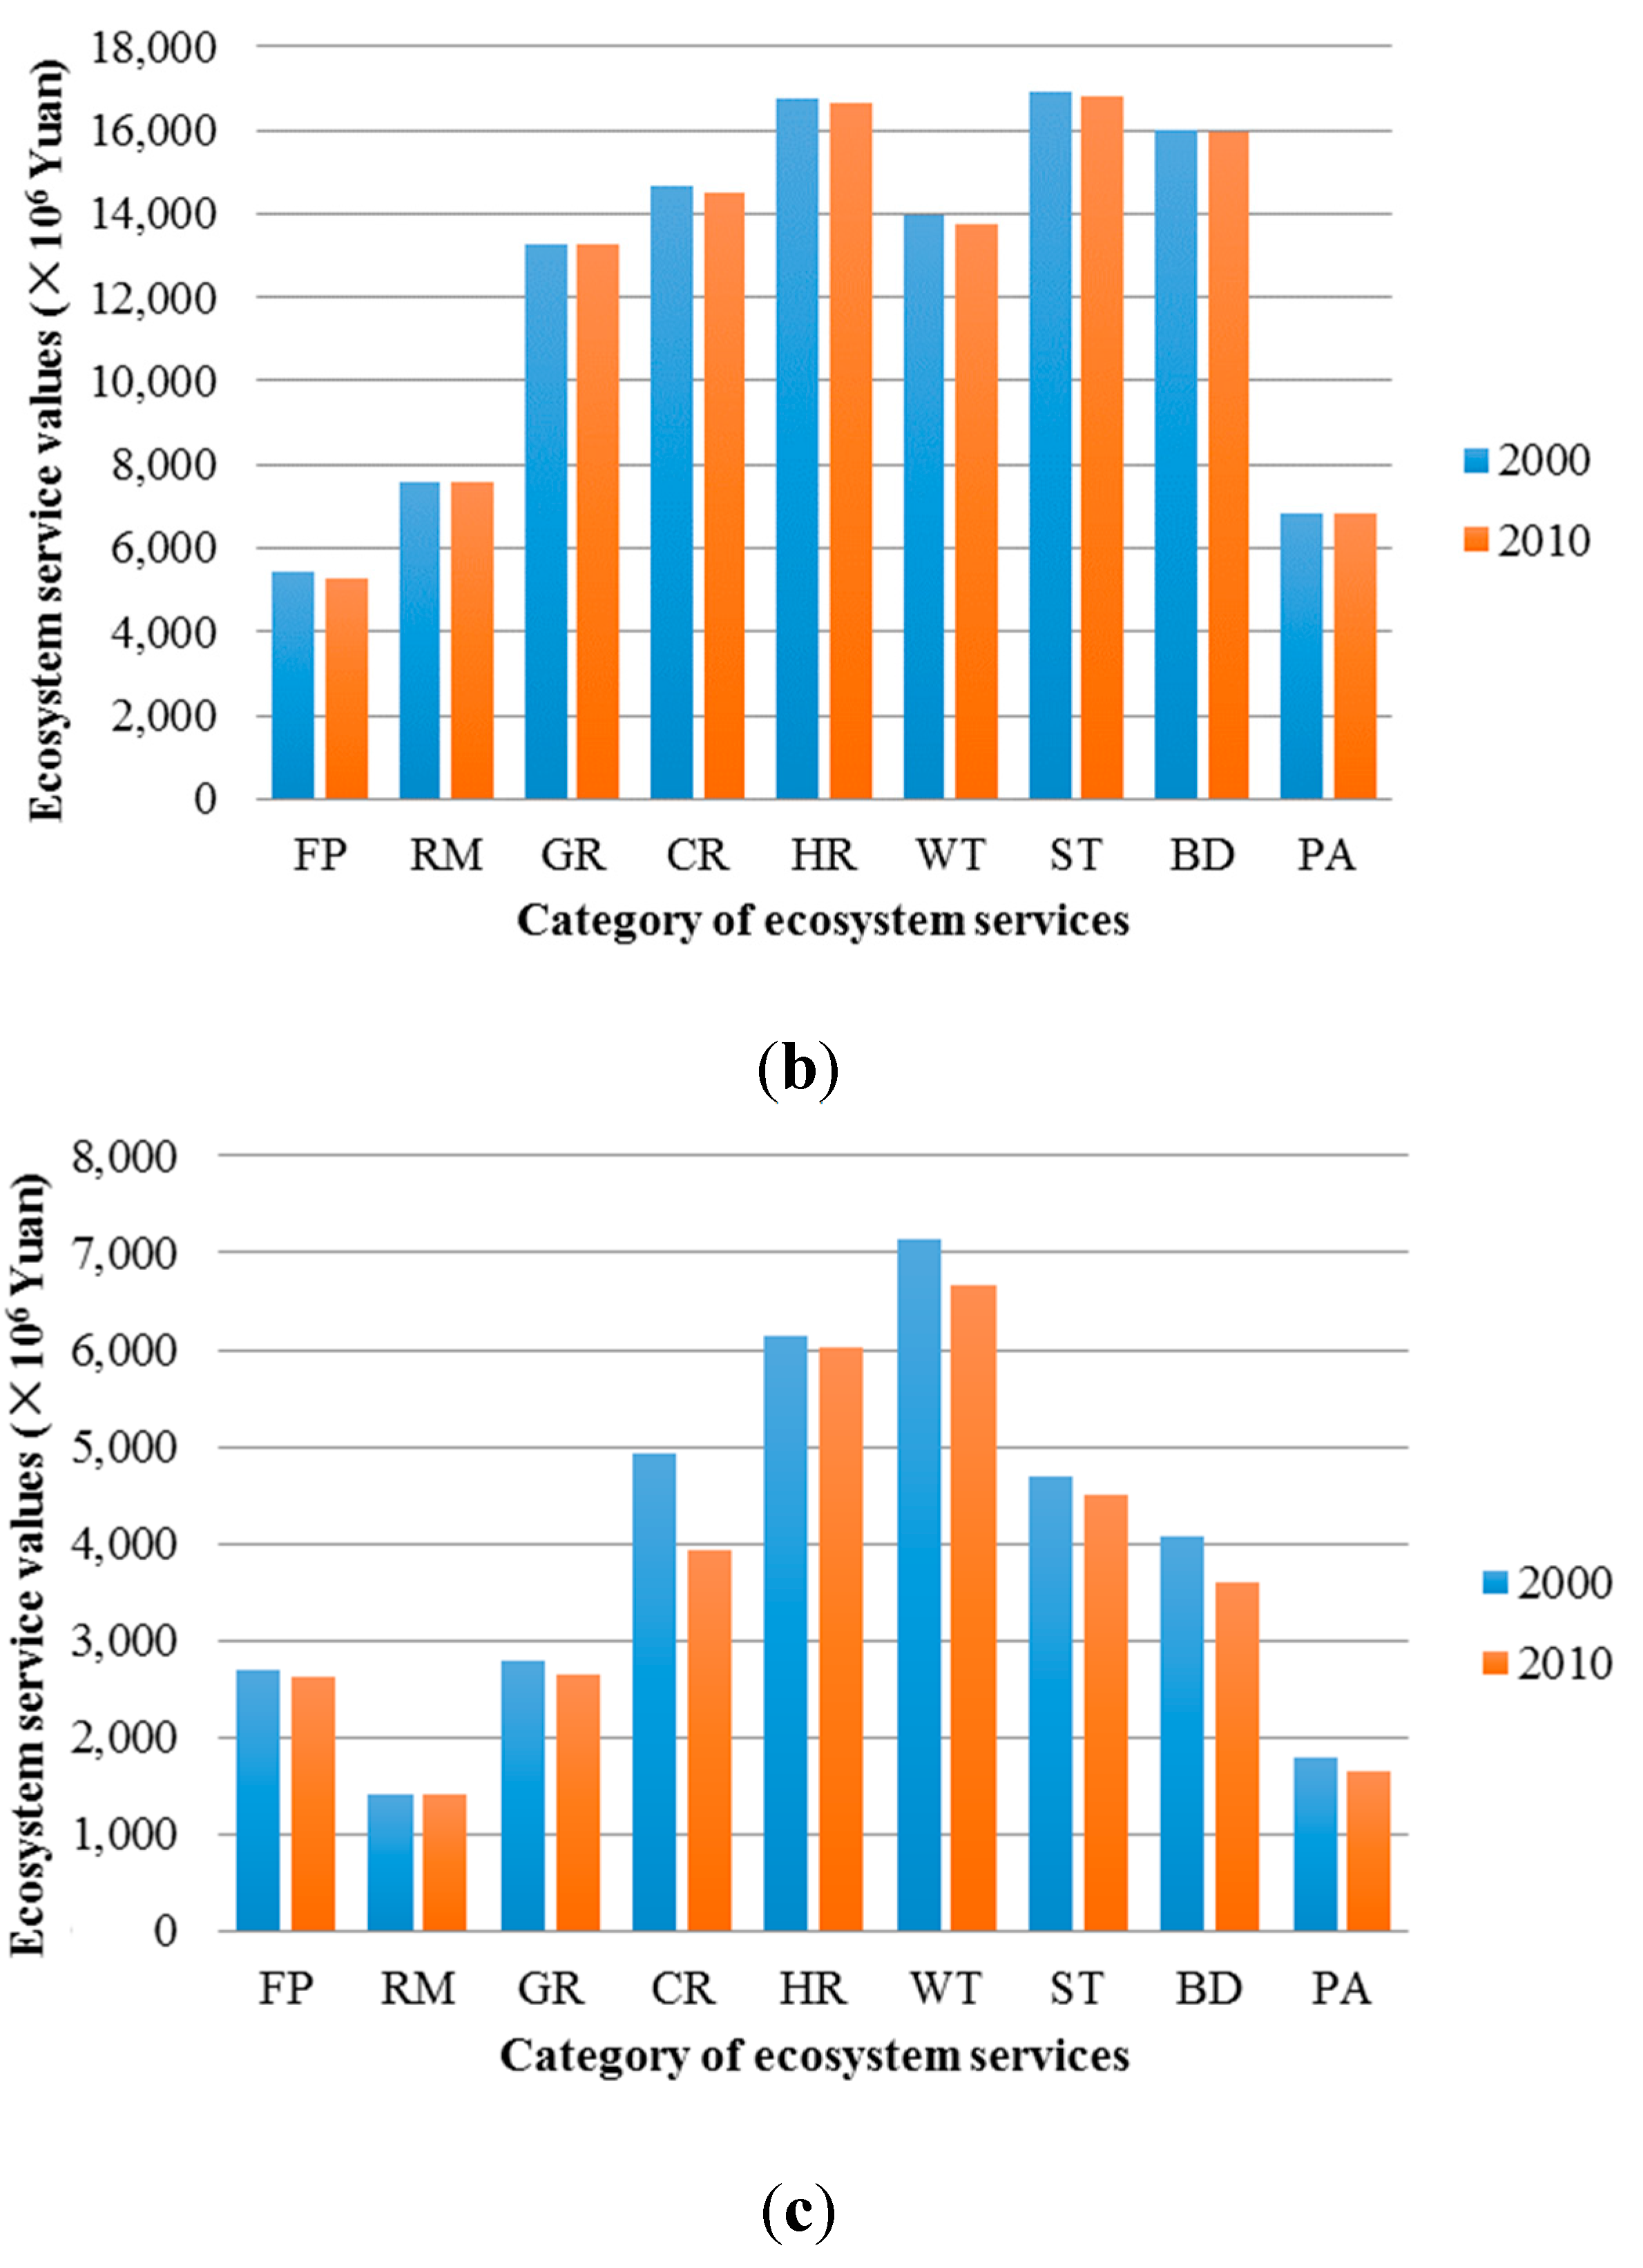
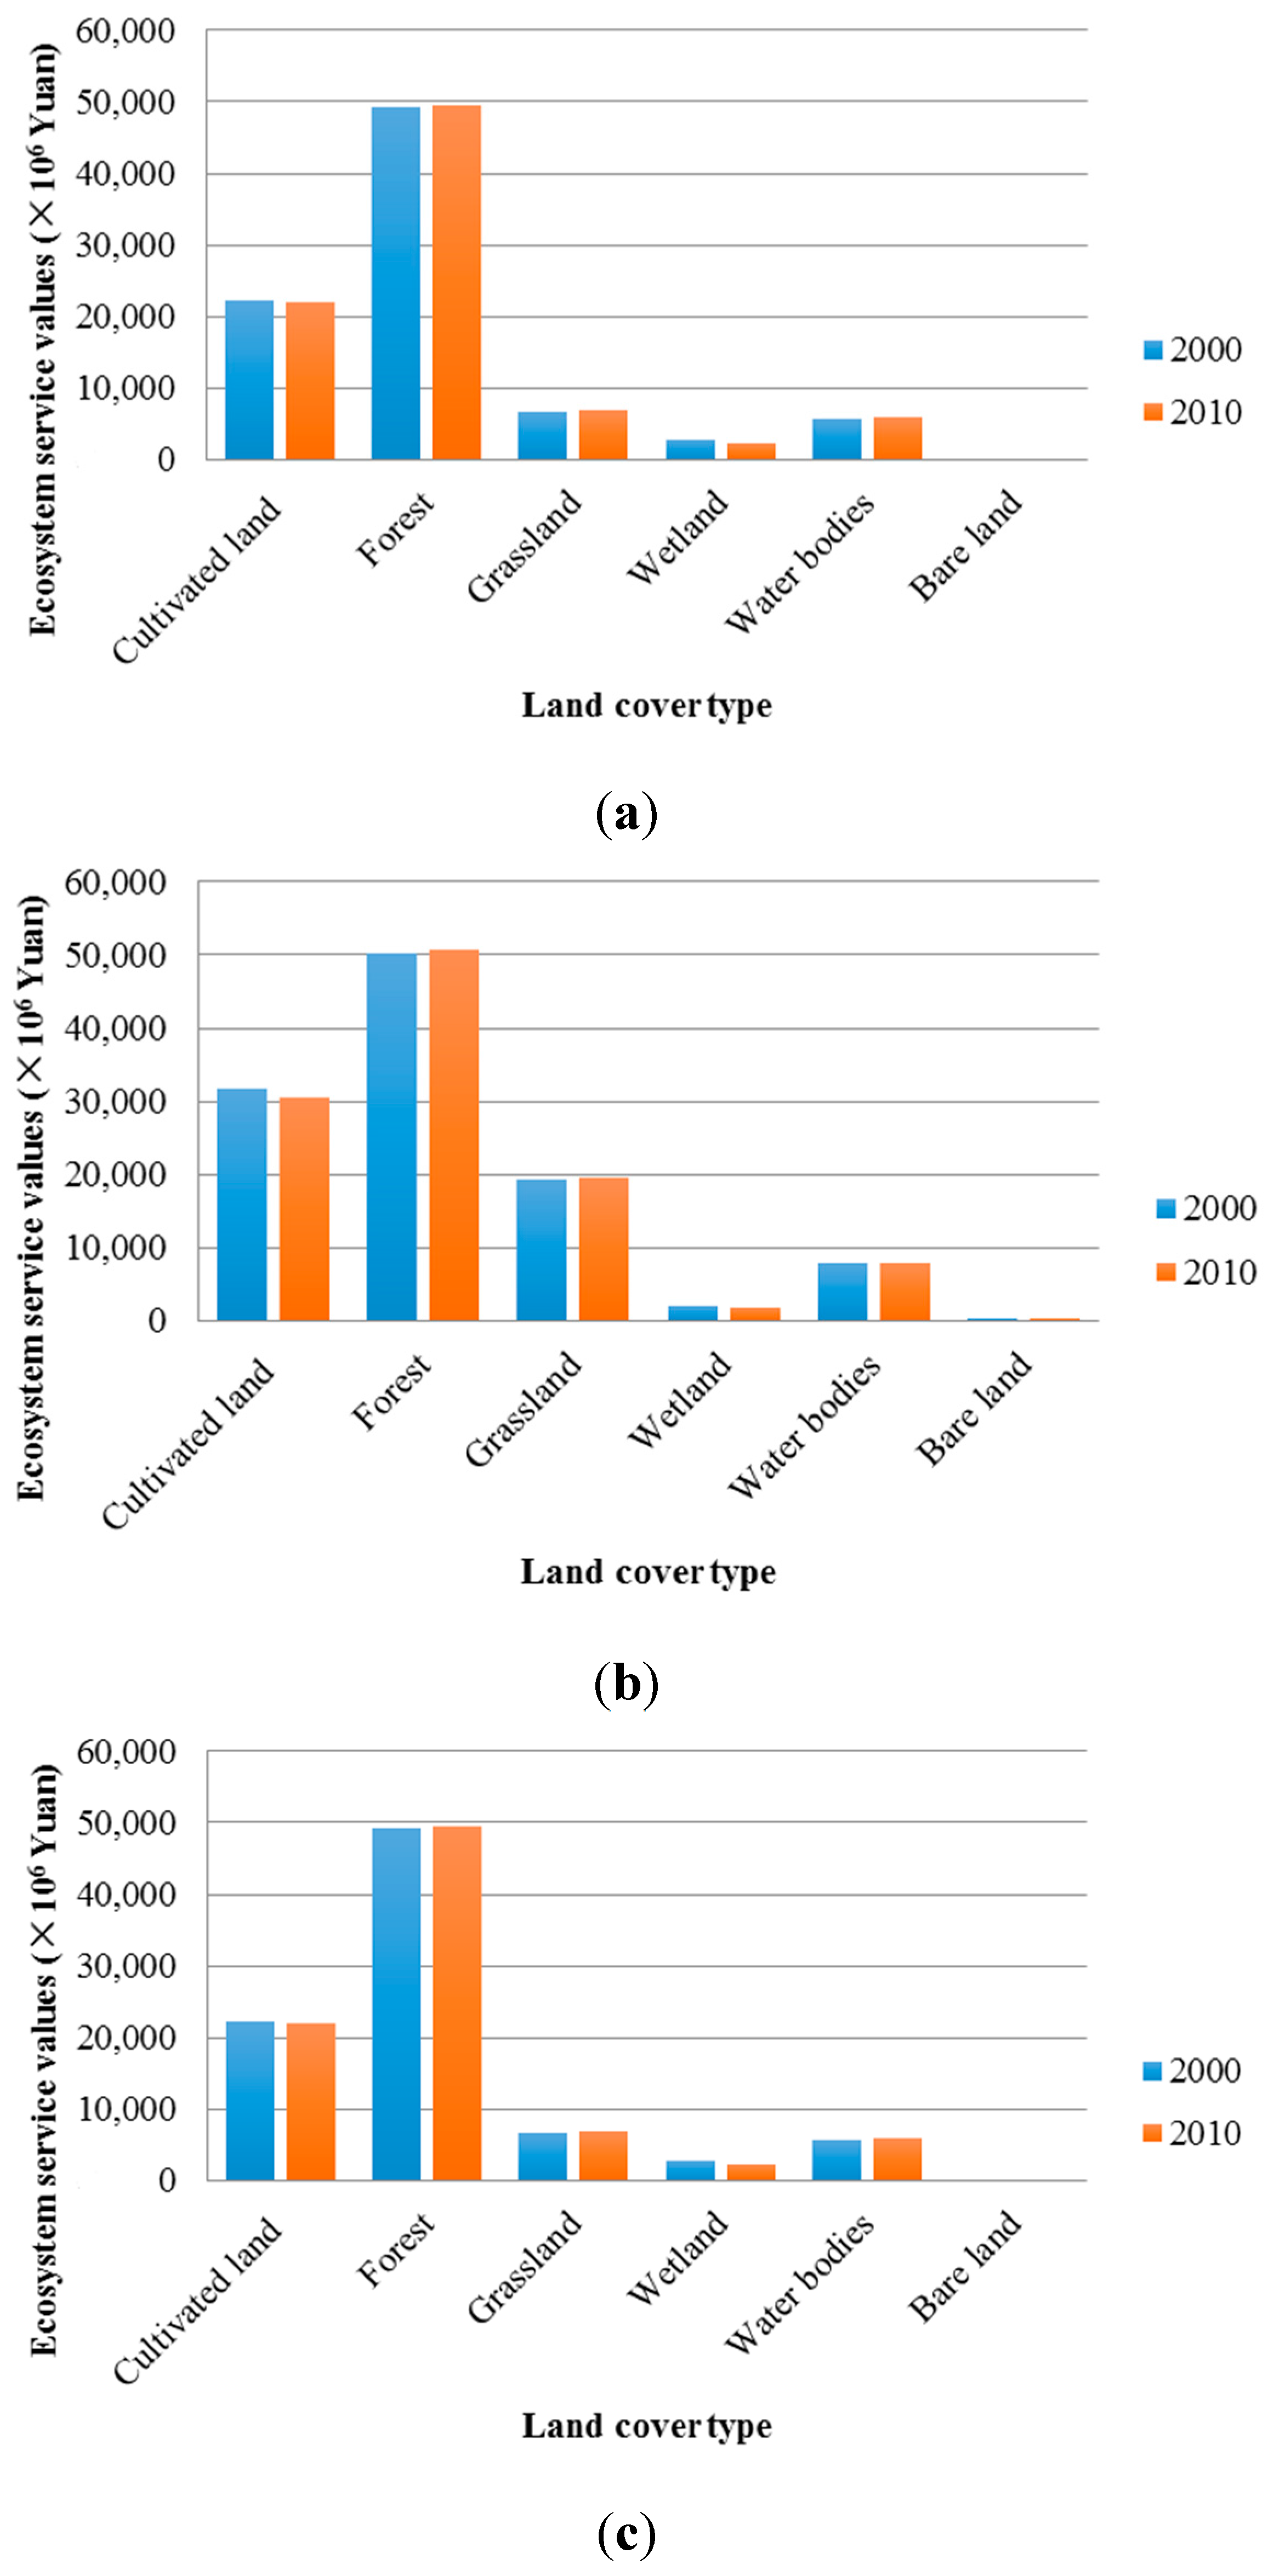
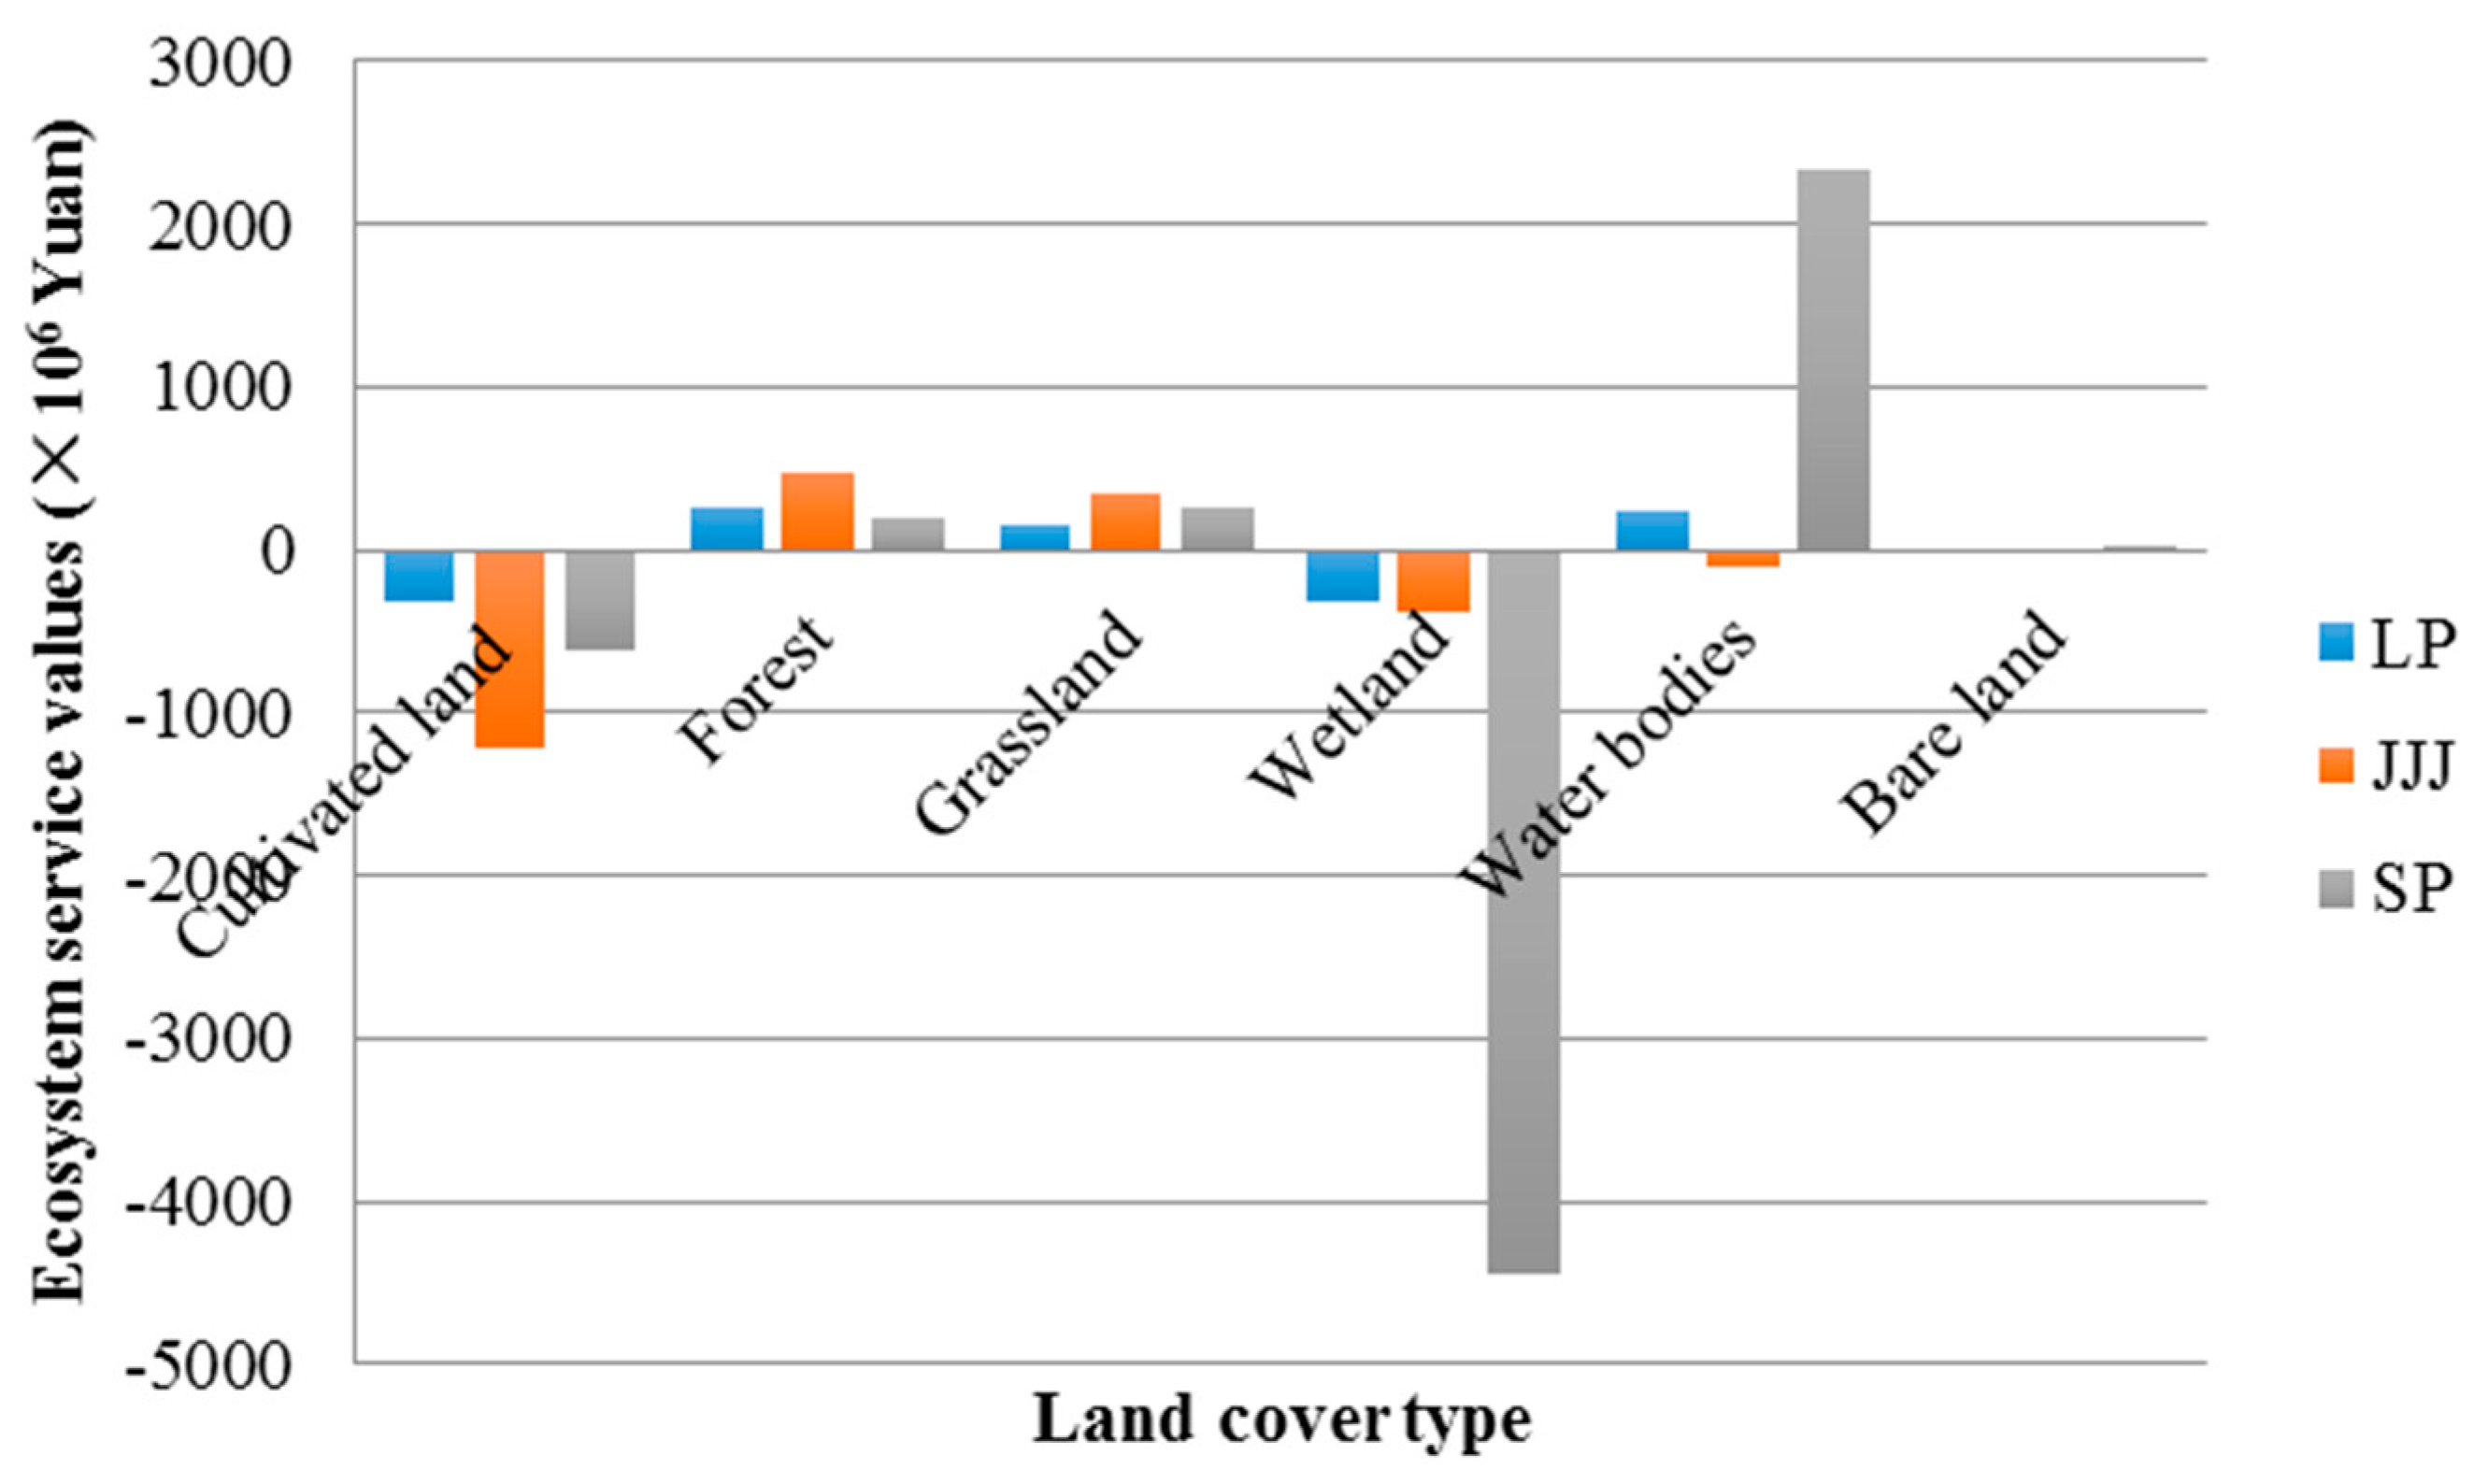
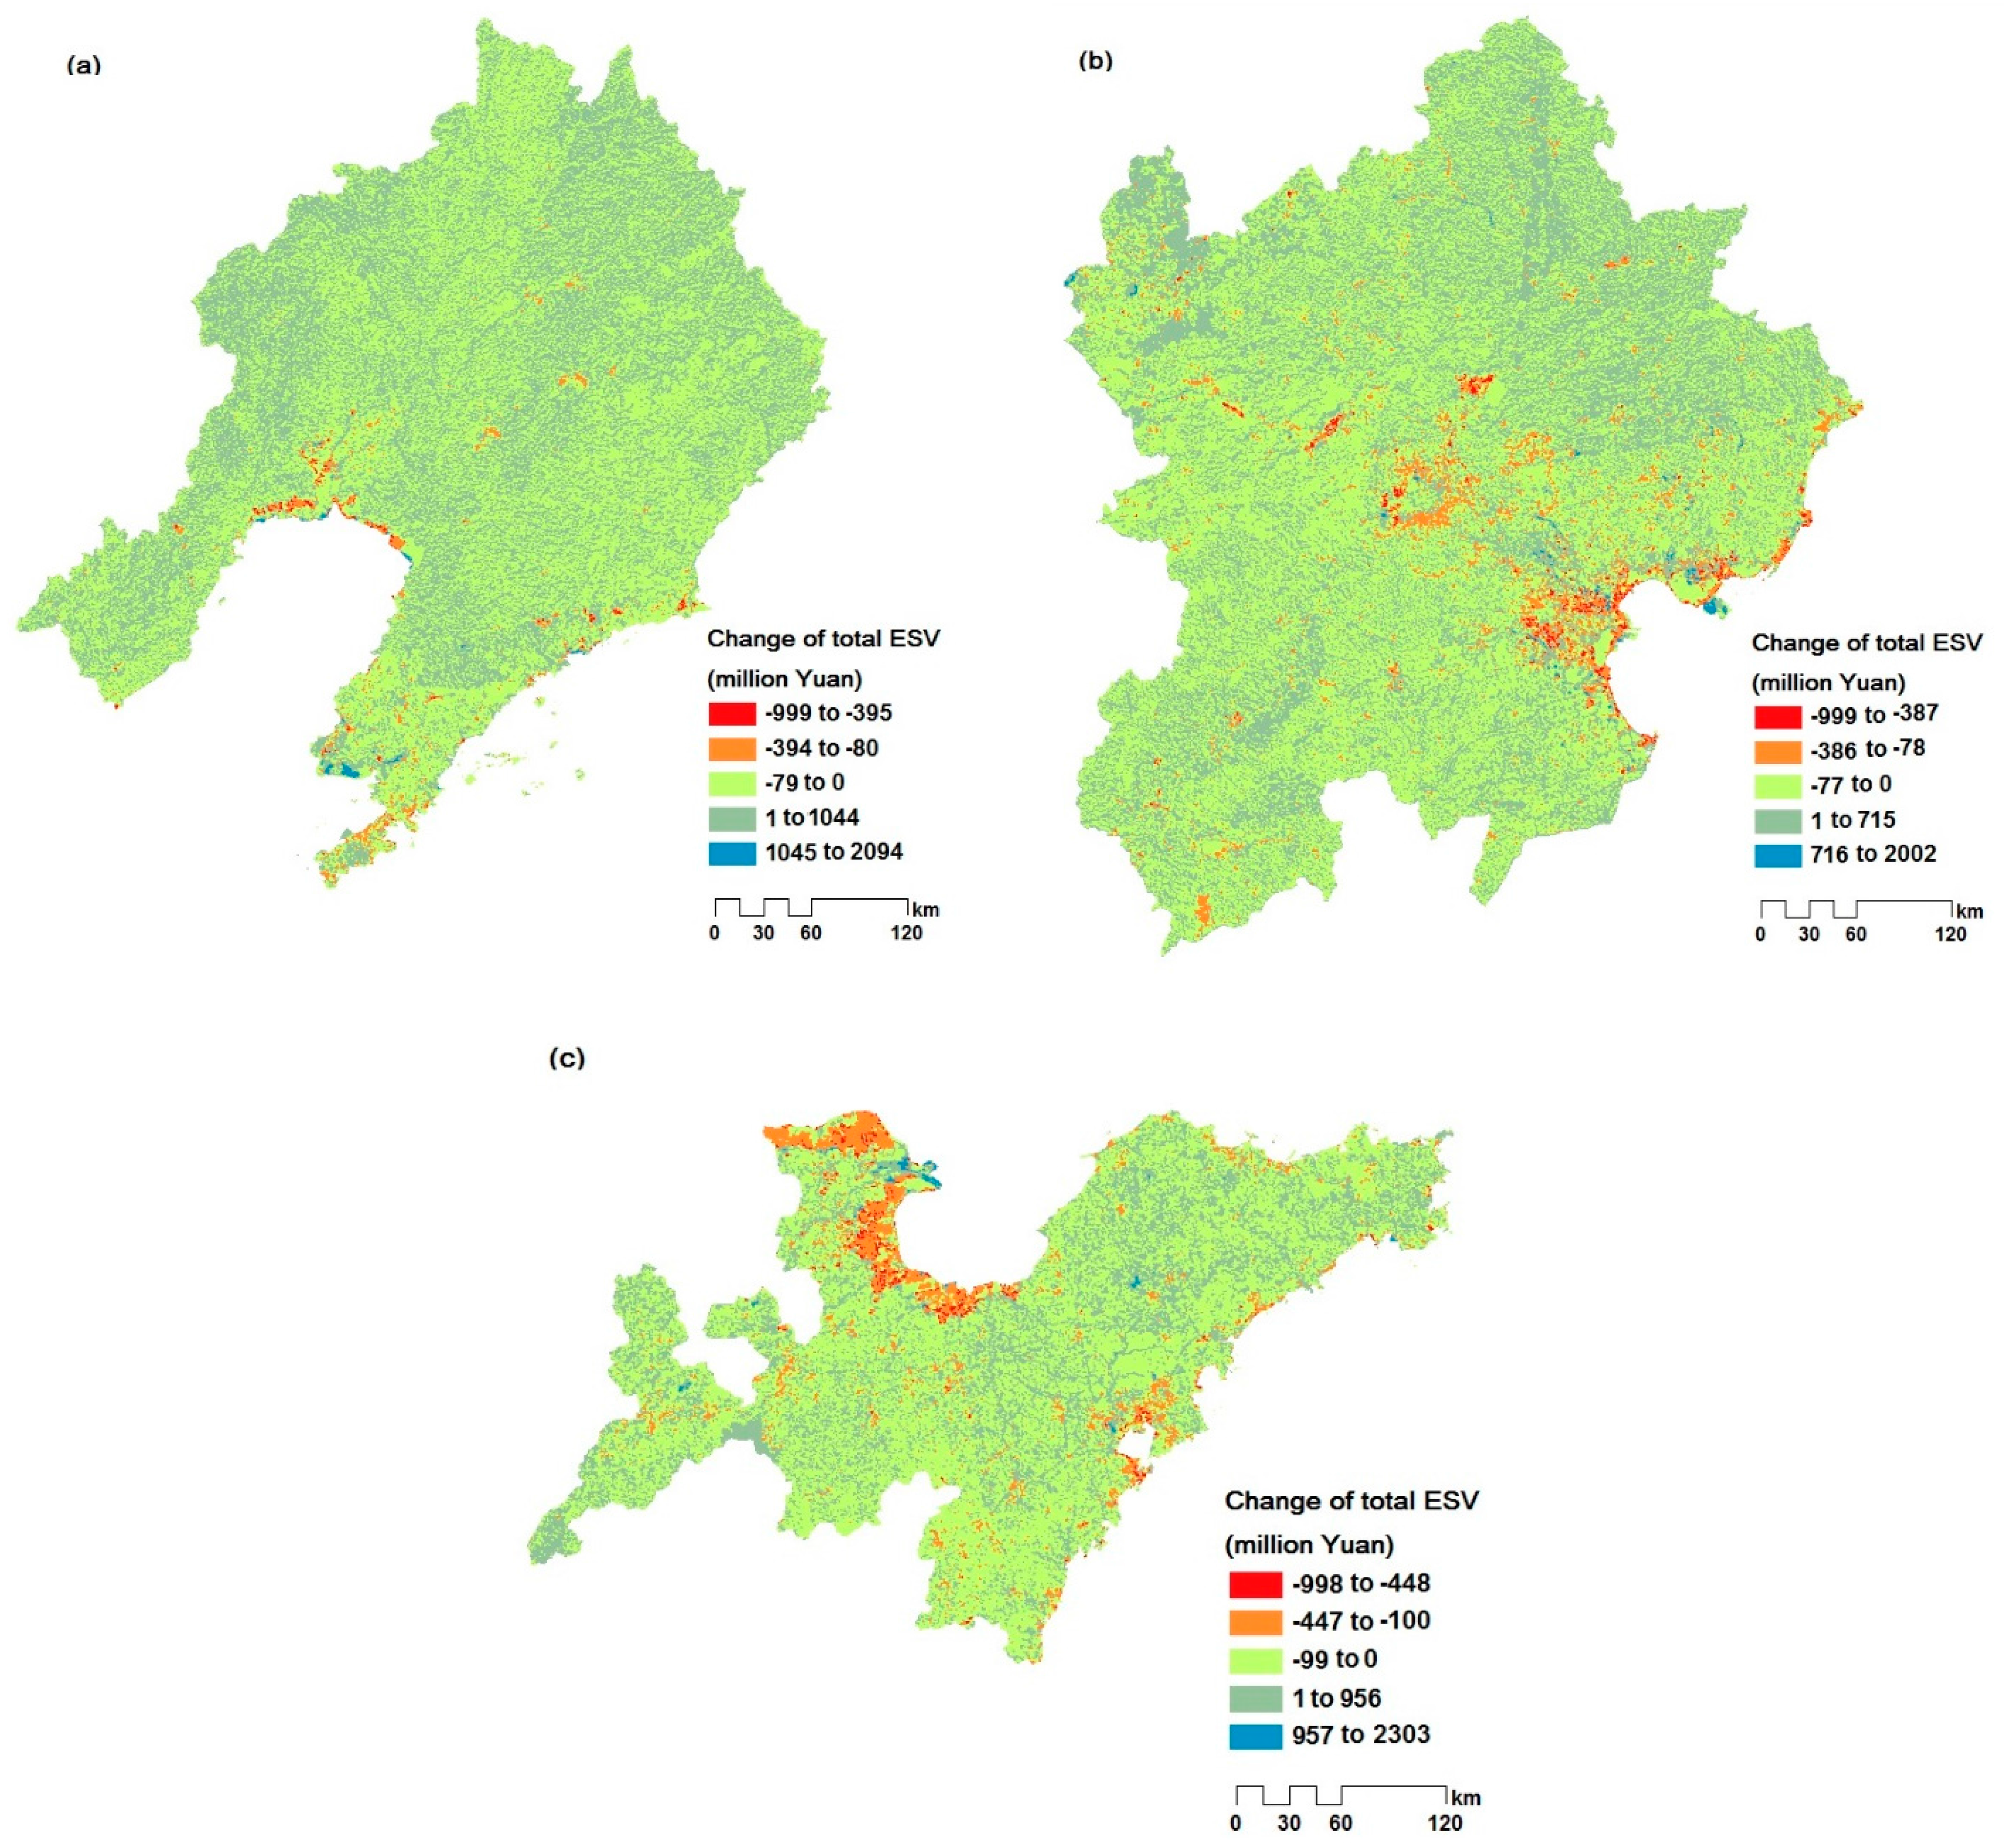
Here, we detected noticeable changes in land cover and ESV among three urban agglomerations in China. The total ESV of LP slightly increased, due to an increase in forest, grassland and water body cover, the higher coefficient values of which offset most of the decreases caused by the loss of cultivated land and wetland to artificial surfaces. The degradation of coastal wetlands primarily occurred on the southwestern shore of Panjin Municipality, where some scattered wetland patches were converted to cultivated land. However, the decrease in total wetland area in LP was minimal, because the main wetland area is located in the Shuangtaihekou National Nature Reserve in the Liaohe River Delta. This reserve was established in 1988, with the aim to protect the coastal estuary wetland ecosystem. Thus, the wetland area in LP is protected by effective natural reserve laws and policies. The increase in artificial surfaces due to large-scale urban expansion occurred at the expense of water bodies and grasslands, primarily in Shenyang, Panjin and Yingkou municipalities along the coastal area.
JJJ had a net loss in total ESV, because of the largest absolute increase in artificial surface area in the three study areas. The conversion of cultivated land to artificial surfaces due to urban expansion was the strongest driver in JJJ. Beijing and Tianjin were the largest hotspots for urban expansion in JJJ between 2000 and 2010. The cultivated land on the periphery of Beijing and Tianjin in 2000 gradually disappeared and almost completely vanished with the expansion of Beijing and Tianjin until 2010. This expansion occurred because there was an urgent need to accommodate the increasing population and growing economy. In addition to artificial surfaces occupying cultivated land around the city, they also occurred as a result of land reclamation in the coastal area of the Caofeidian District and New Binhai District in Tianjin, mainly due to the construction of ports and harbor industry [40]. This phenomenon resulted in the loss of wetlands at the shoals on the coast of the Caofeidian District and New Binhai District. Consequently, land reclamation contributed to the loss of a proportion of coastal wetland areas in JJJ [41]. The expansion of artificial surfaces around the city and in the urban clusters in the interior of JJJ should be strictly controlled to avoid ESV loss. Coastal areas should receive more ecological protection; however, to date, the focus has been on economic development.
The greatest reduction in ESV occurred in SP, due to the largest absolute loss of wetland coverage. The coastal wetland was substantially degraded and disappeared because of conversion to artificial water bodies dominated by saltpans and aquaculture, especially in the coastal area of Laizhou Bay [42]. Because Laizhou Bay is an important extensive saltpan and aquaculture zone in China, local economic income is highly dependent on the salt industry and aquaculture and has been subject to targeted state-led industrialization and economic growth policy pressure. In addition, local residents had low awareness about wetland ecosystem services, resulting in intertidal-mudflat wetlands being extensively and excessively utilized for saltpans and aquaculture. Consequently, pressure for economic growth by the local community has heavily influenced land use policies and decision-making processes. As a result, wetlands were primarily converted to other land cover types, including water bodies (aquaculture and saltpans), cultivated land and grassland. Wetlands urgently require protection and validation of their importance as ecosystem services to improve the quality of the ecological environment in SP [43].
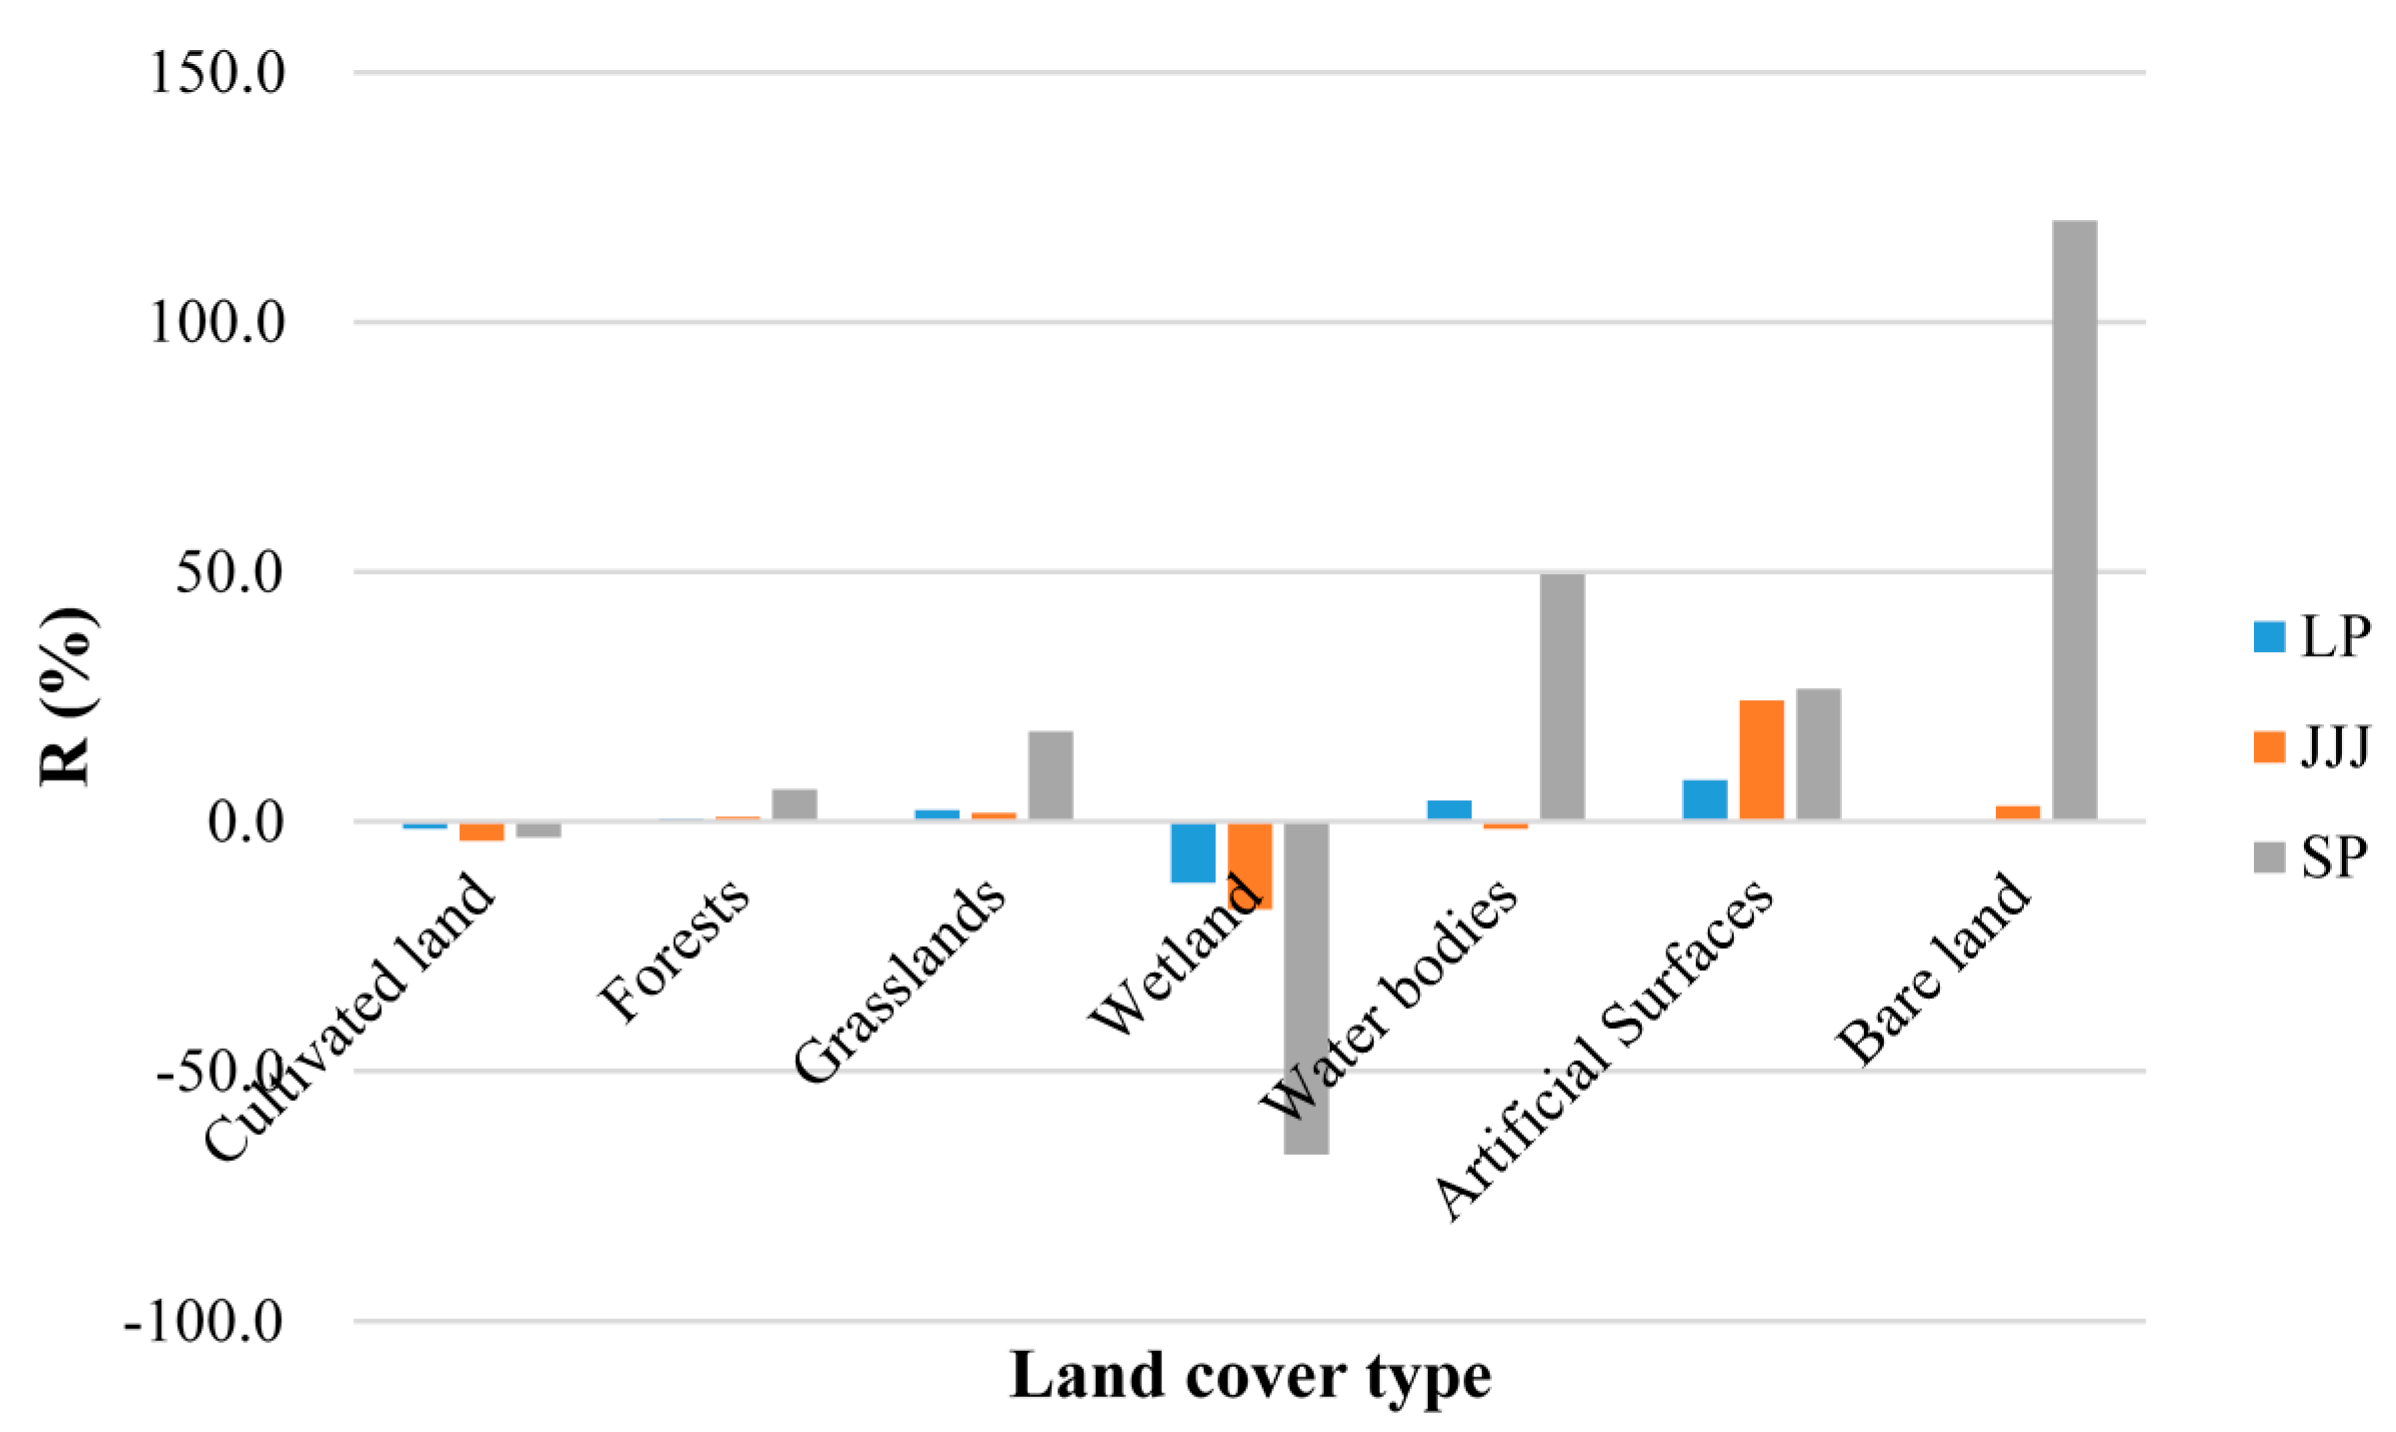
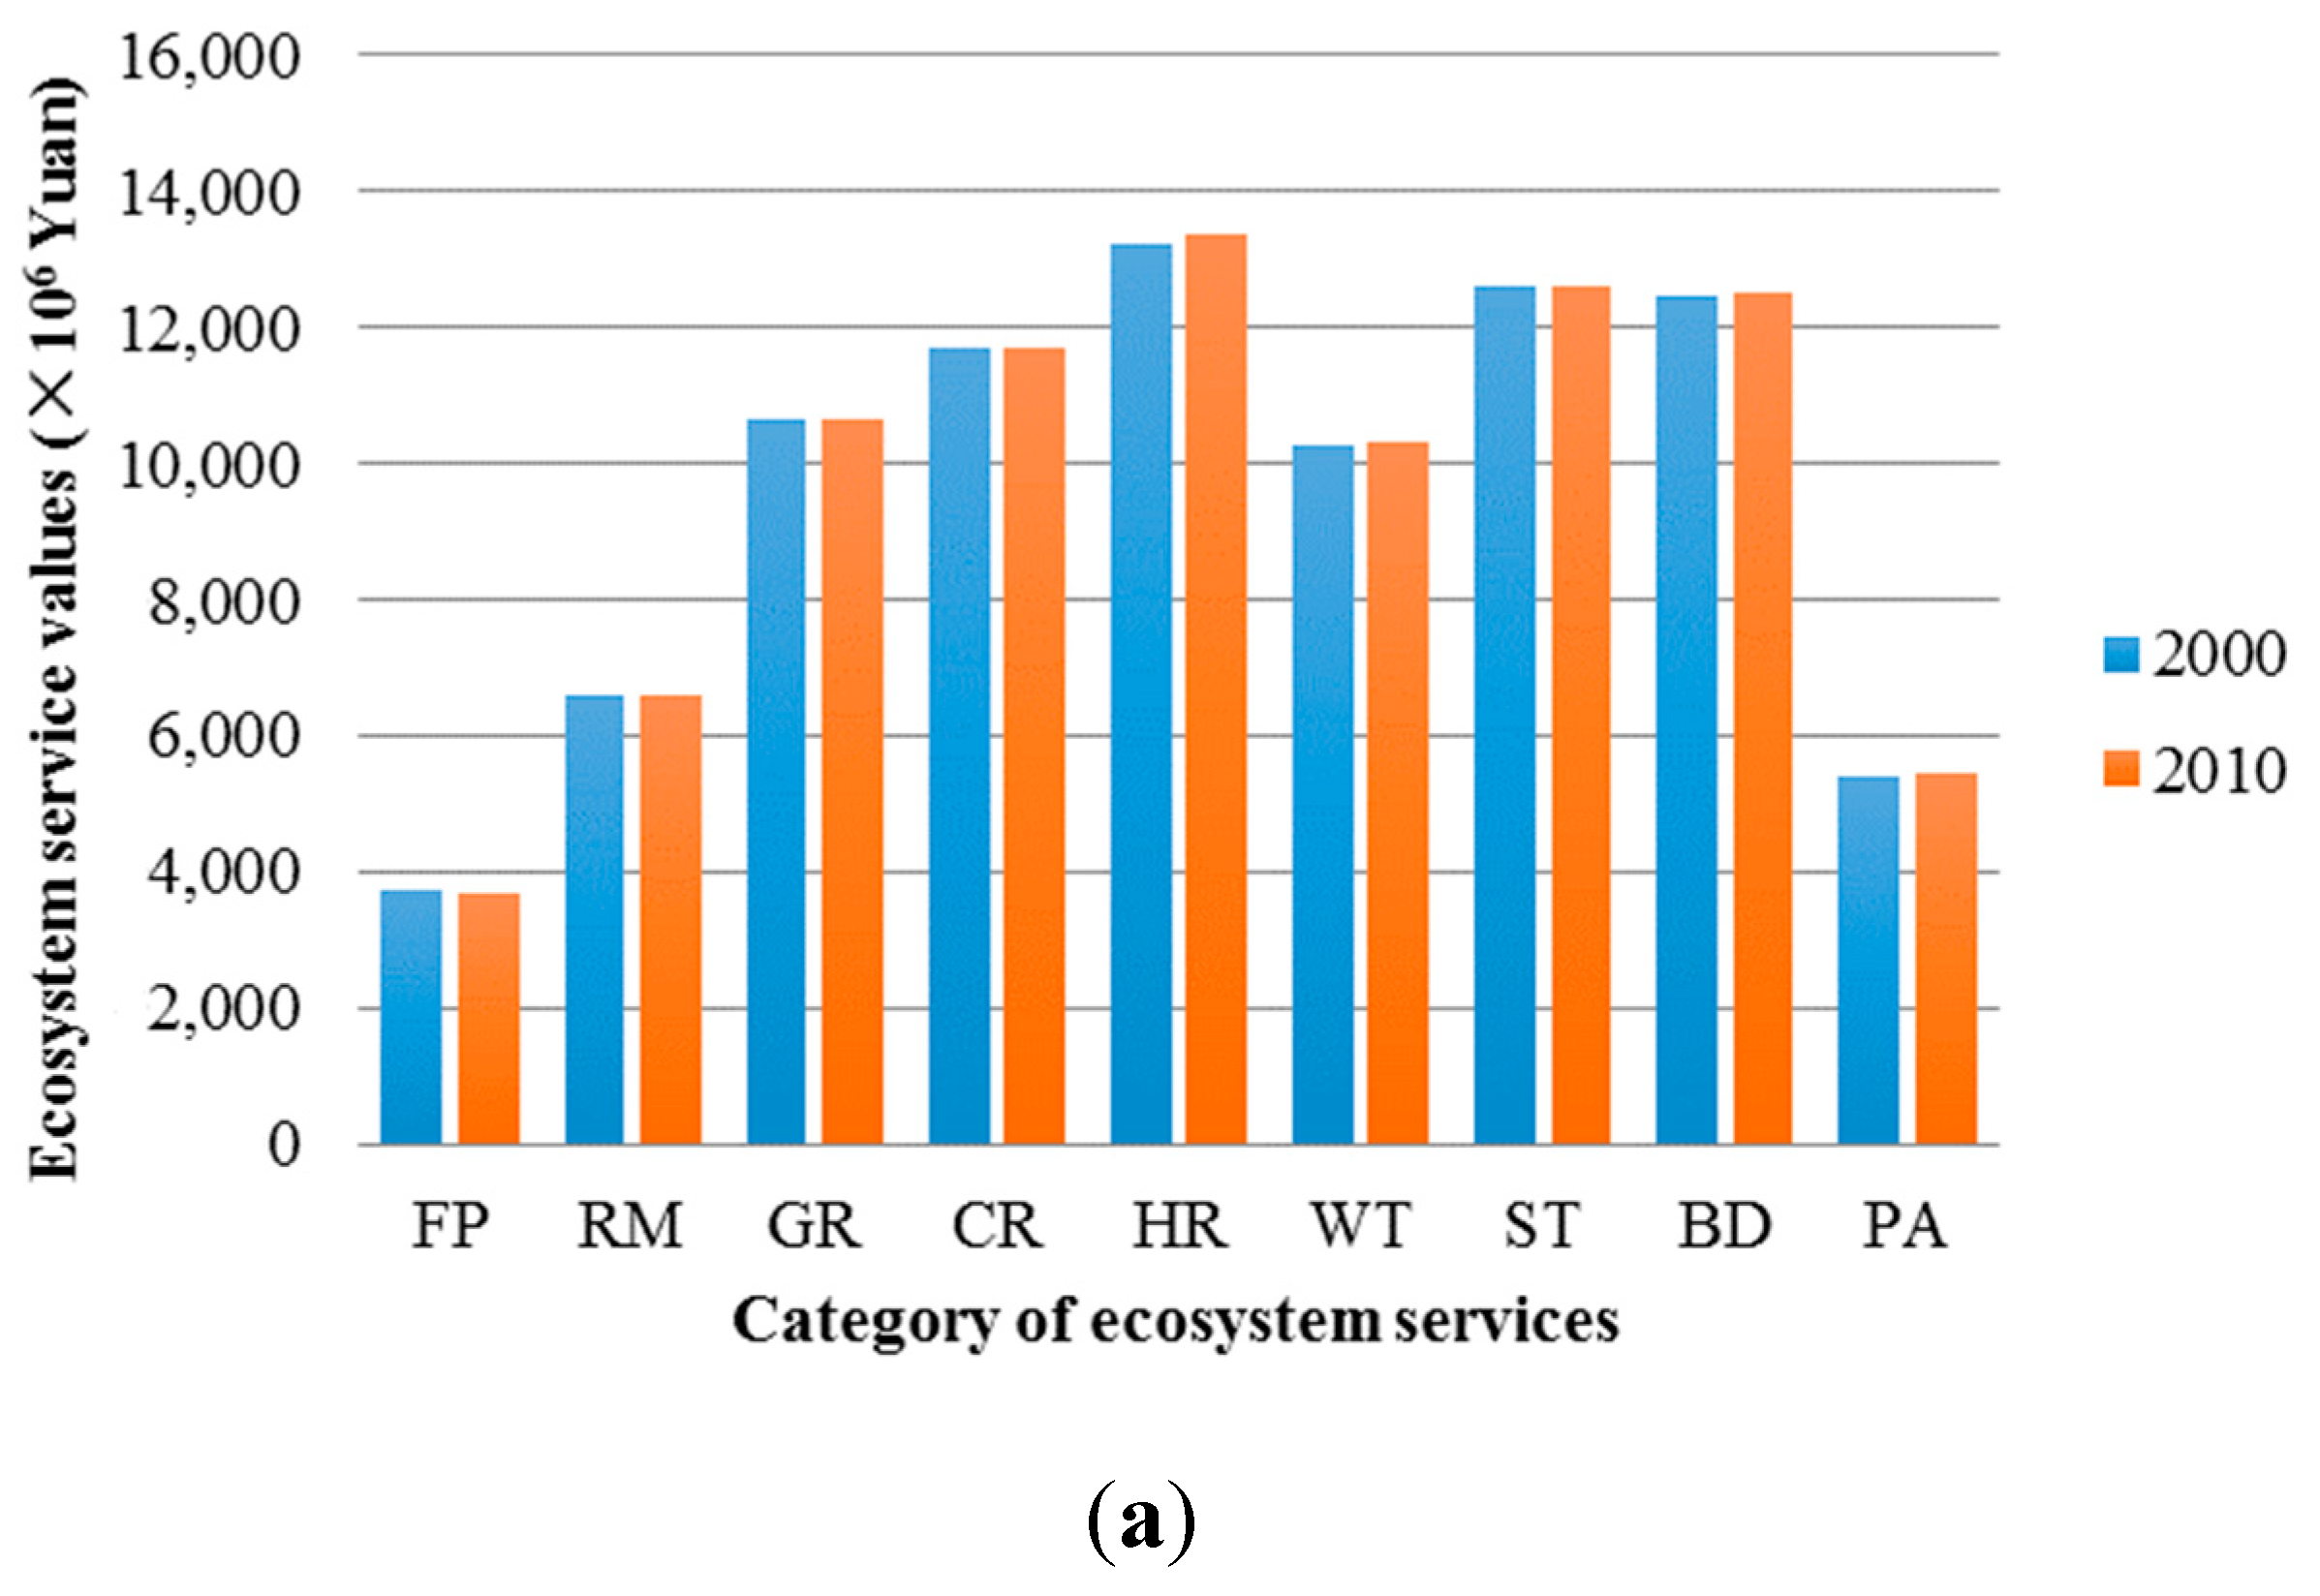
We detected the main negative and positive factors associated with the trends in changing land cover. These factors are interrelated and often have a synergistic impact on ecosystem services. Urban expansion and industrial construction had a strong negative impact on the ecosystem service values estimated in this study. The conversion of cultivated land to artificial surfaces was the most recurrent land cover change. Urban land increased by 8.3%, 24.3% and 26.6% in the three study areas, respectively. In addition, new saltpans and aquaculture construction occurred at the cost of coastal wetlands, leading to a substantial decline in wetland coverage. While the amount of wetland loss varied among the three study areas, it was universally a major contributor to total ESV loss. This is because wetland ecosystems have the highest estimated coefficient values. Consequently, the decline in cultivated land and wetland coverage contributed the most to ESV loss. However, China’s national green infrastructure programs, which aim to protect the environment, represented highly relevant positive drivers for ESV gains. The National Forest Conservation Program, the Grain for Green Program and the Great Wall of China Program are implemented by the Chinese government to increase forested and grassland areas. The programs are widespread and were initiated in 2000 [44]. The hilly and mountainous areas of eastern LP and the western and northern areas of JJJ are included in the Three-North Shelterbelt Development Program and the JJJ Sand Prevention Program implemented by national forestry key programs [45]. These long-term and large-scale projects are beneficial to decelerate total ESV losses.
Under current economic development pressures, many natural landscapes have been lost or degraded. Similar declines in ESV have been detected during the urbanization of different parts of China. Our understanding about the reliability of ESV will be aided by comparing our findings with those obtained in other urban areas. Wang et al. [12] applied the coefficients proposed by Xie et al. [8] to estimate spatio-temporal variations of ESV in China. Their calculations indicated that the total ESV of China decreased by 243.4 billion Yuan from the 1980s to 2010 due to land use changes. This decrease was mostly attributed to the loss of important woodland and water areas. Jan Haas et al. [38] employed the method proposed by Xie et al. [8] to estimate environmental impacts using ESV in JJJ, the Yangtze River Delta and the Pearl River Delta. The decrease in ESV in JJJ from 1990 to 2010 was calculated to be 9045 million Yuan, with losses being attributed to an increase in built-up areas. At the urban scale, Li et al. [39] detected a decrease of 19.3% in the value of ecosystem services provided by Chang Zhou’s natural and semi-natural land from 1991 to 2006, with the 1.3% annual decrease being attributed to the conversion of farmland to other uses. Our results support all of these preceding studies; specifically, the reduction in natural and semi-natural ecosystems, ecosystem services and functions is the result of changes in land cover.
The method adopted here has several limitations. For instance, our ESV estimates are based on the usefulness of the links between land cover types and ecosystem service categories. This method has been criticized as having low resolution, high uncertainty and high variation arising from the complex, dynamic and nonlinear properties of ecosystems [46,47]. However, accurately calculated coefficients have less impact on dynamic analyses over time than on cross-sectional analyses, because the value of the coefficients tend to influence estimates of directional change to a lesser extent than they affect estimates of the magnitude of ecosystem values at specific points in time [24]. Our study focused on variations in ecosystem services that influence human well-being over time. To this information, we added high-resolution land cover data (30 m) to calculate land cover and to assess ESV to obtain further precise spatial results. Therefore, the ESV unit in our study is credible at a regional scale; however, it may not provide an accurate assessment of the true value of ecosystem services.
In addition, we were not able to estimate monetized ESV for artificial surfaces, because we assumed that the well-known valuation of built-up land was zero. In fact, the levels of supply and demand of ecosystem services in urban areas are highly heterogeneous [48]. The developed land produces increasing levels of significant negative ecosystem service values because of air, water, solid waste and other pollution. However, the green urban areas play a relevant and positive role in the provision of ecosystem services [49]. For example, parks in urban areas provide aesthetic values for residents [50]. Ecosystems in urban and rural areas have important ecological roles in urban and regional studies and are expected to be a valuable asset in future studies of urbanization, providing insights about the interaction between natural ecosystems and human households. Therefore, it is necessary to extract reliable coefficient values for urban areas in future studies.

5. Conclusions

We explored the similarities and differences in ESV in three urban agglomerations by evaluating the impacts of land cover change on ecosystem service values over a 10-year period (2000 to 2010). The changes in land cover trends were similar in all three coastal urban agglomerations. Changes were dominated by urban expansion to convert natural and semi-natural land cover to urban land, with cultivated land being largely occupied in the peri-urban areas of the major cities. Meanwhile, differences in the magnitude and rate of impact of land cover change on ESV were really obvious.
This study demonstrated that urban expansion in coastal areas may not necessarily lead to a net decline in ESV, if there are substantial increases in natural land with greater estimated coefficients. For instance, like SP and JJJ, there was a rapid increase in artificial surfaces in LP due to urban expansion; however, the total ESV in LP increased because of the effective national sustainable forestry (national green infrastructures) and natural wetland reserve policies. Thus, the negative impacts of urban expansion on ecosystem services could be offset by positive changes to natural landscapes, because a change in ESV depends on the interaction of changes of various land cover types over time.
This study highlights the important links between land cover change and impacts on ecosystem service values. The transformation of land cover types leads to a change in the structure and function of ecosystem services. However, when the capacity of the ecosystem to deliver ecosystem service functions is depleted because of land cover change, the intermediate- and long-term gains from economic growth may exceed the short-term gains, because degraded environmental quality may lead to economic losses. In China, while natural land should be used sustainably in the process of rapid urbanization, the need to balance economic, social and ecological benefits is becoming increasingly urgent. Therefore, land use and land cover policymaking processes should be aimed at balancing ecological resources with economic growth.

Acknowledgments

This research is supported by the National Natural Science Foundation of China (No. 41171097), National Twelfth Five-year Science and Technology Plan (2012BAK12B03) and the 985 Project of Beijing Normal University (Beijing-Tianjin-Hebei strategy research of ecological civilization). We thank Lisa Naughton-Treves and Axing Zhu from Department of Geography, University of Wisconsin-Madison, Jun Chen, Yuejing Ge and Dianting Wu for the help and valuable advice. We also thank Rebecca May, Jun Yin and Jianke Guo for help in correcting some of the grammar issues. We are especially grateful to the National Geomatics Center of China for supplying land cover data.

Author Contributions

Yushuo Zhang conceived and designed the study. Lin Zhao and Jiyu Liu processed and calculated the data. Yuli Liu and Cansong Li performed research and analyzed the data. Yushuo Zhang wrote the paper. All authors read and approved the final manuscript.

Conflicts of Interest

The authors declare no conflict of interest.

Appendix

Table A1. Classification and definition of ecosystem services.
CategorySub-CategoryDefinition
ProvisioningFood productionEdible plant and animal goods transformed from solar energy
Raw materials productionRaw materials derived from solar energy that can be used as construction materials or alike
RegulatingGas regulationMaintenance of atmospheric chemical composition balance, absorbing SO2, fluoride and NxOy
Climate regulationRegulation of regional climate, e.g., increased precipitation and decreased temperature
Hydrological regulationFresh water filtration, retention, storage and supply
Waste treatmentRemoval or breakdown of excess of xenic nutrients and compounds, dust agglutination
SupportingSoil formation and conservationAccumulation of organic materials, function of root and biological materials in soil retention, nutrient cycling and accumulation
Biodiversity maintenanceSources of genes for wild animals and plants, habitats for wild animals and plants.
CulturalProviding aesthetic valuesPotentials in providing recreational, cultural and artistic values
Table A2. Land cover conversion matrix from 2000 to 2010 in LP (ha).
TypesCultivated LandForestGrasslandWetlandWater BodiesArtificial SurfacesSea
Cultivated land5,961,30465,74060,267993312,64852,9093513
Forest83,5373,650,615177,428322842991806121
Grassland94,243177,3721,035,02391745354629179
Wetland1471177423086,38037461371395
Water bodies16,495322921733977247,34874920,586
Artificial Surfaces100,823303712,21220688536759,7151645
Sea25898283197116955149,880
Table A3. Land cover conversion matrix from 2000 to 2010 in JJJ (ha).
TypesCultivated LandForestGrasslandWetlandWater BodiesArtificial SurfacesBare LandSea
Cultivated land8,252,26217,590138,624807152,742103,708513
Forest38,6683,750,365225,35735759362556200
Grassland262,057206,1683,253,537280215,22140591229295
Wetland6606100814936,70119,0428480163
Water bodies65,312363563623,982276,875439348280
Artificial Surfaces288,339555753,92811,32119,9591,059,52312922,362
Bare land16412123271178556820
Sea25017934352012046749
Table A4. Land cover conversion matrix from 2000 to 2010 in SP (ha).
TypesCultivated LandForestGrasslandWetlandWater BodiesArtificialSurfacesBare LandSea
Cultivated land5,275,197914582842,87429,68069,6364635
Forest15,413218,41615,5338120332516532
Grassland28,67114,053248,29031,262223790884526
Wetland53,199106135398,529188,5071129642826
Water bodies5944099373,08337641054895788
Artificial Surfaces221,4721081371411,4936121581,365262169
Bare land3681743594741918933296510
Sea1161678589760642025,160
Rows and columns contain data between 2000 and 2010, respectively.
Table A5. Total ecosystem service values (ESV) change in 2000 to 2010 (×106 Yuan).
LPJJJSP
20002010Variation20002010Variation20002010Variation
Total ESV86,65786,72972111,386110,492−89335,67433,402−2273
Table A6. Changes in the value of ecosystem service category (ESVf) in 2000 to 2010.
LPJJJSP
ESV(×106 Yuan)ESV(×106 Yuan)ESV(×106 Yuan)
20002010Variation20002010Variation20002010Variation
FP37223693−2954145275−13927022634−69
RM658366001875637562−114081404−4
GR10,64310,6763313,28413,272−1128022639−162
CR11,68211,7122914,64314,514−12949273921−1006
HR13,24913,37712816,73716,639−9861436020−123
WT10,27210,3295713,99713,751−24671366665−472
ST12,62012,629916,94216,834−10846874509−178
BD12,46712,5104316,00115,948−5240823593−129
PA541854664868076809217881657−131
Table A7. Changes in the value of different land cover types (ESVk) in 2000 to 2010.
LPJJJSP
ESV(×106 Yuan)ESV(×106 Yuan)ESV(×106 Yuan)
20002010Variation20002010Variation20002010Variation
Cultivated land22,20421,883−32131,63330,416−121619,87019,247−623
Forest49,27649,52825250,33450,80947429853178193
Grassland6749690615819,32819,66333614491710262
Wetland26682341−32721371761−37566572218−4439
Water bodies5761600724679507838−112471170412330
Bare land000450485

References

  1. Costanza, R.; d’Arge, R.; Groot, R.D.; Faber, S.; Grasso, M.; Hannon, B.; Limburg, K.; Naeem, S.; O’Neill, R.V.; Paruelo, J.; et al. The value of the world’s ecosystem services and natural capital. Nature 1997, 387, 253–260. [Google Scholar] [CrossRef]
  2. Bolund, P.; Hunhammar, S. Ecosystem services in urban areas. Ecol. Econ. 1999, 29, 293–301. [Google Scholar] [CrossRef]
  3. Burkhard, B.; Petrosillo, I.; Costanza, R. Ecosystem services—Bridging ecology, economy and social sciences. Ecol. Complex. 2010, 7, 257–259. [Google Scholar] [CrossRef]
  4. Escobedo, F.J.; Kroeger, T.; Wagner, J.E. Urban forests and pollution mitigation: Analyzing ecosystem services and disservices. Environ. Pollut. 2011, 159, 2078–2087. [Google Scholar] [CrossRef] [PubMed]
  5. Groot, R.S.D.; Wilson, M.A.; Boumans, R.M.J. A typology for the classification, description and valuation of ecosystem functions, goods and services. Ecol. Econ. 2002, 41, 393–408. [Google Scholar] [CrossRef]
  6. Troy, A.; Wilson, M.A. Mapping ecosystem services: Practical challenges and opportunities in linking GIS and value transfer. Ecol. Econ. 2006, 60, 435–449. [Google Scholar] [CrossRef]
  7. Costanza, R.; Groot, R.D.; Sutton, P.; Ploeg, S.V.D.; Anderson, S.J.; Kubiszewski, I.; Farber, S.; Turner, R.K. Changes in the global value of ecosystem services. Global Environ. Chang. 2014, 26, 152–158. [Google Scholar] [CrossRef]
  8. Xie, G.; Zhen, L.; Lu, C.; Xiao, Y.; Chen, C. Expert knowledge based valuation method of ecosystem services in China. J. Resour. Ecol. 2008, 5, 911–919. [Google Scholar]
  9. Li, J.; Wang, W.; Hu, G.; Wei, Z. Changes in ecosystem service values in Zoige Plateau, China. Agric. Ecosyst. Environ. 2010, 139, 766–770. [Google Scholar] [CrossRef]
  10. Lin, T.; Xue, X.; Shi, L.; Gao, L. Urban spatial expansion and its impacts on island ecosystem services and landscape pattern: A case study of the island city of Xiamen, Southeast China. Ocean Coast. Manag. 2013, 81, 90–96. [Google Scholar] [CrossRef]
  11. Ng, C.N.; Xie, Y.; Yu, X. Integrating landscape connectivity into the evaluation of ecosystem services for biodiversity conservation and its implications for landscape planning. Appl. Geogr. 2013, 42, 1–12. [Google Scholar] [CrossRef]
  12. Wang, W.; Guo, H.; Chuai, X.; Dai, C.; Lai, L.; Zhang, M. The impact of land use change on the temporospatial variations of ecosystems services value in China and an optimized land use solution. Environ. Sci. Policy 2014, 44, 62–72. [Google Scholar] [CrossRef]
  13. Jim, C.Y.; Chen, W.Y. Ecosystem services and valuation of urban forests in China. Cities 2009, 26, 187–194. [Google Scholar] [CrossRef]
  14. Morri, E.; Pruscini, F.; Scolozzi, R.; Santolini, R. A forest ecosystem services evaluation at the river basin scale: Supply and demand between coastal areas and upstream lands (Italy). Ecol. Indic. 2014, 37, 210–219. [Google Scholar] [CrossRef]
  15. Alexander, A.M.; List, J.A.; Margolis, M.; d’Arge, R.C. A method for valuing global ecosystem services. Ecol. Econ. 1998, 27, 161–170. [Google Scholar] [CrossRef]
  16. Li, G.; Fang, C. Global mapping and estimation of ecosystem services values and gross domestic product: A spatially explicit integration of national “green GDP” accounting. Ecol. Indic. 2014, 46, 293–314. [Google Scholar] [CrossRef]
  17. Scolozzi, R.; Morri, E.; Santolini, R. Delphi-based change assessment in ecosystem service values to support strategic spatial planning in Italian landscapes. Ecol. Indic. 2012, 21, 134–144. [Google Scholar] [CrossRef]
  18. Frélichová, J.; Vačkář, D.; Pártl, A.; Loučková, B.; Harmáčková, Z.V.; Lorencová, E. Integrated assessment of ecosystem services in the Czech Republic. Ecosyst. Serv. 2014, 8, 110–117. [Google Scholar] [CrossRef]
  19. Kreuter, U.P.; Harris, H.G.; Matlock, M.D.; Lacey, R.E. Change in ecosystem service values in the San Antonio area, Texas. Ecol. Econ. 2001, 39, 333–346. [Google Scholar] [CrossRef]
  20. Liu, Y.; Li, J.; Zhang, H. An ecosystem service valuation of land use change in Taiyuan City, China. Ecol. Model. 2012, 225, 127–132. [Google Scholar] [CrossRef]
  21. Estoque, R.C.; Murayama, Y. Examining the potential impact of land use/cover changes on the ecosystem services of Baguio city, the Philippines: A scenario-based analysis. Appl. Geogr. 2012, 35, 316–326. [Google Scholar] [CrossRef]
  22. Mendoza-González, G.; Martínez, M.L.; Lithgow, D.; Pérez-Maqueo, O.; Simonin, P. Land use change and its effects on the value of ecosystem services along the coast of the Gulf of Mexico. Ecol. Econ. 2012, 82, 23–32. [Google Scholar] [CrossRef]
  23. Clerici, N.; Paracchini, M.L.; Maes, J. Land-cover change dynamics and insights into ecosystem services in European stream riparian zones. Ecohydrol. Hydrobiol. 2014, 14, 107–120. [Google Scholar] [CrossRef]
  24. Li, T.; Li, W.; Qian, Z. Variations in ecosystem service value in response to land use changes in Shenzhen. Ecol. Econ. 2010, 69, 1427–1435. [Google Scholar]
  25. Wu, K.; Ye, X.; Qi, Z.; Zhang, H. Impacts of land use/land cover change and socioeconomic development on regional ecosystem services: The case of fast-growing Hangzhou metropolitan area, China. Cities 2013, 31, 276–284. [Google Scholar] [CrossRef]
  26. Lautenbach, S.; Kugel, C.; Lausch, A.; Seppelt, R. Analysis of historic changes in regional ecosystem service provisioning using land use data. Ecol. Indic. 2011, 11, 676–687. [Google Scholar] [CrossRef]
  27. Logsdon, R.A.; Chaubey, I. A quantitative approach to evaluating ecosystem services. Ecol. Model. 2013, 257, 57–65. [Google Scholar] [CrossRef]
  28. Chen, M.; Liu, W.; Tao, X. Evolution and assessment on China’s urbanization 1960–2010: Under-urbanization or over-urbanization? Habitat Int. 2013, 38, 25–33. [Google Scholar] [CrossRef]
  29. Cao, S.; Lv, Y.; Zheng, H.; Wang, X. Challenges facing China’s unbalanced urbanization strategy. Land Use Policy 2014, 39, 412–415. [Google Scholar] [CrossRef]
  30. Liu, H. Comprehensive carrying capacity of the urban agglomeration in the Yangtze River Delta, China. Habitat Int. 2012, 36, 462–470. [Google Scholar] [CrossRef]
  31. Du, J.; Thill, J.C.; Peiserc, R.B.; Feng, C. Urban land market and land-use changes in post-reform China: A case study of Beijing. Landsc. Urban Plan. 2014, 24, 118–128. [Google Scholar] [CrossRef]
  32. Schneider, A.; Mertes, C.M. Expansion and growth in Chinese cities, 1978–2010. Environ. Res. Lett. 2014, 9, 1–11. [Google Scholar] [CrossRef]
  33. Shen, J.; Chen, S.; Yao, S. Study on urban land saving in the economic developed coastal region of China. Chin. Geogr. Sci. 2001, 1, 11–16. [Google Scholar] [CrossRef]
  34. He, C.; Huang, Z.; Wang, R. Land use change and economic growth in urban China: A structural equation analysis. Urban Stud. 2014, 51, 2880–2898. [Google Scholar] [CrossRef]
  35. Deng, X.; Huang, J.; Rozelle, S.; Uchida, E. Growth, population and industrialization, and urban land expansion of China. J. Urban Econ. 2008, 63, 96–115. [Google Scholar] [CrossRef]
  36. Fang, C. New Structure and new trend of formation and development of urban agglomerations in China. Sci. Geogr. Sinica 2011, 31, 1025–1034. [Google Scholar]
  37. National Geomatics Center of China. GlobeLand30. Available online: http://globallandcover.com/ (accessed on 27 May 2015).
  38. Haas, J.; Ban, Y. Urban growth and environmental impacts in Jing-Jin-Ji, the Yangtze, River Delta and the Pearl River Delta. Int. J. Appl. Earth Obs. Geoinform. 2014, 30, 42–55. [Google Scholar] [CrossRef]
  39. Li, F.; Ye, Y.; Song, B.; Wang, R.; Tao, Y. Assessing the changes in land use and ecosystem services in Changzhou municipality, Peoples’ Republic of China, 1991–2006. Ecol. Indic. 2014, 42, 95–103. [Google Scholar] [CrossRef]
  40. Long, H.; Liu, Y.; Hou, X.; Li, T.; Li, Y. Effects of land use transitions due to rapid urbanization on ecosystem services: Implications for urban planning in the new developing area of China. Habitat Int. 2014, 44, 536–544. [Google Scholar] [CrossRef]
  41. Wang, W.; Liu, H.; Li, Y.; Su, J. Development and management of land reclamation in China. Ocean Coast. Manag. 2014, 102, 415–425. [Google Scholar] [CrossRef]
  42. Liu, X.; Qi, S. Wetlands environmental degradation in the Yellow River Delta, Shandong Province of China. Proc. Environ. Sci. 2011, 11, 701–705. [Google Scholar]
  43. Zorrilla-Miras, P.; Palomo, I.; Gómez-Baggethun, E.; Martín-López, B.; Lomas, P.L.; Montes, C. Effects of land-use change on wetland ecosystem services: A case study in the Doñana marshes (SW Spain). Landsc. Urban Plan. 2014, 122, 160–174. [Google Scholar] [CrossRef]
  44. Liu, Y.Y.; van Dijk, A.I.J.M.; de Jeu, R.A.M.; Canadell, J.G.; McCabe, M.F.; Evans, J.P.; Wang, G. Recent reversal in loss of global terrestrial biomass. Nat. Clim. Chang. 2015, 5, 470–474. [Google Scholar] [CrossRef]
  45. China Forestry Data Base. The National Forestry Statistical Yearbook Analysis Report in 2011. Available online: http://cfdb.forestry.gov.cn:443/showpdf.action (accessed on 27 May 2015).
  46. Turner, R.K.; Paavola, J.; Cooper, P.; Farber, S.; Jessamy, V.; Georgiou, S. Valuing nature: Lessons learned and future research directions. Ecol. Econ. 2003, 46, 493–510. [Google Scholar] [CrossRef]
  47. Van, D.B.K.; Vrebos, D.; Staes, J.; Boerema, A.; Bodí, M.B.; Fransen, E.; Meire, P. Evaluation of the accuracy of land-use based ecosystem service assessments for different thematic resolutions. J. Environ. Manag. 2015, 156, 41–51. [Google Scholar]
  48. Baró, F.; Haase, D.; Gómez-Baggethun, E.; Frantzeskaki, N. Mismatches between ecosystem services supply and demand in urban areas: A quantitative assessment in five European cities. Ecol. Indic. 2015, 55, 146–158. [Google Scholar] [CrossRef]
  49. Kabisch, N. Ecosystem service implementation and governance challenges in urban green space planning—The case of Berlin, Germany. Land Use Policy 2015, 42, 557–567. [Google Scholar] [CrossRef]
  50. Buchel, S.; Frantzeskaki, N. Citizens’ voice: A case study about perceived ecosystem services by urban park users in Rotterdam, the Netherlands. Ecosyst. Serv. 2015, 12, 169–177. [Google Scholar] [CrossRef]

