Article

Assessing the Determinants of Renewable Electricity Acceptance Integrating Meta-Analysis Regression and a Local Comprehensive Survey

Department of Economics, University of Perugia, Via A. Pascoli n. 20, 06123 Perugia, Italy
*
Author to whom correspondence should be addressed.
Sustainability 2015, 7(9), 11909-11932; https://doi.org/10.3390/su70911909
Submission received: 27 May 2015 / Revised: 20 August 2015 / Accepted: 21 August 2015 / Published: 27 August 2015
(This article belongs to the Section Environmental Sustainability and Applications)

Abstract

:
In dealing with renewable electricity (RE), individuals are involved both as end-consumers on the demand side and as stakeholders (citizens) in the local production process on the supply side. Empirical evidence shows that in many countries, consumers are willing to pay a significant amount to facilitate adoption of RE. By contrast, environmental externalities are often the cause of strong opposition to RE adoption if local communities are involved as stakeholders in wind, solar or biomass investment projects. Looking at the literature on willingness to pay and on willingness to accept, we have investigated RE acceptance mechanisms. First, we have used the meta-analysis to assess the major determinants of RE acceptance on both demand and supply sides. Meta-analysis has provided some insights useful for managing field research on an onshore wind farm enlargement project located in the Umbria region. Meta-analysis and survey results confirm that the local community plays a central role in local RE acceptance. Furthermore, people who have previous experience with windmills require less compensation, or are willing to pay more, for RE development. Results suggest that these attributes should be included in future research to improve understanding of determinants of RE acceptance.

1. Introduction

Climate change has become a scientific problem of global interest in the 21st century [1]. Today, the consequences of the use of fossil energy are seen from a different perspective because the issues related to climate change are evident worldwide. Thus, climate change and resource depletion are real problems to be addressed for the welfare of society. In this context, renewable electricity (RE) is essential to reduce polluting emissions, even if it can produce a range of environmental effects that might be detrimental to human activities, as attested by the “Not In My Back Yard” (Nimby) syndrome. [2]. This is because the infrastructure-siting process is usually characterized by different pros and cons for the local community, and, often, negative environmental externalities cause a strong opposition to RE diffusion. Nevertheless, empirical evidence also shows that in many countries, individuals are willing to pay to support RE. These results seem to suggest that individuals demonstrate different behavior according to the role they take on. As stakeholders, on the supply side, they are more affected by local negative externalities, while as consumers, on the demand side, they are more affected by global positive externalities due to RE.
In this paper, we survey existing literature related to RE adoption, taking into account this double role played by individuals. We have addressed an important area of the economic analysis by investigating the literature on willingness to pay (WTP) and the willingness to accept (WTA) related to RE. Consequently, we have analyzed the relationship between RE, consumers and citizens, focusing on the literature related to demand and supply. We have surveyed research evaluating both attitude of consumers towards RE use and likelihood of citizens’ acceptance of new RE investment projects.
In particular, on the demand side, we have analyzed WTP for RE use. We want to stress that we have not considered “labeled green electricity” such as in Ek and Söderholm [3] or “green power products” such as in Wüstenhagen et al. [4]. In surveyed studies, authors have investigated a stated intention to purchase a generic RE. In other words, respondents are generally asked if they want voluntarily to contribute to RE development by purchasing more RE. In this context, we have focused on the main determinants of respondents’ choices.
On the supply side, we have considered studies that use a contingent valuation (CV) method and choice experiment (CE) to evaluate acceptance of green investment programs in the energy sector. We have focused on the local community reaction in terms of opposition to and acceptance of investment projects pointing out the main determinants of project outcomes.
The paper, therefore, is not about how to reconcile consumers’ and citizens’ behaviors; rather, it explores the main determinants of people’s behavior for a better understanding of the preferences involved in the double role considered.
The method used is mixed. First, we have analyzed related literature by meta-analysis regression, then, using results obtained by meta-analysis, we have conducted a preliminary survey assessing perceived net benefits associated with an onshore wind farm enlargement project in the Umbria region.
The general aim of this paper is to better understand the mechanisms related to RE acceptance. In detail, we expected to build our knowledge and understanding on three fronts. First, we jointly investigate consumers’ and citizens’ attitudes towards RE, allowing a better understanding of whether common determinants exist in the acceptance process. Second, we deeply analyze local community characteristics focusing on collective dimensions such as “sense of place” or “place attachment” that are important psychological and emotional determinants. Third, we assess how day-to-day experience with windmills, which were erected in 1990 in this region, affected local community attitudes toward new wind projects. All these points have been rarely investigated in the literature so we deem that our results can improve knowledge on the determinants of RE. Finally, we also discuss conclusions that can be drawn from the Umbria case for RE sector development.
The paper is organized as follows. In Section 2, we briefly discuss methods used, presenting the related literature. The method is applied in Section 3 and obtained results are discussed. Section 4 presents our conclusions and possible insights for the RE sector.

2. Method

The meta-analysis is a useful tool for comparison and synthesis of various studies and research. In the social sciences, and especially in behavioral studies, the meta-analysis is useful because it allows for the comparison of similar results, given the semi-controlled nature of the experiments that are conducted in these fields [5]. The meta-analysis consists of a series of techniques that allow researchers to generate more information through a synthesis, and interpretation keys, starting from primary sources that make up the body of knowledge available.
The work can be divided into four phases. In the first phase, we proceed to examine and catalog the primary sources according to the criteria specified above. In the second phase, we specify the research questions that can help to advance the degree of knowledge according to the aim of this paper. In the third phase, we have regressed the primary information using the meta-analysis approach. Insights from meta-regression results have been used in the local survey that we have conducted on the enlargement project of the existing windmill in a central area in Umbria.
In this way, we have combined two methods, meta-analysis, that is quantitative, and a qualitative comprehensive local survey. This is a hybrid design approach [6] that allows us to capture both qualitative and quantitative aspects of our research question.

2.1. Related Literature

The meta-analysis can be defined as “the study of studies” [7] because it uses a wide range of individual publications (primary sources) in order to integrate and summarize literature results [8].
In this section, we present existing literature that led us to formulate our research questions. To do this, we clarify criteria used to reduce existing heterogeneity, then we present relevant topics for our case study and, finally, we formalize our research questions contextualizing them within the current literature.

2.1.1. Criteria Selection

An overview of the primary studies used in the meta-analysis is provided in this section. We have collected several papers related to RE acceptance according to the double perspective described in the introduction. The incongruence between the RE demand and supply side has been underlined, among others, by Groothuis et al. [9] and Ek and Matti, [10]. Nevertheless, the majority of the reviewed papers deal with only one out two perspectives. Consequently, they are characterized by high heterogeneity. In line with Nelson and Kennedy [11], we examined the literature in terms of factual and methodological heterogeneity.
Factual heterogeneity is related to some main characteristics such as type of respondents, type of infrastructure or site characteristics, localization, context and period of investigation. Methodological heterogeneity concerns the study design adopted such as the survey method used, information collected, type of data and econometric technique.
In the case of RE studies, the first kind of heterogeneity is usually represented by variables related to three main categories of determinants: (a) type of respondents; (b) institutional and contextual conditions; and (c) project and service characteristics. Type of respondent can be an individual, such as Alvarez-Farizo and Hanley [12], Batley et al. [13,14], Bergmann et al. [15], Borchers et al. [16], Botetzagias et al. [17], Byrnes et al. [18], Ek and Matti [10]; Goett et al. [19], Groothuis et al. [9], Hanemann et al. [20], Hansla et al. [21], Koundouri et al. [22], Meyerhoff et al. [23], Meyerhoff [24], Mirasgedis et al. [25], Strazzera et al. [26] and Zhang and Wu [27]; the head of family [28] or the homeowner [29] but scholars often refer to the “family” as a “unified” research unit, such as Bigerna and Polinori [30,31], Bollino [32], Dimitropoulos and Kontoleon [33], Grösche and Schröder [34], Kim et al. [35], Ivanova [36,37], Nomura and Akay [38] and Zorić and Hrovatin [39].
The use of the family in the economic research is an open research question. Casimir and Tobi [40] have highlighted that rarely a theoretical or operational definition of the concept of household is provided. Consequently, we have preferred to disregard this aspect, focusing on studies in which the respondent is an individual or the household is treated as a single unit.
Nevertheless, since the seminal papers of Portney [41], Blamey et al. [42] and Sagoff [43], it is well known that another important source of heterogeneity is related to the respondents according to the consumers vs. citizens’ dilemma.
By referring to the topic of this paper, Huijts et al. [44] have underlined the importance of the consumers vs. citizens’ dilemma. They have investigated this dilemma in terms of energy technology acceptability distinguishing between citizen and consumer acceptance [44] (p. 526): in the first case, preferences are concerned with “siting decisions”, while, in the second one, respondents are mainly asked to purchase preexisting technology services.
In this paper, we have used this distinction that primary reflects the differences between the two groups of papers (demand vs. supply side) even if one distinction exists within the demand side group [14].
Characteristics related to the respondents are numerous. Apart from characteristics such as age, gender, education, environmental or cultural membership and political attitude, we have also found a study that has analyzed both attitude vs. several types of environmental risks and peculiar aspects associated with history of the respondents and his/her family. In particular, we have taken into account how long the interviewee and his/her ancestors have lived in the area because this characteristic affects WTP and WTA. Furthermore, empirical evidences confirm that newcomers generally differ from long-term residents in terms of RE acceptance [45].
The second category refers to the scenario proposed in the empirical analysis. Several reviewed papers proposed a policy scenario, incorporating clear environmental targets, such as Batley et al. [13,14], Bergmann et al. [15], Bigerna and Polinori [30,31], Bollino [32], Grösche and Schröder [34], Kim et al. [35], Koundouri et al. [22], Ivanova [36,37] and Yoo and Kwak [28].
Almost all of the authors have considered CO2 emission reductions as a result of changes proposed in the studies even if it is puzzling to compare the environmental impact of different renewable energy sources (RES), recent harmonized results seem to confirm that wind power emerged as the RES with the lowest impact [46]. Only in a few cases [10,15] were additional job opportunities considered. A subgroup of papers [12,15,23,24,45] have focused on the visual impact of windmills in value areas trying to explain the main determinants of the acceptance (or of the oppositions), while other papers simply consider the economic constraints to the RE development, especially on the demand side. Other important characteristics refer to the impact on the fauna and landscape; however, the Nimby syndrome is the main issue considered in the literature.
According to Wolsink [2] (p. 57), considering project characteristics such as location is important in order to distinguish among different types of Nimby syndromes. Several authors have dealt with this crucial aspect—see, among others, Navrud and Bråten [47]—also trying to quantify the impact of the institutional factor and/or the role of the local community’s attitude towards windmills. Other authors have extensively investigated the local community, focusing on social relations and on residents’ attachment to the territory.
Finally, important characteristics can be connected to the type of goods under evaluation. On the demand side, the main characteristic considered is related to the energy mix used in RE generation—see, among others, Borchers et al. [16], Goett et al. [19], and Kim et al. [35]—if a generic RE is not proposed. More varied is the literature on the supply side. Characteristics involved are related to the localization of the windmills [15,26]; tail of the towers and their numbers are also important characteristics [23,24] both related with the wind farm size. In some cases, type of camouflage is also considered [45] as is institutions involved in realization and management of the project and/or of the wind turbines [26].
Methodological heterogeneity is related to several aspects of empirical analysis used in the literature reviewed. Several types of surveys have been used, though face-to-face interviews represent the most frequent approach among the studies related to the supply side [12,26,33], and some scholars have also used this type of interview on the demand side [16,28,35,39]. Among several elicitation methods, CE [10,12,15,16,18,19,23,24,26,29,33,34] and CV are more intensively adopted among researchers. In the CV approach, the open-ended elicitation method has been used by Mirasgedis et al. [25], while the single bounded elicitation method has been used by Ivanona [36,37], Batley et al. [13,14] and Zoric and Hrovatin [39]. Double bounded elicitation method has been applied by Groothuis et al. [9], Groothuis [45], Koundouri et al. [22], Nomura and Akay [38] Kim et al. [35] and Yoo and Kwak [28]. Finally, payment card has been utilized by Hansla et al. [21], Bollino [32] and Bigerna and Polinori [31].
WTP is the only welfare measure used, given that only a few scholars have used WTA [9,25,26,45].
According to Lancaster’s [48] theory of consumption, CE allows obtaining a more detailed representation of goods under evaluation, linking their use by respondents to the primary characteristics of the good evaluated. On the other hand, CV outcomes are more accurate, especially when the scenario proposed involves a policy targeting the goods being evaluated [49].
In conclusion, a large number of papers have been taken into account according to the aim of this paper. We have focused on some aspects potentially useful for our field research. We have selected papers that, directly or indirectly, dealt with the issue of the type of respondents. Second, we have found papers in which a policy scenario, or a clear project, has been proposed. Finally, papers related to the local community are also included in our review. The outcome of this selection is a sample of more than 30 papers almost equally divided between the demand and supply side, published from 1999 to 2014 and mainly related to European, North American and Asian countries. It might appear as though the number of primary studies is low, however, in meta-analysis, the number of primary information that can be derived from primary studies is also important. We use more than 30 papers, which is a common sample size for meta-analyses, which allows us to manage about 300 primary information sources. International literature provides papers that use fewer primary studies. For instance, Mirasgedis et al. [25] conducted a meta-analysis using 10 papers.

2.1.2. Topics of Interest

Given that RE is mainly obtained by hydropower and photovoltaic in the Umbria Region, both close to their maximum capacity, wind power has become the most important RES for achieving the next European Climate Policy target. See Communication COM (2014) No. 15, 22 January 2014, non-legislative resolution based on own initiative procedure, 2013/2135 (INI). According to this regional energy scenario, the knowledge of the determinants of RE acceptance/opposition both on demand and supply sides has become a crucial point in the regional energy policy.
From the surveyed literature, it is shown that, in general, RE is perceived by consumers as clean and environmentally friendly. Nevertheless, the establishment of the related infrastructure appears to be a difficult process due to local opposition [50]. This is particularly true for wind energy, biomass, as well as for large size photovoltaic plants, as underlined by Wüstenhagen et al. [51] and Kaldellis et al. [52].
Due to the strategic role that wind power is going to play in the Umbria Region, we have focused on this RES on the supply side. Through this decision, we have also been assisted by the substantial research on the main drivers of public acceptance/opposition towards on-shore wind farms, see, among others, Aitken [53], Cass and Walker [54], Devine-Wright [55], Jobert et al. [56] Read et al. [57], van Rensburg et al. [58], Rowlands et al. [59], and Stigka et al. [60]. Commenting on the attitude of the people towards RE, we have focused on four main questions that are of interest in the empirical analysis due to their relevance to the Umbria Region:
(a)
The role of individual and household characteristics in supporting RE.
(b)
The role of the perception of risk to amenity in attitude towards windmills.
(c)
The role of the local community attachment to the territory in attitude towards windmills.
(d)
The role played by the existing windmills in the analyzed area both in attitude towards windmills and in supporting RE.
This last topic is related to the impact of existing wind farms on the attitude and preferences of respondents. This topic has not been investigated adequately in the literature and our results can improve general knowledge on it. In the meta-analysis, controlling for heterogeneity, we have also tried taking into account these aspects whenever possible.

2.1.3. The State of the Art

How individual characteristics impact on RE acceptance has been extensively investigated in the literature both on demand and supply sides. A general agreement exists on the positive impact of education on both sides [22,29,45,61], even if some exceptions exist. For instance, in Ek and Söderholm [3], education degree is not significant, while, in Kim et al. [35] and Zhang and Wu [27], education reduces elicited WTP. On the contrary, Groothuis et al. [9] found that WTA is reduced by education.
Gender is another characteristic widely investigated. The expectation is that women are willing to pay less due to their lower incomes and, consequently, males and females differently value costs and benefits related to RE. Ek and Persson [61] have obtained this result for several wind firm attributes, while Kounduri et al. [22] did not obtain analogous results. Several scholars have found gender differences on the demand side. Women are willing to pay less according to Bigerna and Polinori [31], Bollino [32] and Ivanona [36]. In Jiangsu province, Zang and Wu [27] also found that females are willing to contribute less, especially as the amount of payment required increased. Finally, insignificant results were obtained in Borchers et al. [16], Ek and Söderholm [3] and Zoric and Hrovatin [39].
Another important characteristic often analyzed in the literature is the age of the respondent. In this case, varied results can be found in the literature. In general, younger people are more likely to support RE on both sides [3,15,29,31,36,37,39]. Sometimes, variables related to the age of respondents are simply not significant [22,27,28,32,45]. Finally, more articulate results arise in some cases. Groothuis et al. [9] found that age does not affect, WTA even if increases in age reduce participation in green programs. Kim et al. [35], testing for several RES, have found that age only negatively affects WTP for hydropower. Finally, Borchers et al. [16] have pointed out that RE is preferred both by respondents over 50 and under 30.
Many other individual characteristics have been investigated in the literature such as income, household size, homeownership, environmental awareness and knowledge of RE.
With rare exceptions, income is always positively related to WTP (or negatively related to WTA) for RE or increased participation in RE projects [9,16,28,31,32,34,35,39]. Income is not significant in Ivanova [36,37], Hanemann et al. [20] and Kounduri et al. [22], while in Groothuis [45], the correlation was negative, indicating that there were no change in attitudes in Mountain View due to the windmill. Ek [29] has also found a negative relationship between income and support for RE due to occupational effect on lower income respondents. Finally, Zhang and Wu [27] point out that different relationships exist between WTP and income according to how much the respondents had to pay, while Grösche and Schröder [34] found income to be insignificant.
Family size negatively affects support for RE in Bigerna and Polinori [31], Kounduri et al. [22] and Zoric and Hrovatin [39].
Scholars sometimes take homeownership into account. The hypothesis is that a homeowner will be more affected by the technology. For example, the realization of new windmills close to the property could reduce the value of the house. On the other hand, homeowners may be more affected by electricity price variations due to RE diffusion. Consequently, the expectation is that homeownership could reduce support for RE. Nevertheless, variables related to homeownership are not significant [31,32,39].
Finally, environmental awareness and knowledge of RE increase the support for [30,31,32,35,39] and the participation [9,16] in RE programs.
The perception of risk to amenity considered in this paper mainly refers to two environmental traits: CO2 concentration in the atmosphere and visual intrusion. We have just seen in this section that reduction of the first characteristic is commonly used to describe the benefits of RE diffusion.
The second trait is the most important negative impact associated with on-shore wind farm projects. Several scholars have directly investigated this aspect. Alvarez-Farizo and Hanley [12] found that landscape impact is valuated less in monetary terms than impacts on flora and fauna. Groothuis et al. [9] estimated a significant reduction in the acceptance of electrical windmills due to mountain view intrusion. Mirasgedis et al. [25] have obtained similar results in terms of WTP reduction to support siting of on-shore wind farms. In Italy, Strazzera et al. [26] confirm that visual impact is crucial, especially if residents involved in the projects have experienced windmills before. Meyerhoff et al. [23] have conducted an articulate analysis pointing out, among other results, that distances from residential areas and the small size of windmills both contribute to increased acceptance of wind projects with reduced landscape intrusion. Meyerhoff [24] confirms this result, also introducing a spatial model in the analysis. On the other hand, van Rensburg et al. [58], analyzing 345 wind farm applications and planning authority decisions in Ireland, have pointed out that proximity to residential areas does not affect planning outcomes; visual intrusion and identity of appellants appear to be more important.
These results confirm that amenity risk perception seems to be a central aspect in the siting process of windmills especially if local communities are directly involved in terms of environmental externalities.
Local communities play a central role in the wind farm siting and realization process. Jobert et al. [56] underline that local actors affect acceptance of wind energy. Van Rensburg et al. [58] obtain the same result by focusing on local authority decisions. Read et al. [57] identify several local community attributes related to wind farm project opposition, partially confirming the results of Jobert et al. [56].
The presence of community members able to influence local residents is the key variable associating the opposition process to past opposition behaviors. Less relevant seem to be proximity, visual perception and sense of place. Place attachment is also analyzed by Groothuis et al. [9] taking into account how long respondents have lived in the location of the wind project. Results point out that those who have ancestors in the area required higher compensation to accept electrical windmills. Similar results are obtained by Strazzera et al. [26].
Finally, few studies have analyzed the impact of having previously experiencing wind farms on the local acceptance and opposition mechanisms. To the best of our knowledge, only Koundouri et al. [22] Meyerhoff et al. [23] Meyerhoff [24] and Strazzera et al. [26] have explicitly taken into account this aspect referring to on-shore wind farms. Results confirm that respondents’ previous experience with windmills influences welfare measures. In Germany, Meyerhoff et al. [23] and Meyerhoff [24] found that respondents who live in proximity to windmills are more willing to accept new wind projects. Strazzera et al. [26] underline that those residents in municipalities that have experience with wind farms pay more attention to technical characteristics of the new wind energy project.
In the next section, we analyze in a quantitative way the literature reviewed and selectively control for publication characteristics and heterogeneity sources.

2.2. The Meta-Analysis

WTA and WTP are neoclassical welfare measures used for policy analysis. Formally, we used an indirect utility function (v) defined over a vector of goods (G) purchased at prices p, a rationed good RE, and income M [31]; consequently, we can obtain WTP and WTA solving the following equations:
v(M, G, RE0) = v(M – WTP, G, RE1)
v(M, G, RE1) = v(M + WTA, G, RE0)
The WTP/WTA for a marginal increase of production of RE is defined as the ratio of the marginal utility of the production of RE and the purchase price of property attributes:
WTP / WTA = ± ( U / RE RE / P )
We assume that U is a linear stochastic utility function for the individual, with the production of RE, the purchase price P and a vector of other variables. We must therefore define the WTP as the ratio of the coefficient of the production of RE, βRE and the purchase price βP:
WTP / WTA = ± ( βRE βP )
These coefficients are estimated using information derived from the existing literature, and the estimates of the WTP/WTA depend on the reference level used for the calculation. In the literature, these reference levels are usually calculated as the average level of production of RE and the purchase price used in the survey. Reference levels can vary considerably between primary studies so the comparison of WTP/WTA values obtained using different utility function specifications can be difficult and puzzling. From a theoretical point of view, see Equations (1a) and (1b), a measure that circumvents this problem is the compensating variation, which reflects the change in the economic welfare of an individual caused by a change in the level of consumption of a good. In other words, the compensating variation is the monetary compensation necessary after a change in the level of the good consumed to restore the same level of welfare that the individual had before the occurrence of the changes. However, if we assume that the utility function is linear in the production of RE, the compensating variation is simply equal to the product of the marginal WTP/WTA in relation to the proposed change. For each study, we take into account, as much as possible, the value of RE1/RE0 and the ΔRE objective of the environmental policy. According to meta-analysis literature [11,62,63], we have formulated Equations (4a) and (4b) showing meta-regression models used to explain the variation of the logarithm of the estimates of the WTP and WTA.
Equation WTP for RE
ln ( W T P q ) = α + β R E l n ( R E q ) + i = 1 I δ P U i P U i , q + j = 1 J δ F A C j F A C j , q +   ( 4 a )     + k = 1 K δ M E T k M E T k , q + ϵ q
where ln (REq) is the natural logarithm of the average level of consumption of the REq reported in or assumed by the q-primary study. PUq is a vector of I dummy variables indicating whether the primary study is published in a peer-reviewed journal and if the period of publication is after 2007 (in particular, we focus on pre- or post-crisis). FACq denotes a vector of J dummy variables related to factual heterogeneity and indicating the location of the study; the different composition of RES used in electricity generation; the type of respondent; if environmental awareness and knowledge of RES are verified; and if a clear policy target is proposed to interviewees. METq is a vector of K dummy variables related to methodological heterogeneity such as the elicitation format, survey type and the treatment of uncertainty. Finally, εq is an error term with mean zero and variance σq.
Equation WTP/WTA for on-shore wind farm
ln ( W T A q / W T P q )        = α + β R E l n ( R E q ) + i = 1 I δ P U i P U i , q +   ( 4 b ) j = 1 J δ F A C j F A C j , q        + k = 1 K δ M E T k M E T k , q + ϵ q
Adding some variables, and deleting others, in Equation (4a), it is possible to analyze WTP/WTA for the on-shore wind farm siting process. We have extended the previous model, taking into account the FACq vector, some technological characteristics such as the distance of the windmills and the installed capacity, and if visual intrusion is taken into account. Furthermore, we have considered the type of opposition of the local community and other characteristics of the local community. In addition, the welfare metrics used are also considered in the methodological category.
Both equations are estimated using unweighted and weighted least square estimators. In particular, weighted ordinary least square (OLS) is superior to conventional random effects estimator when meta-analysis refers to a small sample [64], such as in our paper.

2.3. The Survey

This survey is included in a broader CV study in which the monetary evaluation is obtained through the development of a hypothetical market. We use the result of the preliminary survey to test the questionnaire. This survey was conducted at the end of June 2012 to capture local communities’ attitudes both towards RE in general and to a new wind project. Furthermore, we have focused on the attitude of the community towards new wind farm projects.
We have interviewed individuals who live in a municipality close to an on-shore wind farm to investigate their attitude towards RE in order to appraise both the acceptability of the improvement of the existing wind farm and the support that interviewees are willing to provide to RE production.
Respondents are asked if they perceive the project as positive and consequently if they want to support the project (WTP). Otherwise, respondents can declare their opposition to the projects, due to their negative perception, and consequently they are asked if they are willing to accept a monetary compensation for the project (WTA).
The respondents have dealt with a development project of an existing on-shore wind farm. The project involves the installation of 16 towers for wind generation of electricity. Precisely, the plan should provide for the installation of four towers reaching 40 to 60 m in Pian di Spilli (Municipality of Costacciaro), in Val di Ronco (Municipality of Sigillo) and eight similar towers in the municipalities of Scheggia Pascelupo and Fossato di Vico. Each tower will have a maximum power of 1 MW. The questionnaire includes three sections. Initially, we tested respondents’ specific knowledge on RES and sustainability. In the second section, we investigated respondents’ attitudes towards potential benefits and environmental damage associated with the project.
The CV scenario included the possibility for respondents to state if they wanted (or not) to support the project, accounting for their choice. In the first case, WTP is examined while in the second one WTA is measured. According to Frew et al. [65] and Lunander [66], among several elicitation formats, we have adopted the open-ended contingent valuation as providing the most prudent estimates of “true” economic value. The last section of the questionnaire is aimed at measuring respondents’ socio-demographic and -economic characteristics, ensuring us a means to investigate how socio-economic factors influence WTP and WTA.
Face-to-face interviews were conducted by the authors using a sub-sample population representative in terms of demographic features according to the 2011 population census.

3. Results and Discussion

In this paper, we apply the meta-analysis for RE WTP/WTA studies both on the demand and supply sides. We have reduced selection distortion, using as much as possible the published and working papers, by correcting for heteroscedasticity. In this regard, we prefer to focus our attention on the impact of different empirical methods on the final results of the study, rather than provide a simple summary of the main results of the literature. To do this, we have classified all the variables into four categories: (a) calculated variables; (b) variables related to publication; (c) factual variables; and (d) methodological variables.
In the first category, data collected have been transformed into comparable information converting original data into kWh for consumption and production data. In other words, both WTP for RE households’ consumption and WTP/WTA for wind farm production refer to kWh. Furthermore, to conduct the full comparative assessment of the studies, the estimated values of WTP and WTA have been converted to 2013 EUR and recalculated as a percentage of GDP per capita to compensate for income differences. Consumption data are available at World Energy Council [67]. For the UK, additional information are available at Department of Energy and Climate Change [68]. For Italy, additional information are available at Terna, the Transmission System Operator, [69] and GSE [70] that is the state-owned company which promotes and supports RES in Italy. Information on capacity factors are gathered by EIA [71] and IEA wind [72]. Finally, information on exchange rates and deflators are gathered by Blomberg [73] and Oanda [74], respectively.
The other three categories simply refer to different sources of heterogeneity described in Section 2. Finally, we want to underline that in both models we use log-linear specification. First, we use the logarithmic transformation of the estimates of the WTP/WTA for the dependent variables because the transformed data are less sensitive to the problem of heteroscedasticity. Second, our sample contains some negative estimates of WTP that are lost due to the logarithmic transformation (less than 10%).

3.1. WTP for RE

With reference to the demand side, we use 18 studies that take into account the WTP for RE; empirical results are shown in Table 1. According to the variable classification, we can see that there is a negative effect on the WTP caused by the level of total RE consumption.
Table 1. Meta-analysis regression of WTP for RE.
RHSUnweighted OLS (uOLS)Weighted OLS (wOLS)
CalculatedlnRE−0.804***−0.611***
0.058 0.046
PublicationPU: after 2007n.s. n.s.
PU: ISI journal0.111**0.051*
0.053 0.033
FactualFAC: Europe0.515**0.521**
0.122 0.037
FAC: U.S.−0.532*−0.299*
0.299 0.087
FAC: Wind−0.622***−0.659***
0.077 0.061
FAC: Green genericn.s. n.s.
FAC: Individualn.s. n.s.
FAC: Env. Awareness0.045**0.032*
0.021 0.019
FAC: Knowledge RE0.025**0.015*
0.011 0.009
FAC: Specified targetn.s. n.s.
MethodologicalMET: Payment card−0.491***−0.467***
0.034 0.034
MET: Choice experimentn.s. n.s.
MET: Double bound DCn.s. n.s.
MET: Face to Facen.s. n.s.
MET: Uncertainty0.335**0.387**
0.148 0.122
MET: Small sample−0.276**−0.347***
0.098 0.045
Const.0.457***0.502***
0.054 0.071
Obs. 189; R-sq. adj.: uOLS = 0.753; wOLS = 0.835. RMSE: uOLS = 0.324; wOLS = 0.232. Prob F.: uOLS = 1.5 E-04; wOLS = 2.4 E-04. St. err. in italic.*** sig. at 1%; ** sig. at 5%; * sig. at 10%; n.s., not significant.
Period of publication is not significant, while the paper being published on ISI positively affects WTP. Among the factual variables, a negative effect is evident in studies conducted in the USA, while the effect is positive in European studies.
Studies that differentiate renewable energy mix found a negative effect on WTP when wind energy is taken into account. This is interesting because it confirms that wind energy is perhaps seen by the public as a potentially environmentally dangerous RES. The results related to individual characteristics are also interesting, given that studies in which environmental awareness is taken into account found a positive effect on WTP for RE.
Furthermore, smaller positive effects are also due to “knowledge of RES” confirming that providing information on RE to the consumers increases the acceptability of RE. Surprisingly, the parameter associated with the policy target is not significant.
This means that the definition of a clear environmental target does not affect the WTP of respondents. A possible explanation is that currently environmental policy uses too many strategies and, consequently, environmental targets are not clear to the citizens that perceive a lack of policy efficacy [75].
Controlling for methodological aspects, we find that a negative effect is due to studies that use payment cards or small samples. The results are robust when using both normal and weighed OLS.

3.2. WTA and WTP for On-Shore Wind Farm

With reference to the supply side, we use 13 studies of various externalities related to wind farms by estimating the WTP (10 studies) or the WTA (three studies). Results are shown in Table 2.
We can, again, see that that there is a negative effect on the WTP caused by the level of total RE production. In this model, both period of publication and type of publication are not significant. The positive effects among European studies are confirmed while the results related to other factual characteristics are very interesting.
Assuming that distances equal to or above 10 km do not lead to visual impact, we dichotomized the information using a dummy variable that takes the value zero for distances below 10 km. Parameter estimates confirm that distance increases the WTP for RE produced. Citizens are willing to pay to move windmills far away, and this means that increase in distance positively affects attitudes towards RE generation.
For the installed capacity, when the original data were not available, we calculated them assuming a standard power for each turbine of 2 MW; in the case of a study in which it was possible to infer the production of electricity, it has been edged up to capacity by using load factors between 25% and 30%. Coherent with the literature results, the estimate parameter is significant and negative suggesting that people are willing to pay less if a large size wind firm is proposed.
Environmental impact of wind projects is analyzed using several factual variables. The type of resistance was dichotomized into a variable, which takes the value one if it is Nimby syndrome and zero otherwise. Results confirm that Nimby syndrome consistently reduces the RE acceptance. Visual intrusion has the same effects even if its estimate parameter is smaller.
Environmental awareness and knowledge of RES are also considered in this model. The parameter associated with the first dummy is greater and becomes negative in this model with respect to parameters estimated in Section 3.1. Considering that visual intrusion is estimated separately, this result points out that environmental negative externalities are perceived more intensely when respondents are directly involved in electricity generation. It is also interesting to underline that the parameter associated with knowledge of RES is not significant, suggesting that information on RES may not be decisive—in the context of investment projects—in increasing the acceptability of RE. Dummy variables related to local community are not significant either. This dummy takes the value one if the results are related to investigations conducted at the local level with the specific development projects, and zero otherwise. This result is not surprising because there are few studies conducted at a local level and because the variable local community needs a more detailed specification that we have introduced in the local survey.
Table 2. Meta-analysis regression of WTP/WTA for on-shore wind farm.
RHSUnweighted OLS (uOLS)Weighted OLS (wOLS)
CalculatedlnRE−0.361***−0.305***
0.031 0.023
PublicationPU: after 2007n.s. n.s.
PU: ISI journaln.s. n.s.
FactualFAC: Europe0.253**0.259**
0.056 0.021
FAC: Nimby−0.912**−0.969***
0.023 0.015
FAC: Distance0.832***0.818***
0.003 0.005
FAC: Installed capacity−0.053*−0.077*
0.041 0.034
FAC: Visual intrusion−0.031*−0.027*
0.021 0.020
FAC: Individualn.s. n.s.
FAC: Env. Awareness−0.108*−0.097*
0.075 0.052
FAC: Knowledge of RESn.s. n.s.
FAC: Experienced WF0.081**0.075**
0.033 0.030
FAC: Local communityn.s. n.s.
FAC: Scenarion.s. n.s.
MethodologicalMET: Choice experiment−0.473***−0.406***
0.038 0.032
MET: Face to Face−0.863***−0.925***
0.008 0.008
MET: WTA0.830**0.617**
0.012 0.018
MET: Small sample−0.130**−0.183***
0.046 0.029
Const.0.220***0.247***
0.030 0.042
Obs. 119; R-sq. adj.: uOLS = 0.604; wOLS = 0.671. RMSE: uOLS = 0.392; wOLS = 0.344. Prob F.: uOLS = 1.3 E-04; wOLS = 1.5 E-04. St. err. in italic.*** sig. at 1%; ** sig. at 5%; * sig. at 10%; n.s. not significant.
The variable related to the policy scenario is not significant; we deem that the same reason underlined in the previous model can be put forward. Finally, studies conducted in areas where respondents have experienced windmills found a positive effect of WTP for RE, confirming that respondents exposed to windmills for medium or long periods are more supportive of wind power development.
Controlling for methodological aspects, we found that CE affects negatively WTP for RE production. This can be explained considering that the CE approach produces more conservative WTP estimates. Furthermore, as discussed in the theoretical model, the use of the WTA produces an increase of the amounts elicited consistent with the fact that this metric is not in any way bound to the income of the respondent. Finally, we see that small sample studies tend to provide lower WTP even if the weighted OLS estimator has been used.

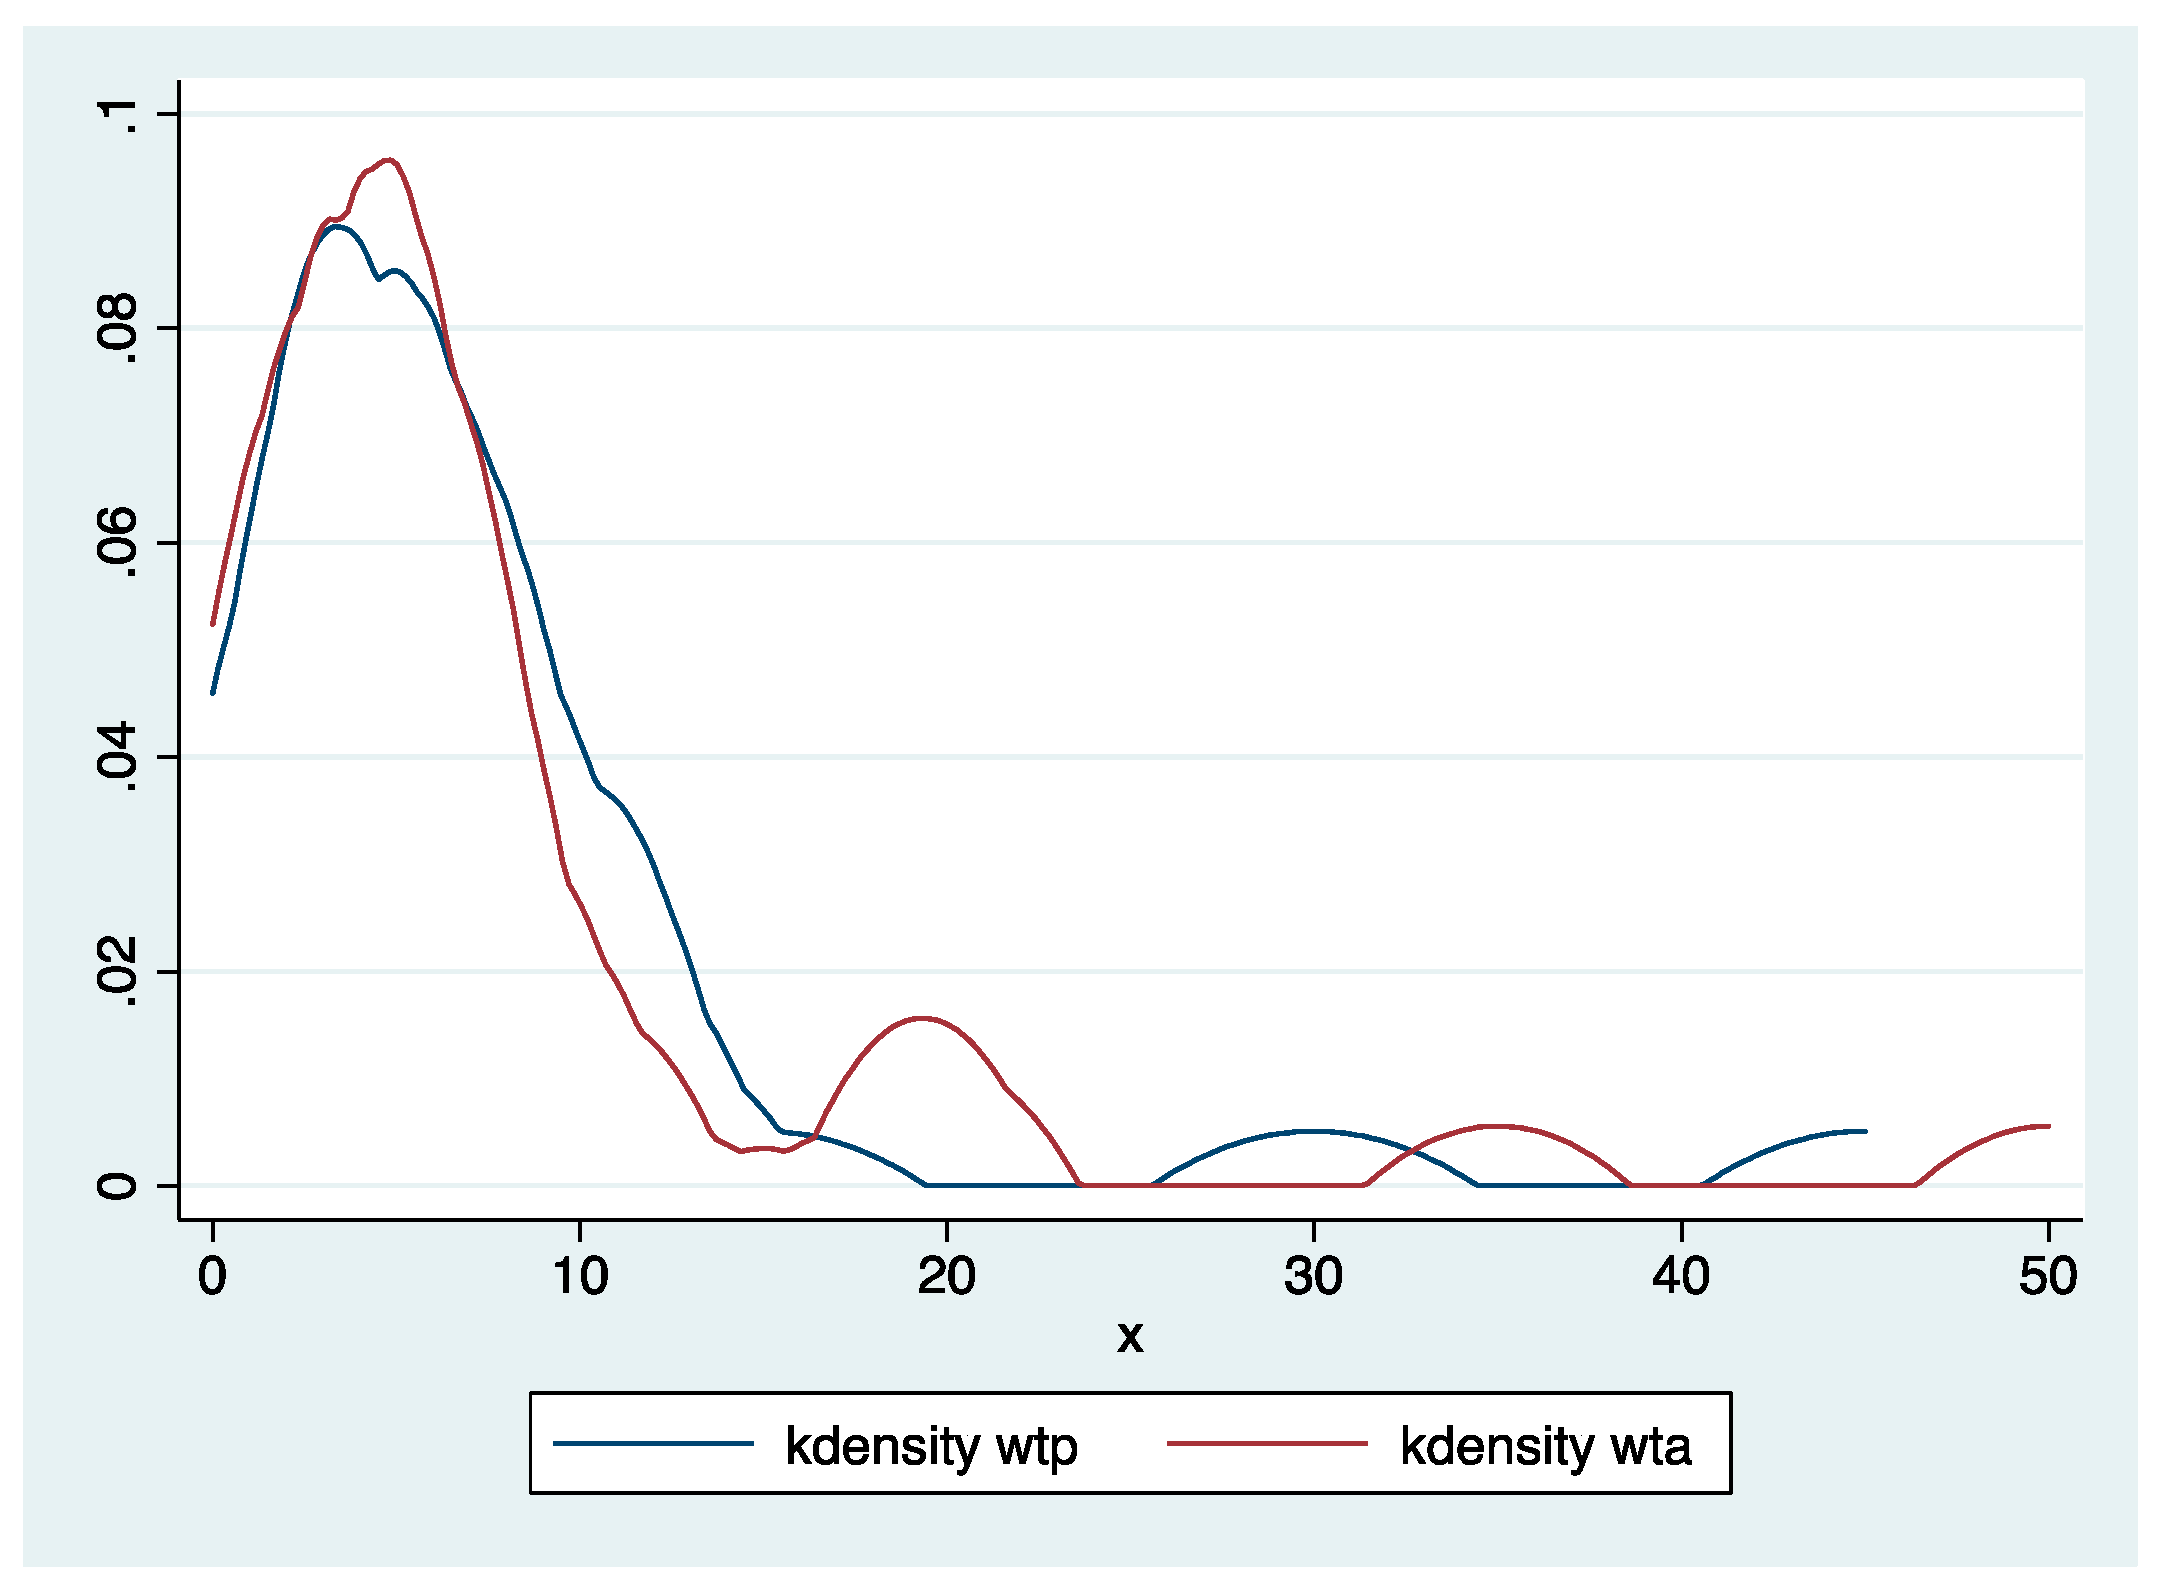
3.3. Local Survey Results

By using results of preliminary survey (210 interviews), we compare WTP and WTA for kWh of RE, taking into account preference heterogeneity. All of the respondents knew both fossil and RES; the most widely known are methane (57%) and wind (64%), respectively, for electricity generation. The majority of respondents (75%) stated they were aware of both positive and negative forms of environmental impact associated with electricity production. Respondents who support wind farm development projects and perceive positive externalities are almost of the same percentage of those who oppose the same project because of perceived local negative externalities. Table 3 shows that the two types of respondents are quite similar for socio-demographic and economic characteristics.
Both groups pay a bill that is between 72 and 73 EUR/bimonthly and have a declared income that is approximately 26,000 EUR, with a difference smaller than 10%; in both cases, more than 78% of respondents are homeowners. Some differences arise in the socio-demographic characteristics.
The group requiring compensation for the project includes families that are long-term residents and have a younger head of family with respect to the respondents of the other group. Number of components is instead similar between the two groups; furthermore, respondents’ characteristics are quite similar only in terms of gender, while the two groups differ consistently for the remaining characteristics. In particular, respondents are less educated in the second (supportive) group in which there are also fewer members of environmental associations but more leftist members. Finally, compared to the other group, we have found that respondents that are willing to pay for the project believe that amenity does not characterize their dwelling place; this group also was more supportive than other respondents towards the first on-shore wind farm project in 1999.
As expected, the mean WTA is significantly higher than the mean WTP, while the median values are more similar. The difference between WTA and WTP is still positive and statistically significant. Figure 1 shows the kernel density estimation of the WTP and WTA distributions, showing the skewness and the kurtosis of the distributions; WTA also has a higher maximum value, with a higher density for 20 and 35 EUR.
Table 3. Sub sample descriptive statistics (a).
VariablesTypeAcronymUnitSupporters (b)Opponents (c)
Bimonthly Electricity billContinuousbillEUR73.06272.232
9.2569.210
Head of family ageContinuousagehfnr.54.03048.595
19.77114.72
GenderDummysex#0.4550.486
(1 = female) 0.5050.506
Family years of residence (ancestors included) Continuousresanninr.41.54533.297
21.2118.65
Household componentsContinuousncompnr.2.9392.757
1.0580.954
Household income (×10,000)ContinuousincomEUR2.7812.500
1.1561.001
Left party affinity Dummyleftp#0.6970.189
(1 = yes) 0.4660.397
Amenity perceptionScale (1–10)amenitynr.4.9096.432
(10 = max) 1.5881.993
Year of educationContinuouseducynr.9.54511.541
4.0244.226
Environmental association membershipDummyassambcc#0.0910.189
(1 = yes) 0.2910.397
HomeownerDummyhomeow#0.7880.730
(1 = yes) 0.4150.450
Positive attitude vs. wind farm project in 1999.Dummywfexp#0.2120.135
(1 = yes) 0.4150.346
Willingness to pay (mean WTP)ContinuousmWTP EUR7.003
8.797
Willingness to accept (mean WTA)ContinuousmWTAEUR 7.935
9.980
(a) standard error in italic; (b) 103 observations; (c) 107 observations.
Partial correlations among WTP, WTA and socio-demographic and economic variables are shown in Table 4. We emphasize that this type of analysis does not allow for an explanation of causality but that it only investigates whether a linear interrelation exists among these variables.
Females exhibit a higher WTA for the project; this is consistent with some recent studies, see, among others, Kontogianni et al. [76]. As expected, other individual variables are positively related to the WTA, such as amenity perception and the education of respondents. How people perceive the place where they live and WTA are closely related, confirming existing literature on this topic.
Figure 1. WTP and WTA kernel density estimation.
Sustainability 07 11909 g001
Table 4. Partial correlations.
VariablesWTPWTA
Bimonthly Electricity bill0.15730.1791
Head of family age0.21350.3040
Gender (1= female)0.25610.3926 *
Family years of residence (ancestors included) 0.4266 *0.4806 *
Household components−0.1892 *0.3276 *
Household income (×10,000)0.3293 *−0.3936 *
Left party affinity (1 = yes)0.08590.0399
Amenity perception−0.5690 *0.4957 *
Year of education0.4833 *0.3671 *
Environmental association membership (1 = yes)−0.15100.4827 *
Homeowner (1 = yes)0.24060.2637
Positive attitude vs. wind farm project in 1999 (1 = yes)0.3995*−0.1018
* Significant at 5%.
This literature has mainly investigated negative perceptions due to the wind farm (see, among others [77,78,79]) instead of the direct amenity perception. Several family characteristics are positively correlated with WTA.
The first one regards how long households of respondents have been in the area. Literature on “place attachment” and on “sense of place” describes the importance of this attribute [80,81] for determining Nimby syndrome, while Groothius et al. [9] underlined that those who have ancestors in the area involved in the wind farm project exhibit a higher WTA. We also confirm this last result. More educated people also require higher compensation; this result is in contrast with Groothius et al. [9], while it is consistent with Landry et al. [82]. According to the existing literature, household size and income are correlated positively and negatively [9] with WTA, respectively. Finally, WTA is positively linked to the environmental association membership. This result seems logical and consistent with expectations; it is not easily comparable with literature given that, to the best of our knowledge, no other studies have used this variable. Among respondents who have declared themselves to be in agreement with the project, those who have a positive attitude towards the wind farm project in 1999 exhibit a higher WTP; this confirms that prior experiences matter [24,83,84]. The same expected relationship arises between WTP and household income, WTP and how long family and ancestors have lived in the place [9] and WTP and education of respondents. A negative correlation is obtained between WTP and household size and WTP and amenity.
Integrating meta-analysis with a local comprehensive survey, we have investigated the main determinants towards RE acceptance and development taking into account several explicative variables categorized as factual variables.
We have paid particular attention to the environmental externalities and how individuals and local community perceive them. The reason is that these perceptions impact on citizens’ and consumers’ preferences and behaviors when both deal with RE acceptance. Some useful insights arise.
Environmental awareness affects differently the two market sides considered. Indeed, it increases WTP for RE on the demand side but opposite results arise on the supply side confirming that externalities are more strongly perceived if respondents are directly involved in the project. Both meta-analysis and survey results support this hypothesis given that we have controlled for visual intrusion and for exposure to windmills.
The impact of the knowledge of RES is clearly asymmetrical. Indeed, it impacts only on consumers’ behavior increasing WTP for RE, but this variable does not matter in the local context if a wind investment project is proposed. This means that information is not sufficient to mitigate stronger perceptions of negative externalities. Even if information on wind energy does not increase RE acceptance, our results suggest that to increase acceptability of wind power, new wind investment should take place near an existing wind farm. This solution allows taking advantage of the dynamism of preference towards wind farms. Wolsink [84] has pointed out that preferences change according to the U-shape scheme. Indeed attitudes are very positive in two particular periods. First, attitudes are very positive when citizens are not confronted with wind farms. Second, attitudes are positive again some reasonable time after the construction of wind farms. This result is also directly confirmed by the fact that people who had positive attitude in 1999 are still positive towards new projects.

4. Conclusions

Promoting RE is essential at the global level. Nevertheless, a reduction in worldwide CO2 emissions implies a comprehensive legal framework, an adequate incentive mechanism and considerable costs. Furthermore, it requires the harmonization of two opposing behaviors. Indeed, if consumers declare strong support for RE, citizens exhibit low acceptance towards new infrastructure for RE production when this project involves their community. The aim of this paper is to provide a novel contribution, first analyzing existing literature on this argument through the meta-analysis, and second conducting a comprehensive survey on a local community that has experienced wind energy production previously and is involved in a new wind investment project.
Meta-analysis results confirm that consumers are willing to support RE when they are end users but are less supportive if a new project is proposed. In addition, meta-analysis highlights that distance is an important attribute in the siting process and that the local dimension is also relevant given that, at this level, the perception of technology is stronger if compared with the supra-local scale. This result supports our choice of conducting a comprehensive local survey putting major emphasis on the local dimension. Integrating meta-regression with the local survey allows us to jointly investigate citizens’ and consumers’ preferences within the local community. This analysis confirms some well-known results in terms of individual characteristics, such as education which positively affects RE acceptance on two market sides, and age that negatively influences both consumers’ and citizens’ attitudes. However, some interesting insights have also been pointed out. Confirmation of Wolsink’s [84] scheme suggests that past experiences with wind investments projects could be a useful tool for institutional communication strategies. Furthermore, in the siting decision process, communities already involved in wind projects seem to be the ideal counterpart in the bargaining process due to their pragmatism and also because they focus on institutional aspects rather on “ideological questions”. However, the local dimension strengthens the perception of negative externalities, so careful planning is required in the establishment of wind investment projects taking into account both their technical characteristics and environmental impacts.
In conclusion, our research results suggest that sociological and psychological aspects should be included in the future economic research to facilitate the new installation of onshore wind farms reducing the related infighting. On the other hand, the policy agenda should include this type of research into its toolbox, based on at least three reasons. First, to better understand wind investment project outcomes. Second, to guarantee an active participation of the local community in the decision-making process. Third, the combined effect of the first two allows increasing the probability of positive outcomes for this type of project.

Acknowledgments

We are grateful to Giacomo Manna and Silvia Micheli for their research assistance. The usual disclaimers apply.

Author Contributions

Authors contributed equally to this work.

Conflicts of Interest

The authors declare no conflict of interest.

References

  1. Mu, Y.; Mu, X. Energy conservation in the Earth’s crust and climate change. J. Air Waste Manag. Assoc. 2013, 63, 150–160. [Google Scholar] [CrossRef] [PubMed]
  2. Wolsink, M. Wind power and the NIMBY-myth: Institutional capacity and the limited significance of public support. Renew. Energy 2000, 21, 49–64. [Google Scholar] [CrossRef]
  3. Ek, K.; Söderholm, P. Norms and economic motivation in the Swedish green electricity market. Ecol. Econ. 2008, 68, 169–182. [Google Scholar] [CrossRef]
  4. Wüstenhagen, R.W.; Markard, J.; Truffer, B. Diffusion of green power products in Switzerland. Energy Policy 2003, 31, 621–632. [Google Scholar] [CrossRef]
  5. Stanley, T.D.; Doucouliagos, H.; Giles, M.; Heckemeyer, J.H.; Johnston, R.J.; Laroche, P.; Nelson, J.P.; Paldam, M.; Poot, J.; Pugh, G.; et al. Meta-analysis of economics research reporting guidelines: Reporting guidelines for meta-regression analysis in economics. J. Econ. Surv. 2013, 27, 390–394. [Google Scholar] [CrossRef]
  6. Edmonson, A.C.; McManus, S.E. Methodological fit in management field research. Academ. Manag. Rev. 2007, 32, 1115–1179. [Google Scholar]
  7. Holmgren, J. Meta-analysis of public transport demand. Transp. Res. Part A 2007, 41, 1021–1035. [Google Scholar] [CrossRef]
  8. Glass, G.V.; McGaw, B.; Smith, M.L. Meta-Analysis in Social Research; Sage: Beverly Hills, CA, USA, 1981. [Google Scholar]
  9. Groothius, P.A.; Groothuis, J.D.; Whitehead, J.C. Green vs. green: Measuring the compensation required to site electrical generation windmills in a viewshed. Energy Policy 2008, 36, 1545–1550. [Google Scholar] [CrossRef]
  10. Ek, K.; Matti, S. Valuing the local impacts of a large scale wind power establishment in northern Sweden: Public and private preferences toward economic, environmental and sociocultural values. J. Environ. Manag. 2014, 58, 1–19. [Google Scholar] [CrossRef]
  11. Nelson, J.P.; Kennedy, P.E. The use (and abuse) of meta-analysis in environmental and natural resource economics: An assessment. Environ. Resour. Econ. 2009, 42, 345–377. [Google Scholar] [CrossRef]
  12. Álverez-Farizo, B.; Hanley, N. Using conjoint analysis to quantify public preferences over the environmental impcts of wind farms. An example from Spain. Energy Policy 2002, 30, 107–116. [Google Scholar] [CrossRef]
  13. Batley, S.L.; Fleming, P.D.; Urwin, O. Willingness to pay for renewable energy: Implications for UK green tariff offerings. Indoor Built. Environ. 2000, 9, 157–170. [Google Scholar] [CrossRef]
  14. Batley, S.L.; Colbourne, D.; Fleming, P.D.; Urwin, O. Citizen versus consumer: Challenges in the UK green power market. Energy Policy 2001, 29, 479–487. [Google Scholar] [CrossRef]
  15. Bergmann, A.; Hanley, N.; Wright, R. Valuing the attributes of renewable energy investments. Energy Policy 2006, 34, 1004–1014. [Google Scholar] [CrossRef]
  16. Borchers, A.M.; Dukea, J.M.; Parsons, G.R. Does willingness to pay for green energy differs by source? Energy Policy 2007, 35, 3327–3334. [Google Scholar] [CrossRef]
  17. Botetzagias, I.; Malesios, C.; Kolokotroni, A.; Moysiadis, Y. The role of NIMBY in opposing the siting of wind farms: Evidence from Greece. J. Environ. Plann. Manag. 2013, 58, 252–269. [Google Scholar]
  18. Byrnes, B.; Jones, C.; Goodman, S. Contingent valuation and real economic commitments: Evidence from electric utility green pricing programs. J. Environ. Plan. Manag. 1999, 42, 149–166. [Google Scholar] [CrossRef]
  19. Goett, A.A.; Hudson, K.; Train, K.E. Customers’ choice among retail energy suppliers: The willingness to pay for service attributes. Energy J. 2000, 4, 1–28. [Google Scholar] [CrossRef]
  20. Hanemann, M.; Labandeira, X.; Loureiro, M.L. Climate change, energy and social preferences on policies: Exploratory evidence for Spain. Clim. Res. 2011, 48, 343–348. [Google Scholar] [CrossRef]
  21. Hansla, A.; Gamble, A.; Juliusson, A.; Garling, T. Psychological determinants of attitude towards and willingness to pay for green electricity. Energy Policy 2008, 36, 768–774. [Google Scholar] [CrossRef]
  22. Koundouri, P.; Kountouris, Y.; Remoundou, K. Valuing a wind farm construction: A contingent valuation study in Greece. Energy Policy 2009, 37, 1939–1944. [Google Scholar] [CrossRef]
  23. Meyerhoff, J.; Ohl, C.; Hartje, V. Landscape externalities from onshore wind power. Energy Policy 2010, 38, 82–92. [Google Scholar] [CrossRef]
  24. Meyerhoff, J. Do turbines in the vicinity of respondents’ residences influence choices among programs for future wind power generation? J. Choice Model. 2013, 7, 58–71. [Google Scholar] [CrossRef]
  25. Mirasgedis, S.; Tourkolias, C.; Tzovla, E.; Diakoulaki, D. Valuing the visual impact of wind farms: An application in South Evia, Greece. Renew. Sustain. Energy Rev. 2014, 39, 296–311. [Google Scholar] [CrossRef]
  26. Strazzera, E.; Mura, M.; Contu, D. Combining choice experiments with psychometric scales to assess the social acceptability of wind energy projects: A latent class approach. Energy Policy 2012, 48, 334–347. [Google Scholar] [CrossRef]
  27. Zhang, L.; Wu, Y. Market segmentation and willingness to pay for green electricity among urban residents in China: The case of Jiangsu Province. Energy Policy 2012, 51, 514–523. [Google Scholar] [CrossRef]
  28. Yoo, S.H.; Kwak, S.Y. Willingness to pay for green electricity in Korea: A contingent valuation study. Energy Policy 2009, 37, 5408–5416. [Google Scholar] [CrossRef]
  29. Ek, K. Public and private attitudes towards “green” electricity: The case of Swedish wind power. Energy Policy 2005, 33, 1677–1689. [Google Scholar] [CrossRef]
  30. Bigerna, S.; Polinori, P. A bidding game for Italian households’ WTP for RES. Atl. Econ. J. 2013, 41, 189–190. [Google Scholar] [CrossRef]
  31. Bigerna, S.; Polinori, P. Italian households’ willingness to pay for green electricity. Renew. Sustain. Energy Rev. 2014, 34, 110–121. [Google Scholar] [CrossRef]
  32. Bollino, C.A. The willingness to pay for renewable energy sources: The case of Italy with socio demographic determinants. Energy J. 2009, 30, 81–96. [Google Scholar]
  33. Dimitropoulos, A.; Kontoleon, A. Assessing the determinants of local acceptability of wind-farm investment: A choice experiment in the Greek Aegean Islands. Energy Policy 2009, 37, 1842–1854. [Google Scholar] [CrossRef]
  34. Grösche, P.; Schröder, C. Eliciting public support for greening the electricity mix using random parameter techniques. Energy Econ. 2011, 33, 363–370. [Google Scholar] [CrossRef]
  35. Kim, J.; Park, J.; Kim, H.; Heo, E. Assessment of Korean customers’ willingness to pay with RPS. Renew. Sustain. Energy Rev. 2012, 16, 695–703. [Google Scholar] [CrossRef]
  36. Ivanova, G. Queensland consumers’ willingness to pay for electricity from renewable energy sources. In Proceedings of the Ecological Economics in Action Conference, Massey University, Palmerston North, New Zealand, 11–12 December 2005.
  37. Ivanova, G. Are consumers’ willingness to pay extra for the electricity from renewable energy sources. An example of Queensland Australia. Int. J. Renew. Res. 2012, 4, 758–766. [Google Scholar]
  38. Nomura, N.; Akay, M. WTP for green electricity in Japan as estimated through contingent valuation method. Appl. Energy 2004, 78, 453–463. [Google Scholar] [CrossRef]
  39. Zoric, J.; Hrovatin, N. Household willingness to pay for green electricity in Slovenia. Energy Policy 2012, 47, 180–187. [Google Scholar] [CrossRef]
  40. Casimir, G.J.; Tobi, H. Defining and using the concept of household: A systematic review. Int. J. Consum. Stud. 2011, 35, 498–506. [Google Scholar] [CrossRef]
  41. Portney, P.R. The contingent valuation debate: Why economists should care. J. Econ. Perspect. 1994, 8, 3–17. [Google Scholar] [CrossRef]
  42. Blamey, R.; Common, M.; Quiggin, J. Respondents to contingent valuation surveys: Consumers or citizens. Aust. J. Agric. Econ. 1995, 39, 263–288. [Google Scholar] [CrossRef]
  43. Sagoff, M. Aggregation and deliberation in valuing environmental public goods: A look beyond contingent pricing. Ecol. Econ. 1998, 24, 213–230. [Google Scholar] [CrossRef]
  44. Huijts, N.M.A.; Molin, E.J.E.; Steg, L. Psychological factors influencing sustainable energy technology acceptance: A review-based comprehensive framework. Renew. Sustain. Energy Rev. 2012, 16, 525–531. [Google Scholar] [CrossRef]
  45. Groothuis, P.A. Land use issues: The last settler’s syndrome. J. Agric. Appl. Econ. 2010, 42, 357–365. [Google Scholar]
  46. Asdrubali, F.; Baldinelli, G.; D’Alessandro, F.; Scrucca, F. Life cycle assessment of electricity production from renewable energies: Review and results harmonization. Renew. Sustain. Energy Rev. 2015, 42, 1113–1122. [Google Scholar] [CrossRef]
  47. Navrud, S.; Bråten, K.G. Consumers’ preferences for green and brown electricity: A choice modeling approach. Rev. Econ. Politique 2007, 117, 795–811. [Google Scholar] [CrossRef]
  48. Lancaster, K.J. A new approach to consumer theory. J. Political. Econ. 1966, 74, 132–157. [Google Scholar] [CrossRef]
  49. Hanley, N.; MacMillan, D.; Wright, R.E.; Bullock, C.; Simpson, I.; Parsisson, D.; Crabtree, B. Contingent valuation versus choice experiment: Estimating benefits of environmentally sensitive areas in Scotland. J. Agric. Econ. 1998, 49, 1–15. [Google Scholar] [CrossRef]
  50. Sovacool, B.K. Exploring and contextualizing public opposition to renewable electricity in the United States. Sustainability 2009, 1, 702–721. [Google Scholar] [CrossRef]
  51. Wüstenhagen, R.; Wolsink, M.; Bürer, M.J. Social acceptance of renewable energy innovation: An introduction to the concept. Energy Policy 2007, 35, 2683–2691. [Google Scholar] [CrossRef]
  52. Kaldellis, J.K.; Kapsali, M.; Katsanou, E. Renewable energy applications in Greece—What is the public attitude? Energy Policy 2012, 42, 37–48. [Google Scholar] [CrossRef]
  53. Aitken, M. Wind power and community benefits: Challenges and opportunities. Energy Policy 2010, 38, 6066–6075. [Google Scholar] [CrossRef]
  54. Cass, N.; Walker, G. Emotion and rationality: The characterization and evaluation of opposition to renewable energy projects. Emot. Space Soc. 2009, 2, 62–69. [Google Scholar] [CrossRef]
  55. Devine-Wright, P. Reconsidering Public Attitudes and Public Acceptance of Renewable Energy Technologies: A Critical Review; University of Manchester: Manchester, UK, 2007. [Google Scholar]
  56. Jobert, A.; Laborgne, P.; Mimler, S. Locla acceptance of wind energy: Factors of success identified in French and German case studies. Energy Policy 2007, 35, 2751–2760. [Google Scholar] [CrossRef]
  57. Read, D.L.; Brown, R.F.; Thorsteinsson, E.B.; Morgan, M.; Price, I. The theory of planned behavior as a model for predicting public opposition to wind farm development. J. Environ. Psychol. 2013, 36, 70–76. [Google Scholar] [CrossRef]
  58. Van Rensburg, T.M.; Kelley, H.; Jeserich, N. What influences the probability of wind farm planning approval: Evidence from Ireland. Ecol. Econ. 2015, 111, 12–22. [Google Scholar] [CrossRef]
  59. Rowlands, I.H.; Scott, D.; Parker, P. Consumers and green electricity: Profiling potential purchasers. Bus. Strategy Environ. 2003, 12, 36–48. [Google Scholar] [CrossRef]
  60. Stigka, E.K.; Paravantis, J.A.; Mihalakakou, G.K. Social acceptance of renewable energy sources: A review of contingent valuation applications. Renew. Sustain. Energy Rev. 2014, 32, 100–106. [Google Scholar] [CrossRef]
  61. Ek, K.; Persson, L. Wind farms—Where and how to place them? A choice experiment approach to measure consumer preferences for characteristics of wind farm establishments in Sweden. Ecol. Econ. 2014, 105, 193–203. [Google Scholar] [CrossRef]
  62. Borenstein, M.; Hedges, L.; Rothstein, H. Introduction to Meta-Analysis, 1st ed.; Wiley: Hoboken, NJ, USA, 2007. [Google Scholar]
  63. Dimitropoulos, A.; Rietveld, P.; van Ommeren, J.N. Consumer valuation of changes in driving range: A meta-analysis. Transp. Res. Part A 2013, 55, 27–45. [Google Scholar] [CrossRef]
  64. Stanley, T.D.; Doucouliagos, H. Better Than Random: Weighted Least Squares Meta-Regression Analysis. Available online: http://www.deakin.edu.au/buslaw/aef/workingpapers/papers/2013_2.pdf (accessed on 24 April 2013).
  65. Frew, E.J.; Wolstenholme, J.L.; Whynes, D.K. Comparing willingness-to-pay: Bidding game format versus open-ended and payment scale formats. Health Policy 2004, 68, 289–298. [Google Scholar]
  66. Lunander, A. Inducing incentives to understate and to overstate willingness to pay within the open-ended and the dichotomous-choice elicitation formats: An experimental study. J. Environ. Econ. Manag. 1998, 35, 88–102. [Google Scholar] [CrossRef]
  67. World Energy Perspective. Energy Efficiency Policies. Available online: http://www.worldenergy.org/wp-content/uploads/2013/09/WEC-Energy-Efficiency-Policies-report.pdf (accessed on 12 September 2013).
  68. Department of Energy & Climate Change. Quarterly energy prices; December 2012. Available online: https://www.gov.uk/government/uploads/system/uploads/attachment_data/file/65940/7341-quarterly-energy-prices-december-2012.pdf (accessed on 20 February 2013).
  69. Terna. Available online: http://www.terna.it/Default.aspx?tabid=101 (accessed on 20 March 2013).
  70. GSE (Gestore servizi Energetici). Available online: http://www.gse.it/en/Pages/default.aspx (accessed on 13 March 2013).
  71. EIA–U.S. Energy Information administration. Available online: http://www.eia.gov (accessed on 11 April 2013).
  72. IEA Wind. Available online: http://www.ieawind.org (accessed on 14 April 2013).
  73. Bloomberg Business. Available online: http://www.bloomberg.com/europe (accessed on 14 June 2014).
  74. OANDA. Available online: http://www.oanda.com/lang/it/ (accessed on 15 April 2013).
  75. European Environmental Bureau (EEB). Future of EU Environmental Policy. Towards the 7th Environmental Action Programme—Sustainability—Annual Conference Report; European Environmental Bureau (EEB): Brussels, Belgium, 2010. [Google Scholar]
  76. Kontogianni, A.; Tourkolias, C.; Skourtos, M.; Damigos, D. Planning globally, protesting locally: Patterns in community perceptions towards the installation of wind farms. Renew. Energy 2014, 66, 170–177. [Google Scholar] [CrossRef]
  77. Ladenburg, J. Attitudes towards on-land and offshore wind power development in Denmark; choice of development strategy. Renew. Energy 2008, 33, 111–118. [Google Scholar] [CrossRef]
  78. Krueger, A.D.; Parsons, G.R.; Firestone, J. Valuing the visual disamenity of offshore wind power projects at varying distances from the shore: An application on the Delaware shoreline. Land Econ. 2011, 87, 268–283. [Google Scholar] [CrossRef]
  79. Ladenburg, J.; Lutzeyer, S. The economics of visual disamenity reductions of offshore wind farms—Review and suggestions from an emerging field. Renew. Sustain. Energy Rev. 2012, 16, 6793–6802. [Google Scholar] [CrossRef]
  80. Devine-Wright, P. Beyond NIMBYism: Towards an integrated framework for understanding public perceptions of wind energy. Wind Energy 2005, 8, 125–139. [Google Scholar] [CrossRef]
  81. Devine-Wright, P. Rethinking NIMBYism. J. Community Appl. Soc. Psicol. 2009, 19, 426–441. [Google Scholar] [CrossRef]
  82. Landry, C.E.; Allen, T.; Cherry, T.; Whitehead, J.C. Wind turbine and coastal recreation demand. Esour. Energy Econ. 2012, 34, 93–111. [Google Scholar] [CrossRef]
  83. Ladenburg, J. Visual impact assessment of offshore wind farms and prior experience. Appl. Energy 2009, 86, 380–387. [Google Scholar] [CrossRef]
  84. Wosink, M. Wind power implementation: The nature of public attitudes: Equity and fairness instead of “backyard motives”. Energy Policy 2007, 11, 1188–1207. [Google Scholar]

