Abstract
Mixed land-use development is the integration of different land-use functions like residential, commercial, recreational, and institutional in an urban sector or a neighbourhood. Integrating transport and land-use mix is one of the goals of planning policies around the world. Prior studies mention the benefits of mixed land-use development towards creating sustainable environment, but do not specify the proportion of the mix of compatible land uses. This study attempts to assess the sustainability of the neighbourhoods with mixed land-use in the context of the Nagpur city, India. Residents’ travel behaviour in twelve neighbourhoods is studied by means of indicators namely trip lengths, mode of travel, vehicle ownership, and travel expenses. To investigate the users’ insight, the study further examines residents’ perception with the help of parameters such as safety, satisfaction, pollution, and mix. The sustainability indices are computed for both residents’ travel behaviour and perception, for each neighbourhood. The study revealed that neighbourhoods with high and moderate land-use mix are sustainable with travel behaviour. Residents’ perception sustainability index indicates neighbourhoods with moderate land-use mix are more sustainable than those with high and low land-use mixed neighbourhoods. This study advocates stakeholders’ insight and the proportion of mix in land-use planning decisions.
1. Introduction
Mixed land-use development is about co-existence of more than one type of land-use function like residential, commercial, recreational, educational, etc. in a specific area. It gives emphasis on higher intensity and diversity of land uses [1]. It is a key component of many development trends, including traditional neighbourhood development, transit oriented development, new urbanism, liveable communities, and smart growth principles [2]. These development trends act as a strong proponent to create a sustainable environment [3,4,5,6,7]. The land-use mix is associated with certain externalities both in terms of benefits (proximity, vibrancy, and social bonding) and cost (over loaded infrastructure and pollution), creating either a sustainable or unsustainable built environment. Prior studies mention that areas with mixed land-use are more sustainable than segregate areas [6]; however, the proportion of the mix of compatible land uses for sustainable development is not understood.
Traditionally, Indian cities had mixed land-use characteristics [8] with a high mix of commercial and residential uses. Over time, the residential land-use has been replaced by commercial activities due to economic market pressures [9,10]. Other areas in the city have a moderate mix in sub-centres or along a major road. It is obvious from the current state of Indian cities that land-use mix when left uncontrolled leads to the issues of environmental externalities related to mixed land-use. Thus, there is a need to investigate the range of the land-use mix that will enhance sustainability. To investigate this, the neighbourhood scale is appropriate as it provides both residential and non-residential functions [11] and connects communities and dwellings to the wider urban context.
There are various factors like the density, transport facility, travel behaviour, and socio-economic aspects which influence mixed land-use development. Amongst the various factors that affect mixed land-use, transport and land-use mix (as part of urban form or built environment) are strongly interrelated and integrating them is one of the goals of planning policies around the world [4,11,12,13,14,15,16]. Reid states, the measures of travel demand [trip frequency, trip length, vehicle-miles of travel (VMT), and mode choice] are the functions of socioeconomic and built environment [17]. Leck also supported these variables along with vehicle-hour travel and travel frequency influencing density and mix [18]. Trip generation, trip distribution, modal split, and route assignment also influence travel demand [19].
1.1. Mixed Land-Use and Transport
In a mixed land-use area, as various activities are in close proximity, they support sustainable forms of transport (walking, cycling or transit) [20]. Professional services are permitted in residential areas in few Master plans [21]. Different studies in the past reveal the advantages of mixed land-use supporting sustainable transport, health wellbeing, and reduction of air pollution. Mixing of uses near the employment destination is found to reduce travel demand [13]. Land-use mix reduces personal vehicle travel and significantly increases walking and cycling [16]. Increased walking has a direct connection to health wellbeing. The performance of the body mass index model with mixed land-use suggests that the presence of mixed land uses improves walk-ability [12]. Neighbourhoods with mixed uses facilitate the use of non-automobile travel modes and shorten car trips, thereby reducing vehicle greenhouse gas emissions [22,23].
1.2. Mixed Land-Use and Social Aspects
Social aspects also influence mixed land-use development. A mixed land-use environment creates social benefits favouring the residents [24]. A mix of diverse housing types based on income, functions, and forms provides residents with multiple choices when selecting their abode. A fine-grained mix of attractive destinations and good aesthetic qualities like tree cover in a neighbourhood supports walking for various activities and also for pleasure [25]. Dwellers in neighbourhoods with mixed land-use are more likely to use public spaces [26]. A neighbourhood with mixed land-use promotes a high level of activity on the street, keeping it safe. Children feel safe to play or cycle, elderly meet and talk, and strangers feel they are intruding [27]. Community cohesion, interaction, and sense of belonging are strong in a mixed land-use community. People perform diverse activities (live, shop, play, and work) in the same environs. The frequencies of their meeting, greeting, smiling, and talking increase. Neighbourhoods with mixed land-use provide convenient access to people and places and so residents and workers prefer such neighbourhoods for a balanced life [4].
An insight of the social aspects can be gained with the help of the stakeholders’ perception. In a neighbourhood residents are the prime stakeholders. Residents’ perception presents the inhabitants’ views about the socio-physical services and other aspects of life in their local areas. An insight can be sought on various aspects of the neighbourhood such as diversity, vitality, attractiveness, health, safety, satisfaction, community cohesion, interaction, a sense of belonging, and quality of life. Residents’ perception includes community participation, provides an insight on the current status, and reveals the focus area where improvement is needed. This tool is used to assess sustainability aspects. The residents’ self-report tool is used to create, a neighbourhood sustainability framework for New Zealand. Behaviours, perceptions and experiences associated with their neighbourhoods are used to get information on the built environment (land-use mix and density) [11]. Residents’ perception has been supported in prior studies to provide a robust understanding of various aspects of sustainability like mixed land-use, travel behaviour, environment, density, connectivity, social benefits, etc. [12,28,29,30].
1.3. Need Identification: Mixed Land-Use—Residents’ Travel Behaviour and Perception
The interaction of mixed land-use with transport supports sustainability, but the proportion of mix has not been specified in prior studies. Hence, this study attempts to investigate the same with the help of residents’ travel behaviour in the mixed land-use neighbourhoods. Travel behaviour is the study of how people use transport. It probes into the number, pattern, and purpose of trips, destinations, modes, route choices, etc. [31,32]. Besides these parameters age, gender, status, values, self-selection, attitude, and lifestyles also influence travel behaviour [28,33]. As residents’ perception provides an insight of the neighbourhood, this study is further extended to investigate the residents’ perception in the mixed land-use neighbourhoods.
The neighbourhoods are selected based on the high to low mix of commercial and residential land-use in the urban context of Nagpur, India. Residents’ travel behaviour and perception in the neighbourhoods with mixed land-use is presented in terms of the sustainability indices.
Travel behaviour studies the residents’ travel habits like commuting distance, mode of travel, vehicle ownership, and expenses on travel, while perception examines residents’ opinion, feelings, safety, satisfaction, and mix indicators. Though the residents’ travel behaviour and perception are less related, the study tries to compare the sustainability indices of these two domains. The purpose of this study is to explore the sustainability of varying land-use mixed neighbourhoods. It addresses the following research questions:
- (1)
- Whether the inhabitants of mixed land-use neighbourhoods support mixing, and if they do, then how much mix is supported to achieve sustainability?
- (2)
- Are the sustainability indices of residents’ travel behaviour and perception similar or different?
The organization of the paper is as follows. The introduction presents the mixed land-use and its influencing factors. It further states the need to conduct the study in the neighbourhoods with mixed land-use (through residents’ travel behaviour and perception indicators) to achieve sustainability. The second section describes the methodology (data, indicators, results, and observation) in three stages; (a) study area; (b) residents’ travel behaviour; and (c) perception. The third section presents the sustainability index model (normalization, weights and aggregation) and discusses the findings. The last section concludes the study.
2. Methodology and Data Presentation
The methodology is divided into three stages (refer Figure 1). The first stage elucidates the study area selection criteria. Twelve neighbourhoods spread across the city, with varying residential and commercial mix were selected for the study. Entropy index is used to measure the land-use mix for these neighbourhoods.
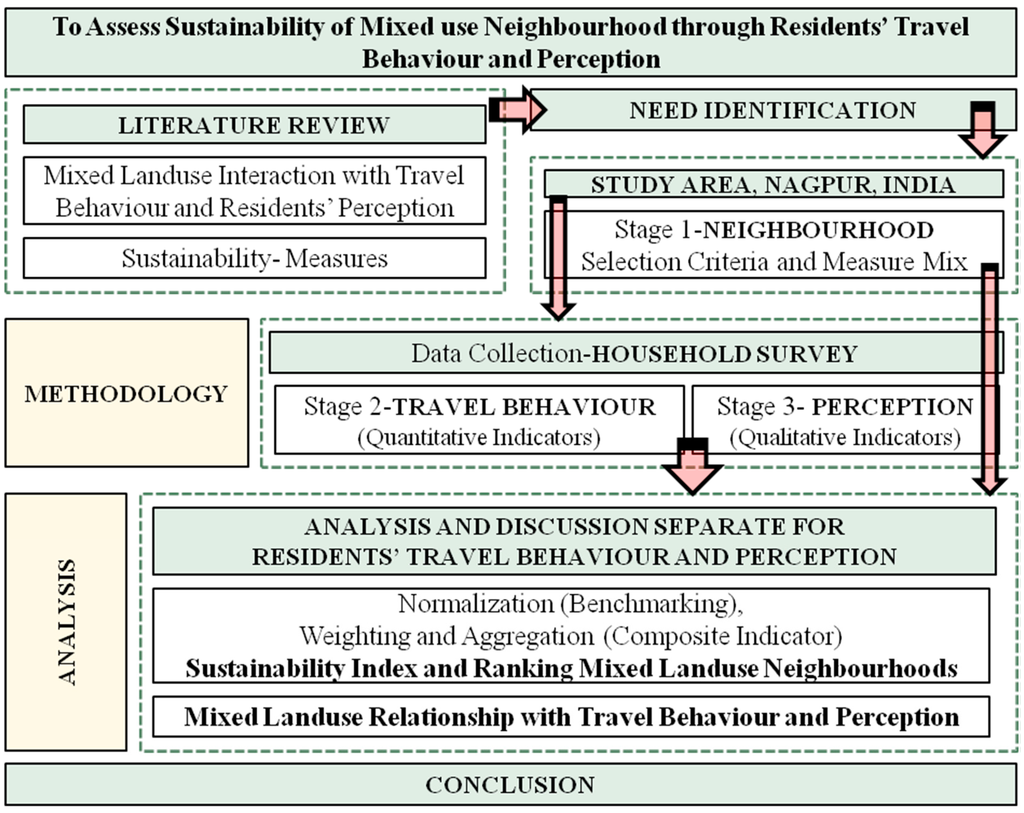
Figure 1.
Methodology adopted for the study.
Figure 1.
Methodology adopted for the study.

In the second and third stages, residents’ travel behaviour and perception is studied. Household survey is conducted to understand various aspects like trip length to various destinations, travel mode, vehicle ownership, safety, satisfaction, pollution, social interaction, etc. of residents’ travel behaviour and perception. Travel behaviour is studied with the help of quantitative indicators while perception is studied using qualitative indicators. Although a variety of indicators could have been used to operationalize sustainability index, the study is restricted to eleven travel behaviour indicators and twelve perception indicators.
Indicator scores are used to compute the sustainability index for each neighbourhood under travel behaviour and perception domains. At the end, the sustainability index score is correlated with the land-use mix measure (entropy index) to identify the relationship.
2.1. First Stage—Study Area: Neighbourhoods in Nagpur City, India
Nagpur is centrally located in the country and well connected to major cities in India by air, rail, and road. It acts as the key administrative, business and institutional centre for central India. The total area of Nagpur Municipal Corporation is 21,756 hectares. The Nagpur city has a population of 2,405,665 as per 2011 census with a gross density of 110 persons per hectare. Nagpur is ranked the thirteenth largest urban agglomeration in India [34].
There is an observed pattern of a varying land-use mix within the city. The core has a dense mixed land-use environment that has evolved over time. These areas have high land and rental value making it less feasible for pure residential use so mixed land-use exists. There are planned and semi-planned areas with a balance of residential and non-residential activities. Sprawled areas near the fringe are partly planned and partly unplanned plotted development with residential and no commercial use [27].
2.1.1. Selection Criteria for Neighbourhoods
There are different typologies of neighbourhoods within the Nagpur Municipal Corporation limit, each with a different land-use mix. The city-core has a dense mixed land-use environment evolved over time. In these areas more commercial land-use prevails due to the high land and rental value making it less feasible for pure residential use. The other areas of the city are planned and semi-planned with a moderate mix of residential and non-residential activities. The sprawled areas near the fringe are partly planned and partly un-planned plotted development with residential and no or little commercial use [27]. The development potential is bringing changes to the existing land-use pattern of the city. Whether this change is creating sustainable or unsustainable environ for the city needs to be explored. An attempt is made to study the sustainability status of neighbourhoods with varying mixed land-use.
Twelve neighbourhoods (NH1 to NH12) under four categories (L1 to L4) of varying residential and commercial mix were selected for the study (refer to Table 1 and Figure 2). Within a category the age of the included neighbourhoods and their socio-economic characteristics are similar.

Table 1.
Twelve neighbourhoods under four categories of varying land-mix.
| Category | Neighbourhoods | Population Density | Population Density Including Floating Population | Age of Neighbourhood (Years) | Spatial Distribution | Mix Characteristics | |||
|---|---|---|---|---|---|---|---|---|---|
| Level-1 (L1) | NH1 | Buldi—CBD and centrally located | 230.29 | 394.62 | 150 | core area, compact, organic, medium rise high density | high mix of commercial and residential land-use | ||
| NH2 | Itwari—known for wholesale market | 466.46 | 596.56 | 150 | |||||
| NH3 | Mahal—known for heritage and retail market | 323.62 | 442.48 | 150 | |||||
| Level-2 (L2) | NH4 | Sadar—in North West Nagpur | 75.65 | 102.77 | 100 | partly old core compact, organic, dense and partly new planned | moderate mix of commercial with residential land-use | ||
| NH5 | Dharampeth—in West Nagpur | 158.04 | 193.76 | 75 | moderately dense, low to medium rise and planned | ||||
| NH6 | Buddha Nagar—in North Nagpur | 234.49 | 250.20 | 75 | |||||
| Level-3 (L3) | NH7 | Nagsen Nagar, Jaripatka—along Nara Road and Ring Road in North Nagpur | 257.70 | 259.13 | 40 | moderately dense, low to medium rise and planned | mix of commercial only along the major road with no influx of commercial in the residential areas | ||
| NH8 | Trimurti Nagar—along Ring Road in South West Nagpur | 176.16 | 177.05 | 30 | |||||
| NH9 | Friends Colony—along Katol Road in North West Nagpur | 142.04 | 142.79 | 25 | partly moderately dense and planned and partly sprawled low rise | ||||
| Level-4 (L4) | NH10 | Civil Lines—Residential and administrative area planned and designed during British period in West Nagpur | 39.32 | 41.95 | 90 | planned and sprawled low rise | no or very less ingress of commercial activity and has only residential land use | ||
| NH11 | Nara—Sprawl growth in North suburb Nagpur | 32.64 | 32.73 | 5–10 | partly planned and partly unplanned sprawled low rise | ||||
| NH12 | Manish Nagar—Sprawl growth in South suburb Nagpur | 32.64 | 32.69 | 5–10 | |||||
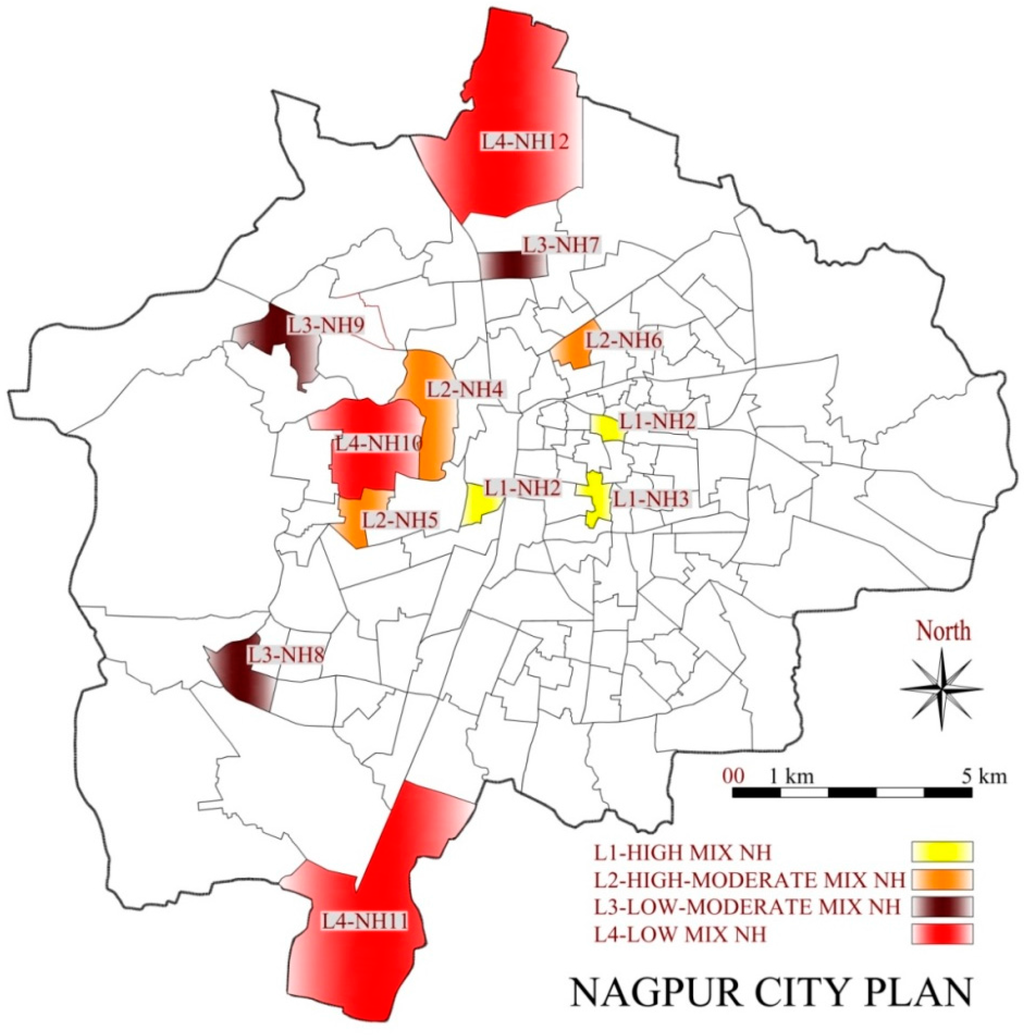
Figure 2.
Spatial location of the selected neighbourhoods in Nagpur City.
Figure 2.
Spatial location of the selected neighbourhoods in Nagpur City.

2.1.2. Sample Selection
The procedure for selecting the sample size is important since the study depends on data surveyed. Simple random sampling across the twelve neighbourhoods with uniform stratification was carried out. The initial sample size n1 is calculated by Equation (1a). The size of population is adjusted using Equation (1b), but this has an effect on the small and moderate size populations. In this study n1/N is negligible, so assumed n2 = n1. The design effect is the ratio of the sampling variance of an estimator under a given design to the sampling variance of an estimator under the simple random sampling of the same sample. The design effect is accommodated by Equation (1c). Finally, the response rate is adjusted to determine the final sample size by Equation (1d) [35].
The assumptions and constants used for the above equations are: the total population of twelve neighbourhoods (N) which is 216,829; margin of error (e) is taken to be 6%; confidence level is 95% so (z) is 1.96; population variance (P) is 50%; design effect (deff) for simple random sampling is 1 and response rate (r) is 75%.
Using the above technique n1, n2, and n3 is 268 and the final sample n is 357. Thus, total samples considered for the study is 360. Carrying out uniform stratification, each study area is allotted 30 samples.
2.1.3. Measuring Land-Use Mix
Measuring land-use mix is critical to mix land-use studies and there have been numerous methods of measuring like entropy index, dissimilarity index, distance to walkable destination (amenities and transit stops), and the number of amenities available within a certain distance [12]. Entropy index quantifies randomness, segregation, diversity or compressibility in the data. Land-use mix exhibits a pattern of combination and segregation of different land uses. So, entropy index is the most widely accepted and commonly used index by researchers for representing the land-use mix within geographic area [12,13,15,36,37]. Crevero [13] derived the entropy Equation (2a) as:
where, Pj is the proportion of developed land in the Jth land-use type. Frank described the evenness of the distribution of built square footage among seven land-use categories as single family, multi-family, retail and service, office, entertainment, institutional and industrial and later for a three-category mix of residential, commercial, and office [36,37].
Entropy index varies between 0 and 1, wherein 0 indicates single use (homogenous) and 1 maximum land-use mix (heterogeneous).
The existing land-use distribution for each neighbourhood is plotted on the base map through a field survey. High resolution is used for the base map which is at plot or property level. The entropy index is computed for commercial and residential land-use by Equation (2b).
where, a is the total area in square meter of two land uses, b1 is the commercial land-use area in square meters, b2 is the residential land-use area in square meters, and n is 2 (total number of land uses in the mix). Table 2 shows the entropy index of the neighbourhoods. The neighbourhoods are placed in the descending order of entropy index values in each category.
Table 2.
Entropy index of the selected twelve neighbourhoods.
| Category Levels | L1 | L2 | L3 | L4 | ||||||||
|---|---|---|---|---|---|---|---|---|---|---|---|---|
| Neighbourhoods | NH1 | NH2 | NH3 | NH4 | NH5 | NH6 | NH7 | NH8 | NH9 | NH10 | NH11 | NH12 |
| Entropy Index | 1.00 | 0.95 | 0.78 | 0.78 | 0.77 | 0.71 | 0.35 | 0.30 | 0.17 | 0.21 | 0.08 | 0.12 |
2.2. Second Stage—Residents’ Travel Behaviour: Indicators, Results, and Observations
Travel behaviour explores the accessibility, mode, vehicle ownership, and expenses related to travel. The study on residents’ travel behaviour is based on measurable indicators (refer Table 3). Each indicator score is computed from the household survey and the average score is taken for analysis.
Table 3.
Travel behaviour (quantitative indicators).
| Indicator Set | Indicator Description |
|---|---|
| Accessibility to land-use destination (Trip length of travel in kilometres) | 1. Trip length for Work |
| 2. Trip length for Shop 3. Trip length for Vegetable market | |
| 4. Trip length for School 5. Trip length for College | |
| 6. Trip length to Health facility | |
| 7. Trip length for Restaurant/Theatre | |
| 8. Trip length for Garden | |
| Travel Mode to work | 9. Percentage of Sustainable Mode (Walk + Cycle + Transit) |
| Vehicle Ownership | 10. Two-wheelers and Four-wheelers {Converted to Passenger Car Unit (PCU) for uniformity} |
| Travel Expenses | 11. Percentage of Income spend on travelling |
2.2.1. Accessibility to Land-Use Destinations
The trip length is the actual network distance travelled by the residents from their own residence to various destinations. The trip length to various destinations is computed from the survey report. The selected destinations are workplaces, shops, educational institutions, health amenities, and recreational areas.
The trip lengths to different destinations vary across the neighbourhood categories (refer Figure 3). The proximity to the amenities is directly proportional to the number of trips. In NH1, due to commercial dominance, only those people having their workplaces in the same neighbourhood reside there, while others have migrated to different parts of the city leaving their residential space for commercial use. It is observed that the high land-use mix in neighbourhoods results in more residents having their workplaces within 25 meters (assumed as work from home). This indicates the proximity to the workplace in high land-use mix areas. In the higher income group (HIG), children travel more than 5 km in all neighbourhoods to reach school. Residents from low land-use mix areas (NH11 and NH12) move outside the neighbourhood to access almost all amenities and travel around 9.5, 5.5 and 4.5 km on an average for work, school, and health facilities respectively.
2.2.2. Mode of Travel
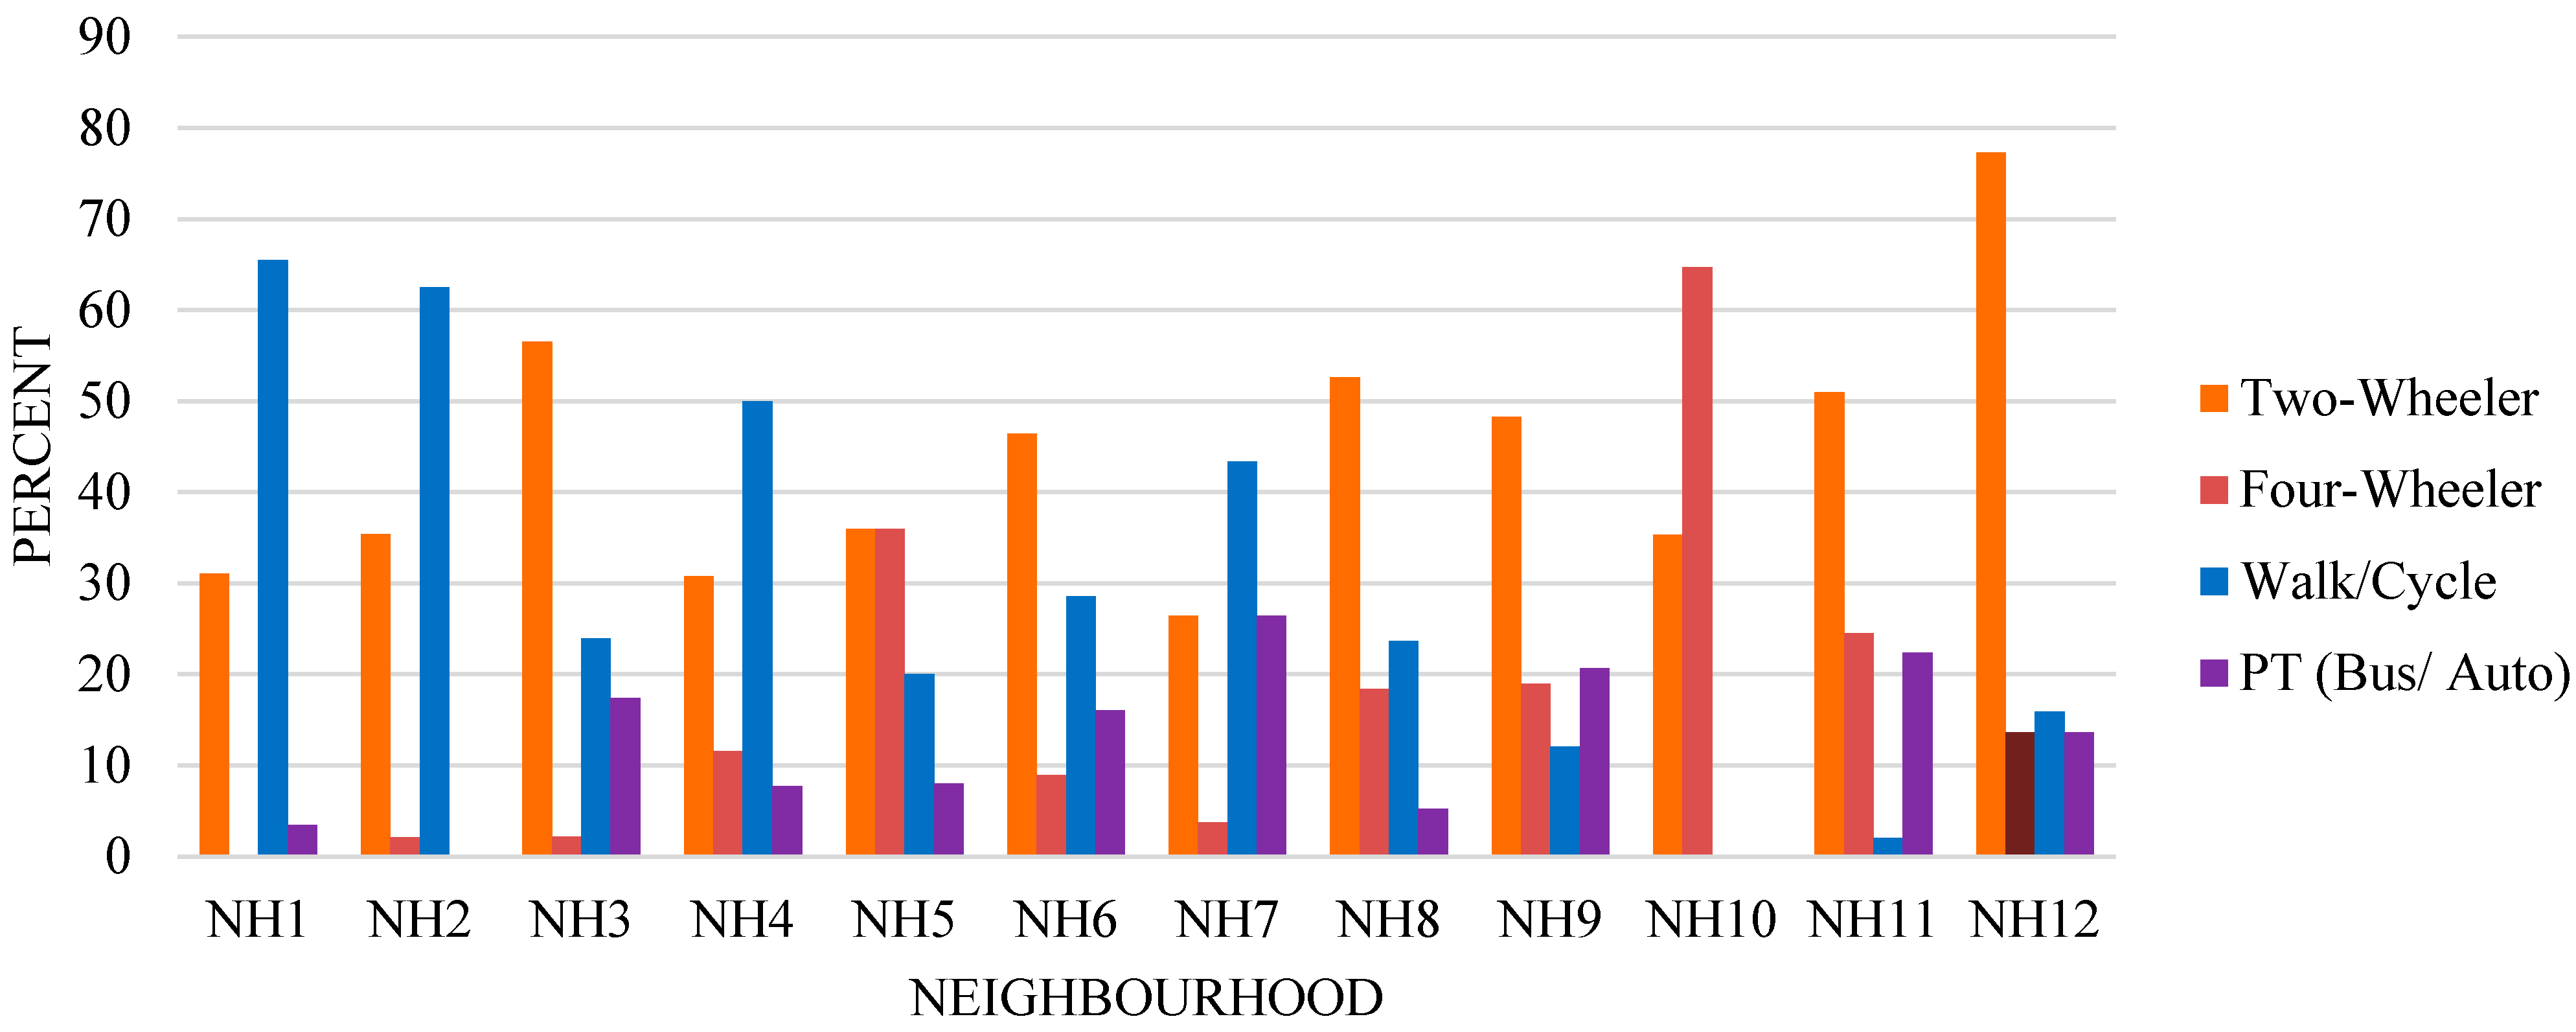
Mode of travel to the destination includes two-wheeler, four-wheeler, walking or traveling by cycle, para-transit (motorized cycle rickshaw), and bus. High walkability is noted in areas with high land-use mix (refer Figure 4). The mode share of public transport does not show a relationship with the land-use mix which indicates that the land-use mix does not promote or discourage the use of public mode. Instead, residents prefer to use a personal vehicle rather than public transport. In L4 category, due to greater commuting distance to work, residents do not prefer to walk or cycle.

Figure 3.
Access to various land-use destinations.
Figure 3.
Access to various land-use destinations.
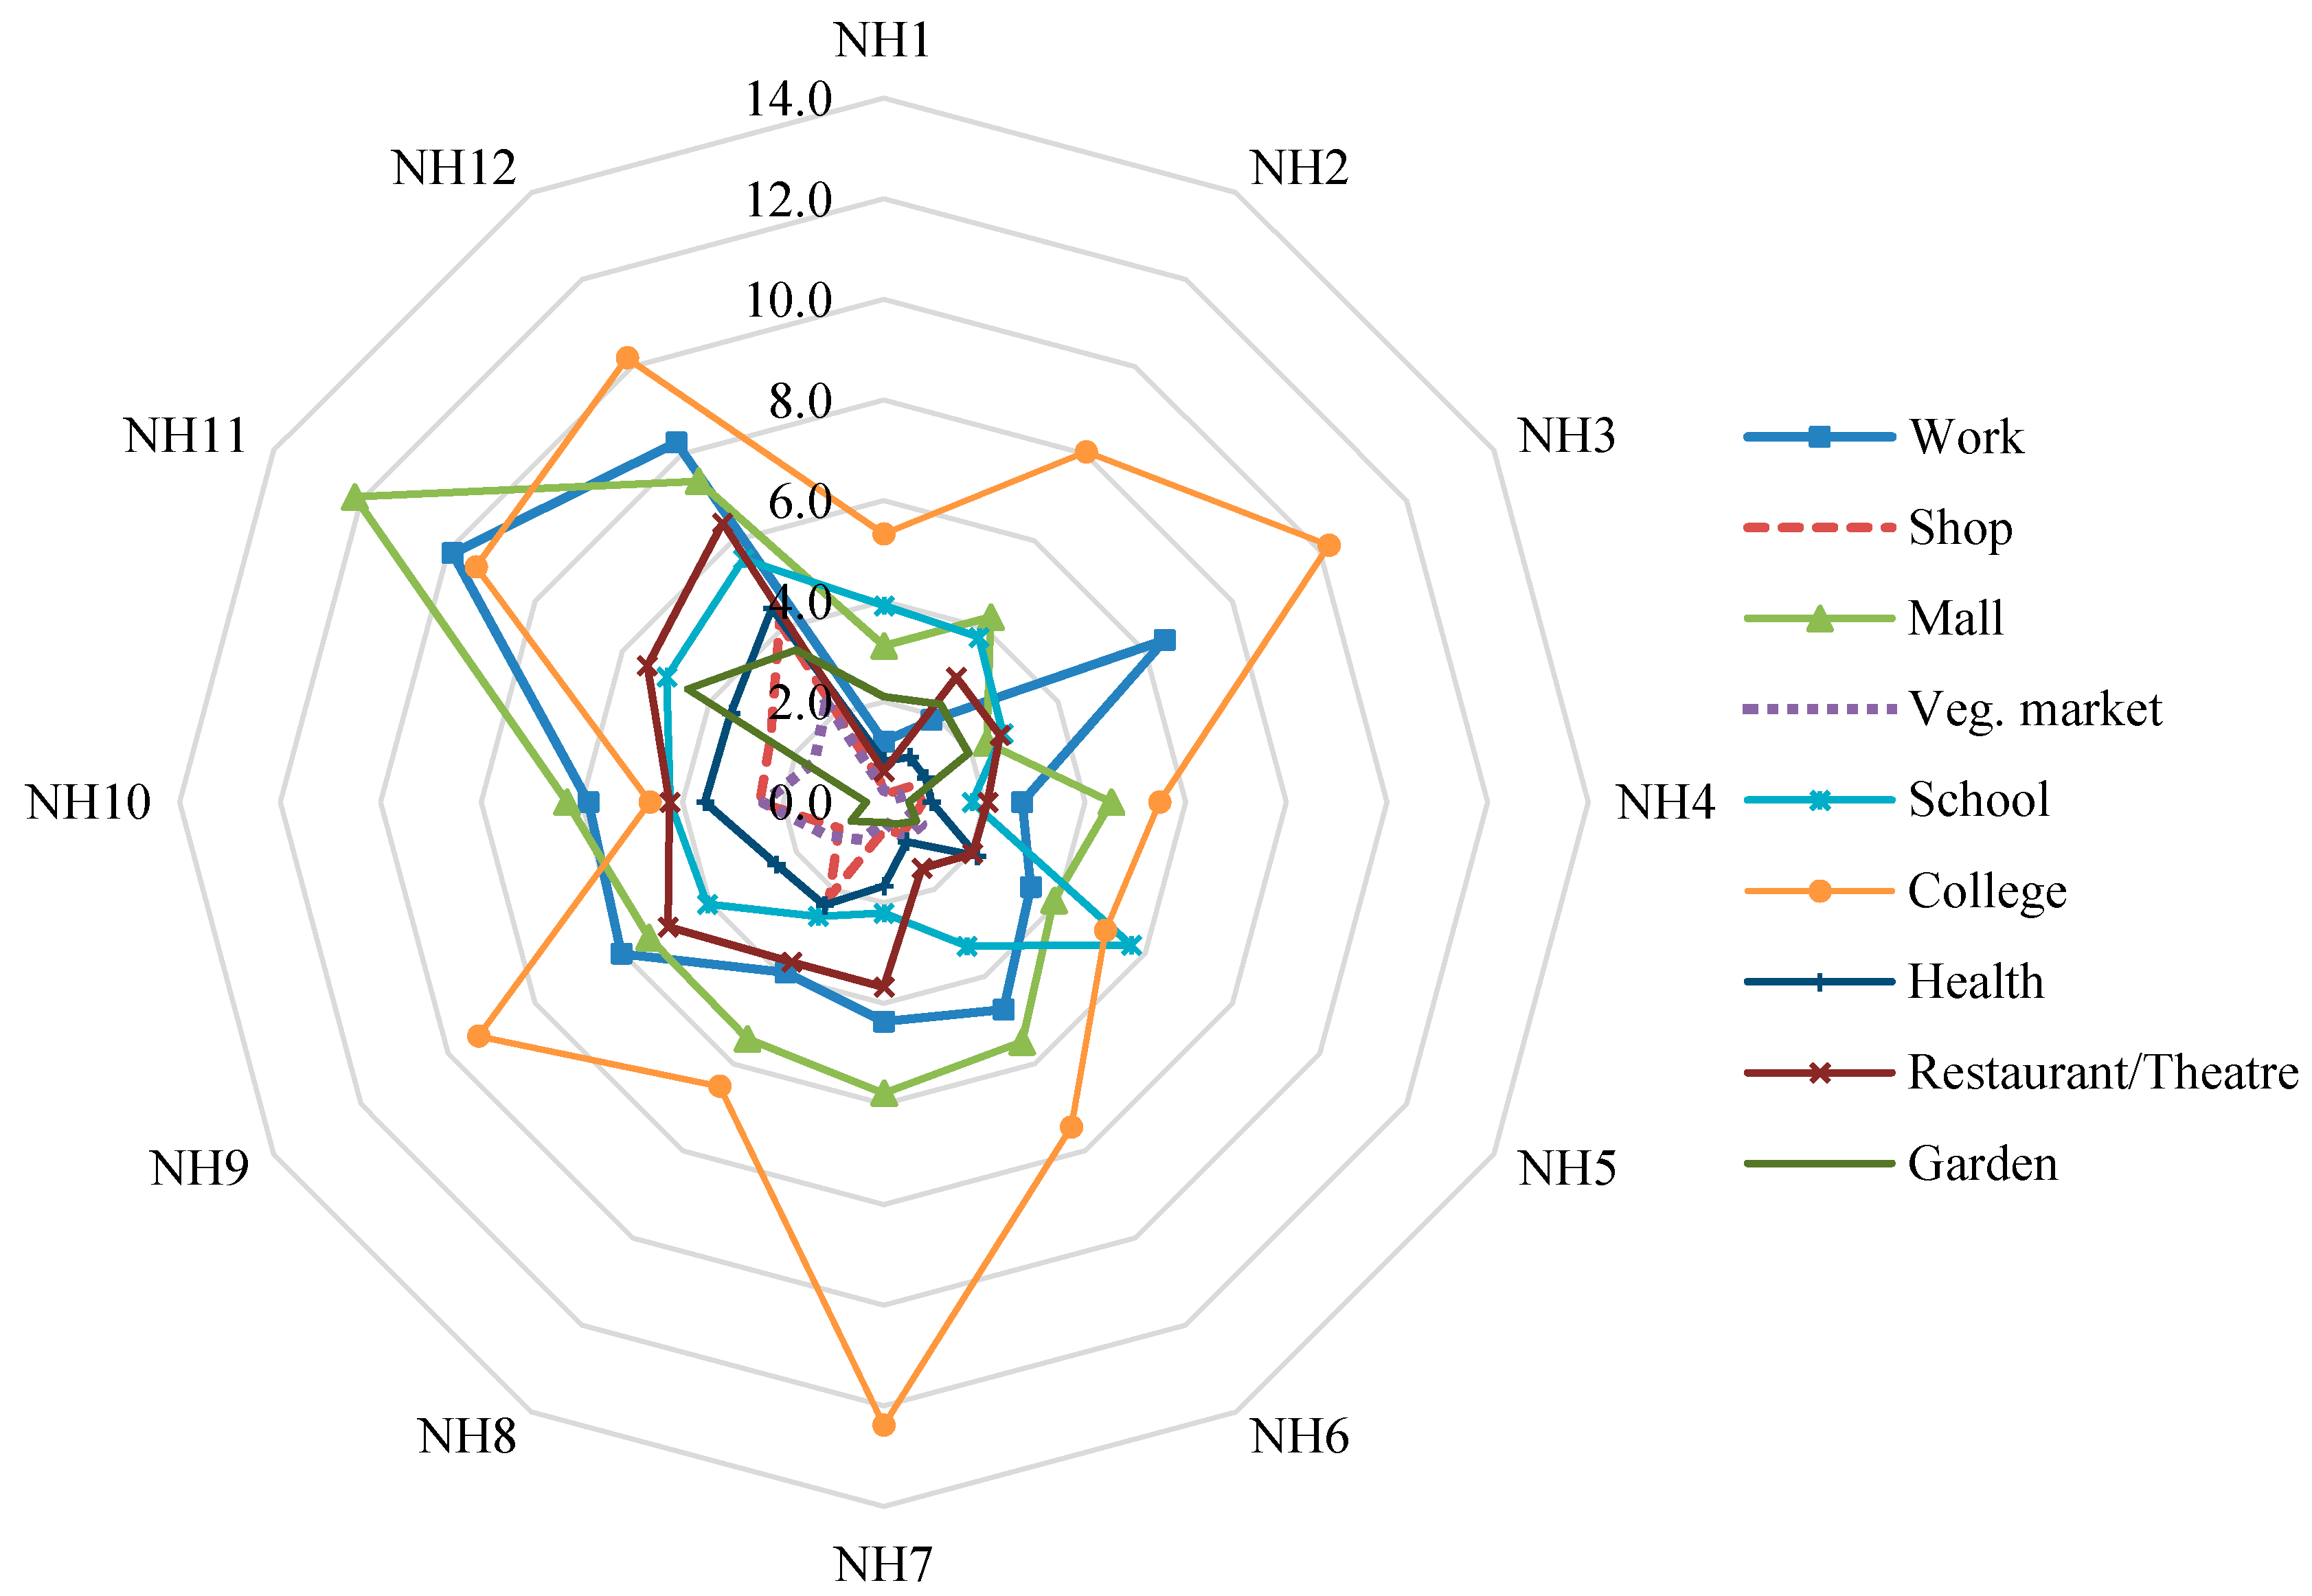

Figure 4.
Travel mode percentage for work trip.
Figure 4.
Travel mode percentage for work trip.
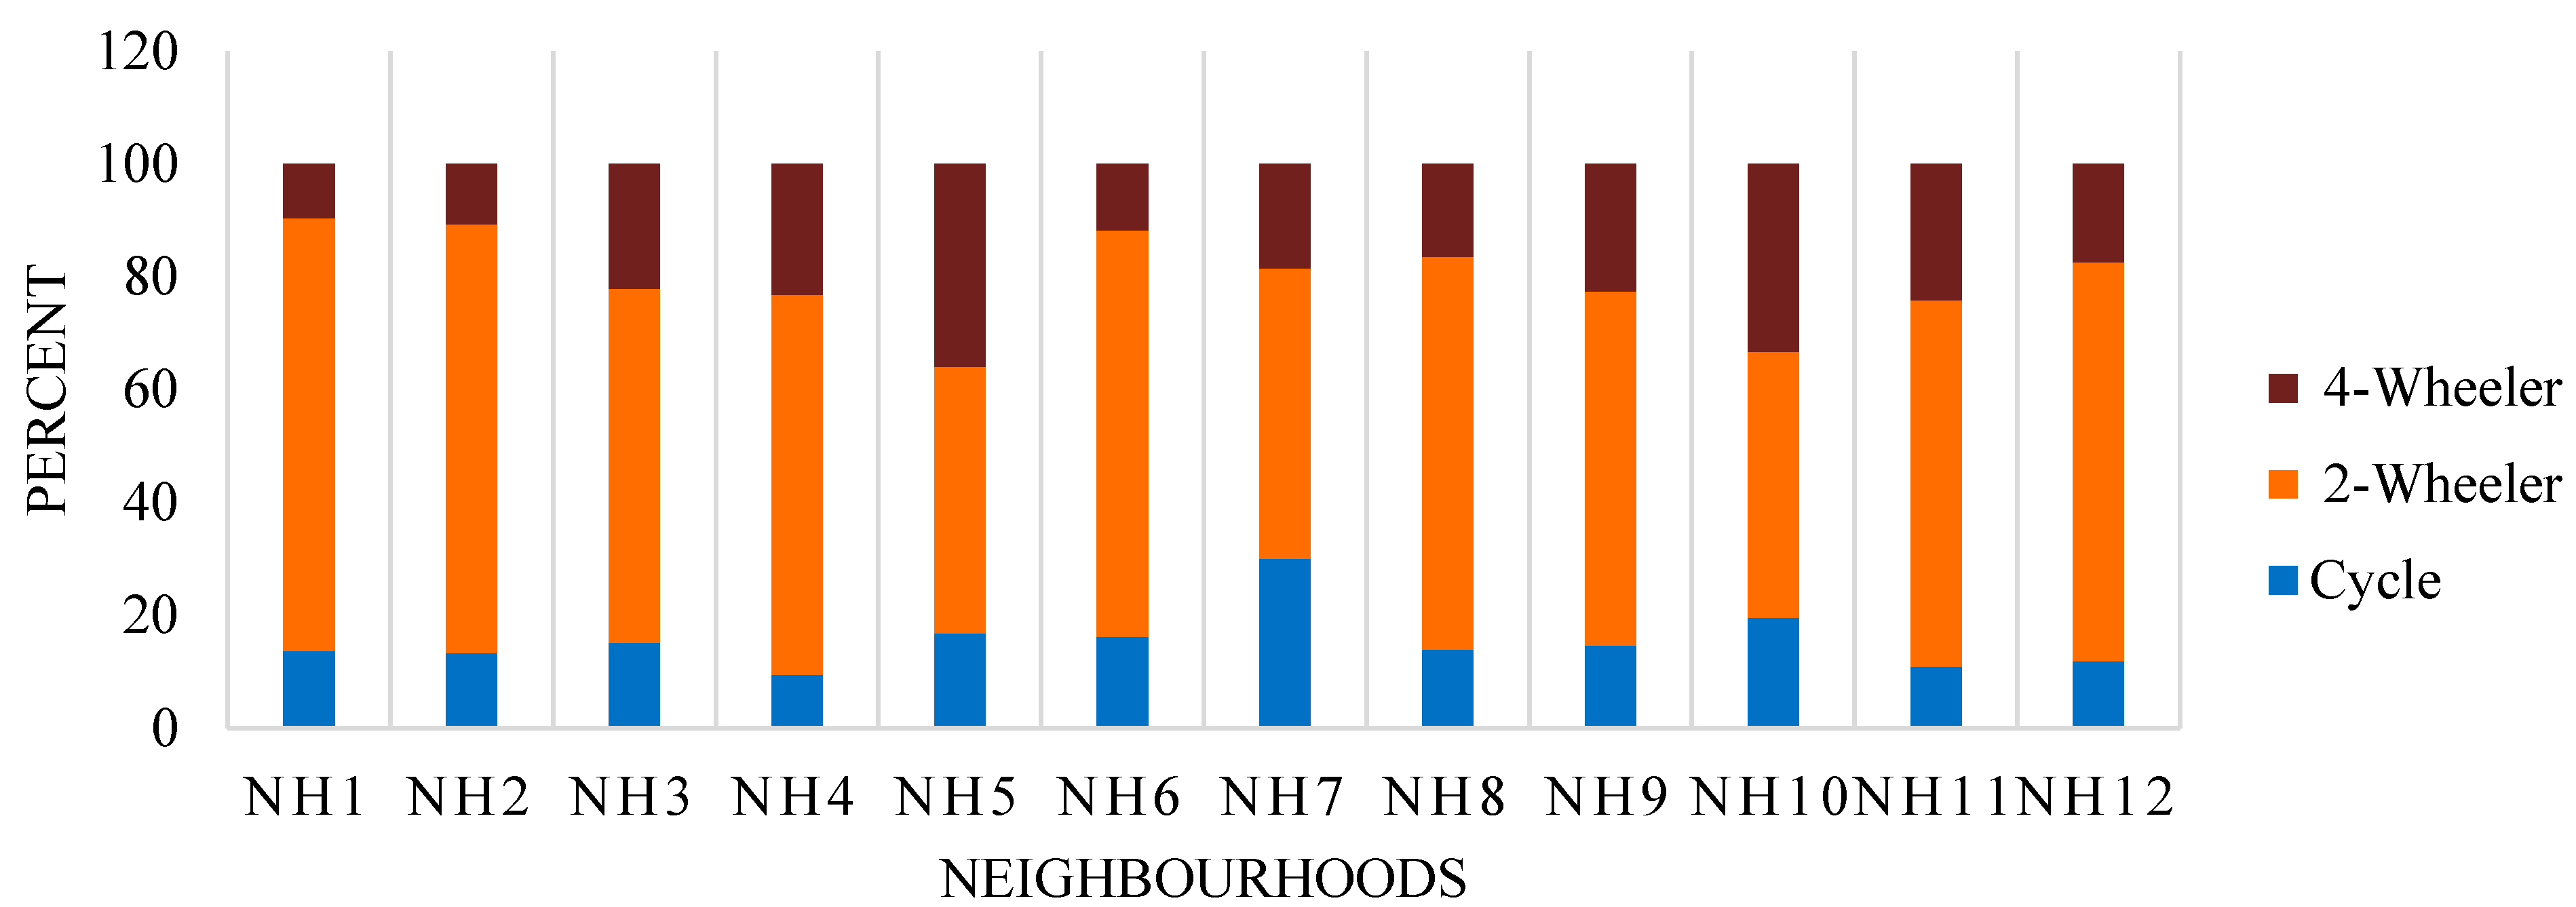
2.2.3. Vehicle Ownership
Vehicle ownership is recorded in terms of the number of cycles, two-wheelers, and four-wheelers. Vehicle ownership per household is calculated in terms of percentage (refer Figure 5). Nagpur is a two-wheeler city, where two-wheelers contribute to 55 percent of all mode of transport share and 65 percent of non-motorized mode share [38]. It is observed that irrespective of the income group and neighbourhood type, two-wheeler ownership is high and constant. Vehicle ownership is observed to be linked with the income levels as cycle ownership is high in neighbourhoods with low income residents (NH7) whereas, car ownership is higher in neighbourhoods with high income residents (NH5 and NH10). However, many residents in high mix (L1) neighbourhoods reported that, they can afford a car but are discouraged to own one due to the unavailability of parking space and congestion.

Figure 5.
Vehicle ownership in percentage.
Figure 5.
Vehicle ownership in percentage.
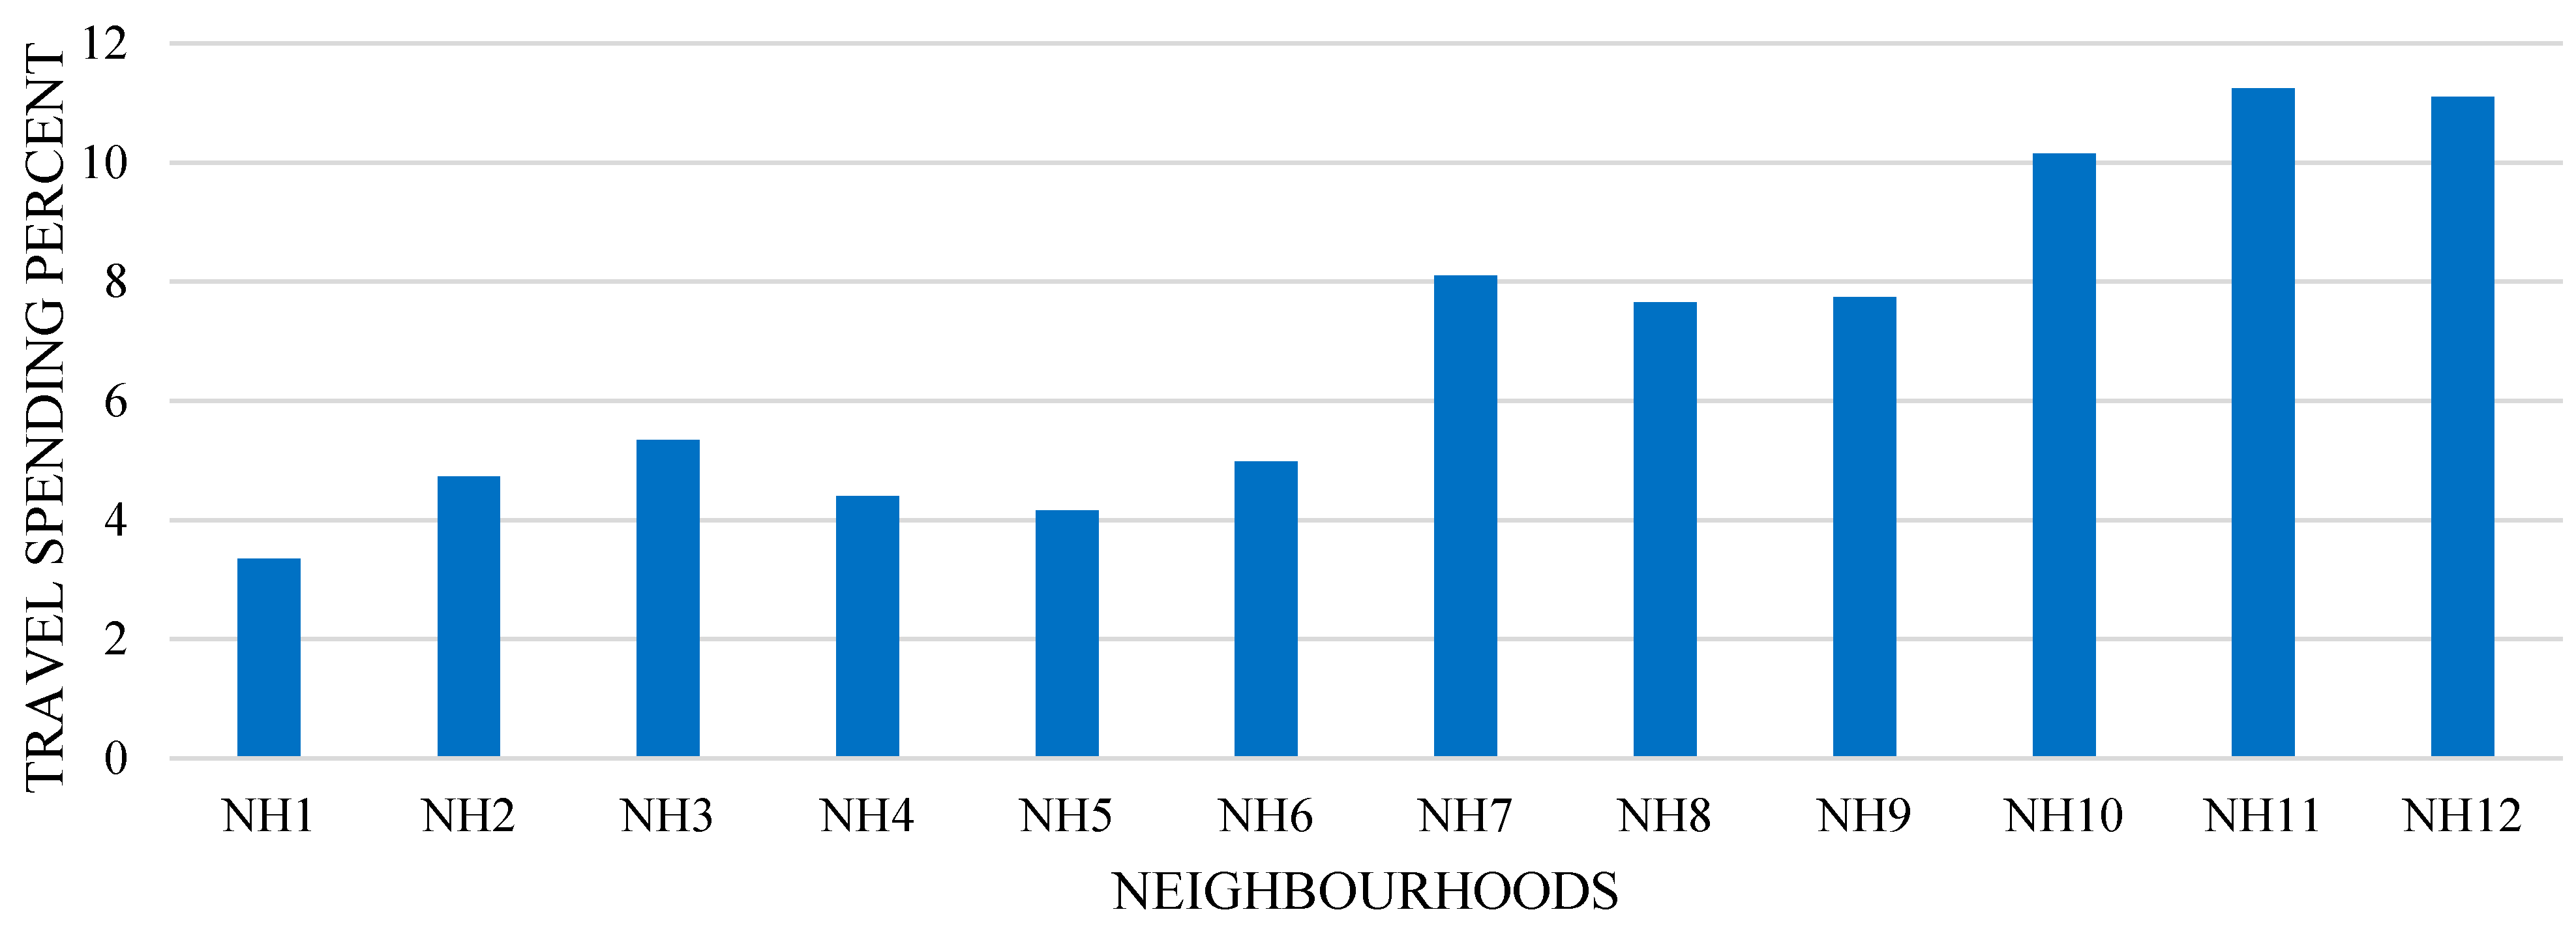
2.2.4. Travel Expenses
The average household income of residents from NH4, NH5, and NH10 is high, and that of residents from NH7 is low; the income of inhabitants from other neighbourhoods is in a similar range. Total travel expenses per month are calculated as a sum of spending for different destination trips and the maintenance of the vehicles (refer to Figure 6). It is observed that residents in neighbourhoods with high land-use mix spend less and those living in neighbourhoods with low land-use mix spend more on travel.

Figure 6.
Percentage of household income on travel expenses per month.
Figure 6.
Percentage of household income on travel expenses per month.
2.3. Third Stage—Residents’ Perception: Indicators, Results and Observations
The study of perception tries to understand residents’ perception about the neighbourhood in the context of safety, satisfaction, pollution, interaction, and mix. This insight is obtained through a household survey. The questionnaire is formulated on the five-point Likert scale (LS) (scored as 1-strongly satisfied; 2-satisfied; 3-neither; 4-dissatisfied; and 5-strongly dissatisfied) and “yes/no” (Y/N) answers nominal scale as mentioned in Table 4.
Table 4.
Residents’ perception (qualitative indicators).
| Indicator Set | Indicator Description |
|---|---|
| Safety and Satisfaction | 1. On street Safety (Y/N) |
| 2. Satisfied with amenities in NH (Y/N) | |
| 3. Wish to shift from current NH (Y/N) | |
| 4. Part of Social Group (Y/N) | |
| 5. Neighbourhood Safety (LS) | |
| 6. Neighbourhood Quality (LS) | |
| 7. Sense of Belonging (LS) | |
| Pollution | 8. Feel Traffic Problem (Y/N) |
| 9. Feel Noise Pollution(Y/N) | |
| 10. Feel Air Pollution(Y/N) | |
| Favour Mix | 11. Favour mix of residential and commercial land-use (LS) |
| 12. Favour mix LIG, MIG and HIG (LS) |
2.3.1. Safety and Satisfaction
The road and neighbourhood safety is studied. Road safety is studied through accidents and neighbourhood safety in terms of natural surveillance, citizen’s safety, and safety from theft. Satisfaction is studied in terms of neighbourhood quality, availability of amenities, a sense of belonging, residents’ wish to migrate to another neighbourhood, and their participation in a social group. Figure 7a indicates the residents’ aspiration towards safety and satisfaction measured as the percentage of “yes choices”. The high score on “yes choices” for street safety, satisfaction about amenities, and participation indicates that residents feel safe and are satisfied, however a high score on migration indicates dissatisfaction. Figure 7b indicates the cumulative count of the Likert scale for thirty households in each neighbourhood. The higher score on the Likert scale indicates higher neighbourhood safety, quality and sense of belonging.
The amount of satisfaction felt by the residents towards their neighbourhood is studied. Quality amenities within the neighbourhood satisfy the residents. In many neighbourhoods some amenities are highly accessible, while others are less accessible. Dissatisfaction with the quality of the neighbourhood leads to an urge to migrate to a better neighbourhood. The sense of belonging is highly related to the social factor rather than the physical factor.
The overall satisfaction level is above average even when there is inadequate infrastructure. Areas with high land-use mix (L1) are safer in terms of natural surveillance and theft, but not in road safety. They suffer from poor quality of life due to high congestion and, lack of infrastructure and open spaces. Due to the environmental externalities and the pressure to accommodate space for commercial use, L1 residents prefer migration. L1 and L2 residents have a strong sense of belonging and social bonding. They also interact and take active part in social activities and know more people in their neighbourhood. Residents in moderate mix (L2, L3, and NH10) areas perceive their neighbourhoods as safe and have a higher level of satisfaction. Low land-use mix (NH11 and NH12) residents feel unsafe and dissatisfied due to sprawl, poor road infrastructure, lack of street lights, and little natural surveillance. They show the lowest sense of belonging.
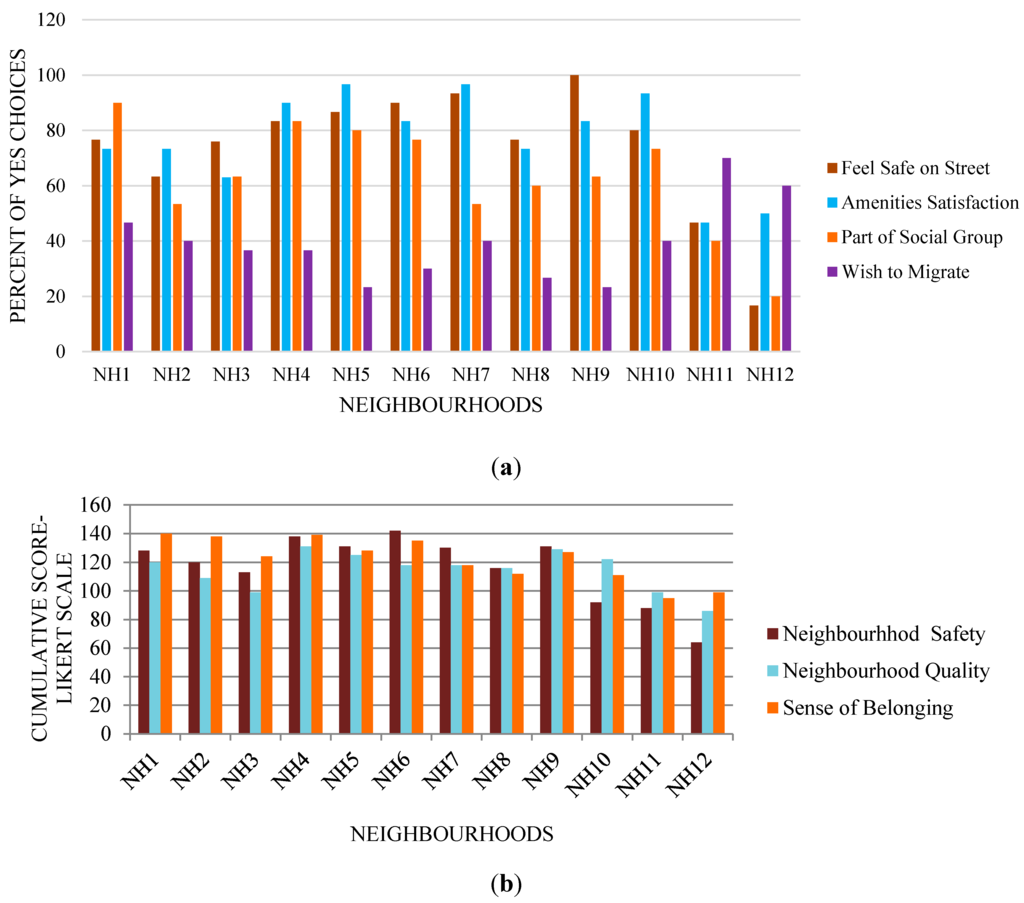
Figure 7.
(a) Safety and satisfaction—percentage; (b) safety and satisfaction—cumulative scores.
Figure 7.
(a) Safety and satisfaction—percentage; (b) safety and satisfaction—cumulative scores.

2.3.2. Pollution and Traffic Problem
Figure 8 shows the percentage of “yes choices” for pollution and traffic problems. High pollution and the problem of traffic congestion are observed in L1 neighbourhoods. However, some residents from the highly noisy L1 area mentioned that they are used to the high noise level and feel uncomfortable in complete silence. L3 neighbourhoods are perceived as less polluted neighbourhoods. NH10 does not have pollution issues due to high greenery and low density. Some pollution in NH11 and NH12 is seen due to continuous construction work. Neighbourhoods with a high land-use mix see pollution and traffic congestion as externalities.
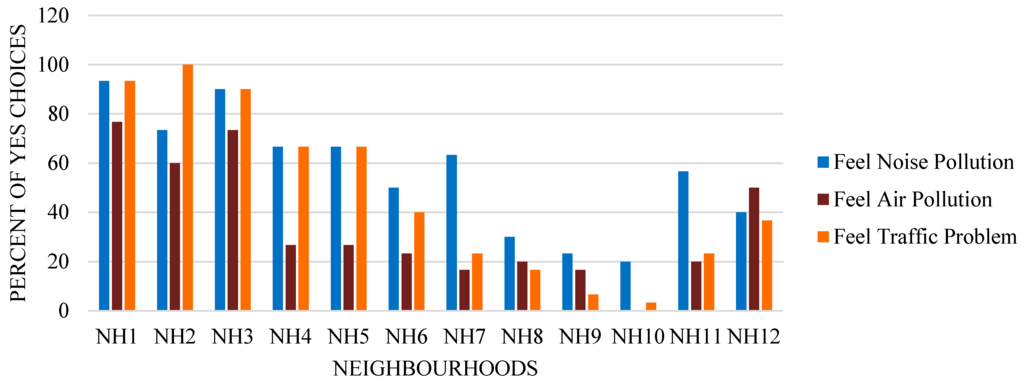
Figure 8.
Pollution and traffic related problems.
Figure 8.
Pollution and traffic related problems.

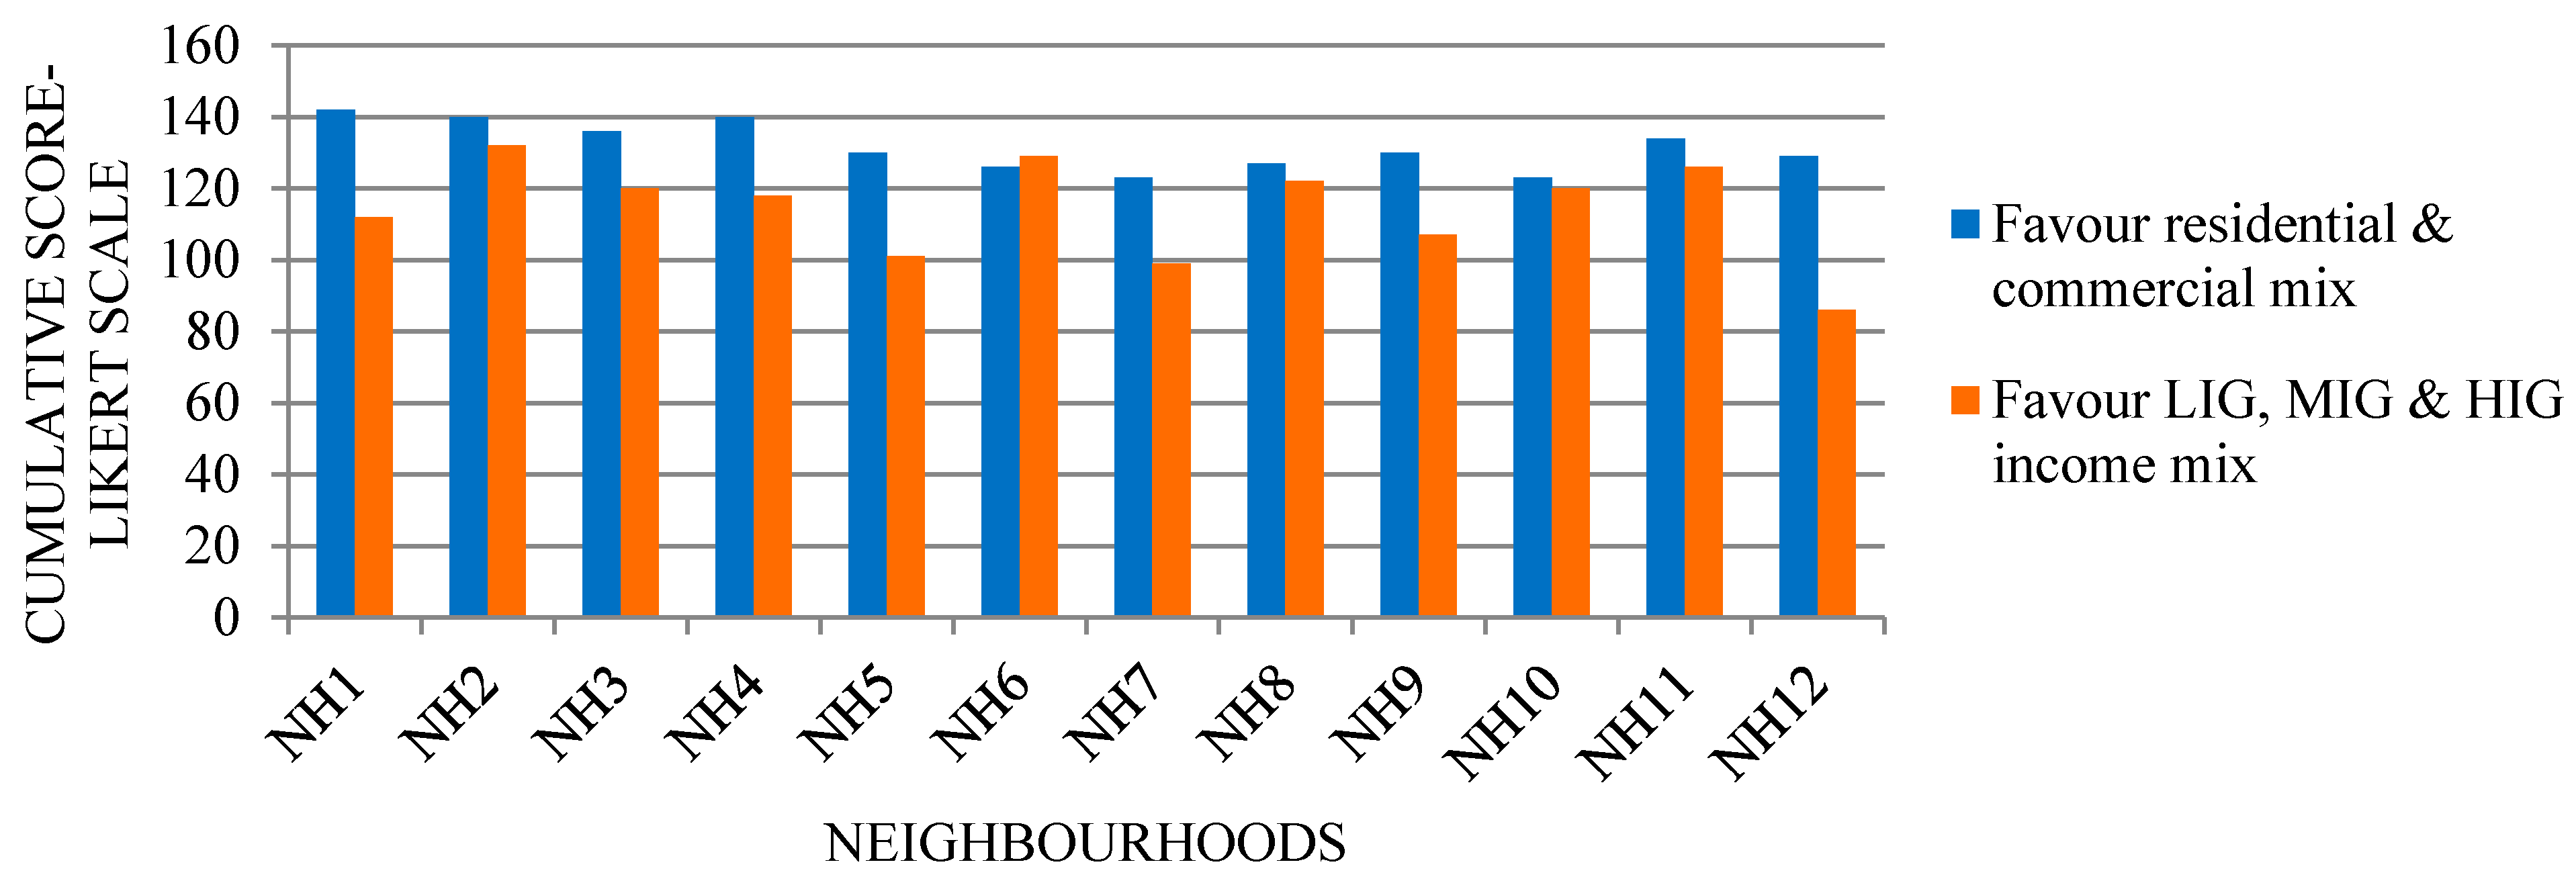
2.3.3. Favour Mix
This section studies residents’ opinion on the mixing of land uses and income. Dwellers favoured a mix of land uses. They mentioned that the commercial area should be on the main road and the residential area should be in the inner part of the neighbourhood by which they would benefit from the proximity to daily needs without having to suffer the externalities associated with commercial use. Most residents expressed their inclination towards a mix of Middle Income Group (MIG) or HIG but not Lower Income Group (LIG) (refer Figure 9). They also stated they are more comfortable with a similar income group.
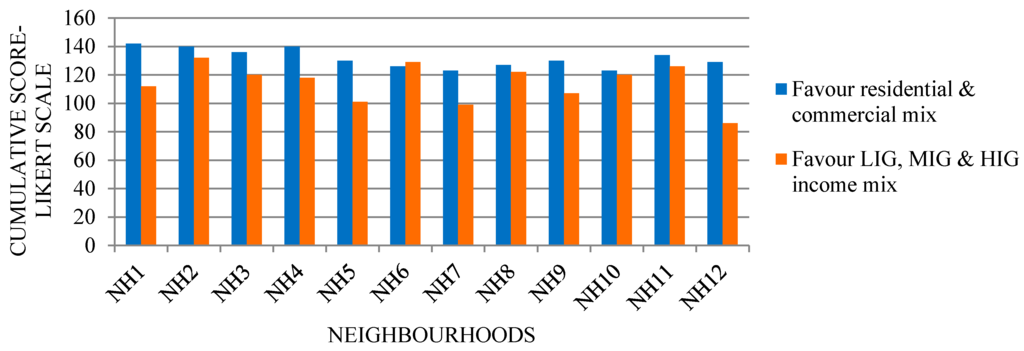
Figure 9.
Residents favouring mix—cumulative scores.
Figure 9.
Residents favouring mix—cumulative scores.
3. Sustainability Index Based on Composite Indicators
Sustainability index is calculated using composite indicators which are assigned performance based benchmarking and weights for each neighbourhood.
3.1. Normalization and Benchmarking
Normalization is used to convert different indicator units into a common and comparable scale. The various normalization methods are: (a) ranking based on the indicators’ performance over time; (b) standardization or z score; (c) rescaling or min-max method; (d) categorical scale [39].
This study uses normalization on a five-point scale as shown in the Table 5. The colours in the table act as a visual aid for representing the levels of sustainability. To achieve sustainability, the goal for the neighbourhood is to attain a five score.
Table 5.
Sustainability benchmarks scores based on normalization.
| Five-Point Scale | Sustainability Benchmark (Colours represents levels) |
|---|---|
| 1 | Low (extremely unsustainable situation) |
| 2 | Medium-Low (not suitable but not as bad as in previous case) |
| 3 | Medium (discrete level of sustainability) |
| 4 | Medium-High (satisfactory level of sustainability) |
| 5 | High (target level of sustainability) |
Benchmarking establishes a baseline measure for the performance of individual indicators and acts as a yardstick to measure and compare effectiveness. It helps in the appraisal of performance and comparative analysis of neighbourhoods and allows for improvement on current performance.
3.1.1. Benchmarking for Travel Behaviour
The benchmarking for travel behaviour is based on the literature review, expert opinions, and the comparative scale. A lower distance to the destination results in high sustainability. Studies mention that the walking distance to the destination should be less than a quarter of a mile (~0.4 km) [40,41]. Preferred trip length for various purpose of travel varies. The benchmark for a shopping trip length starts from a range of 0.0–0.4 km with an increment of 0.4 km as shops must be accessible by foot. For school, health, and recreational facilities, benchmarking range starts at 0.0–0.8 km as these can be accessible by foot or cycle. Work places are scattered all over the city and residents move out of the neighbourhood for work, thus the benchmarking range starts at 0.0–1.5 km. Institutes for higher education are usually not within or near the neighbourhoods but are spread at different locations in the city and suburbs, thus college going students commute long distances. So, the benchmarking range for higher education starts at 0.0–1.5 km.
Walk, cycle, and transit are the sustainable modes of travel whereas two-wheelers and four-wheelers are non-sustainable modes. The percentage mode share is used for benchmarking.
To compute vehicle ownership two-wheeler and four-wheeler ownership is converted to Passenger Carriage Unit (PCU) for uniformity. The final PCU (vehicle ownership) is computed by the following Equation (3).
where, 0.5 and 1.0 is the conversion factor for two-wheeler and four-wheeler respectively [42], Avg 2W and Avg 4W is the two-wheeler and four-wheeler ownership per neighbourhood respectively, Avg HH is the average household size in each neighbourhood which varies from 5.27 in NH1 to 3.37 in NH9 and 4.8 is the average national household size [43]. For benchmarking of vehicle ownership, a lower PCU score specifies higher sustainability.
Household spending on travel is calculated in the percentage of household income. Expenses more than 3% are considered for the benchmark value. The higher the percentage of travel expenses, the lower is the sustainability (refer to Table 6).
3.1.2. Benchmarking for Perception
The benchmarking for perception is based on the expert opinions and comparative scale. The “yes/no” nominal scale questions are converted into the percentage of the households who answered yes. For street safety, satisfaction, and social participation, higher sustainability means a higher percentage of “yes” and vice-versa. The residents’ “urge to migrate” is recorded in the reverse scale, thus its higher percentage means lower sustainability. Similarly, if perception for pollution and traffic problems is high then the neighbourhood has low sustainability. Neighbourhood safety, quality, sense of belonging, and favouring mix are recorded on a five-point Likert scale. Scores are converted to a 1 to 5 sustainability scale (refer Table 7).
3.2. Weights and Aggregation
Assigning weights to indicators is critical because weighting reflects the relative importance given to each indicator. For travel behaviour indicators, weights are assigned based on researcher’s insight, peers opinion, and residents’ view. The share of trip length in indicators is 70%, as it has eight sub-indicators under it. Other indicators (travel mode, vehicle ownership and travel expenses) have a share of 10% each.
The equal weighting technique is adopted for perception data. This is adopted because diversified indicators are present, and it is difficult to judge which is better than the other. There are twelve indicators and each has one twelfth of the weight as shown in Table 5.
Aggregation groups all the indicator scores into a composite index score. To determine the composite indicator score, linear aggregation of the weighted normalized indicator is derived by the Equation no (4).
where, i = 1,2,3,….n, and n is 11 for travel behaviour and 12 for perception indicator; w is the weight of each indicator as mentioned in Table 5 and Table 6; and I correspond to the normalized indicator score between 1 to 5.
Table 6.
Benchmarking and weights for travel behaviour indicators.
| Indicator Description | Sustainability Benchmarking Range | Weights | ||||||
|---|---|---|---|---|---|---|---|---|
| Low | Medium-Low | Medium | Medium-High | High | A | Fraction of A | Weights | |
| 1 | 2 | 3 | 4 | 5 | % | |||
| 1. Trip length for Work | 6.01–more | 4.51–6.00 | 3.01–4.50 | 1.51–3.00 | 0–1.50 | 70 | (2/8) × A | 0.175 |
| 2. Trip length for Shop | 1.61–more | 1.21–1.60 | 0.81–1.20 | 0.41–0.80 | 0.00–0.40 | (1/8) × A | 0.088 | |
| 3. Trip length for Vegetable market | 1.61–more | 1.21–1.60 | 0.81–1.20 | 0.41–0.80 | 0.00–0.40 | (0.75/8) × A | 0.066 | |
| 4. Trip length for School | 3.21–more | 2.41–3.20 | 1.61–2.40 | 0.81–1.61 | 0.00–0.80 | (1/8) × A | 0.088 | |
| 5. Trip length for College | 6.01–more | 4.51–6.00 | 3.01–4.50 | 1.51–3.00 | 0–1.50 | (0.75/8) × A | 0.066 | |
| 6. Trip length to Health facility | 3.21–more | 2.41–3.20 | 1.61–2.40 | 0.81–1.61 | 0.00–0.80 | (1/8) × A | 0.088 | |
| 7. Trip length for Restaurant/Theatre | 3.21–more | 2.41–3.20 | 1.61–2.40 | 0.81–1.61 | 0.00–0.80 | (0.75/8) × A | 0.066 | |
| 8. Trip length for Garden | 1.61–more | 1.21–1.60 | 0.81–1.20 | 0.41–0.80 | 0.00–0.40 | (0.75/8) × A | 0.066 | |
| 9. Percentage of Sustainable mode (Walk + Cycle + Transit) | 0.00–20.00 | 20.01–40.00 | 41.01–60.00 | 60.01–80.00 | 80.01–100 | 30 | (1/3) × A | 0.1 |
| 10. Two-Wheelers and Four-Wheelers Converted in Passenger Car Unit (PCU) | 4.01–more | 3.01–4.00 | 2.01–3.00 | 1.01–2.00 | 0.00–1.00 | (1/3) × A | 0.1 | |
| 11. Percentage of Income spent on Travelling | 12.01–more | 9.01–12.00 | 6.01–9.00 | 3.01–6.00 | 0.00–3.00 | (1/3) × A | 0.1 | |
Table 7.
Benchmarking and weights for perception indicators.
| Indicator Description | Units | Sustainability Normalization Range | Equal Weights | ||||
|---|---|---|---|---|---|---|---|
| Low | Medium-Low | Medium | Medium-High | High | |||
| 1 | 2 | 3 | 4 | 5 | |||
| 1. On Street Safety | Percentage of household answered Yes | 59–less | 60–69 | 70–79 | 80–99 | 90–100 | 1/12 = 0.083 each |
| 2. Satisfied with Amenities in NH | 59–less | 60–69 | 70–79 | 80–99 | 90–100 | ||
| 3. Part of Social Group | 59–less | 60–69 | 70–79 | 80–99 | 90–100 | ||
| 4. Wish to Shift from Current NH | 61–more | 46–60 | 31–45 | 16–30 | 0–15 | ||
| 5. Neighbourhood Safety | 5 point Likert scale | 1 | 2 | 3 | 4 | 5 | |
| 6. Neighbourhood Quality | 1 | 2 | 3 | 4 | 5 | ||
| 7. Sense of Belonging | 1 | 2 | 3 | 4 | 5 | ||
| 8. Feel Traffic Problem | Percentage of household answered Yes | 86–100 | 71–85 | 56–70 | 41–55 | 40–less | |
| 9. Feel Noise Pollution | 86–100 | 71–85 | 56–70 | 41–55 | 40–less | ||
| 10. Feel Air Pollution | 86–100 | 71–85 | 56–70 | 41–55 | 40–less | ||
| 11. Favour Mix of Residential and Commercial use | 5 point Likert scale | 1 | 2 | 3 | 4 | 5 | |
| 12. Favour Mix of LIG, MIG and HIG | 1 | 2 | 3 | 4 | 5 | ||
3.3. Discussion
The composite indicator, sustainability index, sustainability level, and ranking of the neighbourhoods for both residents’ travel behaviour and perception is presented in Table 8. The composite indicators’ score is in the range of 0 to 5. It is converted to 0 to 1 scale to compute the sustainability index. The sustainability index of travel behaviour is in the range of 0.27 (for NH11) to 0.78 (for NH1) and perception is in the range of 0.47 (for NH12) to 0.83 (for NH6 and NH9).
Table 8.
Sustainability index for travel behaviour and perception.
| Category Levels | Selected Neighbourhoods | Travel Behaviour | Residents Perception | |||||||
|---|---|---|---|---|---|---|---|---|---|---|
| Composite Indicator Score | Sustainability Index | Comparative Sustainability level | Ranking | Composite Indicators Score | Sustainability Index | Comparative Sustainability level | Ranking | |||
| L1 | Buldi | NH1 | 3.90 | 0.78 | 4 | 1 | 3.25 | 0.65 | 3 | 8 |
| Itvari | NH2 | 3.27 | 0.65 | 3 | 3 | 3.11 | 0.62 | 3 | 9 | |
| Mahal | NH3 | 2.65 | 0.53 | 3 | 7 | 3.02 | 0.60 | 3 | 10 | |
| L2 | Sadar | NH4 | 3.50 | 0.70 | 4 | 2 | 3.97 | 0.79 | 4 | 4 |
| Dharampeth | NH5 | 2.89 | 0.58 | 3 | 6 | 3.92 | 0.78 | 4 | 6 | |
| Buddha Nagar | NH6 | 3.10 | 0.62 | 3 | 5 | 4.17 | 0.83 | 4 | 1 | |
| L3 | Nagsen Nagar | NH7 | 3.20 | 0.64 | 3 | 4 | 3.84 | 0.77 | 4 | 7 |
| Trimurti Nagar | NH8 | 2.41 | 0.48 | 2 | 8 | 3.97 | 0.79 | 4 | 4 | |
| Friends Colony | NH9 | 1.84 | 0.37 | 2 | 9 | 4.17 | 0.83 | 4 | 1 | |
| L4 | Civil Lines | NH10 | 1.61 | 0.32 | 2 | 10 | 4.11 | 0.82 | 4 | 3 |
| Manish Nagar | NH11 | 1.37 | 0.27 | 1 | 12 | 2.51 | 0.50 | 3 | 11 | |
| Nara | NH12 | 1.40 | 0.28 | 1 | 11 | 2.34 | 0.47 | 2 | 12 | |
Note: Refer Table 5 for color coding.
The resultant sustainability scores of the neighbourhoods are grouped in five comparative sustainability levels. The final ranking is decided based on the sustainability index score. The neighbourhood with a high index is sustainable and ranked first in the list. Neighbourhoods with a high land-use mix are ranked at the top in travel behaviour, but ranked eighth to tenth in a perception survey. Neighbourhoods with moderate land-use mix are ranked between the third and ninth position for travel behaviour and first to seventh for perception. L4 neighbourhoods having a low land-use mix are ranked last in both cases except NH10 which is placed at third position in perception due to green ambiance and superior infrastructure.
3.3.1. Residents’ Travel Behaviour
The travel behaviour study revealed that areas with a high mix of land-use (with entropy index between 0.71 and 1.00) have less trip length, less vehicle ownership, and less travel expenses. Thus, they are more sustainable with a score of 3 and 4 out of 5. However, the neighbourhoods with less land-use mix are scaled as extremely unsustainable (score 1) to unsustainable (score 2) as they need to travel long distances for all amenities and thus, have high vehicle ownership and more travel expenses (refer to Figure 10). Neighbourhoods with moderate land-use mixed are placed at the satisfactory level of sustainability. The findings in this study confirm the results of prior studies on land-use and travel relationship.
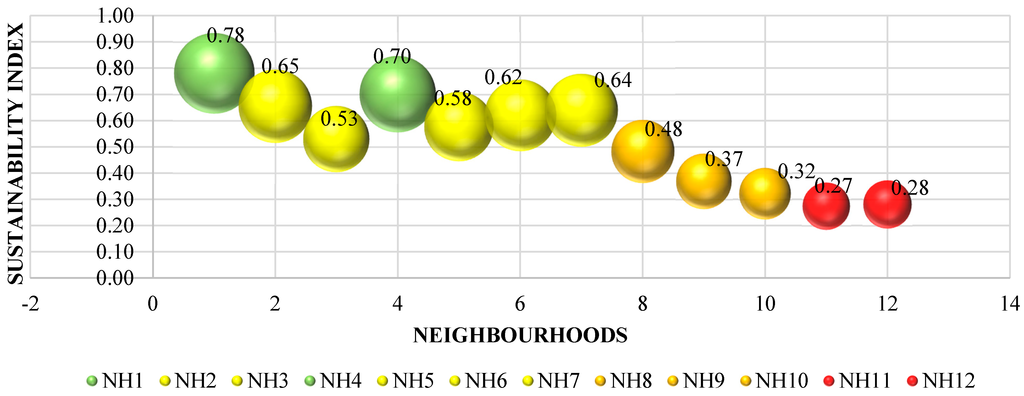
Figure 10.
Sustainability index for travel behaviour.
Figure 10.
Sustainability index for travel behaviour.

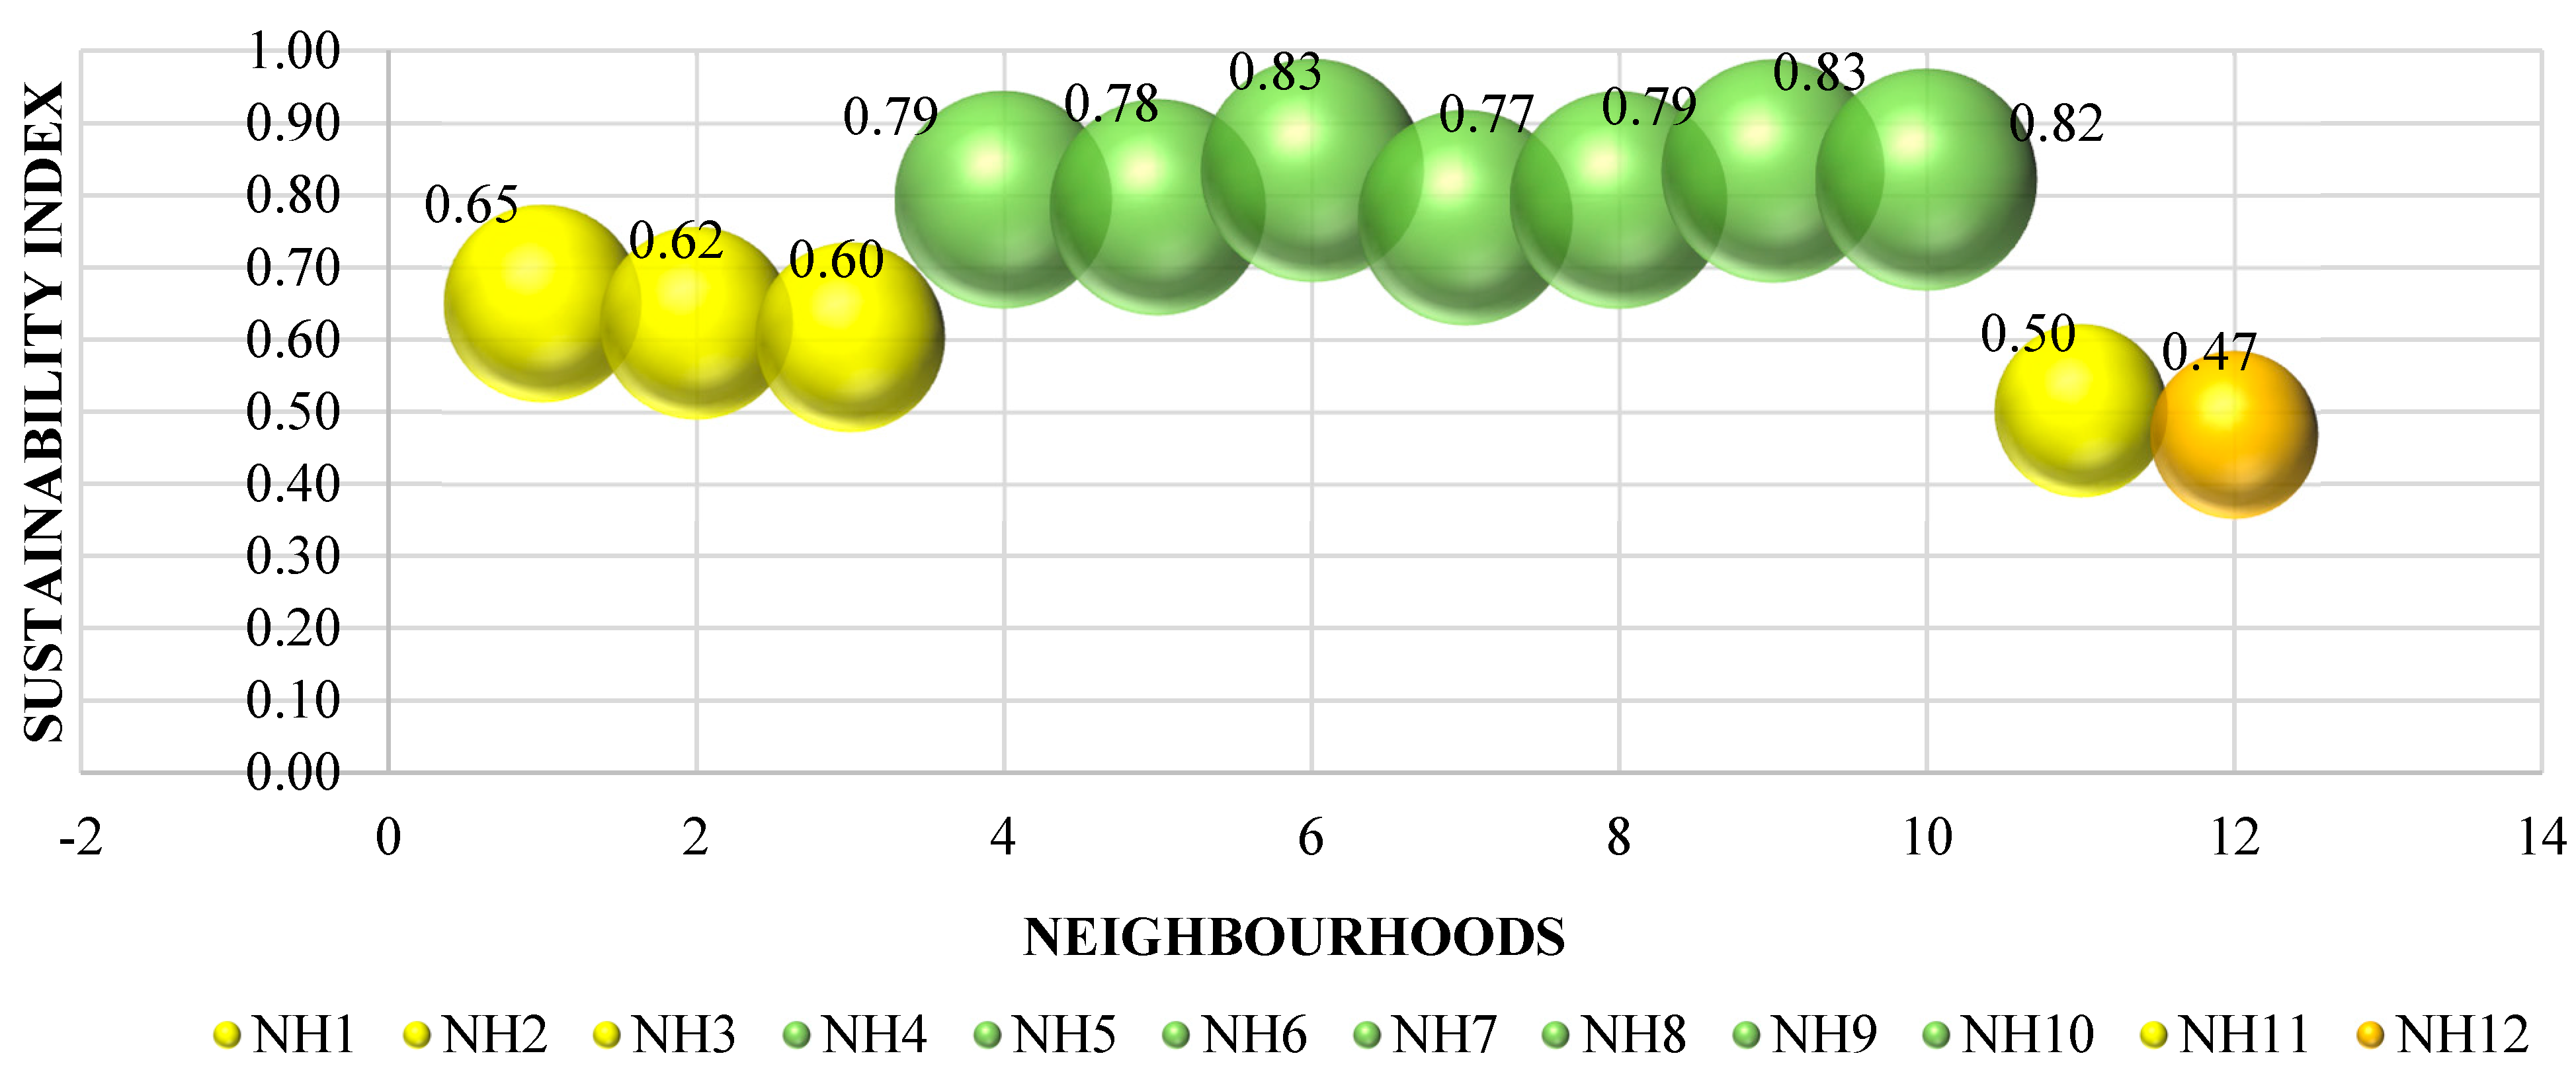
3.3.2. Residents’ Perception
Prior studies mention the social benefits of the mix land-use [6], but the study presented here reveals that neighbourhoods with moderate land-use mix are better liveable spaces than neighbourhoods with high land-use mix. This may be due to the fact that most prior studies have been in the context of developed countries where the land-use mix characteristics are very different from developing countries. Moreover, peoples’ adaptability to various impacts of land-use mix also varies. It is observed that overall residents express a level of satisfaction even with inadequate facilities and infrastructure. Thus, none of the neighbourhood is extremely-sustainable (score 5) or extremely-unsustainable (score 1) and only one is unsustainable (score 2). Neighbourhoods with moderate land-use mix are sustainable, areas with high and low land-use mix have average sustainability (score 3) (refer to Figure 11).
The sustainability index of residents’ travel behaviour with perception shows low correlation (0.30). The findings suggest that, even though neighbourhoods with high land-use mixed are sustainable in travel domain, the residents do not prefer to be part of these neighbourhoods; nor do they want to be part of neighbourhoods with low land-use mix (NH11 and NH12). They prefer neighbourhoods with moderate land-use mix. This advocates that residents wish to stay in neighbourhoods with moderate land-use mix and not in high or low land-use mix.
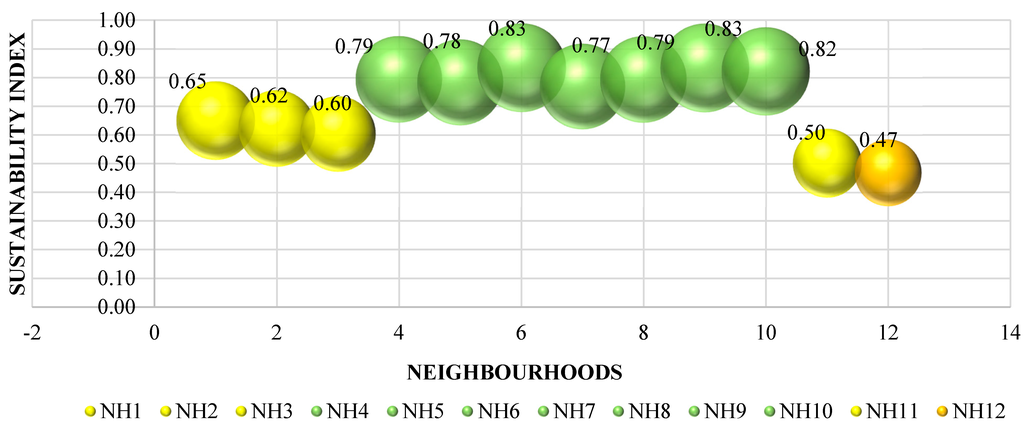
Figure 11.
Sustainability index for residents’ perception.
Figure 11.
Sustainability index for residents’ perception.
3.3.3. Relationship of Mixed Land-Use Measure with Residents’ Travel Behaviour and Perception
Figure 12 shows the relationship of land-use mix measure (entropy index) with resident’s travel behaviour and perception. The sustainability index score of resident’s perception is higher than that of travel behaviour. Low entropy index score (i.e., low mix land-use) is related to low sustainability. Moderate to high entropy index score (i.e., moderate to high mix land-use) is related to moderate to high sustainability.
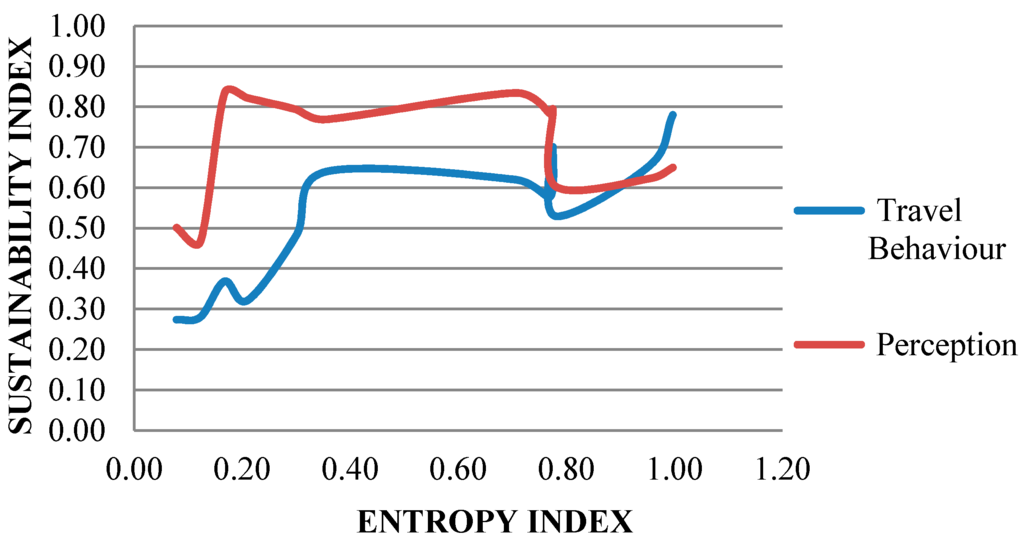
Figure 12.
Scatter plot showing relationship of entropy index and sustainability index.
Figure 12.
Scatter plot showing relationship of entropy index and sustainability index.

The correlation of the land-use mix (entropy index) with travel behaviour is 0.88 indicating both are highly correlated. Travel behaviour is sustainable when the land-use mix is high and vice versa.
The correlation of the land-use mix entropy index with perception is 0.10 indicating poor correlation. It signifies that land-use mix does not directly encourage perception, however, adequate amenities, good infrastructure, and less pollution contribute to an affirmative opinion. In study areas, neighbourhoods with high and low land-use mix lacked infrastructure, leading to dissatisfaction. Thus the poor correlation is perceived.
4. Conclusions
There is a strong advocacy to bring different land uses together for achieving sustainability. Indian cities have a legacy of mixed land-use character. There is an evident mix of land uses in the present context which hints towards a similar trend in the future as well. Here the concern is the proportion of the mix of different land uses for creating sustainable built environment.
Residential and commercial land-use mix is the most compatible mix type. However, the proportion of the mix of these two compatible land uses (commercial and residential) which leads to sustainability has not been explored in prior studies. The change in the land-use mix affects the inhabitants’ travel behaviour, their safety and their satisfaction. The current study tries to identify sustainability indices for neighbourhoods with different land-use mix. By surveying twelve neighbourhoods (NH1 to NH12) categorized under four levels (L1 to L4) with different land-use mix, the study has attempted to comprehend how the neighbourhood performs with the change in land-use mix proportion. Mixed land-use is measured as entropy index of commercial and residential land-use.
Perception is carried out to encompass participatory approach, behaviour and experiences with the neighbourhood. The relationship between mixed land-use and travel behaviour has been well established in prior studies and is confirmed in the current study. Mixed land-use measure is highly correlated with the travel behaviour sustainability index, but is weakly correlated to the residents’ perception sustainability index.
It can be concluded that the neighbourhoods with high land-use mix (L1 category with entropy nearing 1) are sustainable when it comes to travel behaviour but residents are not satisfied here due to the externalities associated with pollution, congestion, and lack of infrastructure.
The neighbourhoods with low land-use mix (L4 category with entropy nearing 0) are extremely unsustainable due to greater travel distance, poor accessibility of amenities, inadequate infrastructure, as well as safety and satisfaction issues. NH10 even though being a low and segregated land-use mixed neighbourhood, is more sustainable as it is planned and maintained with a good physical infrastructure and is the greenest part of the city.
Moderate land-use mix neighbourhoods (L2 and L3 category with entropy in the range of 0.77 to 0.33) are sustainable both in terms of residents’ travel behaviour and perception, and are preferred by the residents. The citizens prefer to be a part of a green, aesthetically appealing, with adequate infrastructure, mixed land-use neighbourhood.
The outcome of the study suggests that high land-use mixed areas though sustainable in the travel domain are not likewise sustainable in the perception domain, due to dissatisfaction amongst the residents here. Low land-use mix and sprawled areas are unsustainable both for the travel and the perception domain. Moderate mix neighbourhoods lead to sustainable development.
Acknowledgments
The authors would like to acknowledge support provided by Visvesvaraya National Institute of Technology, Nagpur, India for publishing this work. The authors would also like to acknowledge support provided by residents during the household surveys conducted in various parts of Nagpur city.
Author Contributions
Sarika Bahadure, first author, took the initiative and conceived the study, shortlisted the indicators, collected data through household surveys, and carried out the statistical analysis. Rajashree Kotharkar, the second author, provided a methodology, framework and revisions for study, and structure of the paper.
Conflicts of Interest
The authors declare no conflict of interest.
References
- Jill, G. Mixed use in theory and practice: Canadian experience with implementing a planning principle. J. Am. Plann. Assoc. 2002, 68, 71–84. [Google Scholar]
- Miller, N.A.; Miller, J. Defining Mixed-Use Development. Available online: http://designforhealth.net/wp-content/uploads/2012/12/DPmixed_use.pdf (accessed on 12 March 2014).
- Graeme, E.; Foord, J. The Generation of Diversity: Mixed-Use and Urban Sustainability. In Urban Sustainability through Environmental Design: Approaches to Time-People-Place Responsive Urban Spaces; Porta, S., Romice, O., Greaves, M., Thwaites, K., Eds.; Routledge: New York, NY, USA, 2007. [Google Scholar]
- Tombari, E.A. Smart Growth, Smart Choices Series: Mixed-Use Development; AICP Land Development Series; National Association of Home Builders (NAHB): Washington, DC, USA, 2005. [Google Scholar]
- Jones, P.; Roberts, M.; Morris, L. Rediscovering Mixed-Use Streets, the Contribution of Local High Streets to Sustainable Communities; The Policy Press: Bristol, UK, 2007. [Google Scholar]
- Saville-Smith, K.; Dwyer, M.; Warren, J. Valuing Sustainable Neighbourhoods Final. s.l.: Report NH3112/2 for Beacon Pathway Limited. Available online: http://www.beaconpathway.co.nz/images/uploads/Final_Report_NH3112(2)_Valuing_neighbourhoods.pdf (accessed on 17 August 2015).
- Jane, J. The Death and Life of Great American Cities; Vintage: New York, NY, USA, 1961. [Google Scholar]
- Hidalgo, D.; Pai, M.; Carrigan, A.; Bhatt, A.; Owen, B. National Investment in Urban Transport Towards People’s Cities through Land Use and Transport Integration; Shakti Sustainable Energy Foundation: New Delhi, India, 2012. [Google Scholar]
- Lucas, R.E.; Rossi-Hansberg, E. On the Internal Structure of Cities. Econometrica 2002, 70, 1445–1476. [Google Scholar] [CrossRef]
- Sita, K.; Phadke, V.; Guha, S. The Declining City-Core of an Indian Metropolis: A Case Study of Bombay; Concept Publishing Company: New Delhi, India, 1988. [Google Scholar]
- Saville-Smith, K.; Lietz, K.; Bijoux, D.; Howell, M. Neighbourhood Sustainability Framework: Prototype. s.l.: NH101 Prepared for Beacon Pathway Limited; Beacon Pathway Limited and the Foundation for Research, Science and Technology: Auckland, New Zealand, 2005. [Google Scholar]
- Brown, B.B.; Yamada, I.; Smith, K.R.; Zick, C.D.; Jones, L.K.; Fana, J.X. Mixed land use and walkability: Variations in land use measures and relationships with BMI, overweight, and obesity. Health Place 2009, 15, 1130–1141. [Google Scholar] [CrossRef] [PubMed]
- Cervero, R. Land Use Mixing and Suburban Mobility. Transp. Q. 1988, 42, 429–446. [Google Scholar]
- Stead, D.; Marshall, S. The Relationships between Urban Form and Travel Patterns. An International Review and Evaluation. Eur. J. Transp. Infrastruct. Res. 2001, 1, 113–141. [Google Scholar]
- Dur, F.; Yigitcanlar, T. Assessing land-use and transport integration via a spatial composite indexing model. Int. J. Environ. Sci. Technol. 2015, 12, 803–816. [Google Scholar] [CrossRef]
- Ewing, R.; Cervero, R. Travel and the Built Environment, A Meta-Analysis. J. Am. Plan. Assoc. 2010, 76, 265–294. [Google Scholar] [CrossRef]
- Ewing, R.; Cervero, R. Travel and the Built Environment: A Synthesis. Transportation Research Record. Transp. Res. Rec. 2001, 1780, 87–114. [Google Scholar] [CrossRef]
- Leck, E. The Impact of Urban Form on Travel Behavior: A Meta-Analysis. Berkeley Plan. J. 2006, 19, 37–58. [Google Scholar]
- Boyce, D.E.; Williams, H.C.W.L. Forecasting Urban Travel: Past, Present and Future; Edward Elgar Publishing: Glos, UK, 2015. [Google Scholar]
- Healthy Spaces and Places. Available online: http://www.healthyplaces.org.au/site/ (accessed on 12 August 2015).
- Chandigarh Master Plan 2031, Chandigarh Administration. Available online: http://chandigarh.gov.in/cmp_2031.htm (accessed on 13 January 2015).
- Spears, S.; Boarnet, M.G. Draft Policy Brief on the Impacts of Landuse Mix Based on a Review of the Empirical Literature; California Environmental Protection Agency Air Resources Board: Sacramento, CA, USA, 2014.
- Frank, L.D.; Greenwald, M.J.; Kavage, S.; Devlin, A. An Assessment of Urban Form and Pedestrian and Transit Improvements as an Integrated GHG Reduction Strategy; Washington State Department of Transportation: Washington, DC, USA, 2011.
- Sonia, H. The Mixed-Use Trend: Planning Attitudes and Practices in Northeast Ohio. J. Archit. Plan. Res. 2007, 24, 224–244. [Google Scholar]
- Handy, S. Urban Form and Pedestrian Choices: Study of Austin Neighborhoods. Transp. Res. Rec. 1996, 1552, 135–144. [Google Scholar] [CrossRef]
- Saville-Smith, K. The Value of Neighborhood Intensification: The Interface between Urban Dynamics & Housing Change Dwelling, Neighborhood Design and Affordability, New Zealand. In Proceedings of the Crossing into the 2nd Decade of the 3rd Millennium 22nd International Housing Research Conference, Istanbul, Turkey, 4–7 July 2010.
- Bahadure, S.P.; Kotharkar, R.S. Social Sustainability and Mixed Landuse, Case Study of Neighbourhoods in Nagpur, India. Bonfring Int. J. Ind. Eng. Manag. Sci. 2012, 4, 76–83. [Google Scholar]
- OECD. Household Behaviour and the Environment Reviewing the Evidence. Organisation For Economic Co-Operation and Development: France, 2008. Available online: http://www.oecd.org/environment/consumption-innovation/42183878.pdf (accessed on 26 October 2014).
- Lesliea, E.; Saelensb, B.; Frankc, L.; Owena, N.; Baumand, A.; Coffeee, N.; Hugo, G. Residents’ perceptions of walkability attributes in objectively different neighbourhoods: A pilot study. Health Place 2005, 11, 227–236. [Google Scholar] [CrossRef] [PubMed]
- Chow, A.S.Y. Urban Design, Transport Sustainability and Residents’ Perceived Sustainability: A Case Study of Transit-oriented Development in Hong Kong. J. Comp. Asian Dev. 2014, 13, 73–104. [Google Scholar] [CrossRef]
- Travel Behavior. Available online: http://en.wikipedia.org/wiki/Travel_behavior.Wikimedia Foundation, Inc (accessed on 20 May 2015).
- Kotharkar, R.S.; Bahadure, S.P. Mixed Landuse and Sustainable Urban Development, A Case Study of Nagpur. In Proceedings of the PLEA 2012—28th Conference, Opportunities, Limits & Needs Towards an Environmentally Responsible Architecture, Lima, Perú, 7–9 November 2012.
- Cao, X.; Handy, S.L.; Mokhtarian, P.L. The influences of the Built Environment and Residential Self-Selection on Pedestrian Behaviour: Evidence from Austin, TX. Transportation 2006, 33, 1–20. [Google Scholar] [CrossRef]
- GoI. Provisional Population Totals, Census of India 2011, Urban Agglomerations/Cities Having Population 1 Million and above, 2011. Available online: http://censusindia.gov.in/2011-prov-results/paper2/data_files/india2/Million_Plus_UAs_Cities_2011.pdf (accessed on 13 December 2014).
- Statistics Canada. Survey Methods and Practices; Minister Responsible for Statistics Canada Minister of Industry: Ottawa, ON, Canada, 2010; Catalogue no. 12-587-X. Available online: http://www.statcan.gc.ca/ (accessed on 15 January 2015).
- Frank, L.D.; Pivo, G. Impacts of Mixed Use and Density on Utilization of Three Modes of Travel. Transp. Res. Rec. 1994, 1466, 44–52. [Google Scholar]
- Frank, L.D.; Schmid, T.L.; Sallis, J.F.; Chapman, J.; Saelens, B.E. Linking objectively measured physical activity with objectively measured urban form: Findings from SMARTRAQ. Am. J. Prev. Med. 2005, 2, 117–125. [Google Scholar] [CrossRef] [PubMed]
- Urban Mass Transit Company Limited and Nagpur Improvement Trust. Comprehensive Mobility Plan for Nagpur Draft Final Report; Urban Mass Transit Company Limited and Nagpur Improvement Trust: Nagpur, India, 2014. [Google Scholar]
- Nardo, M.; Saisana, M.; Saltelli, A.; Tarantola, S. Workpackage 5, Input to Handbook of Good Practices for Composite Indicators’ Development, Deliverable 5.2. Available online: https://www.uni-trier.de/fileadmin/fb4/projekte/SurveyStatisticsNet/KEI-WP5-D5.2.pdf (accessed on 15 November 2014).
- Duncan, D.T.; Aldstadt, J.; Whalen, J.; Melly, S.J.; Gortmaker, S.L. Validation of Walk Score for Estimating Neighborhood Walkability: An Analysis of Four US Metropolitan Areas. Int. J. Environ. Res. Public Health 2011, 8, 4160–4179. [Google Scholar] [CrossRef] [PubMed]
- Ewing, R.; Hodder, R. Best Development Practices: A Primer for Smart Growth; Smart Growth Network: Washington, DC, USA, 1998. [Google Scholar]
- Congress, Indian Roads. Guidelines for Capacity of Urban Roads in Plain Areas, IRC-106; IRC Code of Practice: New Delhi, India, 1990. [Google Scholar]
- MHFW, GoI. National Family Health Survey (NFHS-3) 2005–2006 India; International Institute for Population Sciences Deonar: Mumbai, India, 2007. [Google Scholar]
© 2015 by the authors; licensee MDPI, Basel, Switzerland. This article is an open access article distributed under the terms and conditions of the Creative Commons Attribution license (http://creativecommons.org/licenses/by/4.0/).