Article

Visualization of a City Sustainability Index (CSI): Towards Transdisciplinary Approaches Involving Multiple Stakeholders

1
International Center, Shiga University, 1-1-1 Banba, Hikone, Shiga 522-8522, Japan
2
Oceanlab, School of Biological Sciences, University of Aberdeen, Main Street, Newburgh, Aberdeenshire AB41 6AA, UK
3
Department of Sociology, Kyoto University Graduate School of Letters, Yoshida Honmachi, Sakyo-ku, Kyoto 606-8501, Japan
4
Research Institute for Humanity and Nature, 457-4 Motoyama, Kamigamo, Kita-ku, Kyoto 603-8047, Japan
5
Institute of Human and Social Sciences, Kanazawa University, Kakuma, Kanazawa, Ishikawa 920-1192, Japan
*
Author to whom correspondence should be addressed.
These authors contributed equally to this work.
Sustainability 2015, 7(9), 12402-12424; https://doi.org/10.3390/su70912402
Submission received: 31 March 2015 / Revised: 26 August 2015 / Accepted: 27 August 2015 / Published: 10 September 2015
(This article belongs to the Special Issue Planning, Development and Management of Sustainable Cities)

Abstract

:
We have developed a visualized 3-D model of a City Sustainability Index (CSI) based on our original concept of city sustainability in which a sustainable city is defined as one that maximizes socio-economic benefits while meeting constraint conditions of the environment and socio-economic equity on a permanent basis. The CSI is based on constraint and maximization indicators. Constraint indicators assess whether a city meets the necessary minimum conditions for city sustainability. Maximization indicators measure the benefits that a city generates in socio-economic aspects. When used in the policy-making process, the choice of constraint indicators should be implemented using a top-down approach. In contrast, a bottom-up approach is more suitable for defining maximization indicators because this technique involves multiple stakeholders (in a transdisciplinary approach). Using different materials of various colors, shapes, sizes, we designed and constructed the visualized physical model of the CSI to help people evaluate and compare the performance of different cities in terms of sustainability. The visualized model of the CSI can convey complicated information in a simple and straightforward manner to diverse stakeholders so that the sustainability analysis can be understood intuitively by ordinary citizens as well as experts. Thus, the CSI model helps stakeholders to develop critical thinking about city sustainability and enables policymakers to make informed decisions for sustainability through a transdisciplinary approach.

1. Introduction

1.1. Background

Cities are among the most important entities to be controlled for achieving a sustainable future of human well-being on earth. Urban population and its impact have been steadily increasing. According to the United Nations Department of Economic and Social Affairs (UNDESA) [1], 3.6 billion people of the 7.0 billion world population live in urban areas, and this urban population is projected to increase to 6.3 billion in 2050 (while the world population will be 9.3 billion). Cities negatively impact local and global environments directly and indirectly through resource consumption and trade. For example, cities in the world account for between 71% and 76% of global carbon dioxide (CO2) emissions [2], but are considered engines of economic development that foster socio-economic prosperity [3]. However, prosperity is also accompanied by an expansion of urban inequality [4]. Thus, striking a balance among environmental, economic and social needs is critical to securing sustainable human well-being. For this reason, there is an urgent need for a new and reliable system for assessing city sustainability that is capable of providing relevant and requisite information for policy making [5]. Furthermore, during the decision-making process, discourse would be desirable among all the relevant stakeholders so that information on city sustainability can be shared, and that feasible and effective policies can be contrived and implemented.
In response to such demands, we have developed an objective system called the “City Sustainability Index” (CSI), which provides a scientific basis for evaluating and comparing cities along the three dimensions of sustainable development (i.e., environmental, economic and social considerations). In addition, we have created a visualized physical model of the CSI to deliver multi-dimensional information in a simple and straightforward manner so that the contents can be readily understood by diverse audiences. The purposes of this paper are to: (1) provide a brief explanation of the concept of city sustainability and its assessment methods; (2) introduce a visualized model of CSI with the results of sustainability assessment applied to 18 world megacities; and (3) discuss several applications and development of a visualized CSI model.

1.2. Sustainability and the Transdisciplinary Approach

There have been increasing demands to construct indicators that can assess urban sustainability, and many lists of urban sustainability indicators have been provided [6,7,8,9]. For example, Shen et al. examined and compared nine different lists of urban sustainability indicators used for nine regions/cities, and derived a primary list of urban sustainability indicators on a comparative basis [10]. These early studies have focused on making lists of environmental, economic, social and governance indicators to cover as many aspects of cities as possible. However, methods to integrate these different indicators have not been adequately developed [5]. Furthermore, most urban sustainability indicators have focused on the sustainability of the target cities themselves, not the sustainability of cities across the world; such indicators include the Green City Index [11,12], and City Development Index (or Global Urban Indicators) [13]. In addition, some research has considered the issues of environmental sustainability only at local scale, not on a global scale; these studies include that of Bettencourt and West, who quantitatively analyzed and discussed the impact of economic growth in cities on society and the local environment [14]. Therefore, a more comprehensive set of indicators is needed that can assess the impact exerted by cities upon the sustainability of the global environment.
The main reason for developing sustainability indicators is to provide tools for policy making, information sharing and community improvement [15]. The frameworks adopted for the existing sustainability indicators can be divided into two paradigms, namely “bottom-up” and “top-down” approaches [16]. The top-down approach is based on the knowledge of experts and professionals, with the intention of providing an objective and macroscopic viewpoint, which in turn enables comparative analysis among cities in different geographical locations. However, the interpretation of the concept of sustainability often is different among professionals [17]. Moreover, since the decision-making process is done only by a small number of experts and policymakers, the top-down approach tends to preclude active participation by members of the public, who will actually be most affected by the decision. In other words, the top-down approach fails to take into consideration the views and opinions that only local people can possess. As a result, decisions made through such a process might well be biased in favor of policymakers [18]. Therefore, the top-down approach is not based on a democratic process to represent the collective opinion of a community.
As the limitations and defects inherent in top-down approaches have been revealed, the merits of bottom-up approaches gradually have been examined. Bottom-up approaches rely on the participation of local communities in the decision-making process, and encourage individual members of a local community to select relevant indicators; therefore, a bottom-up approach reflects local needs and issues [19,20]. According to Fraser et al. [21], the implementation of a bottom-up approach has two main advantages. Firstly, by incorporating the knowledge of local community members who are most familiar with the local situation, this approach can increase the meaningfulness of indicators in the society. The bottom-up approach also reflects diverse opinions of the community, making the process of indicator selection more democratic than that in the top-down approach. Secondly, the process of community participation itself contributes to the empowerment and education of the community [22]. There even appear to be synergistic interactions between these two aspects (i.e., inclusiveness and empowerment), since the purpose of establishing the sustainability indicators is the improvement of local and global environment, an aspect of which is the vitality and functioning of the local community itself.
However, the bottom-up approach also has disadvantages. Compared to the top-down approach, engaging the participation of a community in the selection of indicators requires much more time and resources, especially if there are conflicts of opinions within the community. The bottom-up approach also can result in selecting too many indicators within a particular city that are not comparable among cities.
Fortunately, top-down and bottom-up approaches are not mutually exclusive. In fact, the introduction of a bottom-up approach does not deny the necessity for quantitative and aggregated methods that are used often in top-down approaches. Comparative analysis with other locations or at wider geographical scales provides more comprehensive understanding of the whole, as well as the local situations, than can a narrowly focused (i.e., strictly local) analysis. Integration of bottom-up and top-down approaches could compensate for the shortcomings in each, and has therefore been considered as an effective strategy for developing sustainability indices.
The approach that involves not only professionals of different disciplines, but also various stakeholders, is called a “transdisciplinary approach” [17,23,24]. To conduct a transdisciplinary approach, top-down and bottom-up approaches must be integrated. However, synthesizing these two contrasting approaches is not an easy process. There is always a possibility that conflicts between different stakeholders will occur, especially between citizens and policymakers. Since it is the policymakers who normally have the overriding power to make and to implement policies, these conflicts might result in disregard of bottom-up processes. On the other hand, it also can be expected that in some cases, the choices made by a community will be based solely on self-benefits, contradicting the needs for sustainable development at bigger scales. Therefore, a transdisciplinary approach must endeavor “to provide a balance between community and higher level actors” [25]. Although technical criteria can be measured, the perception of a citizen cannot be measured. Therefore, the method of assessing the level of convergence between different stakeholders, especially between professionals and citizens, can be helpful in building a consensus. Such a method has been developed by, for example, Battaglia et al. [24,26].
Fraser et al. also observed that one of the biggest challenges in the integration of top-down and bottom-up approaches is to identify the extent to which the public should be engaged in the decision-making process and the scales at which indicators are to be perceived as relevant by the public [21]. Because different stakeholders and indicators operate at different scales that range from the local community and administrative boundary to international and transboundary areas, identifying the ideal scale for indicators is not an easy task. When sustainability issues are addressed on a global scale, they are not likely to be perceived as relevant by local people or be reflected in their surrounding environment at local levels. Therefore, global environmental issues must be considered by the professionals from a scientific perspective, i.e., through a top-down approach. In addition, local community members often focus merely on issues relating to the current generation, and not on the potential linkages between current and future generations. Because the notion of sustainability assumes intergenerational equality, the challenge to establish a relevant timescale is also an obstacle for the bottom-up approach. In the CSI, these challenges are handled by combining two different types of indicators, namely, “constraint” and “maximization” indicators. We assume that constraint and maximization indicators are suitable for top-down and bottom-up approaches, respectively, and a detailed account of the two types of indicators will be presented in Section 2.2.

1.3. Visualization and the Transdisciplinary Approach

A critical aspect in integrating of the two approaches (i.e., bottom-up and top-down) is to present the process of data collection and interpretation, as well as the final output, clearly to the community in such a way that all non-experts can easily understand them and thereby readily participate in the whole process [27]. Visualization is an effective method by which to convey scientific discoveries to non-professional audiences [28,29,30,31,32]. Because visual data can be understood instinctively, visualization does not require high literacy about the scientific information, especially numerical and mathematical literacy [33]. Visualization can also provide an interactive interface and facilitate a participatory approach [34]. Methods of visualization have been elaborated widely, especially since the establishment of a special conference and journal dedicated to visualization in the 1980s [35].
Methods of data visualization frequently have been used to present scientific research on global environmental issues. Because studies on the global environment inevitably involve various pieces of information from different disciplines and their complex integration processes, visualization plays a critical part in making research results readily understood by an audience. Existing applications include the visualization of atmospheric data [36], CO2 emissions [37] and simulation of water supply and demand [38]. “Tangible Earth” [39] and “Science on a Sphere®” (SOS) [40] developed a digital terrestrial globe that allows users to acquire interactive and educational experience about the global environment. Visualization also provides a platform that enhances viewers’ spatial cognition, especially when the visualization deals with urban data [41,42,43]. Density distribution is a particularly important concept for understanding cities [44].

2. City Sustainability

2.1. Concept of City Sustainability

The term “sustainability” has become increasingly important, particularly in connection with global environmental issues, and what it means conceptually also has been continually evolving [45]. Sustainability is, therefore, not a general term that has a clear and fixed definition or application although the notion of sustainable development as presented in the Brundtland Report is famous. A review of the notion of sustainability is beyond the scope of this paper, but the interested reader can be referred to numerous pieces of academic literature [5,45,46,47,48,49]. Hereafter, we would like to focus on the notion of “city” sustainability.
Many urban sustainability indicators focus only on whether the city under evaluation is sustainable within its boundaries. Importantly, the concept of city sustainability in this paper (i.e., CSI) is different from others in this respect. Herein, we use the notion of city sustainability based on Mori and Yamashita [50] because this interpretation provides a clear framework that describes how environmental, economic and social states should be related in terms of city sustainability. Accordingly, city sustainability denotes maximization of the total economic and social net benefits that a city produces, without exceeding environmental limits and while staying within acceptable limits of socio-economic inequity. In regard to environmental limits, when the limitations are on a global scale a set of threshold values is assigned based on the published study, “Planetary boundaries” [51]. This concept of city sustainability recognizes the global environmental limitations of the “leakage effects” that a city has beyond its urban boundaries. Therefore, city sustainability assumes that whether a city under evaluation continues to be in a healthy condition in terms of local environmental aspects is of no consequence; in contrast, whether the global environment is sustainable while the current socio-economic activities of the city are maintained is significantly important.
Constraint conditions should also be applied in the context of intergenerational equity. That is, for a specified future time period, the extent of socio-economic activities in a city should not exceed the environmental limits. Even if a city does not currently exceed a given threshold of environmental limits, the negative impacts may accumulate and exceed the threshold at some point in the future. The accumulated total environmental burden may have a serious negative impact on the environment that future generations should enjoy. If the accumulated burden into the future exceeds the environmental threshold within the given time scale, its current state should be considered to be unsustainable. Hence, a sustainable city is defined as a city that maximizes economic and social net benefits (degree of satisfaction) while meeting constraint conditions of the environment and socio-economic equity in both opportunities and distribution into the indefinite future.
However, it is insufficient to merely satisfy the constraint conditions. A city exists for the pursuit of economic and social prosperity based on agglomeration effects, and this point should not be viewed lightly. So long as a city fulfills conditions of limits in regard to the environment and equity, economic and social benefit must be increased to a maximum capacity. When maximization has not occurred in this city, there is still room to promote pursuit of benefit because the city has not reached an optimal condition.

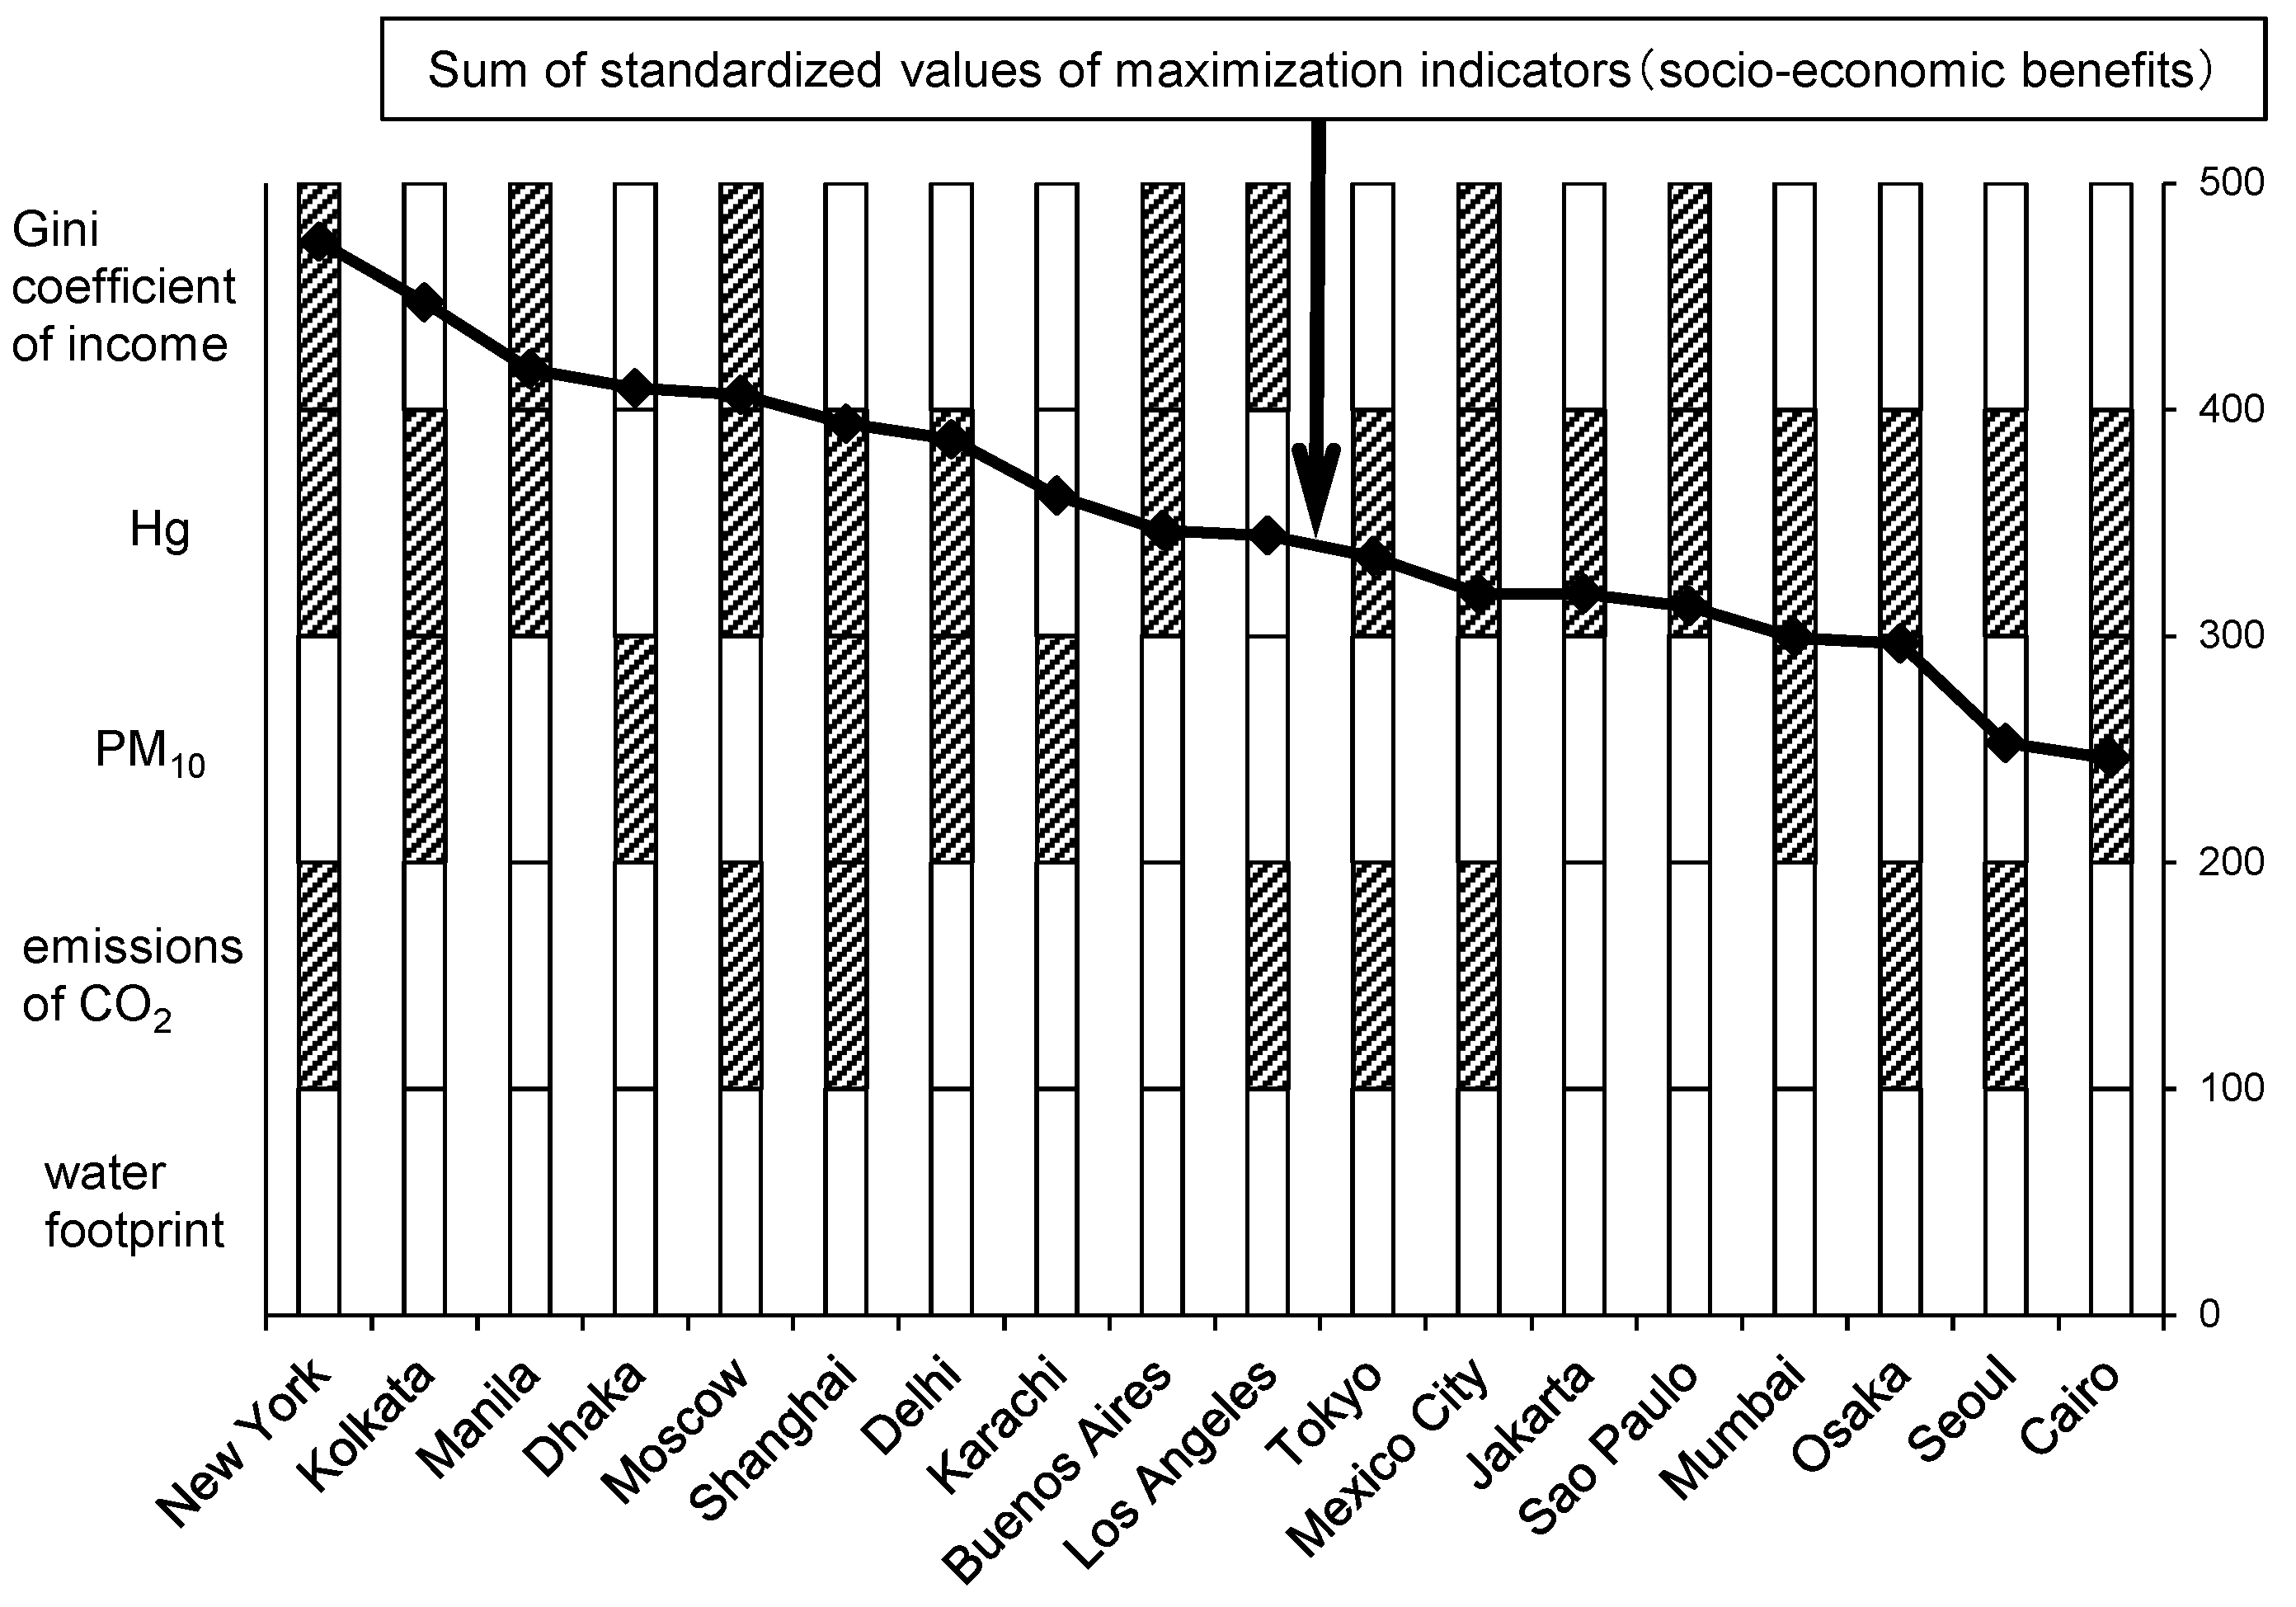
2.2. Constraint and Maximization Indicators

Based on the foregoing concept of city sustainability, the CSI is composed of two types of indicators: constraint indicators and maximization indicators. Constraint indicators are used to judge whether a city meets the minimum necessary conditions to be sustainable, based on relevant criteria and thresholds in terms of environmental limitations and socio-economic equity. The thresholds related to environmental limitations should be provided by scientific research, considering leakage effects on the global environment beyond the boundaries of cities. Constraint indicators for environmental limits that are considered to be appropriate for the CSI include, among others, the annual amount of greenhouse gas emissions; water footprint; the atmospheric concentrations of PM10 (particulate matter 10 micrometers in size or less), nitrogen oxides (NOx), sulfur oxides (SOx) and mercury (Hg); and the amount of direct and indirect consumption of forest resources. Appropriate indicators for socio-economic equity include the Gini coefficient of household income, poverty ratio, and the population ratio of access to safe drinking water, among others.
Maximization indicators measure the benefits that cities generate in economic and social aspects. As cities create more benefits, prosperity increases. Concerning the maximization indicators, city performance can be evaluated in a succinct way: the higher the benefits are, the better the performance of the city is. Then, if the increase in the benefits was free from exceeding any environmental and socio-economic constraints, the city could simply continue to pursue economic growth and social amenities. Maximization indicators that are considered to be appropriate for the CSI include, among others, indicators of economic outputs, such as gross domestic product (GDP) per capita; agglomeration costs, such as traffic congestion and housing costs; indicators of social amenities, such as the extent of public transportation; the number of hospitals per a unit of area; the number of physicians per population; and the number of universities per population.

3. Visualized Model of CSI

3.1. Application of the CSI to Megacities

“Large” cities are often said to be eco-efficient; but megacities (cities with a population of at least 10 million) have large negative impacts on the global environment due to the total environmental burden of their large population. We have created a prototype CSI for 18 megacities using five constraint indicators and seven maximization indicators; these were selected based on data availability and comparability across the megacities.
The five constraint indicators are: the amount of emissions of CO2; the atmospheric concentration of Hg; the atmospheric concentration of PM10; water footprint based on blue water, which includes surface and groundwater and is measured by the consumptive use of the run-off flow [52]; and the Gini coefficient of household income. Grid data on a global scale were used to determine the amounts of CO2 emissions and the atmospheric concentration of Hg. The World Health Organization (WHO) database of PM10 in cities was used to establish the atmospheric concentration of PM10. Although data for the water footprint of countries were available, the data for specific cities were not. Thus, because there was a strong correlation between water footprint and GDP at national scales, we estimated the water footprint of respective megacities from the national data by using both population and GDP data sets for each megacity.
The seven maximization indicators are: the quantity of solid waste generated; ratio of GDP per capita; congestion cost; green rate (the ratio of green areas to urban areas); suicide rate; university density; and the number of physicians. Grid data on a global scale were used for calculating the ratio of GDP per capita, congestion cost (population-weighted average distance to a city center as a proxy) and green rate. Data defining waste generation, university coverage and suicide rate were available from the municipalities. For the university indicator, university rankings were considered in addition to the number of universities. The number of physicians is assumed to be a significant indicator with respect to social security; national data were used as a proxy for this indicator due to the lack of data at smaller scales. The sources of data are provided in Table 1.
The thresholds were derived from published research [51], and were used for judging whether a city meets the necessary minimum conditions for city sustainability. For example, the concept of planetary boundaries [51] has provided some threshold values for a few global environmental indicators including water footprint (global freshwater use). The sources of data and thresholds are provided in Table 1.
The prototype City Sustainability Index consisting of the 12 indicators was applied to the 18 megacities; however, the actual urban areas of the megacities were not clearly defined beforehand. In fact, various definitions and methods exist for delineating urban boundaries of cities, including administrative boundaries [53], functional boundaries [54,55], and morphological boundaries [56,57]. In this paper, we defined the spatial extent of urban boundaries based on population density data.
Although pair-wise comparisons between maximization indicators would be possible, presentation of all possible combinations of indicators for the 18 megacities would cause information overload. Therefore, information had to be distilled to facilitate comparisons among cities. For this purpose, we standardized maximization indicators on a relative scale using a z-value, where the “worst” city was assigned a ranking of 0 and the “best” city was given a ranking of 100. “Best” and “worst” were dependent on the context of the indicator; for some indicators (e.g., suicide rate) “best” was the smallest value, but for others (e.g., number of physicians) the largest value indicated the “best” performance.
The method that we employed to establish and standardize scores for the maximization indicators was the same as the method used to produce composite indicators consisting of multiple individual indicators [58]. Constraint indicators did not require scaling or standardization because the necessary minimum conditions for city sustainability (i.e., threshold values) were derived from the literature; these thresholds were treated as unbiased standards in this study.
Table 1. Indicators used in a prototype City Sustainability Index (CSI).
Category IndicatorUnitData SourceThreshold
Environmental1Water footprint based on blue waterm3/(person year)The Water Footprint Network. Mekonnen, M.M. and Hoekstra, A.Y. [59]4000 km3/(person∙year) (from Planetary Boundaries)
2Amount of emissions of CO2t/(person year)EDGARJudge whether the state of the average temperature in 2100 will be 2 degrees on the Celsius scale higher than that in 1850. (from IPCC)
3Quantity of solid waste generatedkg/(person year)Karak et al. [60]. UN-HABITAT [61]. Japanese Ministry of the Environment [62]No threshold. This is a maximization Indicator. Negative contributor.
4Atmospheric concentration of Hgμg/m3AMAP/UNEP1 μg/m3 (annual average) (from WHO)
5Atmospheric concentration of PM10μg/m3WHO70 μg/m3 (Annual mean) (from WHO)
Economic6Ratio of GDP per capita (GDP per capita in the city/GDP per capita in the country in which the city is located)dimensionlessThe World BankNo threshold. This is a maximization Indicator. Positive contributor.
7Gini coefficient of household incomedimensionlessUN HABITAT0.4 (from UN-Habitat)
8Congestion cost (population-weighted average distance to a city center)mORNLNo threshold. This is a maximization Indicator.
Negative contributor.
Social9Green rate (Ratio of green areas to urban areas)%GLCFNo threshold. This is a maximization Indicator. Positive contributor.
10Suicide rateper 100,000 peopleVarious sourcesNo threshold. This is a maximization Indicator. Negative contributor.
11University densityper one million people, considering the ranking of universitiesVarious sourcesNo threshold. This is a maximization Indicator. Positive contributor.
12Number of physiciansPer 1000 peopleWHONo threshold. This is a maximization Indicator. Positive contributor.
Figure 1 shows the assessment of the 18 megacities using the prototype CSI. The downward-sloping trend line shows the total of the standardized numerical values of the maximization indicators, or in other words, the size of total economic and social benefits. These numerical values do not have any units, and thus no scale on the vertical axis is shown. In Figure 1, the megacities are arranged (from right to left) in an increasing order of the total maximization indicator value. The bar graphs depict the determinations as to whether the necessary conditions for city sustainability are met for the five constraint indicators. Shaded sections indicate that the city is not sustainable in terms of that particular constraint indicator. To our surprise, no megacity satisfied the necessary minimum condition for city sustainability.
Figure 1. Results of city sustainability assessments of 18 world megacities using the City Sustainability Index. Bars represent determinations of sustainability for five constraint indicators; shaded segments indicate failure to meet threshold values for a particular indicator.
Sustainability 07 12402 g001

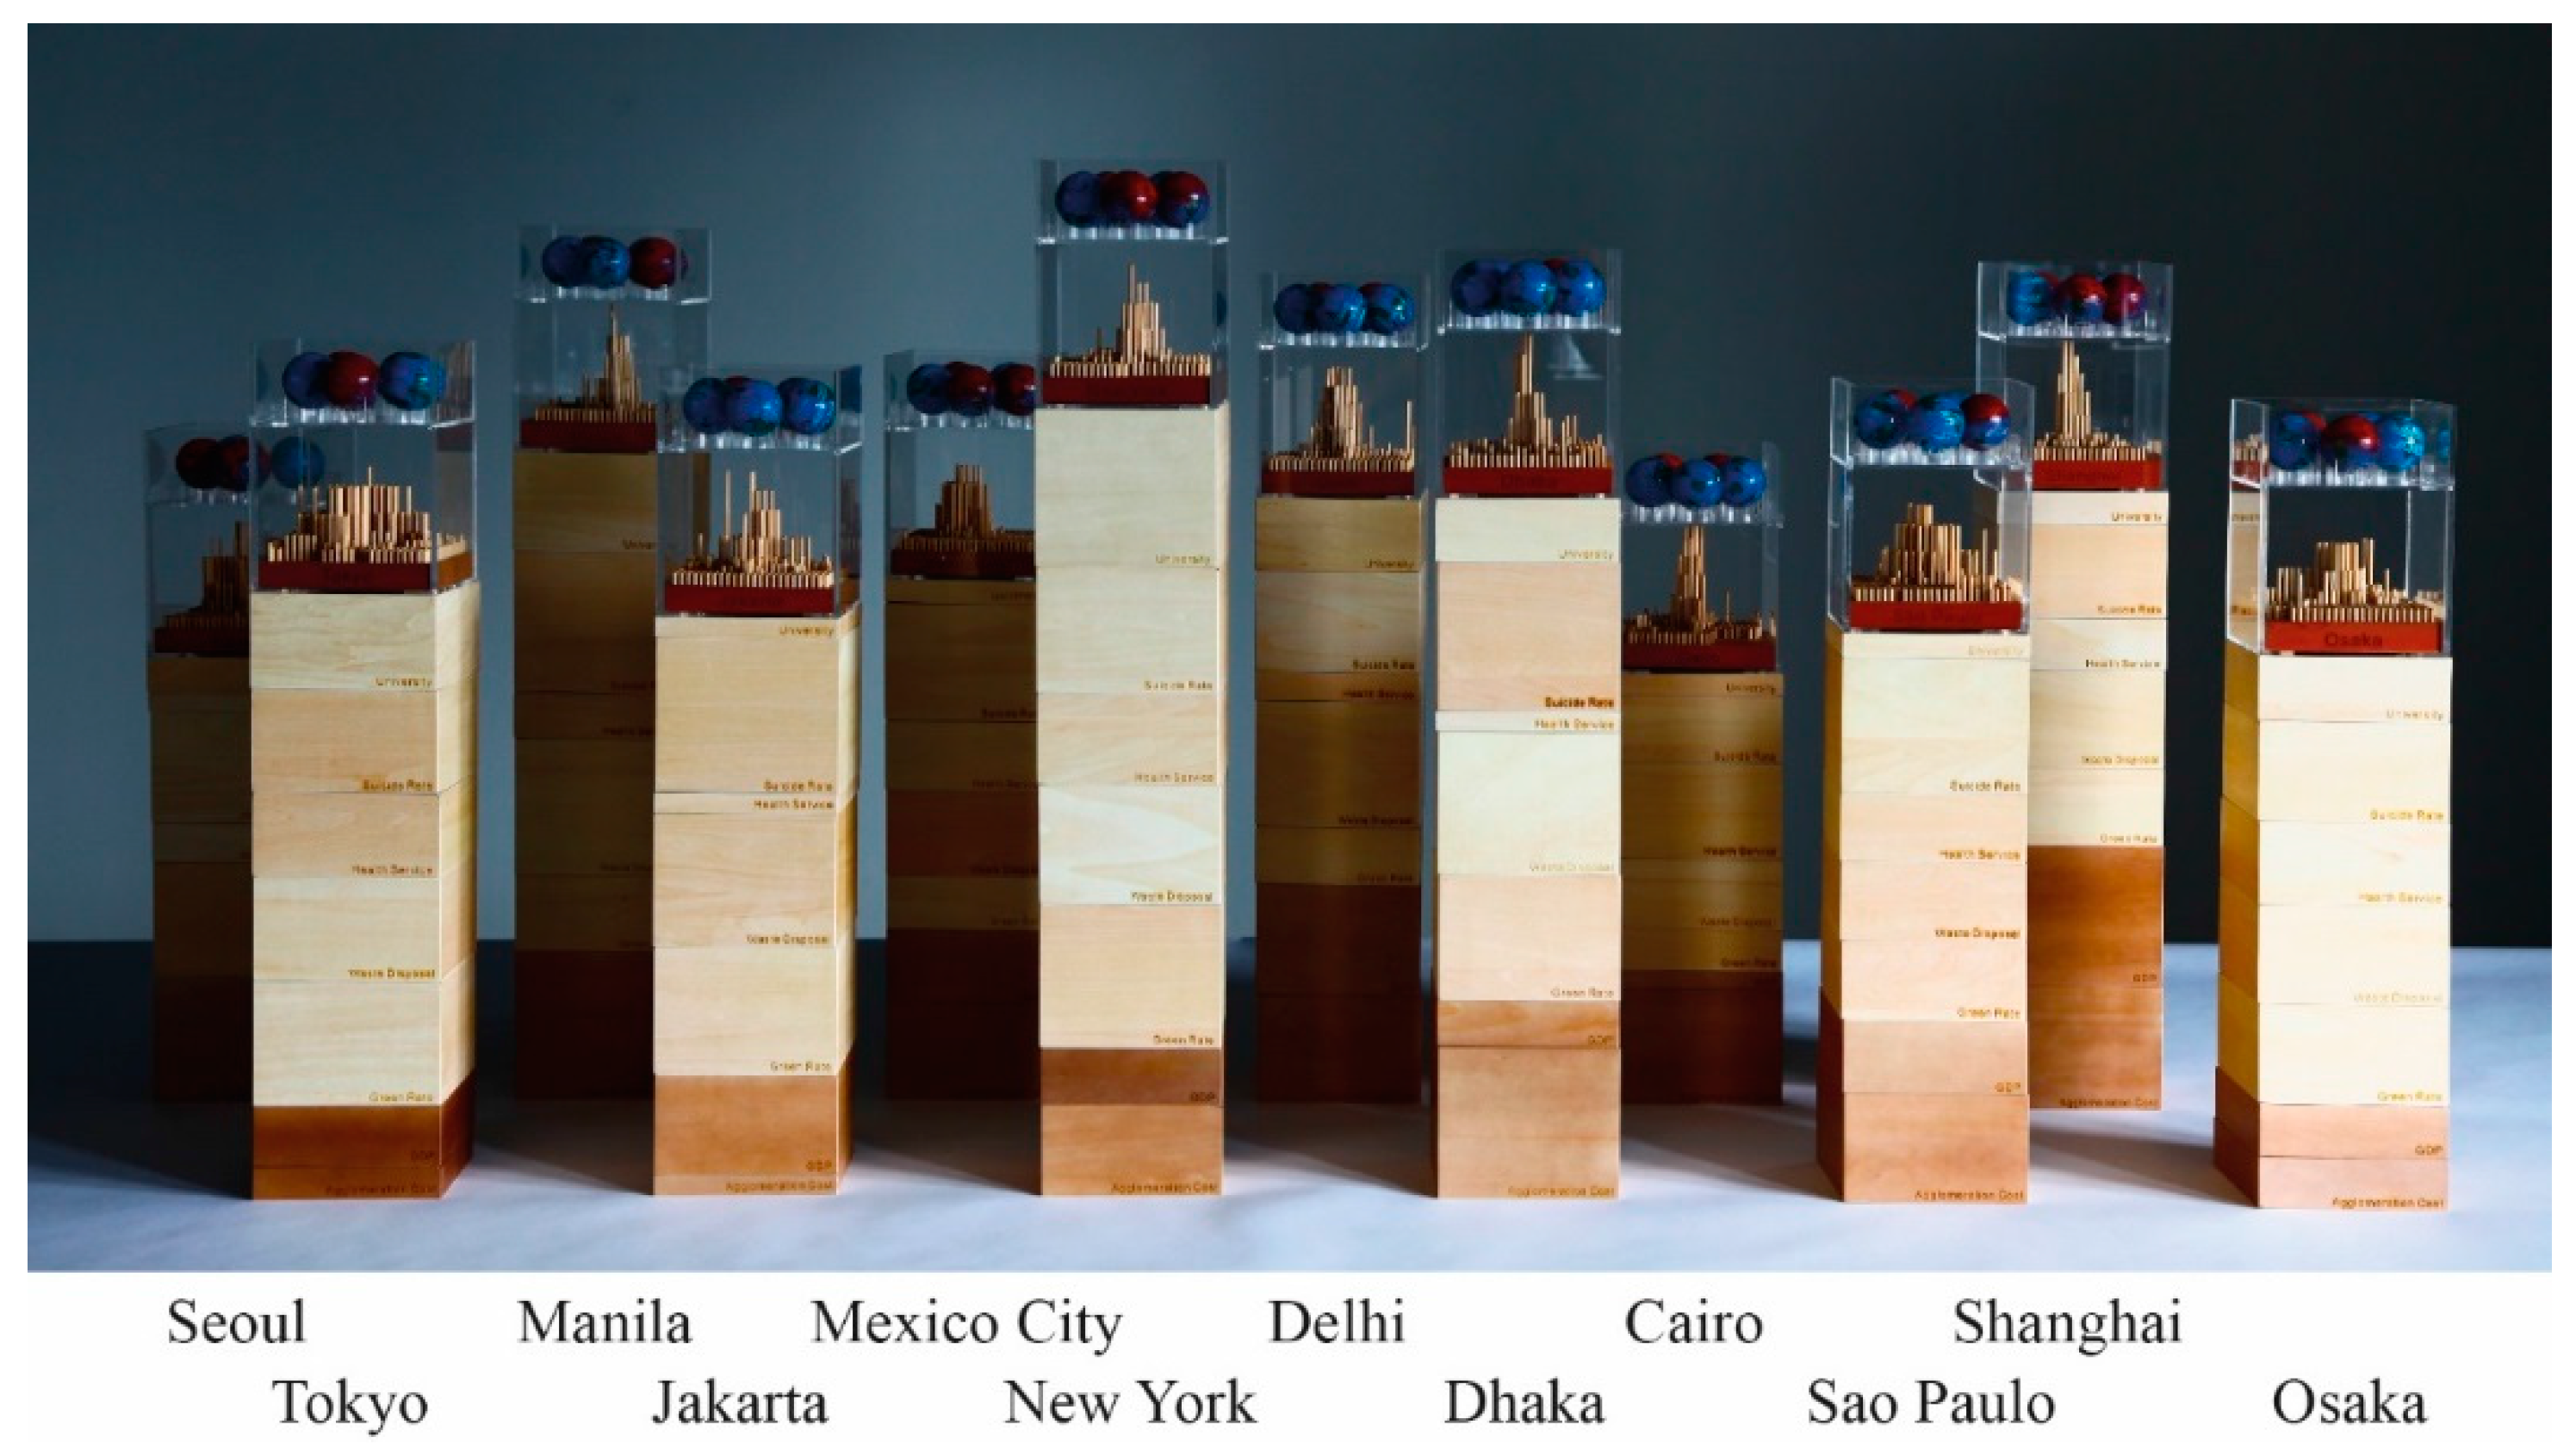
3.2. Visualizing CSI

Transdisciplinary research is a challenge of sustainability science that is formulated by Future Earth, a major international research platform coordinating new interdisciplinary approaches to investigate effective transformations to a sustainable world. The integration of scientific disciplines and social priority in terms of sustainability is of paramount importance. In this light, the CSI study described in Section 3.1 also aimed to involve multiple stakeholders effectively through the processes of co-design, co-production and co-dissemination (Figure 2). In the co-design process, scientifically trained academicians and social stakeholders jointly frame a definition of the required knowledge and propose a research definition to establish a commonly shared understanding of the research goals, to identify the relevant research disciplines, and to agree on the roles of different groups of stakeholders [63]. In the co-production process, all the stakeholders including academicians, policymakers, and the other public participants are required to continuously exchange their respective knowledge so as to ensure the societal relevance of the research [63]. The co-dissemination process includes publication of the acquired knowledge, conversion of it into usable and understandable information, and open discussions on the evaluation, application and relevance of the results, particularly among conflicting stakeholders in real society [63].
Figure 2. Framework for transdisciplinary co-creation of the knowledge. Source: Mauser et al. [63].
Sustainability 07 12402 g002
The importance of co-design, co-production and co-dissemination to relevant stakeholders has been increasingly recognized in the field of sustainability research because actions of stakeholders play a significant role in providing real solutions to the problems of sustainability. Academic researchers are required to share the scientific knowledge obtained from academic research with plural stakeholders in real society and link it to a specific social movement towards sustainable society. In this respect, we have created a visualized model of the CSI with which all stakeholders, including non-researchers, can intuitively understand the extent to which an evaluated city is sustainable (Figure 3). The visualized model of an evaluated city consists of four components: conditions of constraint indicators; distribution of population density; conditions of social maximization indicators and conditions of economic maximization indicators (Figure 3).
The top section of the visualization model in Figure 3 displays five globes, which represent the five constraint indicators used in the prototype CSI described in Section 3.1; by their color, the globes indicate whether the necessary minimum conditions for city sustainability have been satisfied. A blue globe, well-known imagery that depicts a healthy planet, indicates that the city is sustainable in terms of a given constraint indicator. A red globe is a warning sign; it implies that a city is unsustainable in its relationship with the global environment if the constraint indicator is an environmental indicator. The number of red globes indicates to what extent a city does not meet the necessary minimum conditions for city sustainability. Thus, an audience can easily see if a city is sustainable, or the extent to which it is not, simply by looking at the number of colored globes.
The section immediately below the globes shows the distribution of population density within the city being evaluated. Population density is denoted by the height of bar, and each bar represents a 5 km × 5 km physical area within the city. The higher the bar is, the higher the population density is. Normally, the spatial differences in population within a city are difficult to visualize. However, from the visualized model an audience can readily understand which parts of a city are more densely populated than others. Moreover, by comparing the spatial patterns of population densities across several cities, an audience can also judge whether a given city has a tendency to be “sprawled” or whether the city tends to have its population concentrated in a particular area, e.g., the city center.
Figure 3. Structure of a visualized CSI model for a city.
Sustainability 07 12402 g003
The bottom two parts of the visualized CSI model contain “blocks”, each of which corresponds to a particular economic or social maximization indicator. Each type of indicator (economic or social) is depicted in a different color, and the height of each block implies the size of benefit measured by the indicator. Thus, higher blocks indicate larger benefits than smaller blocks, and the cumulative height of all blocks shows the size of the total benefits that a city produces. Thus, by comparing the heights of blocks in the models for several cities, an audience can readily understand which city generates the largest benefits in total.

3.3. Usage of the Visualized Model

The visualized CSI model allows a user to assess and compare different cities easily based on the concept of city sustainability described in Section 2.1 and Section 2.2. For example, Figure 4 shows visualized models for 12 megacities. A user can simply check whether there are any red globes to see how many cities meet the necessary minimum conditions for city sustainability. A user also can compare the physical heights of the models for the various cities to see which city has the highest overall socio-economic benefit (i.e., the tallest model in Figure 4). Lastly, a user can readily identify the most sustainable city by selecting models of cities without red globes, and then picking out the city that is the highest among them. In short, the city for which the visualized CSI model has the greatest height and no red globe is the most sustainable.
Figure 4. Samples of visualized City Sustainability Index (CSI) models for 12 megacities.
Sustainability 07 12402 g004
Figure 5 illustrates how two cities can be compared to decide which is more sustainable. The top section of the model shows that City A is not sustainable (i.e., it has red globes) and City B is sustainable (i.e., it has no red globes). In this case, City B should always be assessed as being better than City A, even though the height of the model for City A is greater than that for City B. The heights of the two models indicate that City A generates greater benefits than City B in maximization indicators; however, this advantage is gained at the expense of the global environment. Neither of the models for City B and City C contain red globes, thus it is possible to compare the two cities in a straightforward way. The higher the model is, the more sustainable the city is. Because the model for City C is taller than that for City B, City C produces more socio-economic benefits than City B does, and does so in a sustainable way.
However, it is not necessarily possible to find the most sustainable city. If all the cities were to have at least one red globe (Figure 4), none of them would be considered to be sustainable because they do not satisfy the necessary minimum conditions for city sustainability. Under such circumstances, it is meaningless to compare the cities in search of the best city because all are unsustainable. Nevertheless, comparisons of both the model height and the number of red globes among cities can be useful in identifying the way to make such cities sustainable.
Figure 5. Comparison among cities.
Sustainability 07 12402 g005
On the other hand, the user in search of the most sustainable city might need to compare each maximization indicator among cities in addition to the total benefits even when all the cities under evaluation meet the necessary minimum conditions for city sustainability (e.g., City B and City C in Figure 5). Such a comparison is necessary because aggregation of individual benefits into a cumulative measure (i.e., total benefits) loses detailed information about each indicator. Consequently, the sizes of benefits of individual indicators among cities may be vastly different, yet produce identical total benefits. Unless one city is better than another in every comparable indicator, the comparison of performance in each indicator is still critical. To accomplish such a comparison, the user can flexibly select the blocks of maximization indicators, and can choose a subset of blocks for comparing the height among cities.
It is also possible to make a comparative analysis of cities that are similar in terms of the distribution of population density. Such a comparison may reveal that some indicators exhibit larger differences between the cities than do any other pairs, thereby providing useful insight into how relevant policies and management actions may be focused on improving the conditions pertinent to those indicators. The feasibility and potentiality of extending such policies or actions to an “inferior” city might be high if similar cities were compared and analyzed.

4. Discussion

4.1. Bottom-up and Top-down Approaches in CSI

We believe that the visualized CSI model introduced in this paper provides a useful tool that allows a wide range of stakeholders to participate in the decision-making process on subjects that influence city sustainability. However, when applying a transdisciplinary approach to complex decision-making, arguments often eventuate in deliberations regarding whether to take a top-down approach or a bottom-up approach [15,21,25]. In the CSI, top-down and bottom-up approaches apply to constraint and maximization indicators, respectively. Because each approach has its own advantages and disadvantages, a CSI study must strive for the appropriate balance between the two approaches; this balance may be society-specific. Because we constructed the visualized CSI model to harmonize with the concept of a transdisciplinary approach, our focus has been placed more on the use of bottom-up approaches in maximization indicators than on the use of top-down approaches. The disadvantage of a bottom-up approach, however, is that there is a high probability that stakeholders will by themselves select the indicators or make judgements about them based purely on their lay opinions, which often lack both expert knowledge and scientific grounding. The solution derived from bottom-up decision-making processes could ignore long-term views, potential impacts of leakage effects and negative externality, and hence fail to take the well-being of future generations into consideration. Although a bottom-up approach seems to be possible for determining constraint indicators in CSI, one must remember that these indicators must be selected, and thresholds set, in a top-down approach based on a long-term view, global perspective, and scientific knowledge. If a bottom-up approach is incorporated into defining constraint indicators in a CSI study, important indicators on a global scale may be omitted, depending on the preferences of local stakeholders. If this happens, the purpose of promoting the sustainability of a city may be lost.
Maximization indicators measure the extent of the benefits a city generates in economic and social aspects, and these benefits are assessed after the conditions of the constraint indicators are met. In evaluating maximization indicators, there is a strong probability that the size of the benefit may be influenced unduly by the values and preferences of local stakeholders, such as residents of that city. If a city meets the necessary minimum conditions for city sustainability, there should be no objection to the city’s maximization of economic and social benefits in any form. In other words, in a CSI study we are able to appreciate diversity in the values and preferences of stakeholders as long as the necessary minimum conditions for city sustainability are satisfied. Therefore, stakeholders may be allowed to freely select and manage the metrics for the maximization indicators by adopting a bottom-up approach. In this respect, we need to create a model of CSI in which weightings can be put flexibly on maximization indicators based on certain values expressed by stakeholders; this feature is not available in the current version of the CSI prototype.

4.2. Visualized CSI Model for Education

When city sustainability is assessed within a global perspective, a wide range of people from different communities and regions across the world must be engaged to raise awareness of the possible links between their respective societies’ lifestyles and global environmental issues. One possibility for accomplishing such engagement would be to effectively disseminate scientific knowledge to a wide range of stakeholders through educational activities [25,64,65].
The visualized model of the CSI can convey complicated information in a simple and straightforward manner to diverse audiences so that the content of complex sustainability analyses can be readily understood by people who are not experts. The appeal and success of visualization in communicating about similarly complex issues has been demonstrated in the applications of Geographic Information Systems (GIS) [42,43] and the NOAA Science on a Sphere® (SOS) program [40]. In view of these successful approaches, the visualized CSI model can provide an ideal teaching resource and/or learning tool to raise awareness and explore real-world issues in a way that helps learners develop critical thinking about the society and environment to which they belong. The teaching and learning activities accomplished through the CSI can provide opportunities for learners to: (1) explore ideas and issues on the environmental effect each city has on the planet; (2) consider the choices citizens make and the consequences of those choices on the environment; (3) identify important local issues and link them to national and international issues of sustainable development; (4) compare and contrast the state of the environmental, economic and social systems that shape ways of living in the cities across the world; and (5) analyze the relationship between human activities and the environment on a global scale. The incorporation of CSI in education may therefore make an effective contribution to raising awareness, changing public behavior and eventually providing a basis for tackling the challenges of sustainable development faced by cities in the long term.

4.3. Visualized CSI Model for Policy-Making

Indicators have been playing an increasingly important role in providing vital information on subjects such as sustainable development to allow for informed decisions to be made. As a result, the focus is now shifting towards a process in which the development of urban sustainability indicators is integrated into policy institutions and decision-making processes of city planners [66]. Likewise, sustainability indicators have steadily gained acceptance as reliable tools to gauge the extent to which a community is moving towards sustainability [67]. In this regard, the CSI allows for the effective communication of visualized and quantitative information amongst diverse stakeholders, and the output is therefore expected to provide an ideal basis for informed decisions on policy making.
A workshop for discussions and information-sharing may be introduced for the purpose of transforming a city into a sustainable one [68,69]. Certainly, in the local policy-making process a workshop could be organized that involves a variety of stakeholders, and in which the visualized CSI model can be used to transform multi-dimensional information into a readily digestible form. The output of such a workshop could provide the respective stakeholders with opportunities to: (1) identify both positive and negative aspects of the city in relation to sustainable development; (2) evaluate possible links between alternative decisions that stakeholders make and the consequences of such decisions for the environment; and (3) consider the best options for decisions affecting the environment at local, national and international scales.
Alternatively, it may be more desirable to establish a consortium that involves cities across the world and in which the visualized CSI model is used optimally in the policy-making process. The output of the CSI provides the respective participating parties with the opportunity to compare the state of the environmental, economic and social systems between cities and evaluate alternatives in decisions affecting issues relating to city sustainability. The participants can then exchange ideas and discuss issues about sustainable development with reference to the city assessed to exhibit the best sustainability performance based on output of the visualized CSI model. This approach will allow poorly performing cities (with respect to sustainability) to develop critical thinking about the lifestyles of their societies. Importantly, cities with different cultural backgrounds must discuss if it is feasible for any social best practices and/or policies to be transferred among these cities. The visualized CSI model thus encourages many parties to participate in the development of the consortium and thereby facilitates multi-stakeholder processes and collaborations, as well as social learning, simultaneously.
Currently the visualized CSI model represents information about the sustainability of cities based on both constraint and maximization indicators. However, an ability to identify and indicate any cause-effect relationships among those indicators would be a desirable addition to the model, as this feature would allow policymakers to specify what controls (i.e., policies and actions) should be implemented to achieve the best possible outcome for sustainable development. In addition, the types of indicators considered to be appropriate for a CSI study are not limited to the constraint and maximization indicators discussed in this paper; we are currently exploring additional unique aspects of city characteristics that are difficult to be assessed in terms of city sustainability (e.g., local climate, demographic structure, and composition of buildings). These additional indicators may be of more relevance than, say, the mean travel distance to a city center, in understanding the links between features of cities and their sustainability performance. Overall, the establishment of a consortium will strengthen the ties between cities, and the further development of the CSI will help the participants in such a consortium to better understand both differences and commonalities across cities in terms of city sustainability. This will in turn help the respective societies identify potential practices from their consortium colleagues to be incorporated in their own policy-making process, as well as to identify unique practices that may only be suitable for a particular society.

4.4. Limitations and Future Research

The visualized CSI model provides both a foundation for the transdisciplinary approach and a framework for measuring and comparing the performance of cities in the context of sustainability. However, the return of meaningful information for use in policy making is highly dependent on the way in which the indices that comprise CSI are incorporated in the actual participatory and/or decision-making processes. In this regard, there are mainly three issues to be addressed with respect to limitations and future prospects of the CSI methodology.
First of all, the visualized CSI model provides a simplified means to help a range of stakeholders comprehend and compare the states of different cities in terms of city sustainability. However, stakeholders have yet to be involved in the process of selecting indicators and deciding how the individual indicators are weighted and presented within the model. In essence, the transdisciplinary approach encourages interactive behavior through the good use of co-design and co-production in participant-led decision-making processes. In this regard, the CSI currently aims to provide an interactive platform for policy making through which stakeholders can decide which indicators to be considered, how they are weighted and how they are presented; once these decisions are made, a CSI study can be performed and stakeholders can discuss the results to come up with the best solution for the society. However, Lockton also points out that the goal of the design process is to modify or redesign the assessment system to influence users’ behavior towards a particular ‘target behavior’ [70]. From this point of view, the CSI study may require stakeholders to be involved even at the designing stage of the model development so that the resulting outcome can influence the participants and then encourage their further engagement in support of a participatory approach.
Secondly, the current CSI model can only present a transient description of the state of a city at a fixed point in time; therefore, the model is not amenable to visually interactive manipulation. In the CSI, the maximization indicators are normalized and then aggregated so that their heights can be visually compared. However, if following analysis, one indicator is deemed to be more important than another, revised weightings must be assigned to the indicators and the indicators re-aggregated. The current CSI model does not accommodate this type of real-time demand (“what-if” scenarios) and this inability may hamper advancement in the use of the visualized CSI model in transdisciplinary programs. Fortunately, integrated technologies are available that provide multimodal display of interaction with information in real time [71]; these tools must be used to develop a computer-based, visually interactive CSI model that allows easy manipulation of weightings among indicators and thereby provides instant alternative graphical representations of different scenarios. In future developments of the CSI model, cause-effect relationships among the sustainability indicators must be identified and included. This feature will allow stakeholders to use a computer-based visualized CSI model to explore various decision choices for city sustainability through the use of co-design and co-production approaches. Furthermore, the identification and inclusion of the unique aspects of city characteristics into the CSI model, as discussed earlier, will add another dimension in the exploration of the cause-effect relationships among the existing indicators, the newly identified characteristics of cities and the performance of the urban sustainable development.
Finally, the effective use of the visualized CSI model is strongly dependent on the availability of a large quantity of data. In addition, the boundaries of cities in this study are defined based on population density (i.e., urban settlement area), which do not necessarily match the politically defined city boundaries. For this reason, the collection and processing of the required data sets can be highly labor-intensive as well as prohibitively expensive. However, public participation through co-design and co-production processes, aided by a consortium of major cities, has gradually gained popularity as an essential component in the management of urban development, because such a participatory approach can help close resource gaps [72]. To help reduce data-gathering costs, public participants can be recruited and trained to conduct surveys for collecting data [67,73]. The involvement of citizens in data collection could provide the CSI with better and larger data sets. If this enhanced supply of data could be continually processed and updated in a refined visualized CSI model, further public engagement would be encouraged, as well as interactions between stakeholders, which may eventually generate a positive feedback in the context of city sustainability (Figure 6). The importance of continually revising and refining the visualized CSI model is crucial to its meeting the challenges of these critical issues in the context of city sustainability.
Figure 6. Schematic diagram of a feedback loop facilitated by use of the City Sustainability Index model.
Sustainability 07 12402 g006

5. Conclusions

We have developed a 3-D model of a City Sustainability Index (CSI), based on our original concept of city sustainability. A sustainable city is one that maximizes the total socio-economic net benefits within constraint conditions of environmental limits and socio-economic equity. In accordance with this concept, the system of the CSI comprised two types of indicators: maximization indicators and constraint indicators. The former measure the benefits that a city generates in socio-economic aspects. The latter judges whether a city meets the necessary minimum conditions for city sustainability. The 3-D model of the CSI shows the results of the analysis in a user-friendly succinct way. To provide this visualization, the height of a model for a city represents the results for the maximization indicators, whereas blue or red globes displayed at the top of the model indicate how many city sustainability constraint conditions are satisfied.
When pursuing city sustainability in practice, the choice of constraint indicators should be made using a top-down approach on the basis of scientific knowledge. On the other hand, maximization indicators should be selected and weighted by implementing a bottom-up approach because this method respects the diversity of values that multiple stakeholders hold, which may be specific to a particular city. The flexibility in the choice and the prioritization of maximization indicators could be the key to successfully involving relevant stakeholders in transdisciplinary research towards city sustainability.
Crucially, for the involvement of appropriate stakeholders and the implementation of relevant policies towards sustainability in cities, complicated information must be conveyed to diverse stakeholders in a simple and straightforward manner so that the current and future situations on sustainability can be readily understood by all the key parties in the process, including non-experts. The visualized model of the CSI can contribute to this conveyance, and also potentially play a significant role in sustainability education.
Finally, it is worth noting here that transdisciplinary co-creation processes consisting of co-design, co-production and co-dissemination have been urgently required for practically solving global sustainability issues according to Future Earth (www.futureearth.org). However, these terms are relatively new and hence they have still remained equivocal even conceptually. As a result, it is not yet clear as to what kinds of practical activities in the transdisciplinary processes need to be conducted. This line of research should therefore be further carried out. This paper suggests that the visualized model of CSI can contribute to transdisciplinary co-creation processes for city sustainability.

Acknowledgments

The authors would like to thank the Research Institute for Humanity and Nature (RIHN), Shin Muramatsu (the leader of the project on Megacities and the Global Environment) and the other project members. This research has also been supported by the Future Earth program in the Future Earth program in the Research Institute of Science and Technology for Society (RISTEX) and the Japan Science and Technology Agency (JST).

Author Contributions

The corresponding author is a leader of this research, but all the authors contributed equally to this work.

Conflicts of Interest

The authors declare no conflict of interest.

References

  1. United Nations Department of Economic and Social Affairs (UNDESA). World Urbanization Prospects, the 2011 Revision; United Nations: New York, NY, USA, 2012. [Google Scholar]
  2. Seto, K.C.; Dhakal, S.; Bigio, A.; Blanco, H.; Delgado, G.C.; Dewar, D.; Huang, L.; Inaba, A.; Kansal, A.; Lwasa, S.; et al. Human Settlements, Infrastructure and Spatial Planning. In Climate Change 2014: Mitigation of Climate Change. Contribution of Working Group III to the Fifth Assessment Report of the Intergovernmental Panel on Climate Change; Edenhofer, O., Pichs-Madruga, R., Sokona, Y., Farahani, E., Kadner, S., Seyboth, K., Adler, A., Baum, I., Brunner, S., Eickemeier, P., et al., Eds.; Cambridge University Press: Cambridge, UK, 2014; Chapter 12; pp. 923–1000. [Google Scholar]
  3. United Nations Human Settlements Programme (UN-Habitat). State of the World’s Cities 2012/2013: Prosperity of Cities; Routledge: New York, NY, USA, 2013. [Google Scholar]
  4. United Nations Human Settlements Programme (UN-Habitat). State of the World’s Cities 2010/2011: Bridging the Urban Divide; Routledge: New York, NY, USA, 2010. [Google Scholar]
  5. Mori, K.; Christodoulou, A. Review of Sustainability Indices and Indicators: Towards a New City Sustainability Index (CSI). Environ. Impact Assess. Rev. 2012, 32, 94–106. [Google Scholar] [CrossRef]
  6. Haghshenas, H.; Vaziri, M. Urban sustainable transportation indicators for global comparison. Ecol. Indicators 2012, 15, 115–121. [Google Scholar] [CrossRef]
  7. Wang, Y.; Lam, K.-C.; Harder, M.K.; Ma, W.-C.; Yu, Q. Developing an Indicator System to Foster Sustainability in Strategic Planning in China: A Case Study of Pudong New Area, Shanghai. Ecol. Indic. 2013, 29, 376–389. [Google Scholar] [CrossRef]
  8. López-Ruiz, V.-R.; Alfaro-Navarro, J.-L.; Nevado-Peña, D. Knowledge-city Index Construction: An Intellectual Capital Perspective. Expert Syst. Appl. 2014, 41, 5560–5572. [Google Scholar] [CrossRef]
  9. Pires, S.M.; Fidélis, T.; Ramos, T.B. Measuring and comparing local sustainable development through common indicators: Constraints and achievements in practice. Cities 2014, 39, 1–9. [Google Scholar] [CrossRef]
  10. Shen, L.-Y.; Ochoa, J.J.; Shah, M.N.; Zhang, X. The Application of Urban Sustainability Indicators—A Comparison between Various Practices. Habitat Int. 2011, 35, 17–29. [Google Scholar] [CrossRef]
  11. Siemens. The Green City Index: A Summary of the Green City Index Research Series; Siemens: Munich, Germany, 2012. Available online: http//www.siemens.com/entry/cc/en/greencityindex.htm (accessed on 19 May 2014).
  12. Meijering, J.V.; Kern, K.; Tobi, H. Identifying the Methodological Characteristics of European Green City Rankings. Ecol. Indic. 2014, 43, 132–142. [Google Scholar] [CrossRef]
  13. United Nations Human Settlements Programme (UN-Habitat). Global Urban Indicators Database, Version 2; United Nations Publications: New York, NY, USA, 2001. [Google Scholar]
  14. Bettencourt, L.; West, G. A Unified theory of urban living. Nature 2010, 467, 912–913. [Google Scholar] [CrossRef] [PubMed]
  15. Singh, R.K.; Murty, H.R.; Gupta, S.K.; Dikshit, A.K. An overview of sustainability assessment methodologies. Ecol. Indic. 2009, 9, 189–212. [Google Scholar] [CrossRef]
  16. Bell, S.; Morse, S. Breaking through the glass ceiling: Who really cares about sustainability indicators? Local Environ. 2001, 6, 291–309. [Google Scholar] [CrossRef]
  17. Bond, A.J.; Viegas, C.V.; Coelho, C.C.D.S.R.; Selig, P.M. Informal Knowledge Processes: The Underpinning for Sustainability Outcomes in EIA? J. Clean. Prod. 2010, 18, 6–13. [Google Scholar] [CrossRef]
  18. Morse, S. Putting the pieces back together again: An illustration of the problem of interpreting development indicators using an African case study. Appl. Geogr. 2004, 24, 1–22. [Google Scholar] [CrossRef]
  19. Chambers, R. Participatory rural appraisal PRA: Analysis of experience. World Dev. 1994, 22, 1253–1268. [Google Scholar] [CrossRef]
  20. Chambers, R. Participatory rural appraisal PRA: Challenges, potentials and paradigm. World Dev. 1994, 22, 1437–1454. [Google Scholar] [CrossRef]
  21. Fraser, E.D.G.; Dougill, A.J.; Mabee, W.E.; Reed, M.; McAlpine, P. Bottom up and top down: Analysis of participatory processes for sustainability indicator identification as a pathway to community empowerment and sustainable environmental management. J. Environ. Manag. 2006, 78, 114–127. [Google Scholar] [CrossRef] [PubMed]
  22. Pretty, J.N. Participatory learning for sustainable agriculture. World Dev. 1995, 23, 1247–1263. [Google Scholar] [CrossRef]
  23. Scholz, R.W.; Lang, D.; Wiek, A.; Walter, A. Transdisciplinarity Case Studies as Means of Sustainability Learning. Historical Framework and Theory. Int. J. Sustain. High. Educ. 2006, 7, 226–251. [Google Scholar]
  24. Maiello, A.; Battaglia, M.; Daddi, T.; Frey, M. Urban sustainability and knowledge: Theoretical heterogeneity and need of a transdisciplinary framework. A tale of four towns. Futures 2011, 43, 1164–1174. [Google Scholar] [CrossRef]
  25. Reed, M.S.; Fraser, E.D.G.; Dougill, A.J. An adaptive learning process for developing and applying sustainability indicators with local communities. Ecol. Econ. 2006, 59, 406–418. [Google Scholar] [CrossRef]
  26. Battaglia, M.; Meloni, E.; Cautillo, A. Technical Assessment and Public Perception of Environmental Issues: The Case of the Municipality of Pisa. Local Environ. 2014, 19, 786–802. [Google Scholar] [CrossRef]
  27. Herweg, K.; Steiner, K.; Slaats, J. Sustainable Land Management—Guidelines for Impact Monitoring; Centre for Development and Environment: Bern, Switzerland, 1998. [Google Scholar]
  28. McCormick, B.H.; DeFanti, T.A.; Brown, M.D. Visualization in Scientific Computing; ACM SIGGRAPH: New York, NY, USA, 1987; p. 3. [Google Scholar]
  29. Kreuseler, M.; Schumann, H. A Flexible approach for visual data mining. IEEE Trans. Visual. Comput. Graph. 2002, 8, 39–51. [Google Scholar] [CrossRef]
  30. Keim, D.A. Information visualization and visual data mining. IEEE Trans. Visual. Comput. Graph. 2002, 8, 1–8. [Google Scholar] [CrossRef]
  31. Wu, L.; Hsu, P. An interactive and flexible information visualization method. Inf. Sci. 2013, 221, 306–315. [Google Scholar] [CrossRef]
  32. Ware, C. Information Visualization: Perception for Design, 2nd ed.; Morgan Kaufmann: Waltham, MA, USA, 2004. [Google Scholar]
  33. Ebert, D.S. Extending Visualization to Perceptualization: The Importance of Perception in Effective Communication of Information. In The Visualization Handbook; Hansen, C.D., Johnson, C.R., Eds.; Academic Press: Burlington, ON, USA, 2004; pp. 771–780. [Google Scholar]
  34. Card, S.K.; Mackinlay, J.D.; Shneiderman, B. Readings in Information Visualization: Using Vision to Think; Academic Press: Waltham, MA, USA, 1999. [Google Scholar]
  35. Hornbæk, K. The Notion of Overview in Information Visualization. Int. J. Hum. Comput. Stud. 2011, 69, 509–525. [Google Scholar] [CrossRef]
  36. Liang, J.; Gong, J.; Li, W.; Ibrahim, A.N. Visualizing 3D atmospheric data with spherical volume texture on virtual globes. Comput. Geosci. 2014, 68, 81–91. [Google Scholar] [CrossRef]
  37. Nieman, A. Concrete vs Abstract Visualization. In Making Visible the Invisible: Art, Design and Science in Data Visualization; Mohl, M., Ed.; University of Huddersfield: Huddersfield, UK, 2012; pp. 49–56. [Google Scholar]
  38. White, D.D.; Wutich, A.; Larson, K.L.; Gober, P.; Lant, T.; Senneville, C. Credibility, Salience, and legitimacy of boundary objects: Water managers’ assessment of a simulation model in an immersive decision theater. Sci. Public Policy 2010, 37, 219–232. [Google Scholar] [CrossRef]
  39. Earth Literacy Program. Tangible Earth Project. Since 2008. Available online: http://tangible-earth.com/ (accessed on 10 March 2015).
  40. Goldman, K.H.; Kessler, C.; Danter, E. Science on a Sphere: Cross-Site Summative Evaluation; Institute for Learning Innovation: Edgewater, FL, USA, 2010. [Google Scholar]
  41. Acevedo, W.; Masuoka, P. Time-series animation techniques for visualizing urban growth. Comput. Geosci. 1997, 23, 423–435. [Google Scholar] [CrossRef]
  42. Ribarsky, W. Virtual Geographic Information Systems. In The Visualization Handbook; Hansen, C.D., Johnson, C.R., Eds.; Elsevier: Burilngton, ON, USA, 2005; pp. 449–477. [Google Scholar]
  43. Ribarsky, W.; Wasilewski, T.; Faust, N. From Urban Terrain Models to Visible Cities. IEEE Comput. Graph. Appl. 2002, 22, 10–15. [Google Scholar] [CrossRef]
  44. Burdett, R.; Çavuşoğlu, Ö.; Verdis, S. City Transformations; LSE Cities, The London School of Economics and Political Science: London, UK, 2013. Available online: http://files.lsecities.net/files/2013/10/city-transformations-newspaper_en.pdf (accessed on 15 March 2015).
  45. Handoh, I.; Hidaka, T. On the timescales of sustainability and futurability. Futures 2010, 42, 743–748. [Google Scholar] [CrossRef]
  46. Dresner, S. The Principles of Sustainability, 2nd ed.; Earthscan: London, UK, 2008. [Google Scholar]
  47. Pezzey, J.C.V.; Toman, M.A. The Economics of Sustainability: A Review of Journal Articles. Discussion Paper 02–03; Resources for the Future: Washington, DC, USA, 2002. [Google Scholar]
  48. Fischer, J.; Manning, A.D.; Steffen, W.; Rose, D.B.; Daniell, K.; Felton, A.; Garnett, S.; Gilna, B.; Heinsohn, R.; Lindenmayer, D.B.; et al. Mind the Sustainability Gap. TRENDS Ecol. Evol. 2007, 22, 621–624. [Google Scholar] [CrossRef] [PubMed]
  49. Baumgärtner, S.; Quaas, M. What is sustainability economics? Ecol. Econ. 2010, 69, 445–450. [Google Scholar] [CrossRef]
  50. Mori, K.; Yamashita, T. Methodological framework of sustainability assessment in City Sustainability Index (CSI): A concept of constraint and maximisation indicators. Habitat Int. 2015, 45, 10–14. [Google Scholar] [CrossRef]
  51. Rockstrom, J.; Steffen, W.; Noone, K.; Persson, A.; Chapin, F.S., III; Lambin, E.; Lenton, T.M.; Scheffer, M.; Folke, C.; Schellnhuber, H.; et al. Planetary boundaries: Exploring the safe operating space for humanity. Ecol. Soc. 2009, 14. Article 32. [Google Scholar]
  52. Hoekstra, A.Y.; Chapagain, A.K.; Aldaya, M.M.; Mekonnen, M.M. The Water Footprint Assessment Manual: Setting the Global Standard; Earthscan: London, UK, 2011. [Google Scholar]
  53. Aguilar, A.G.; Ward, P.M.; Smith, C.B. Globalization, regional development, and mega-city expansion in Latin America: Analyzing Mexico City’s periurban hinterland. Cities 2003, 20, 3–21. [Google Scholar] [CrossRef]
  54. Douglass, M. Mega-urban regions and world city formation: Globalisation, the economic crisis and urban policy issues in pacific Asia. Urban Stud. 2000, 37, 2315–2335. [Google Scholar] [CrossRef]
  55. Hidle, K.; Farsund, A.A.; Lysgard, H.K. Urban rural flows and the meaning of borders functional and symbolic integration in Norwegian city-regions. Eur. Urban Reg. Stud. 2009, 16, 409–421. [Google Scholar] [CrossRef]
  56. Benediktsson, J.A.; Pesaresi, M.; Amason, K. Classification and Feature Extraction for Remote Sensing Images from Urban Areas Based on Morphological Transformations. IEEE Trans. Geosci. Remote Sens. 2003, 41, 1940–1949. [Google Scholar] [CrossRef]
  57. Rashed, T.; Weeks, J.R.; Roberts, D.; Rogan, J.; Powell, R. Measuring the Physical Composition of Urban Morphology Using Multiple Endmember Spectral Mixture Models. Photogramm. Eng. Remote Sens. 2003, 69, 1011–1020. [Google Scholar] [CrossRef]
  58. Organisation for Economic Co-operation and Development (OECD). Handbook on Constructing Composite Indicators—Methodology and User Guide; OECD: Paris, France, 2008. [Google Scholar]
  59. Mekonnen, M.M.; Hoekstra, A.Y. National Water Footprint Accounts: The Green, Blue and Grey Water Footprint of Production and Consumption; Value of Water Research Report Series No. 50; UNESCO-IHE: Delft, The Netherlands, 2011. [Google Scholar]
  60. Karak, T.; Bhagat, R.M.; Bhattacharyya, P. Municipal Solid Waste Generation, Composition, and Management: The World Scenario. Crit. Rev. Env. Sci. Technol. 2012, 42, 1509–1630. [Google Scholar] [CrossRef]
  61. UN-HABITAT. Collection of Municipal Solid Waste—Key Issues for Decision-Makers in Developing Countries; UNON, Publishing Services Section: Nairobi, Kenya, 2011. [Google Scholar]
  62. Japanese Ministry of Environment. Waste Disposal in Japan. 2011. Available online: http://www.env.go.jp/recycle/waste_tech/ippan/h21/ (accessed on 2 September 2015). (In Japanese) [Google Scholar]
  63. Mauser, W.; Klepper, G.; Rice, M.; Schmalzbauer, B.S.; Hackmann, H.; Leemans, R.; Moore, H. Transdisciplinary Global Change Research: The Co-creation of Knowledge for Sustainability. Curr. Opin. Environ. Sustain. 2013, 5, 420–431. [Google Scholar] [CrossRef] [Green Version]
  64. Brewer, G.; Gajendran, T.; Landorf, C.; Williams, A. Educating for Urban Sustainability: A Transdisciplinary Approach. Proc. Inst. Civil Eng. Eng. Sustain. 2008, 161, 185–193. [Google Scholar] [CrossRef] [Green Version]
  65. Reed, M.S. Stakeholder Participation for Environmental Management: A Literature Review. Biol. Conserv. 2008, 141, 2417–2431. [Google Scholar] [CrossRef]
  66. Pintér, L.; Swanson, D.A.; Barr, J. Use of Indicators in Policy Analysis: Annotated Training Module Prepared for the World Bank Institute; IISD: Winnipeg, MB, Canada, 2004; Available online: http://www.iisd.org/pdf/2006/measure_use_indicators.pdf (accessed on 25 March 2015).
  67. Kohsaka, R. Developing biodiversity indicators for cities: Applying the DPSIR Model to Nagoya and integrating social and ecological aspects. Ecol. Res. 2010, 25, 925–936. [Google Scholar] [CrossRef]
  68. Nevens, F.; Frantzeskaki, N.; Gorissen, L.; Loorbach, D. Urban transition labs: Co-creating transformative action for sustainable cities. J. Clean. Prod. 2013, 50, 111–122. [Google Scholar] [CrossRef]
  69. Sellberg, M.M.; Wilkinson, C.; Peterson, G.D. Resilience assessment: A useful approach to navigate urban sustainability challenges. Ecol. Soc. 2015. [Google Scholar] [CrossRef]
  70. Lockton, D.; Harrison, D.; Stanton, N.A. The design with intent method: A design tool for influencing user behavior. Appl. Ergon. 2010, 41, 382–392. [Google Scholar] [CrossRef] [PubMed] [Green Version]
  71. Loftin, R.B.; Chen, J.X.; Rosenblum, L. Visualization Using Virtual Reality. In The Visualization Handbook; Hansen, C.D., Johnson, C.R., Eds.; Elsevier: Burlington, VT, USA, 2004; pp. 479–489. [Google Scholar]
  72. Evans, B.; Joas, M.; Sundback, S.; Theobald, K. Governing Sustainable Cities; Earthscan: London, UK, 2005. [Google Scholar]
  73. Elmqvist, T.; Alfsen, C.; Colding, J. Urban Systems. In Ecosystems, Volume [5] of Encyclopedia of Ecology; Jørgensen, S.E., Fath, B.D., Eds.; Elsevier: Oxford, UK, 2008; pp. 3665–3672. [Google Scholar]

