
Geographical Detector Model for Influencing Factors of Industrial Sector Carbon Dioxide Emissions in Inner Mongolia, China


Abstract
:1. Introduction
2. Materials and Methodology
2.1. Data Resources and the Definitions of the Variables
2.2. The Methodology

| Detector | Main Ideas |
|---|---|
| Risk detector | Compares the differences in average carbon dioxide emissions rates between sub-regions generated by a social economic factor. It uses t-tests to identify whether the average carbon dioxide emissions rates among different sub-regions are significantly different. Greater differences mean greater impact to carbon dioxide emissions within the sub-region. |
| Factor detector | Uses the to assess the impact of social economic factors on the spatial pattern of carbon dioxide emissions. Higher means the social economic factor has a stronger contribution to the occurrence of the carbon dioxide emissions. It uses F-tests to compare whether the accumulated variance of each sub-region is significantly different from the variance of the entire study region. |
| Ecological detector | Assesses whether the impacts of two social economic factors on the spatial distribution of a carbon dioxide emissions are significantly different. It also uses F-tests to compare the variance calculated in a sub-region attributed to one influencing factor with the variance attributed to another influencing factor. |
| Interaction detector | Consists of seven parts: Enhance, Enhance-bi, Enhancenonlinear, Weaken, Weaken-uni, Weaken-nonlinear, and Independent. It compares the combined contribution of two individual influencing factors to carbon dioxide emissions, as well as their independent contributions. By doing so, it assesses whether the two influencing factors weaken or enhance each another, or whether they independently influence the development of the carbon dioxide emissions. |
- Enhance: if
- Enhance, bivariate: if
- Enhance, nonlinear: if
- Weaken: if
- Weaken,univariate: if
- Weaken, nonlinear: if
- Independent: if
3. Results
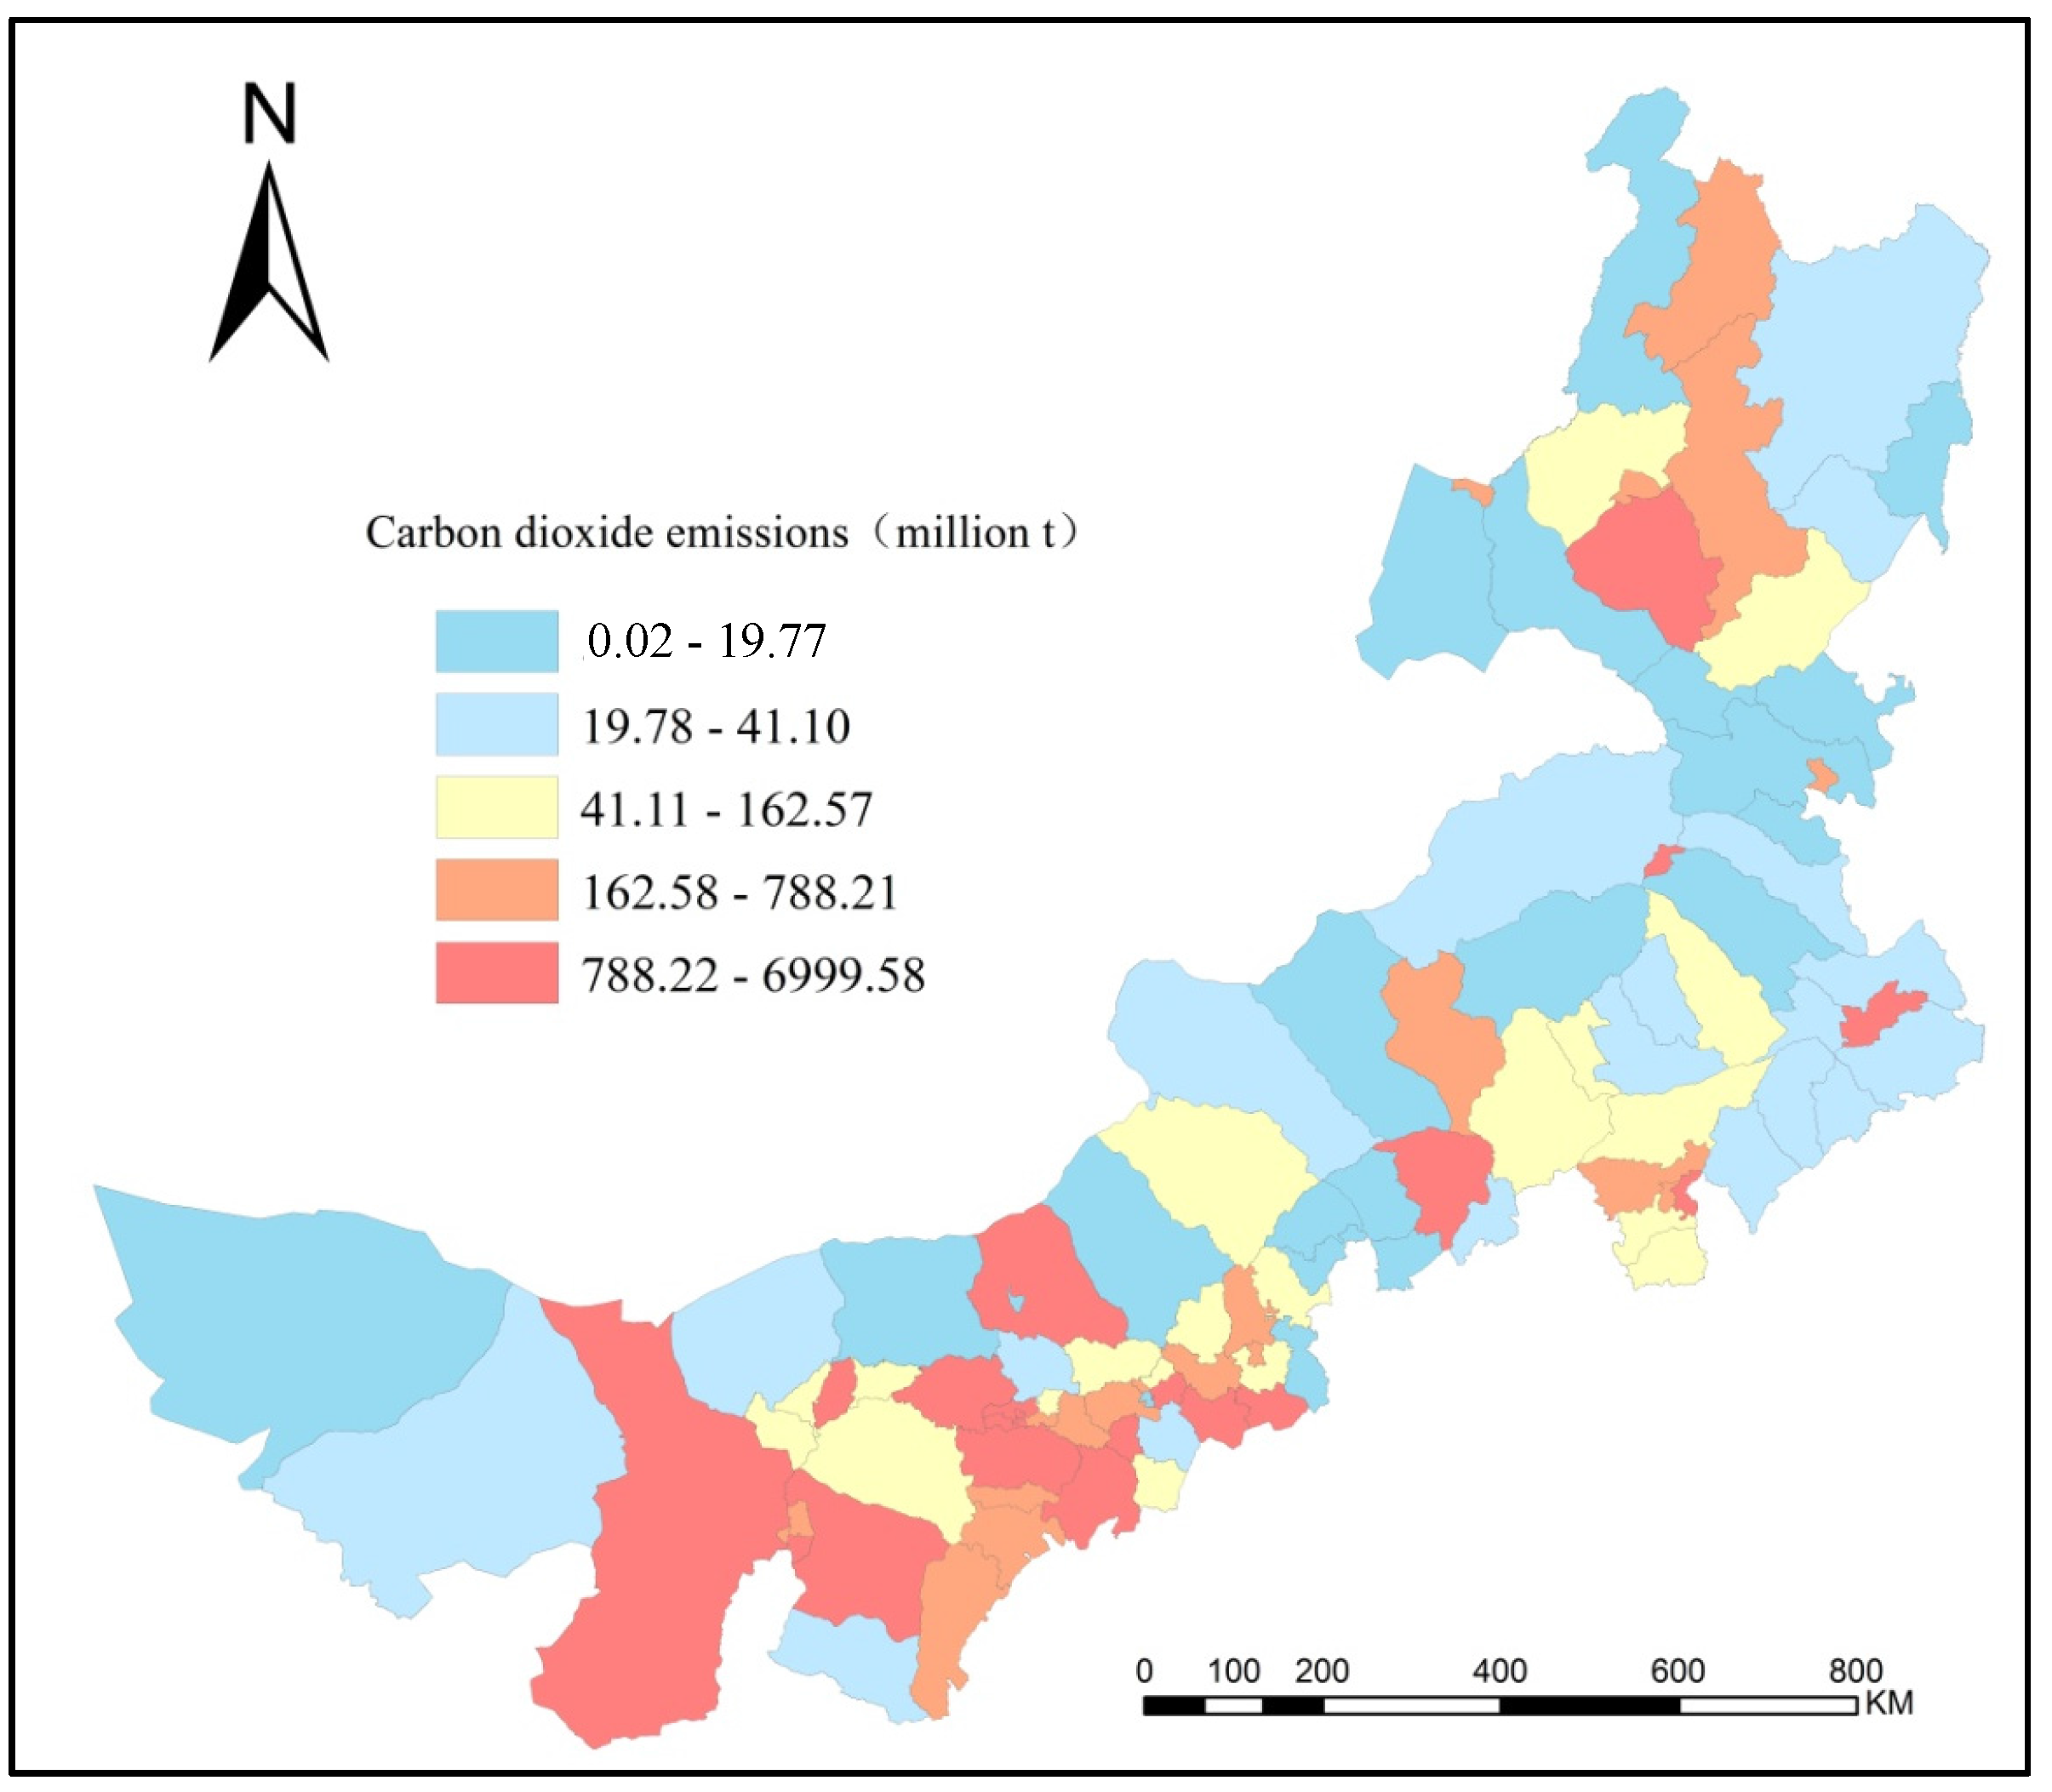
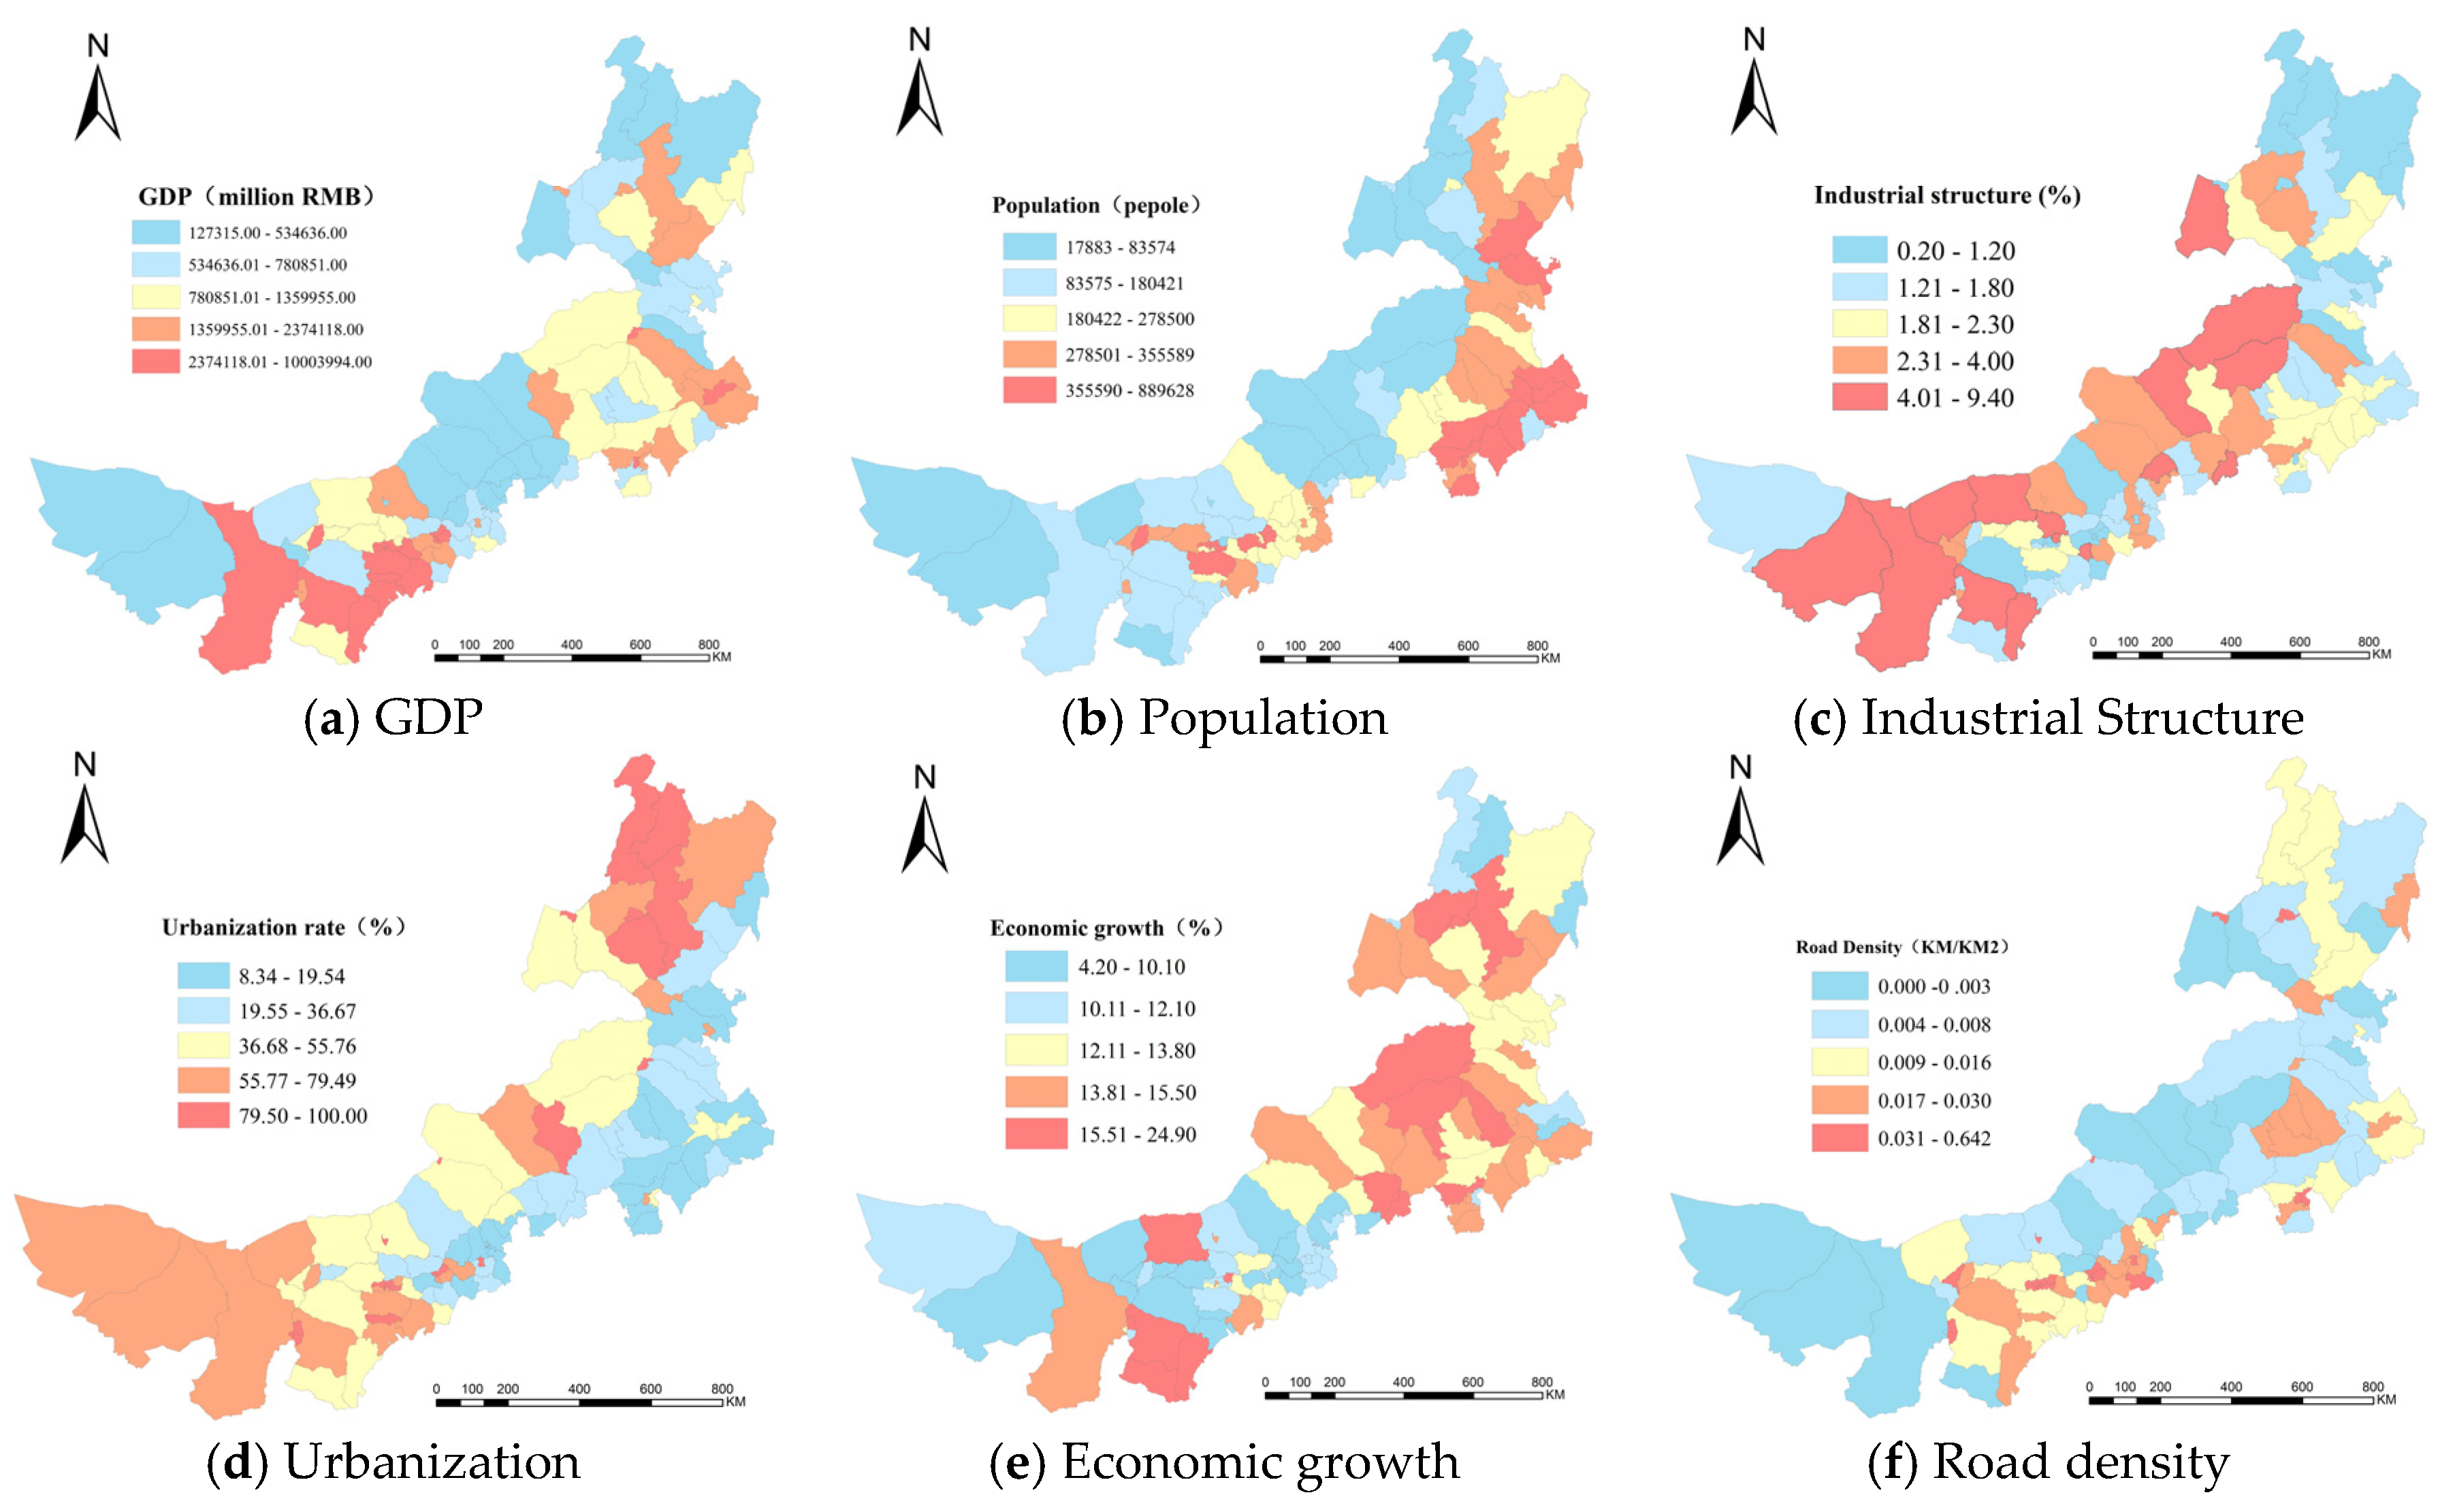
3.1. Spatial Distribution of Carbon Dioxide Emissions and Influencing Factors
| Variables | Mean | STD | Min | 25% | 50% | 75% | Max |
|---|---|---|---|---|---|---|---|
| Carbon dioxide emissions (million t) | 505.43 | 971.84 | 0.02 | 25.95 | 80.71 | 608.75 | 6999.58 |
| GDP (108 CNY) | 175.15 | 193.62 | 12.73 | 58.17 | 103.59 | 212.47 | 1000.4 |
| Economic growth rate (%) | 13 | 3.44 | 4.2 | 11.1 | 13.3 | 15.1 | 24.9 |
| Industrial structure (%) | 2.42 | 1.77 | 0.2 | 1.3 | 1.9 | 3.1 | 9.4 |
| Population (million people) | 24.86 | 16.74 | 1.79 | 10.9 | 23.26 | 33.95 | 88.96 |
| Urbanization rate (%) | 49.7 | 28.52 | 8.34 | 22.27 | 49.97 | 74.89 | 100 |
| Road density (km/km2) | 0.03 | 0.08 | 0 | 0 | 0.01 | 0.01 | 0.64 |

3.2. Spatial Correlation Analysis of Carbon Dioxide Emissions and Influencing Factors
| Carbon Dioxide Emissions | GDP | Population | Economic Growth Rate | Industrial Structure | Urbanization Rate | Road Density | |
|---|---|---|---|---|---|---|---|
| Carbon dioxide emissions | 1 | ||||||
| GDP | 0.52 | 1 | |||||
| Population | 0.13 | 0.44 | 1 | ||||
| Economic growth rate | 0.02 | 0 | −0.06 | 1 | |||
| Industrial Structure | 0.07 | −0.17 | −0.42 | 0.18 | 1 | ||
| Urbanization rate | 0.2 | 0.36 | −0.23 | 0.06 | −0.04 | 1 | |
| Road Density | 0.16 | 0.40 | 0.12 | 0.12 | −0.08 | 0.26 | 1 |
3.3. Analysis of Influencing Factors of Carbon Dioxide Emissions Based on Geographical Detector Model
3.3.1. Risk Detector
| GDP (Million Yuan) | <53 | 53–78 | 78–136 | 136–237 | >237 |
|---|---|---|---|---|---|
| Carbon dioxide emissions (million t) | 86.06 | 77.96 | 178.67 | 528.37 | 2006.99 |
| Industrial Structure (%) | <1.2 | 1.2–1.8 | 1.8–2.3 | 2.3–4.0 | >4.0 |
|---|---|---|---|---|---|
| Carbon dioxide emissions (million t) | 111.20 | 113.32 | 336.27 | 501.67 | 669.93 |
3.3.2. Factor Detector
3.3.3. Ecological Detector
| GDP | Population | Economic Growth Rate | Industrial Structure | Urbanization Rate | |
|---|---|---|---|---|---|
| GDP | |||||
| Population | Y | ||||
| Economic growth rate | Y | N | |||
| Industrial structure | Y | Y | N | ||
| Urbanization rate | Y | Y | N | N | |
| Road density | Y | N | N | N | N |
3.3.4. Interaction Detector
| GDP | Population | Economic Growth Rate | Industrial Structure | Urbanization Rate | Road Density | |
|---|---|---|---|---|---|---|
| GDP Population | 0.43- | |||||
| Economic growth rate | 0.51↑ | 0.37↑ | ||||
| Industrial structure | 0.40- | 0.34↑ | 0.37↑ | |||
| Urbanization rate | 0.48↑ | 0.44↑ | 0.44↑ | 0.13↑ | ||
| Road density | 0.71↑ | 0.30↑ | 0.29↑ | 0.32↑ | 0.38↑ |
4. Conclusions and Discussion
Acknowledgments
Author Contributions
Conflicts of Interest
References
- Wang, L.M.; He, K.L. Analysis of spatial variations in environmental impact based on the STIRPAT model-A case study of energy consumption. Acta Sci. Circumst. 2008, 28, 1032–1037. [Google Scholar]
- Philip, K.A.; William, B.; Franklin, A.M.; Justice, T.M.; Ebo, B. Carbon dioxide emissions, economic growth, industrial structure, and technical efficiency: Empirical evidence from Ghana, Senegal, and Morocco on the causal dynamics. Energy 2012, 47, 314–325. [Google Scholar]
- Wang, W.W.; Zhang, M.; Zhou, M. Using LMDI method to analyze transport sector CO2 emissions in China. Energy 2011, 36, 5909–5915. [Google Scholar] [CrossRef]
- Lee, C.C.; Chang, C.P. Energy consumption and economic growth in Asian economies: A more comprehensive analysis using panel data. Resour. Energy Econ. 2008, 30, 50–65. [Google Scholar] [CrossRef]
- Ehrlich, P.R.; Holden, J.P. Impact of population growth. Science 1971, 171, 1212–1217. [Google Scholar] [CrossRef] [PubMed]
- York, R.; Rosa, E.; Dietz, T. STIRPAT, IPAT and Impact: Analytic tools for unpacking the influencing forces of environmental impacts. Ecol. Econ. 2003, 46, 351–365. [Google Scholar] [CrossRef]
- Lin, S.F.; Zhao, D.T.; Dora, M. Analysis of the environmental impact of China based on STIRPAT model. Environ. Impact Assess. Rev. 2009, 29, 341–347. [Google Scholar] [CrossRef]
- Kaika, D.; Zervas, E. The Environmental Kuznets Curve (EKC) theory—Part A: Concept, causes and the CO2 emissions case. Energy Policy 2013, 62, 1392–1402. [Google Scholar] [CrossRef]
- Xu, X.Y.; Ang, B.W. Index decomposition analysis applied to CO2 emission studies. Ecol. Econ. 2013, 93, 313–329. [Google Scholar] [CrossRef]
- Su, B.; Ang, B.W. Structural decomposition analysis applied to energy and emissions: Some methodological developments. Energy Econ. 2012, 34, 177–188. [Google Scholar] [CrossRef]
- Ang, B.W. LMDI decomposition approach: A guide for implementation. Energy Policy 2015, 86, 33–238. [Google Scholar] [CrossRef]
- Wang, J.F.; Li, X.H.; Christakos, G.; Liao, Y.L.; Zhang, T.; Gu, X. Geographical detectors-based health risk assessment and its application in the neural tube defects study of the Heshun Region, China. Int. J. Geogr. Inf. Sci. 2010, 24, 107–127. [Google Scholar] [CrossRef]
- Hu, Y.; Wang, J.F.; Li, X.H.; Ren, D.; Zhu, J. Geographical Detector-Based Risk Assessment of the Under-Five Mortality in the 2008 Wenchuan Earthquake, China. PLoS ONE 2011, 6, e21427. [Google Scholar] [CrossRef] [PubMed]
- Allen, M.P. Regression Analysis with Dummy Variables. Understanding Regression Analysis; Plenum Press: New York, NY, USA, 1997; pp. 128–132. [Google Scholar]
- Huang, J.X.; Wang, J.F.; Bo, Y.C.; Xu, C.D.; Hu, M.G.; Huang, D.C. Identification of Health Risks of Hand, Foot and Mouth Disease in China Using the Geographical Detector Technique. Int. J. Environ. Res. Public Health 2014, 11, 3407–3423. [Google Scholar] [CrossRef] [PubMed]
- Inner Mongolia Statistical Yearbook. 2012. Available online: http://nianjian.xiaze.com/info/nmgtjnj.html (accessed on 15 November 2012).
- Intergovernmental Panel on Climate Change. IPCC Guidelines for National Greenhouse Gas Inventories; Intergovernmental Panel on Climate Change: Geneva, Switzerland, 2007. [Google Scholar]
- Eldridge, H.T. Population growth and economic development. Land Econ. 1952, 28, 1–9. [Google Scholar] [CrossRef]
- Wu, J.R.; Yang, Z.P.; Adayi, S. Impact factors and temporal variation of environmental pressure of Xinjiang based on ATIRPAT model. Arid Land Geogr. 2011, 34, 187–192. [Google Scholar]
- Maslow, A.H. A theory of human motivation. Psychol. Rev. 1943, 50, 370–396. [Google Scholar] [CrossRef]
- Cao, F.; Ge, Y.; Wang, J.F. Optimal discretization for geographical detectors-based risk assessment. GIS Sci. Remote Sens. 2013, 50, 78–92. [Google Scholar]
- Wang, J.F.; Hu, Y. Environmental health risk detection with GeogDetector. Environ. Model. Softw. 2012, 33, 114–115. [Google Scholar] [CrossRef]
© 2016 by the authors; licensee MDPI, Basel, Switzerland. This article is an open access article distributed under the terms and conditions of the Creative Commons by Attribution (CC-BY) license (http://creativecommons.org/licenses/by/4.0/).
Share and Cite
Wu, R.; Zhang, J.; Bao, Y.; Zhang, F. Geographical Detector Model for Influencing Factors of Industrial Sector Carbon Dioxide Emissions in Inner Mongolia, China. Sustainability 2016, 8, 149. https://doi.org/10.3390/su8020149
Wu R, Zhang J, Bao Y, Zhang F. Geographical Detector Model for Influencing Factors of Industrial Sector Carbon Dioxide Emissions in Inner Mongolia, China. Sustainability. 2016; 8(2):149. https://doi.org/10.3390/su8020149
Chicago/Turabian StyleWu, Rina, Jiquan Zhang, Yuhai Bao, and Feng Zhang. 2016. "Geographical Detector Model for Influencing Factors of Industrial Sector Carbon Dioxide Emissions in Inner Mongolia, China" Sustainability 8, no. 2: 149. https://doi.org/10.3390/su8020149
APA StyleWu, R., Zhang, J., Bao, Y., & Zhang, F. (2016). Geographical Detector Model for Influencing Factors of Industrial Sector Carbon Dioxide Emissions in Inner Mongolia, China. Sustainability, 8(2), 149. https://doi.org/10.3390/su8020149