4.2. Production Function of Soybean in Northern Ghana
The results of the translog production function using stochastic frontier analysis are reported in
Table 3. The results show that Soybean output in Northern Ghana is determined by factors such as cultivated land, seeds, labor and agro-chemical quantities, which are statistically significant at the level of significance of 10%. The level or quantity of fertilizer, however, was not significant, yet the square quantity was significant at 1%.
We also attempted to include the effect of NGOs as a frontier-shifting dummy variable in the production frontier in order to ascertain whether farm productivity is affected by the facilitation. However, the associated coefficient was not significant. One of the possible explanations could be that NGO facilitation in Ghana mainly works through improved utilization of inputs rather than expansion in the scale of operation, which would be more likely to induce frontier shifts.
Without mean scaling, the results in
Table 3 are first order coefficients of the flexible translog production frontier and cannot be interpreted directly. Therefore, we calculate the partial input elasticities using sample means and following Abdulai and Eberlin [
20], Xu
et al. [
31]:
Table 4 reports the resulting estimates of input and scale elasticities. Note that labor is the only input featuring negative elasticity. The remaining inputs all show positive elasticities.
The higher rates of returns to land and seeds suggest that the increase in soybean production is mainly a result of expansion of the land area. This is not surprising as land is not a major limitation to production in Northern Ghana. This result corresponds to that of Abdulai
et al. [
32] who found land, seeds, and agro-chemicals to have positive significant elasticities for maize in Northern Ghana. As one can note, fertilizer input and agro-chemicals are likely to stimulate production to a lower extent than land and seed inputs. This indicates that improvement in application of fertilizers and other chemicals is needed to increase sustainability of farming.
The technology seems to be close to that of constant returns to scale as scale elasticity is slightly below unity at 0.97. Noteworthy, Etwire
et al. [
11] found soybean farmers in Saboaba Chereponi to be producing at decreasing returns to scale of 0.75. The present results suggest that a 1% increase in the use of all inputs will increase the output by 0.97%,
ceteris paribus.
The labor elasticity suggests a 1% increase in labor will decrease output by 0.33%, other inputs remaining constant, and this might be explained by the fact that soybean production in Northern Ghana is facilitated on small scale with average farm size of 0.89 hectare and mean household size of 11 persons. The small land size and large household therefore suggest that labor is being overused. It can also be explained by the lack of machinery employed in soybean production in the area, making farmers dependent on manual labor for all operations on the farm except for plowing. The dependence of Ghanaian agriculture on manual labor is stressed by Asante
et al. [
33] who also finds labor to have negative returns to output in Ghana. The findings of this study is also substantiated by the those of Asogwa
et al. [
34] who found that land, fertilizer and seeds have positive elasticities, whereas it is not the case for labor.
4.3. Technical Efficiency Estimates
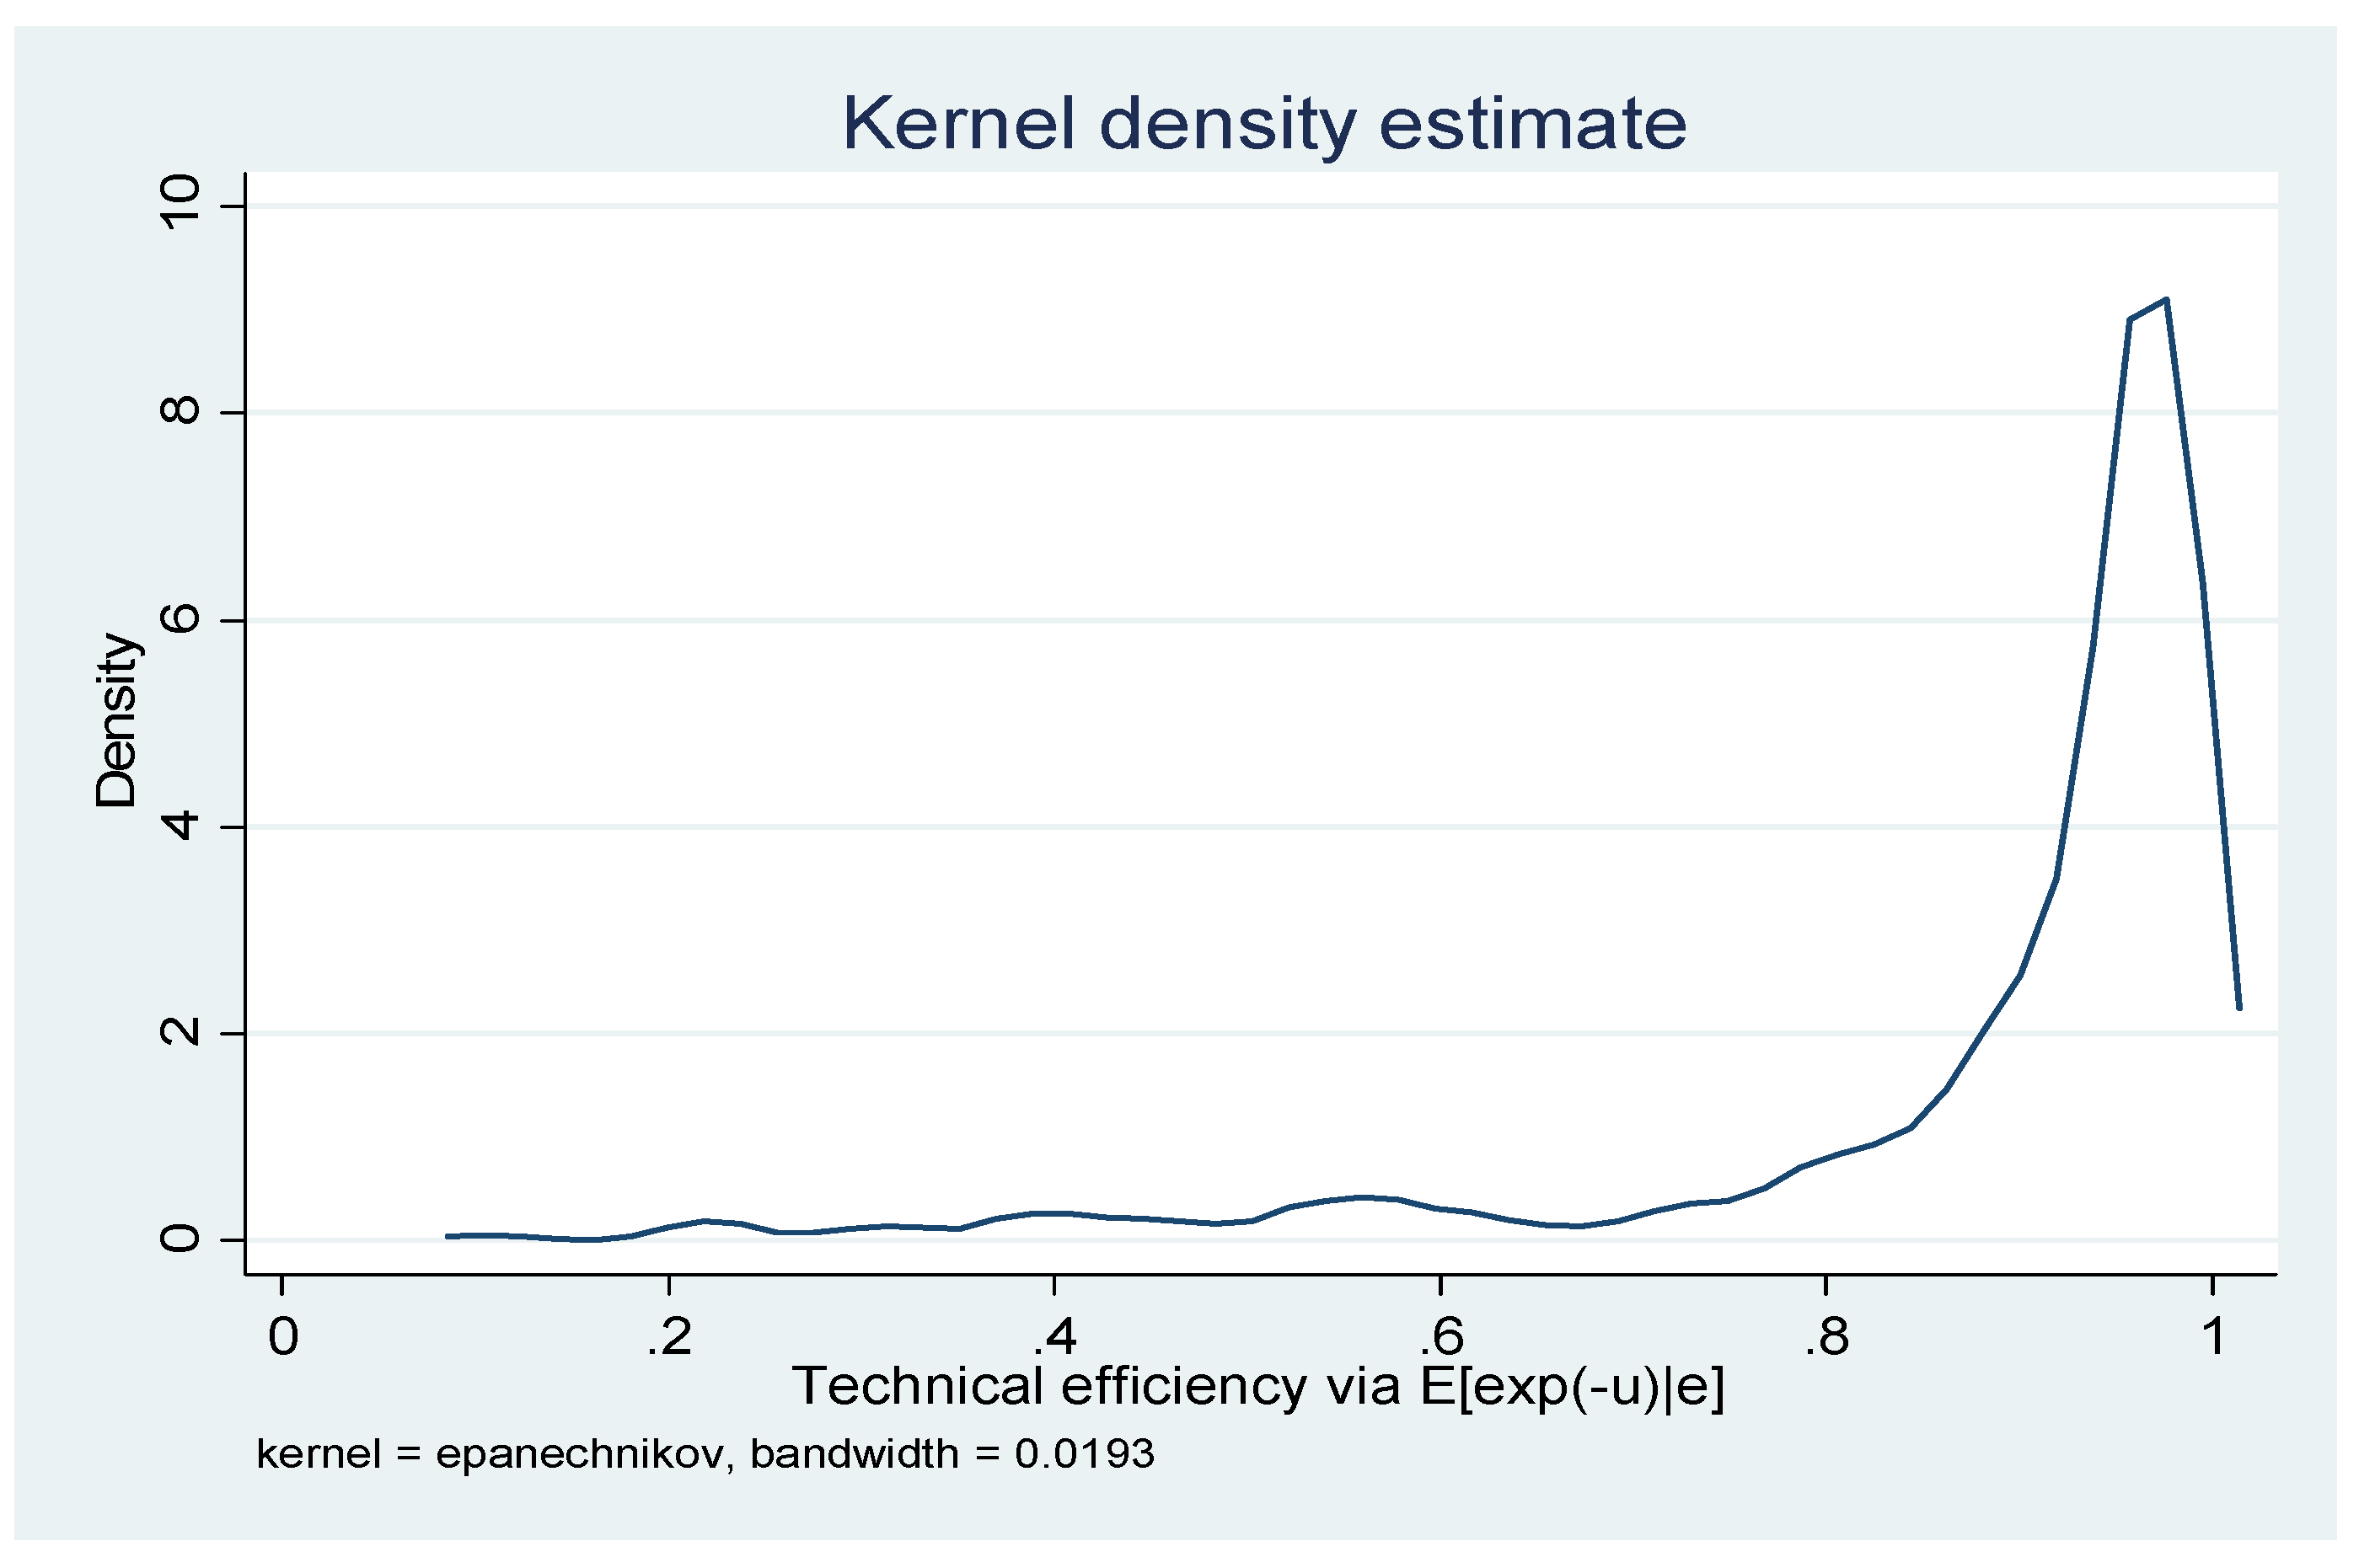
The mean technical efficiency for soybean farms in Northern Ghana is estimated to be 0.885 with a minimum of 0.105 and maximum level of 0.995. This indicates the average soybean farmers can increase their production of soybean by 11.5% with the current level of inputs used. Similarly, Kaur
et al. [
35] reported mean efficiencies of wheat production to be 87%, 94%, 86% for semi-hilly, central, south-western parts of Punjab state, respectively (sample mean—87%). Indeed, the high levels of efficiency could be a result of the numerous capacity building programs farmers receive from NGOs and other development agencies in the area and thereby enhance the utilization of inputs. Anyway, the results suggest the least efficient farmer can increase their level of production by 89.5% without altering the level of input use.
Figure 1 shows the distribution of efficiency scores by means of kernel density plot. Most farmers (71.4%) operate at efficiency levels above 0.90 while less than 10% operate at efficiency levels below 0.60. This means that about 9.2% of farmers can increase their production of soybean by 40% or higher extent without increasing the current level and quantities of inputs used. This implies resource waste is not that acute among Northern Ghana soybean farmers.
However, the high level of technical efficiency can also be explained by the majority of the farmers having a similar mode of production and resource utilization. It could be the reason why farmers have higher efficiency levels but lower outputs, as yields are below achievable levels with an average yield of 0.89 t/ha,
i.e., much below the achievable yield of 2 t/ha as stipulated by Akramov and Malek [
3]. This could be the outcome of the facilitations from NGOs and development agencies as training and other capacity building programs mostly seek to improve farmers’ managerial skills. It is therefore possible that the high efficiency scores accompanied by low outputs could be a result of low input usage. The perception by farmers that soybean is a crop that does not require fertilizer application for its production is evident as only 23% and 30% of the farmers apply fertilizer and agro-chemicals, respectively, on their soybean farms. Low input use can lead to low yields or outputs even if the inputs are used efficiently. This viewpoint portrays that NGOs and development agencies have still much to do with regards to levels of inputs required for soybean production improvement. What is more, other factors, such as erratic rains and pests (rodents), are not uncommon in Northern Ghana and can affect outputs of soybean significantly.
Table 5 below summarizes the distributions of efficiencies for facilitated and non-facilitated farms.
The data in
Table 5 show that the percentage of non-facilitated farmers (14%) with efficiency less than 0.6 is higher than that for facilitated farms (6%). In addition, farmers with efficiency above 0.9 are more frequent among facilitated farmers (74%) than among non-facilitated farmers (67%). Thus, much of the farmers in the low efficiency cohorts are those not facilitated whilst much of the higher efficiency observations come from the facilitated farmers. This supports the argument that NGOs and development agency facilitations lead to effective resource utilization and, hence, higher efficiencies among farmers.
To further substantiate the contribution of NGOs to improving technical efficiency, a two sample
t-test is carried out to ascertain whether the differences in technical efficiency between farmers who participate in development projects and facilitations by NGOs and farmers who do not participate in development projects and are not facilitated by NGOs working in Northern Ghana are statistically significant. The null hypothesis of equal means for the two groups is rejected at a 5% level of significance, as indicated in
Table 5. This, therefore, provides strong evidence in regards to a positive influence of NGOs and development agencies on technical efficiency. Farmers who are facilitated by NGOs and development organization operate with the mean efficiency score of 0.902 while those not facilitated operate at 0.858, which is 0.044 lower compared to those facilitated.
4.4. Determinants of Technical Efficiency
Following Equation (6), the negative coefficients in technical inefficiency model are interpreted as those reducing inefficiency. Therefore, technical efficiency increases with the value of such a factor and
vice versa. As shown in
Table 6, the conventional factor inputs are included into the inefficiency function as exogenous factors affecting technical efficiency besides the socio-economic factors or characteristics of farmers as suggested by [
31]. With the exception of agro-chemicals, all the classical inputs are significant. However, the coefficients near the factors inputs are both positive and negative implying different degrees of input exploitation.
Table 5 already suggested facilitated farms are more efficient if opposed to non-facilitated ones. The corresponding variables in the inefficiency equation (
Table 6) capture the pure effect of facilitation. Specifically, the coefficient of development agencies and NGOs facilitation,
viz. NGO facilitation, is negative and significant at 5%. This suggests that the services provided by development organizations and NGOs to farmers, e.g., training, information support, credit and other input supply, technology transfer, and market linkages as well as monitoring and evaluations of farmer’s production practices, help the farmers to use their productive resources efficiently.
As regards the earlier literature, Seyoum
et al. [
37] also found farmers, who participated in the SG2000 project on maize production, to be more technically efficient that non-participants in Ethiopia. Though this research cannot ascertain and conclude on the indirect effects of NGOs and development organization facilitation on non-participants, it is assumed that the trickling down effects of the NGOs and other development organizations facilitation are reaching most farmers in the communities even if not facilitated directly, as farmers tend to learn and share knowledge and adopt technologies being practiced by their peers. This may explain the marginal difference between facilitated and non-facilitated farmers, otherwise the margins would have been wider. However, further studies need to be conducted to ascertain the attribution of the difference in technical efficiency to facilitation by NGOs and other development organizations/agencies and projects.
In addition, a prerequisite for most NGO and development agency facilitation is the formation of FBOs due to the benefits that can be derived. However, contrary to our expectations, group membership is found to reduce farmers’ technical efficiency. We also attempted to introduce an interaction term to capture the effects of both receiving NGO facilitation and belonging to an FBO. However, the latter variable appeared to be insignificant and thus was not considered for the further analysis. As shown in
Table 6, the coefficient of farmer group membership is positive and significant at 5%, which implies that belonging to farmer groups reduces farmer’s technical efficiency. A similar result is reported by Addai
et al. [
38], although the difference between members and non-members was not significant in that case. They explained that the underlying reason could be an inappropriate diversion of resources received from the groups by group members, which is very likely to be the case in this study. This, however, contradicts our expectations that belonging to a farmers’ group allows members accessing resources easily and timely as well as learning from their peers and ultimately improving their production as indicated by Alwarritzi
et al. [
18]. Indeed, [
18] found positive relationship between technical efficiency and farmer group membership. The results of this study, indeed, can be explained by the fact that, in some cases, farmers’ groups in Northern Ghana are formed solely to enjoy the benefits from the development organizations and NGO projects. This, obviously, precludes functioning towards the core objectives stipulated by the NGOs and development agencies. Furthermore, most farmer groups are engaged in demand pooling to purchase inputs at reduced prices, and, therefore, are less keen on implementing practices that would improve the utilization of the acquired inputs. All in all, members may access inputs but may not use these optimally. The group structure and dynamics as well as the motives for joining groups, if not well defined and adjusted, can also reduce the ability of the groups to deliver on their objective of improving productivity as suggested by Addai
et al. [
38]. Moreover, the inverse relationship between membership in farmer groups and technical efficiency could also be the result of poor cohesion or weak commitments among members in farmers’ groups, which emanate from lack of downward accountability. This makes many FBOs too weak to exploit their benefits and economics of scale [
39]. It is therefore suggested that interventions by NGOs and development agencies should include strengthening farmers’ capacities to challenge exclusion and demand accountability. Alternatively, non-group members’ efficiency may be higher as they operate individually and may not have access to inputs eventually putting more efforts into reducing input waste.
As regards the other determinants of technical efficiency, the results in
Table 6 imply the gender of a farmer is significant at 10% in determining technical efficiency of soybean production in Northern Ghana with a positive coefficient indicating males are more efficient in soybean production than females. This was expected as agriculture in Ghana and Northern Ghana is dominated by males who are more favored in accessing production resources and information compared to females who are burdened with household and other social obligations like caring for children in the household. Abatania
et al. [
14], Donkoh
et al. [
15] and, Amoah
et al. [
40] also found gender to have significant influence on technical efficiency. Other socio-economic characteristics of farmers, such as age and education level, were significant at 1% and 5%, respectively, with inverse relationships with technical efficiency. These results are in lines with Alwarritzi
et al. [
18] and Bozoğlu and Ceyhan [
41] who found similar results for age. This situation, however, contradicts to that in Europe, where a study by Nowak
et al. [
42] indicated the existence of positive relationship between age and technical efficiency.
One can argue that the use of improved and certified seeds needs to be treated as a different technology. However, we follow the approach taken in previous studies [
13,
28,
40,
43,
44,
45], where the use of improved and certified seeds was treated as an explanatory variable, access to which is also being facilitated by NGOs and development agencies. The use of improved and certified seeds and the use of fertilizer were both significant. The associated coefficients indicate a positive contribution of the said factors towards technical efficiency. This was not surprising as Amoah
et al. [
40] suggested a positive relationship between efficiency and use of improved seeds. This demonstrates access to and utilization of these inputs improves efficiency of soybean production. Therefore, NGOs and development agencies need to strive to increase access to improved seeds and fertilizers as current levels of application are low. Indeed, it is a long-term task to make the high efficiency levels meaningful by raising outputs and consequently helping to alleviate poverty. Extension contact is also a key instrument in pushing technical efficiency up as it positively influences technical efficiency among smallholder farmers.
Furthermore, technical efficiency is also significantly (p < 0.05) influenced by the regional location of farmers. Farmers in the Northern region are found to be more efficient in soybean production than those from Upper West and East regions collectively. These results can be attributed to the fact that access and availability of inputs and production services as well as soils and climatic conditions vary across the regions. Northern region, for instance, hosts most of the development organizations (such as the NRGP and the SADA; and such NGOs as the ACDEP, the IFDC, and ADVANCE), farmers have access to plowing services (such as tractors), which are not the case for Upper East and West regions. In addition, variations in social values exist among the regions, especially in Muslim dominated areas like Upper West Sissala districts, where women are not encouraged to farm and this may influence technical efficiency.
Finally, such socio-economic factors as farmers experience in soybean farming, access to credit and household size were not significant in their influence on technical efficiency.
To address the possible issue of endogeneity, which, in our case, might arise due to self-selection bias, we consider some additional contextual variables as proxies to farmers’ attitudes towards farming. These might explain farmers’ decisions to join projects by NGOs, yet are not likely to affect output levels directly. Specifically, Output sold, Perception on farming, Gender of household head, and Farmer’s exposure are related to entrepreneurship abilities and the degree of market integration, which, in turn, could trigger participation in the projects. However, it is due to
Table S1 that the differences in the aforementioned variables are not significant across facilitated and non-facilitated farms. As there have been no clear patterns of farmers’ characteristics leading to facilitation by NGOs, one can assume that the issue of endogeneity is not acute in the present study. However, endogeneity needs to be seriously considered in further studies on the impacts of NGOs by considering (i) additional variables in the questionnaire survey and (ii) applying improved techniques for estimation.


 ,
, 
