As explained earlier, the analysis of cycle performance was performed by neglecting the friction and heat losses in the pipes and heat exchangers, and assuming adiabatic turbomachinery (turbine and feed pump).
4.1. Effect of Working Fluid Properties on Thermal Efficiency and Specific Net Work Output
Correlations for thermal efficiency developed by the authors [
31,
32] were used to investigate the effects of the working fluid properties on performance of a simple ORC. Equations (1), (5) and (8) show that, in a subcritical region, thermal efficiency is a function of the specific heat capacity and the latent heat of evaporation.
It can be shown that the first derivative of Equations (1) and (8) with respect to
in the subcritical region is negative (Equation (37)), meaning that at constant maximum and minimum temperatures, working fluids with higher specific heat capacity give lower thermal efficiency.
However, the first derivative of Equations (1) and (8) with respect to
in the subcritical region is positive (Equation (38)), meaning that at constant maximum and minimum temperatures, working fluids with higher latent heat of evaporation give higher thermal efficiency.
Since the first derivatives of expression for
(Equation (21)) with respect to specific heat capacity
and latent heat of evaporation
in the subcritical region are positive, Equation (39), working fluids with higher
or
produce higher net power output.
The effect of critical temperature on thermal efficiency (Equations (1) and (8)) and net power output (Equation (21)) for
Tmin = 2 °C and
Tmax = 100 °C is presented in
Figure 5. As the results show, both
and
increase as the latent heat of evaporation is increased. An increase in the specific heat,
Cp, results in a higher net power output and lower thermal efficiency.
Depending on the application of a simple subcritical ORC, there is an optimum specific heat capacity representing a tradeoff between thermal efficiency and net power output. The optimal value of Cp may be determined by developing a relationship between the LCOE and Cp and finding its minimum.
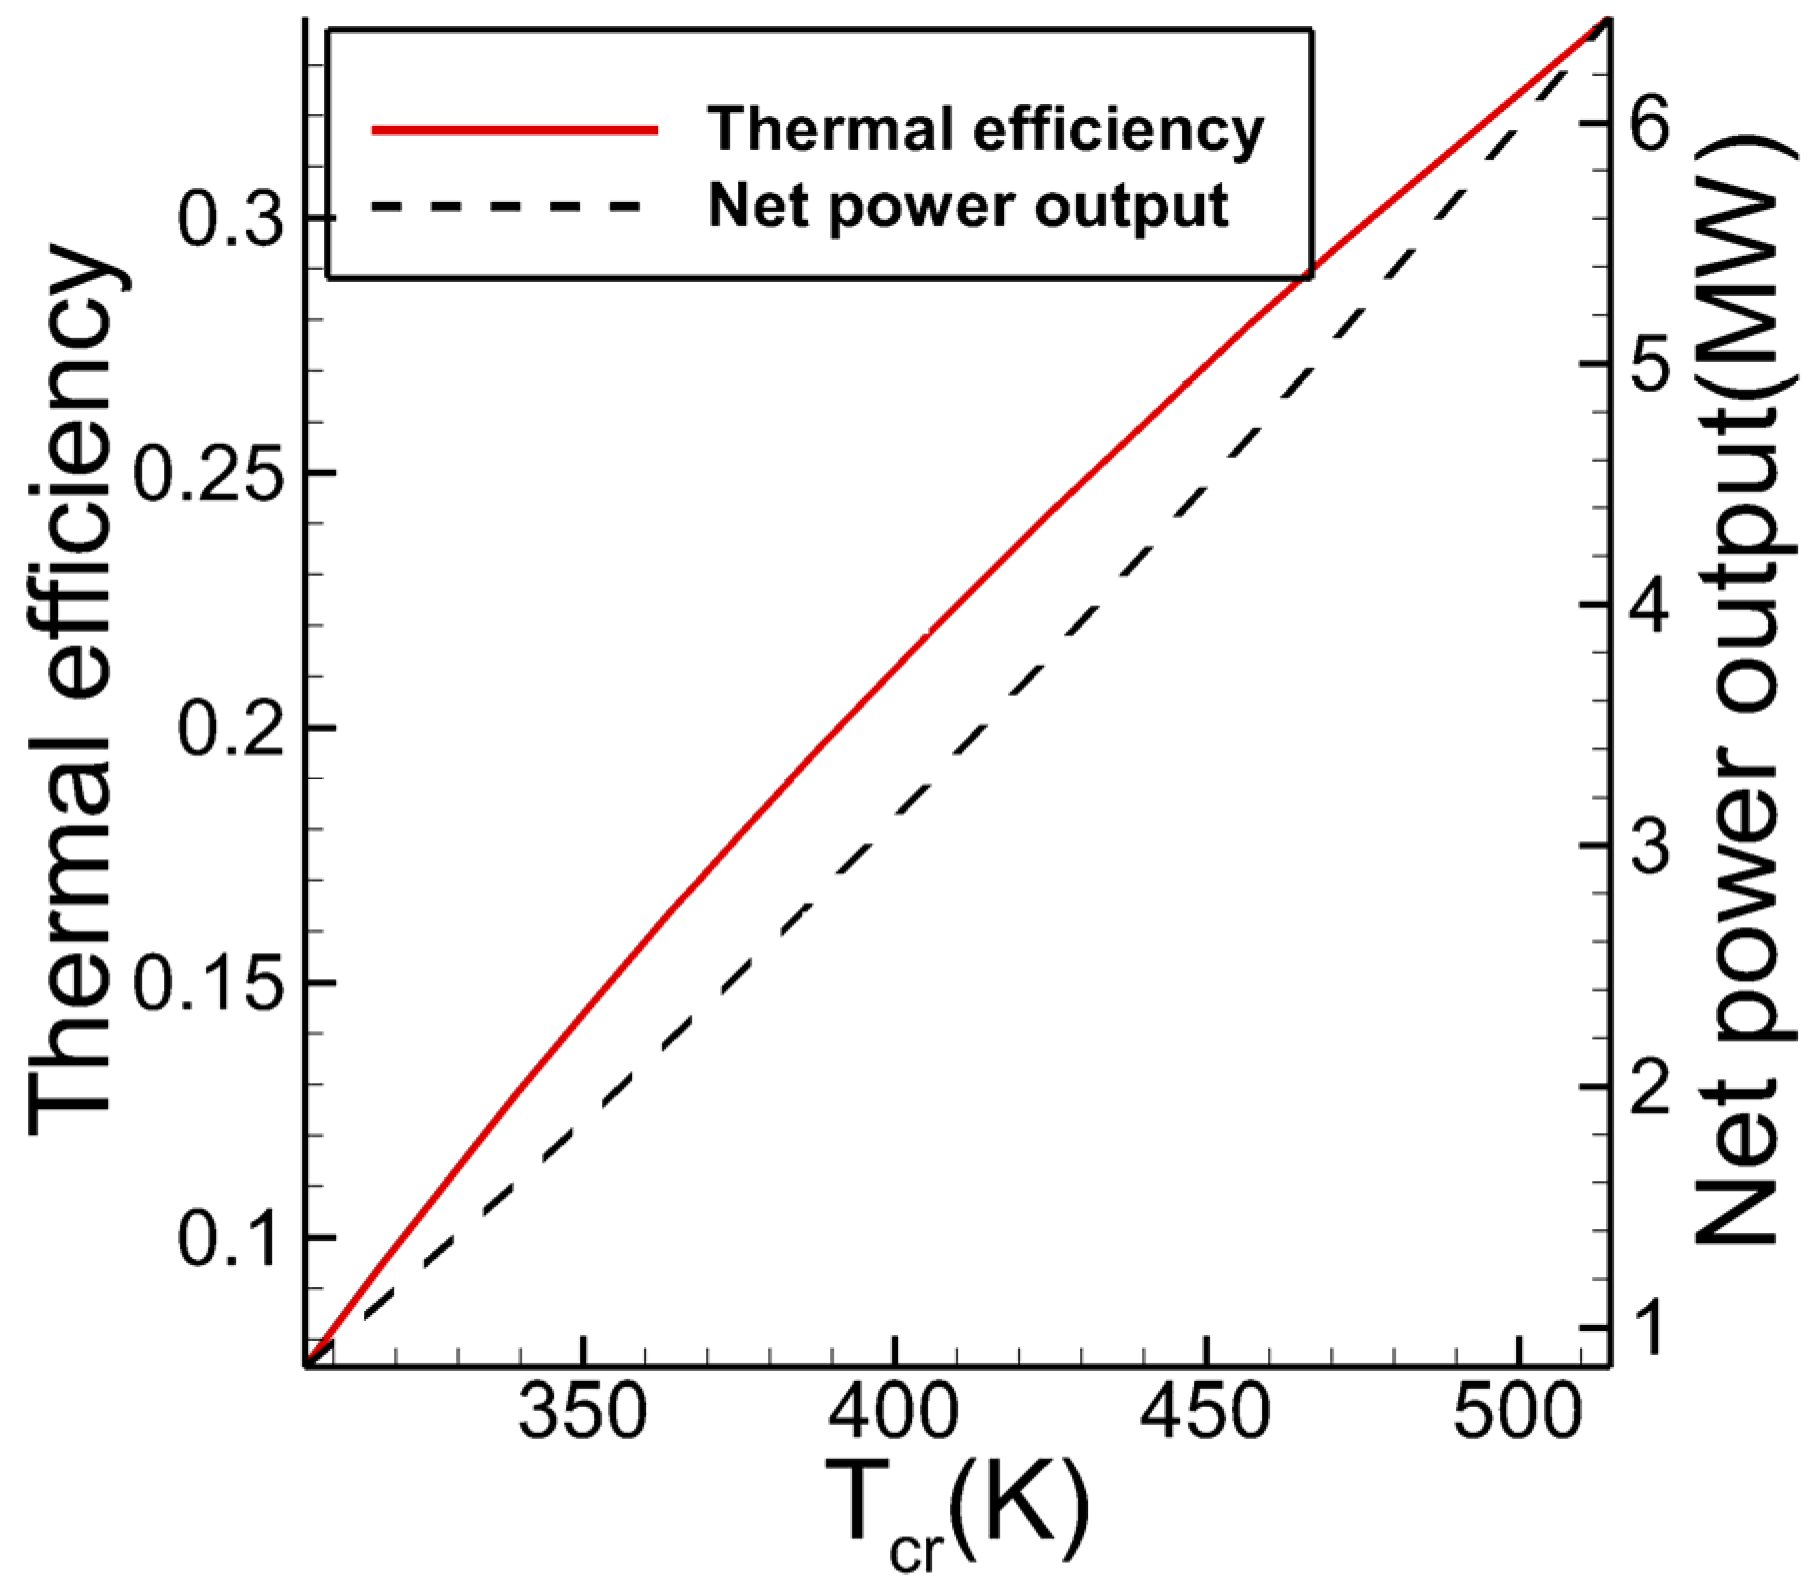
Equation (15) shows that in the supercritical region, thermal efficiency is affected by the critical temperature
Tcr. It can be shown that the first derivative of Equation (15) in the supercritical region is positive (Equation (40)), meaning that at constant maximum and minimum temperatures, working fluids with higher critical temperature give higher thermal efficiency.
Since the first derivatives of the expression for the net power output (Equation (21)) with respect to the specific heat
Cp and critical temperature
Tcr (expressed in dimensionless form as
Tr) are positive, Equation (41), working fluids with higher
Cp or
Tcr produce higher net power output.
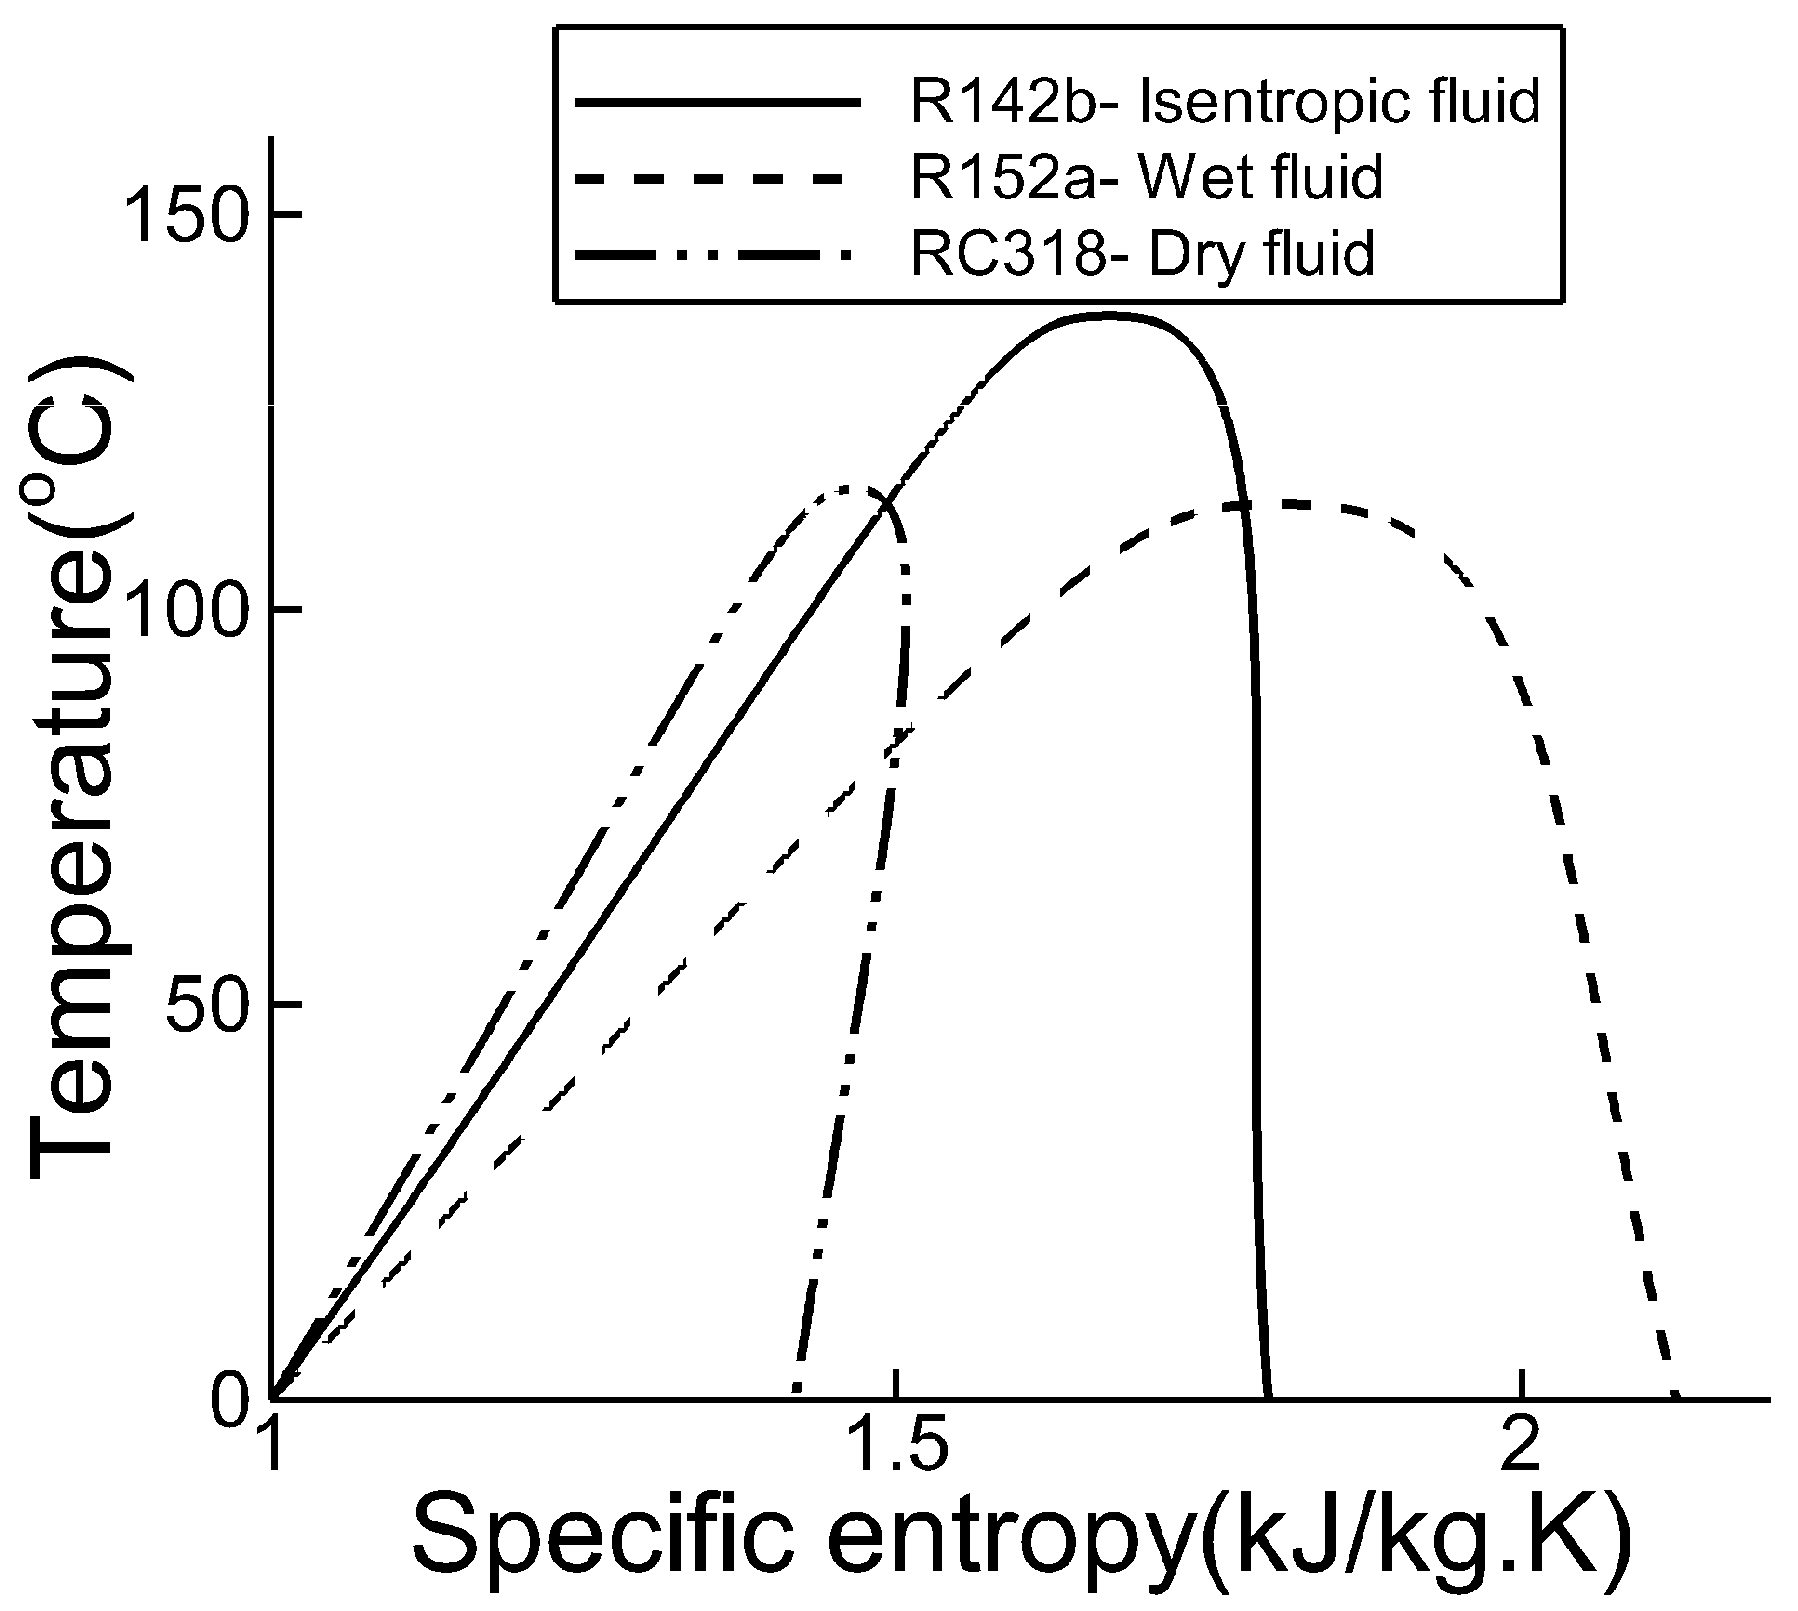
In addition, the first derivative of Equations (8), (15) and (21) with respect to
in the superheated subcritical and supercritical region is negative (Equation (42)), meaning that, at constant maximum and minimum temperatures, wet and isentropic working fluids give higher thermal efficiency and net power output, compared to the dry fluids.
The effect of critical temperature on thermal efficiency (Equation (15)) and net power output (Equation (21)) for
Tmin = 2°C and
Tmax = 200 °C is presented in
Figure 6. As the results show, both
and
increase as critical temperature is increased.
4.2. The Effect of Operating Conditions on Performance of a Combined Brayton/ORC Cycle
Thermal efficiency of a combined regenerative Brayton/ORC cycle, shown in
Figure 3, was determined over a range of operating conditions for twelve working fluids listed in
Table 1 for the bottoming (ORC) cycle, and nine working fluid listed in
Table 2 for the topping regenerative Brayton cycle. The cycle parameters used in the calculations are summarized in
Table 9.
The temperature difference between the topping cycle turbine inlet temperature (TC-TIT) and the heat source temperature of 10 °C was assumed in the calculations. In addition, the optimal pressure ratio of the topping cycle was determined, as described in [
47]. At the optimal pressure ratio, the cycle network output reaches its maximum value. Since the flow rate of the working fluid in the bottoming cycle is dependent on the mass flow rate of the working fluid in the topping cycle, a constant gross power output of 100 MW was assumed for the topping cycle.
The topping (regenerative Brayton) cycle exhaust (heat rejection) temperature (
T6) for nine working fluids is presented in
Figure 7 over the range of operating conditions.
As the results show, depending on the operating conditions, the topping cycle using CO2 as a working fluid has the highest and lowest cycle exhaust temperature, followed by air and O2. For example, for a TIT of 1000 °C, CO2 produces the cycle exhaust temperature around 350 °C. For the range of analyzed operating conditions, the exhaust temperature of the regenerative CO2 Brayton cycle is between 100 °C and 350 °C, which is within the ORC operating range. Thus, the ORC can be selected as the bottoming cycle in the combined regenerative Brayton/ORC cycle configuration.
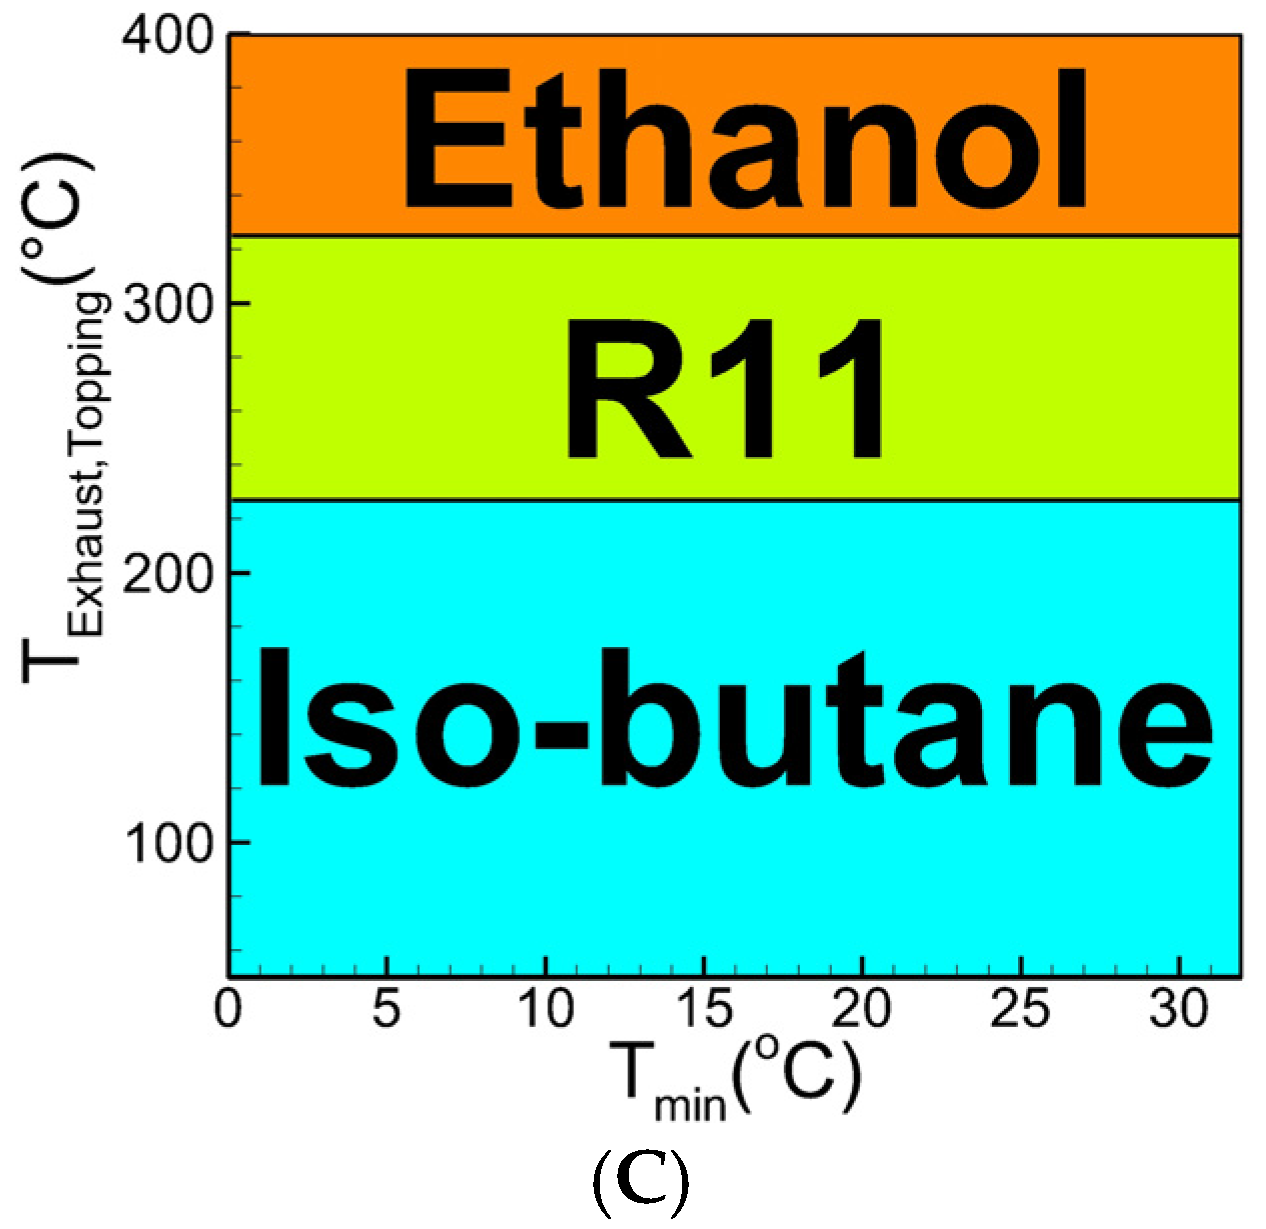
Figure 8 shows the effect of exhaust temperature of the topping cycle (TC-ET) on the
A value given in Equation (22), where quantity
A represents improvement in thermal efficiency of the combined cycle with respect to the topping cycle. Five working fluids having the highest
A value (efficiency improvement with respect to the topping cycle) are shown in
Figure 8. As can be seen in
Figure 8, for the values of topping cycle exhaust temperature lower than 227 °C, Iso-butane performs better than other working fluids. R11 is the preferred working fluid for TC-ET in the 227 °C and 327 °C range. For TC-ET higher than 327 °C, ethanol gives the highest
A value (highest efficiency improvement).
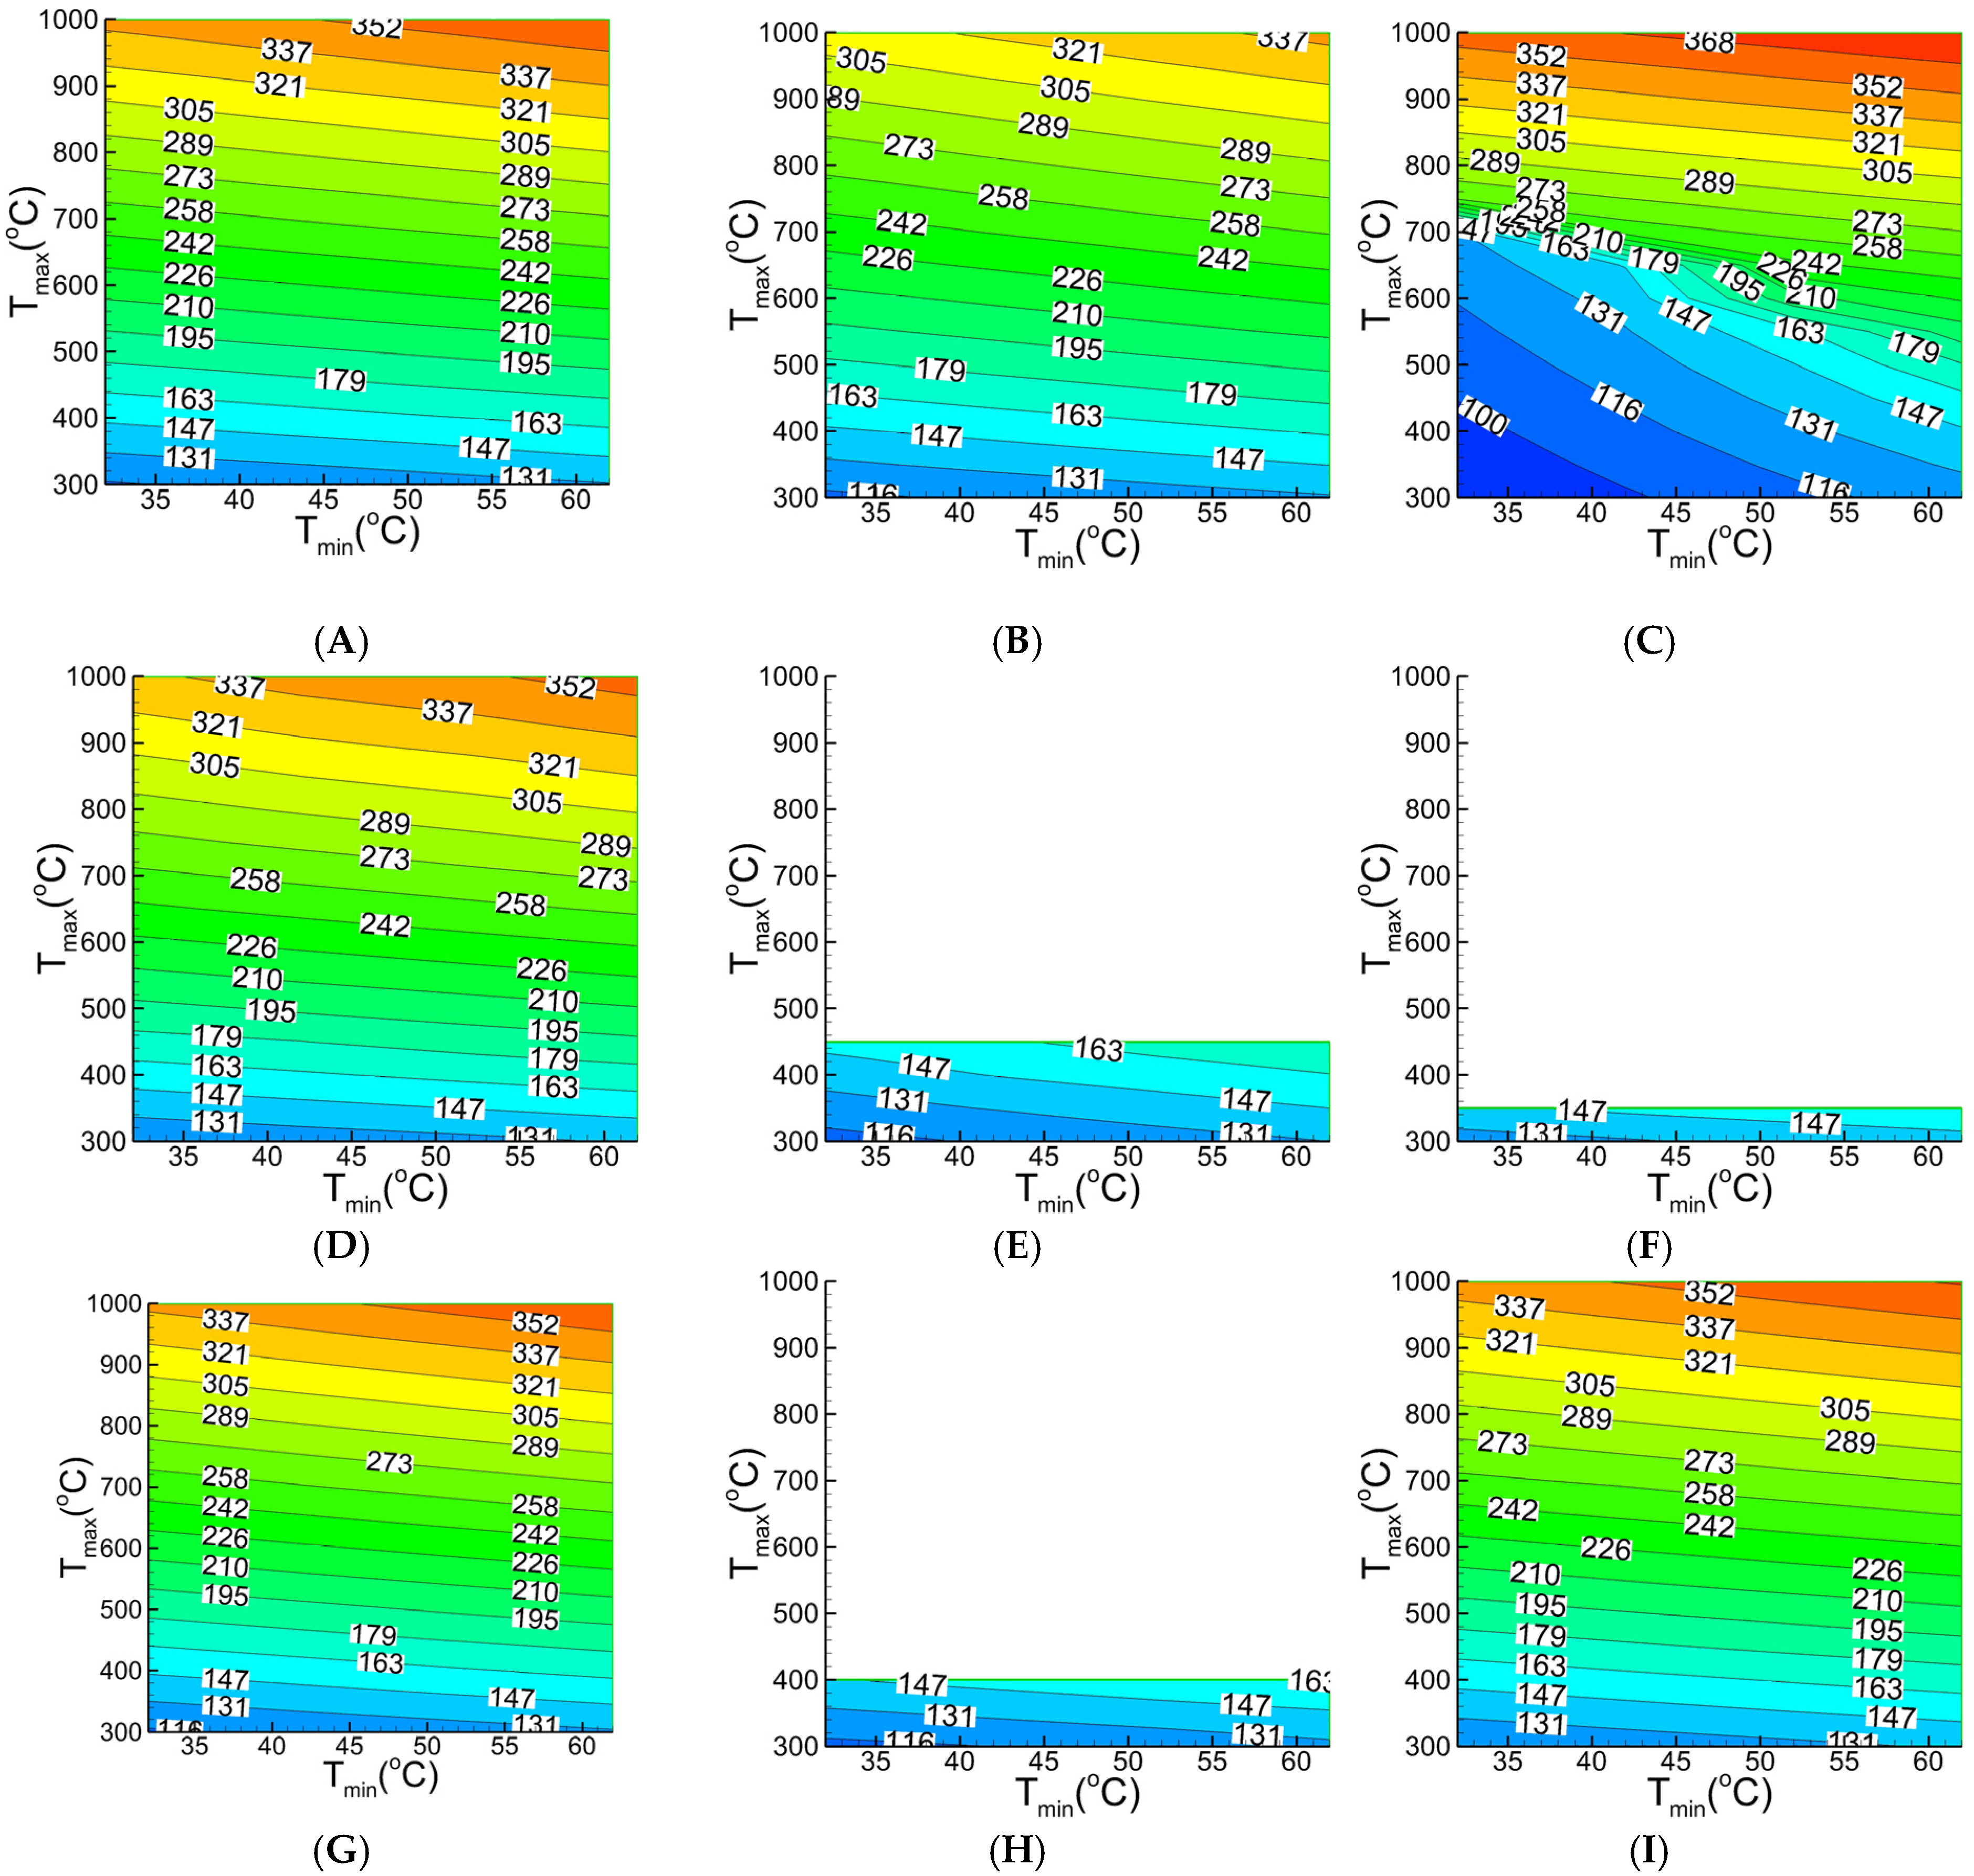
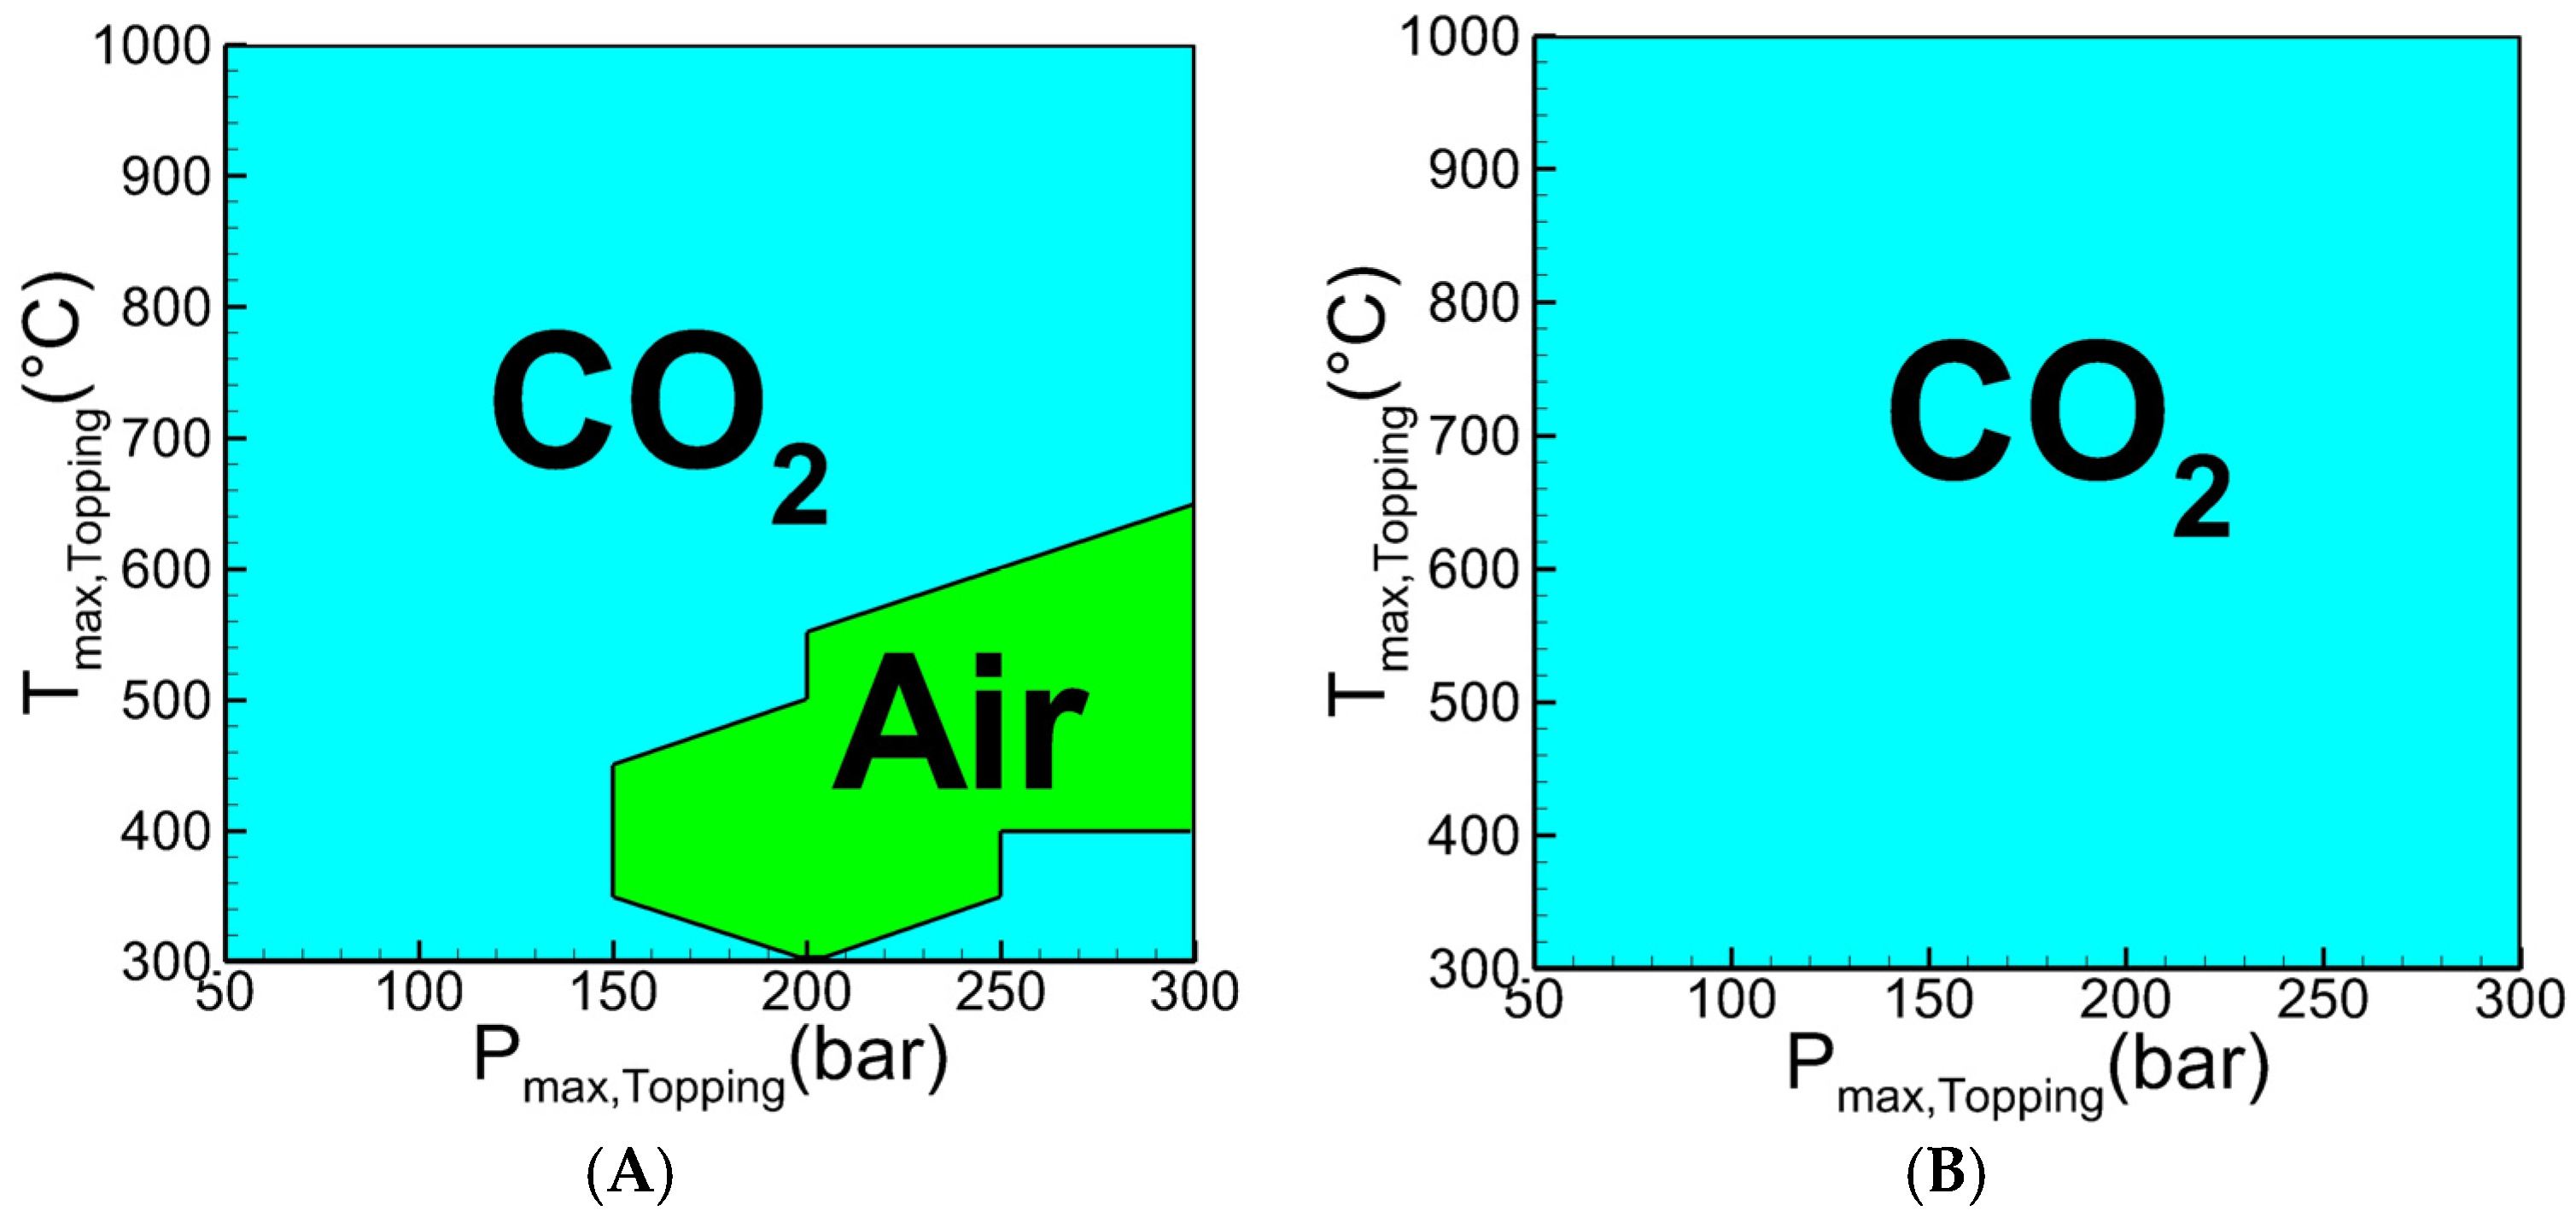
One of the main objectives of this study is selection of the preferred (most suitable, best) working fluid(s) for the given cycle operating conditions. A performance map of thermal efficiency for the combined regenerative Brayton/ORC cycle was developed to enable selection of the best working fluids for the topping and bottoming cycles,
Figure 9.
Performance maps for the topping cycle are presented in
Figure 9A,B. As shown in
Figure 9A, for the minimum temperature of the combined regenerative Brayton/ORC cycle lower than 42 °C, depending on the maximum temperature and pressure, CO
2 or air are the preferred working fluids. As shown in
Figure 9B, for the minimum temperature higher than 42 °C, CO
2 is the preferred working fluid over the entire range of analyzed operating conditions. Performance map for the bottoming ORC is presented in
Figure 9C. Depending on the TC-ET, Iso-butane, R11, or ethanol are the preferred working fluids.
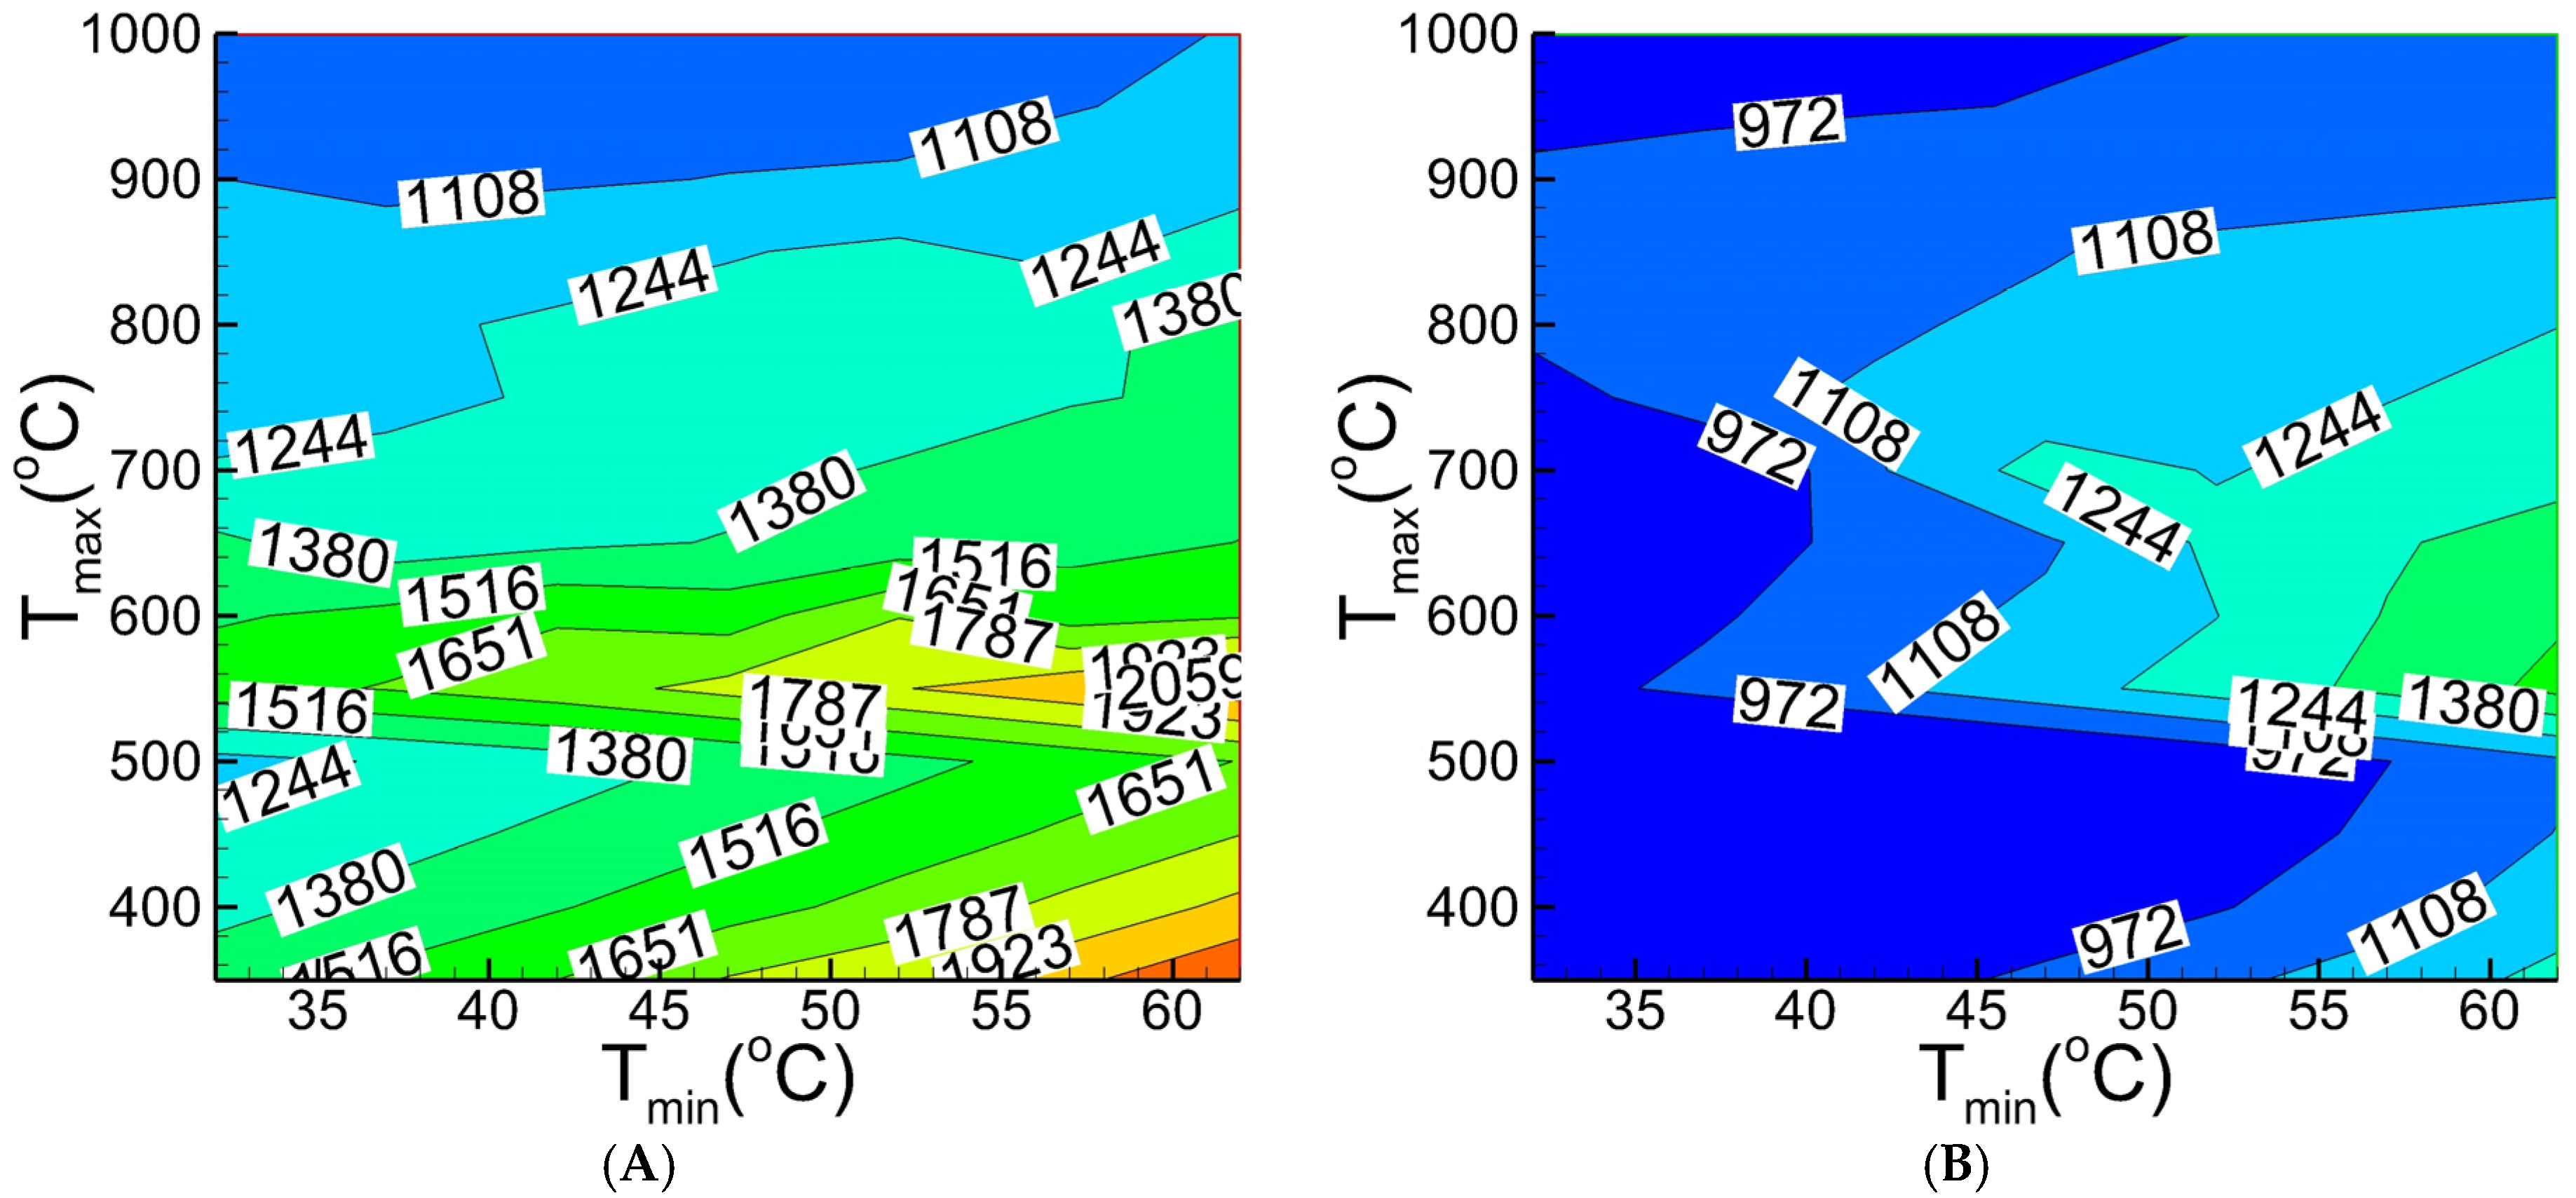
Thermal efficiency of a combined regenerative Brayton/ORC cycle is shown in
Figure 10A. At the maximum temperature of 1000 °C, minimum topping cycle temperature of 32 °C, and
Pmax of 30 MPa, the combined Brayton/ORC cycle has a thermal efficiency of 55%.
Figure 10B shows the
A value given in Equation (22), i.e., the improvement in thermal efficiency of the combined regenerative Brayton/ORC cycle with respect to the regenerative Brayton cycle. Since the cycle exhaust temperature of a regenerative Brayton cycle is quite high, the rejected heat used by a bottoming ORC increases thermal efficiency of the combined cycle by up to 15%-points (
A = 0.15). In addition, as shown in
Figure 10B, efficiency improvement increases as maximum temperature of the topping cycle is increased. This is because higher maximum temperature results in a higher exhaust temperature (
T6) (see
Figure 7), thus the topping cycle is providing higher temperature heat to the bottoming ORC cycle, which increases efficiency of the bottoming cycle.
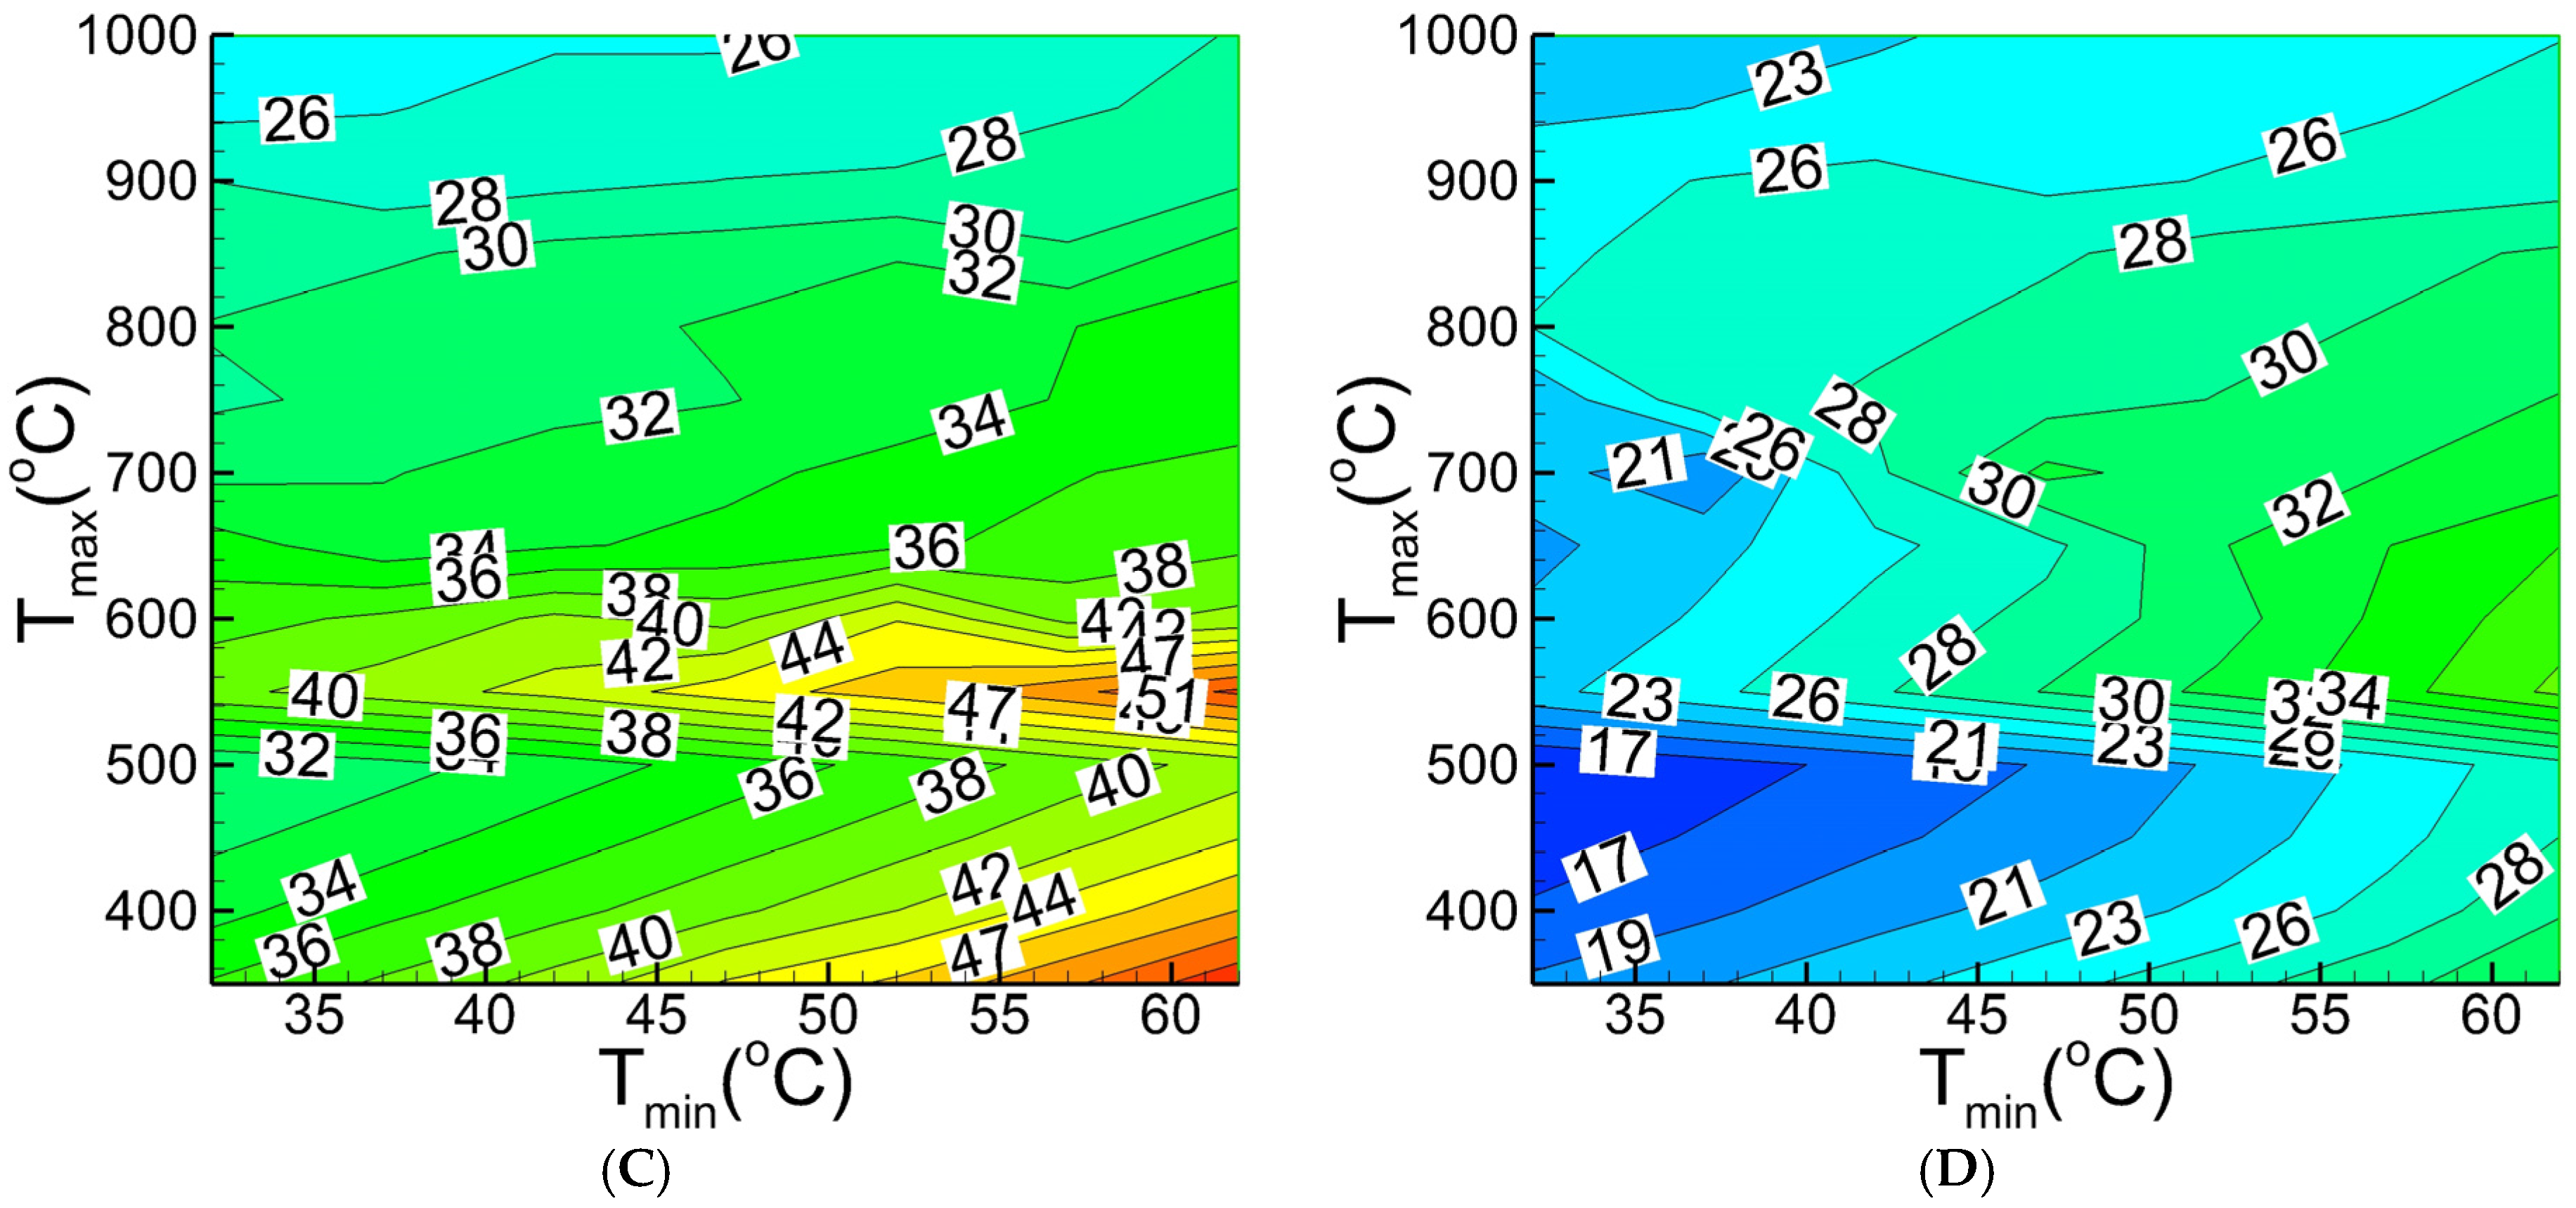
Figure 11A,B shows the net power output in MW generated by the combined regenerative Brayton/ORC cycle and the bottoming ORC, respectively. By the using waste heat from the topping cycle at
Tmax of 1000 °C, the power output of the bottoming ORC exceeds 13 MW (25% of the total power output). This is in contradiction with lines 428–429, which state that the constant power output of 100 MW was assumed for the topping cycle.
In addition, as shown in
Figure 11B, for the maximum topping cycle temperatures lower than 700 °C, the minimum temperature of the topping cycle has a significant effect on the power generated by the bottoming ORC. However, for maximum temperatures higher than 700 °C, the minimum topping cycle temperature does not have a significant effect on power output of the bottoming ORC. For example, at
Tmax = 700 °C, increasing the minimum temperature of the topping cycle from 32 °C to 62 °C results in a 500% increase of the power output of the ORC (i.e., from 2 to 10 MW). However, at
Tmax = 1000 °C, increasing the minimum temperature of the topping cycle results in less than 1% increase of the net power output of the bottoming ORC.
The results of the techno-economic analysis, i.e., the total capital investment,
CTCI, and LCOE for a combined Brayton/ORC cycle obtained over the range maximum and minimum cycle temperatures, and two maximum pressures (10 and 30 MPa), are presented in
Figure 12.
As
Figure 12 shows, the total capital investment and LCOE decrease as the maximum cycle pressure is increased. For example, at
Tmin = 32 °C,
Pmax = 10 MPa and
Tmax = 1000 °C, the total capital investment and LCOE of a combined Brayton/ORC cycle are 1000
$/kW
net and 25
$/MWh, respectively. For the same maximum and minimum temperatures and maximum pressure of 30 MPa, the values of
CTCI and LCOE are 940
$/kW
net and 24
$/MWh, i.e., 6 and 4 percent lower.
The effect of the maximum cycle temperature is more complex, since more expensive materials need to be used as temperature is increased, resulting in step change in cost. For example, a significant increase in total capital investment can be observed at Tmax = 500 °C, since for Tmax > 500 °C a more expensive stainless steel has to be used instead of carbon steel for all components of the regenerative Brayton cycle (RBC).
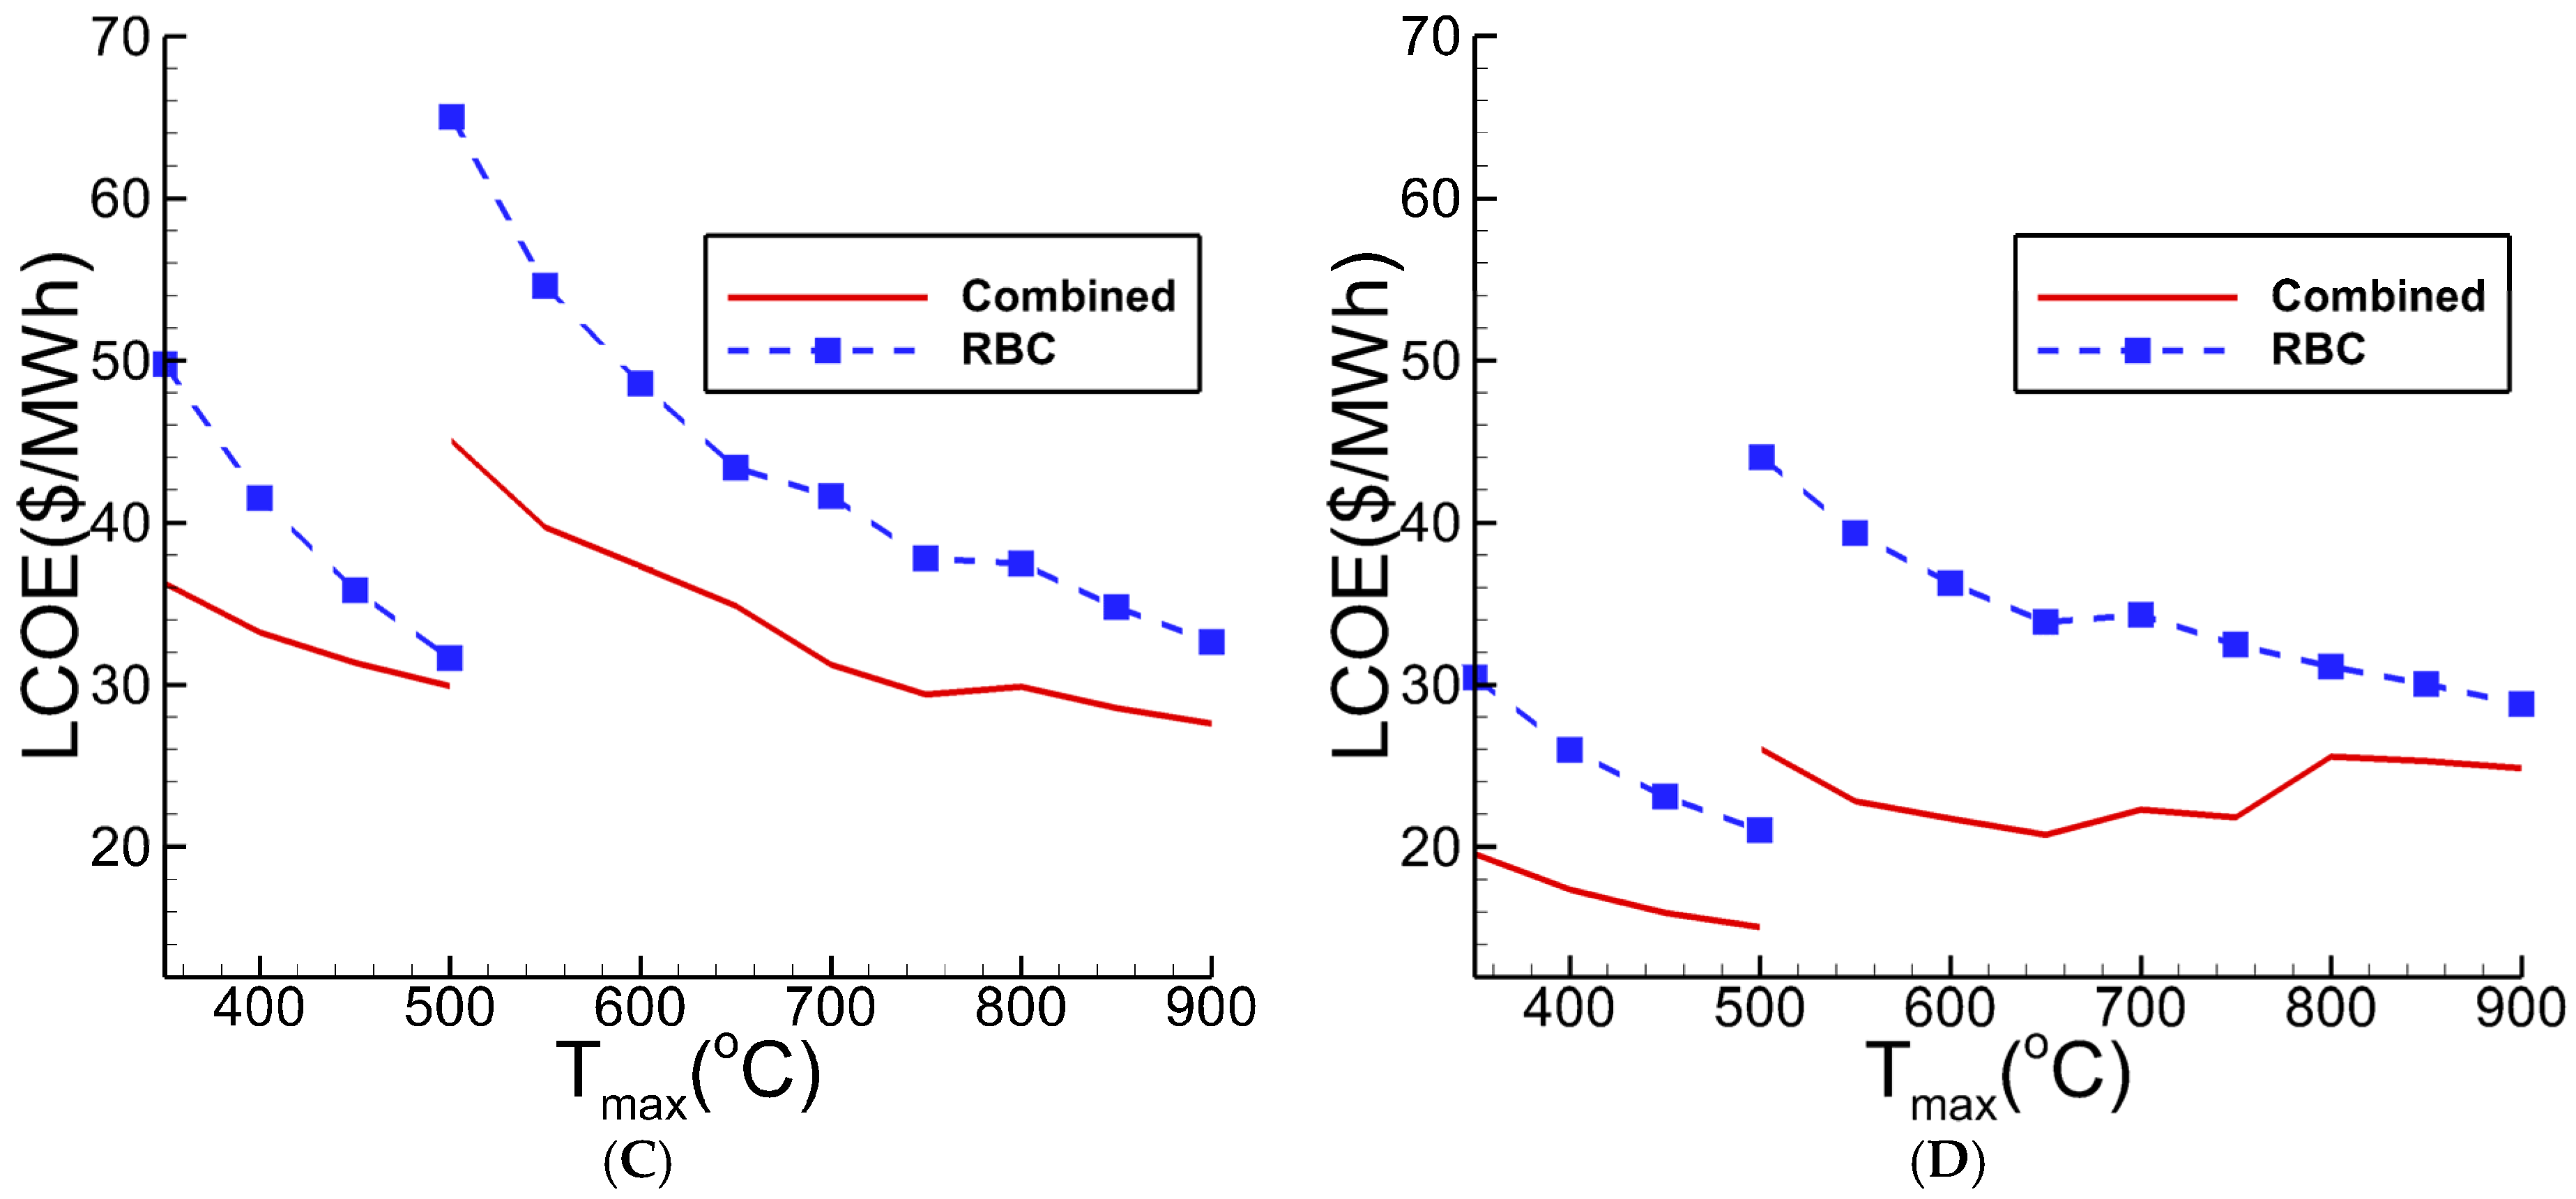
The total capital investment and LCOE of the CO
2 regenerative Brayton cycle (RBC) and combined Brayton/ORC cycle are compared in
Figure 13 over the range of
Tmax from 300 °C to 900 °C,
Pmax of 10 and 30 MPa, and
Tmin = 32 °C. As the results show, the combined Brayton/ORC cycle has a significantly lower total capital investment and LCOE, compared to the regenerative Brayton cycle. For example, at
Tmax = 550 °C and
Pmax = 30 MPa, LCOE of the combined Brayton/ORC cycle is 17
$/MWh (43%) lower compared to the RBC. As mentioned before, because of the material change, a significant increase in total capital investment and LCOE occurs at
Tmax = 500 °C.
4.4. Combined steam Rankine/ORC Cycle
Steam Rankine cycle is the most widely used thermodynamic cycle for power generation. As a heat engine, it rejects large amounts of low-temperature grade heat. Its efficiency ranges from about 32% (efficiencies are given on the higher heating value (HHV) basis) for the subcritical live steam conditions, to 45% for the advanced ultra-supercritical live steam conditions [
34]. Most (about 95%) of the exiting power generation fleet is subcritical, about 5% is supercritical, and only a small number of the units operate at ultra-supercritical live steam conditions and efficiency of about 40% [
34]. Commercial operation of the advanced ultra-supercritical units is expected within the next 10 years [
48].
The efficiency of the steam Rankine cycle could be improved by addition of a bottoming cycle. Due to the low temperature of the rejected heat, the ORC is a good choice.
An analysis of a combined steam Rankine/ORC cycle was performed to determine the increase in power output that could be achieved by adding a bottoming ORC to the utility-scale (600 MW) steam Rankine cycle. The analysis included the effect of ambient conditions (heat sink temperature) on the power output of the bottoming ORC.
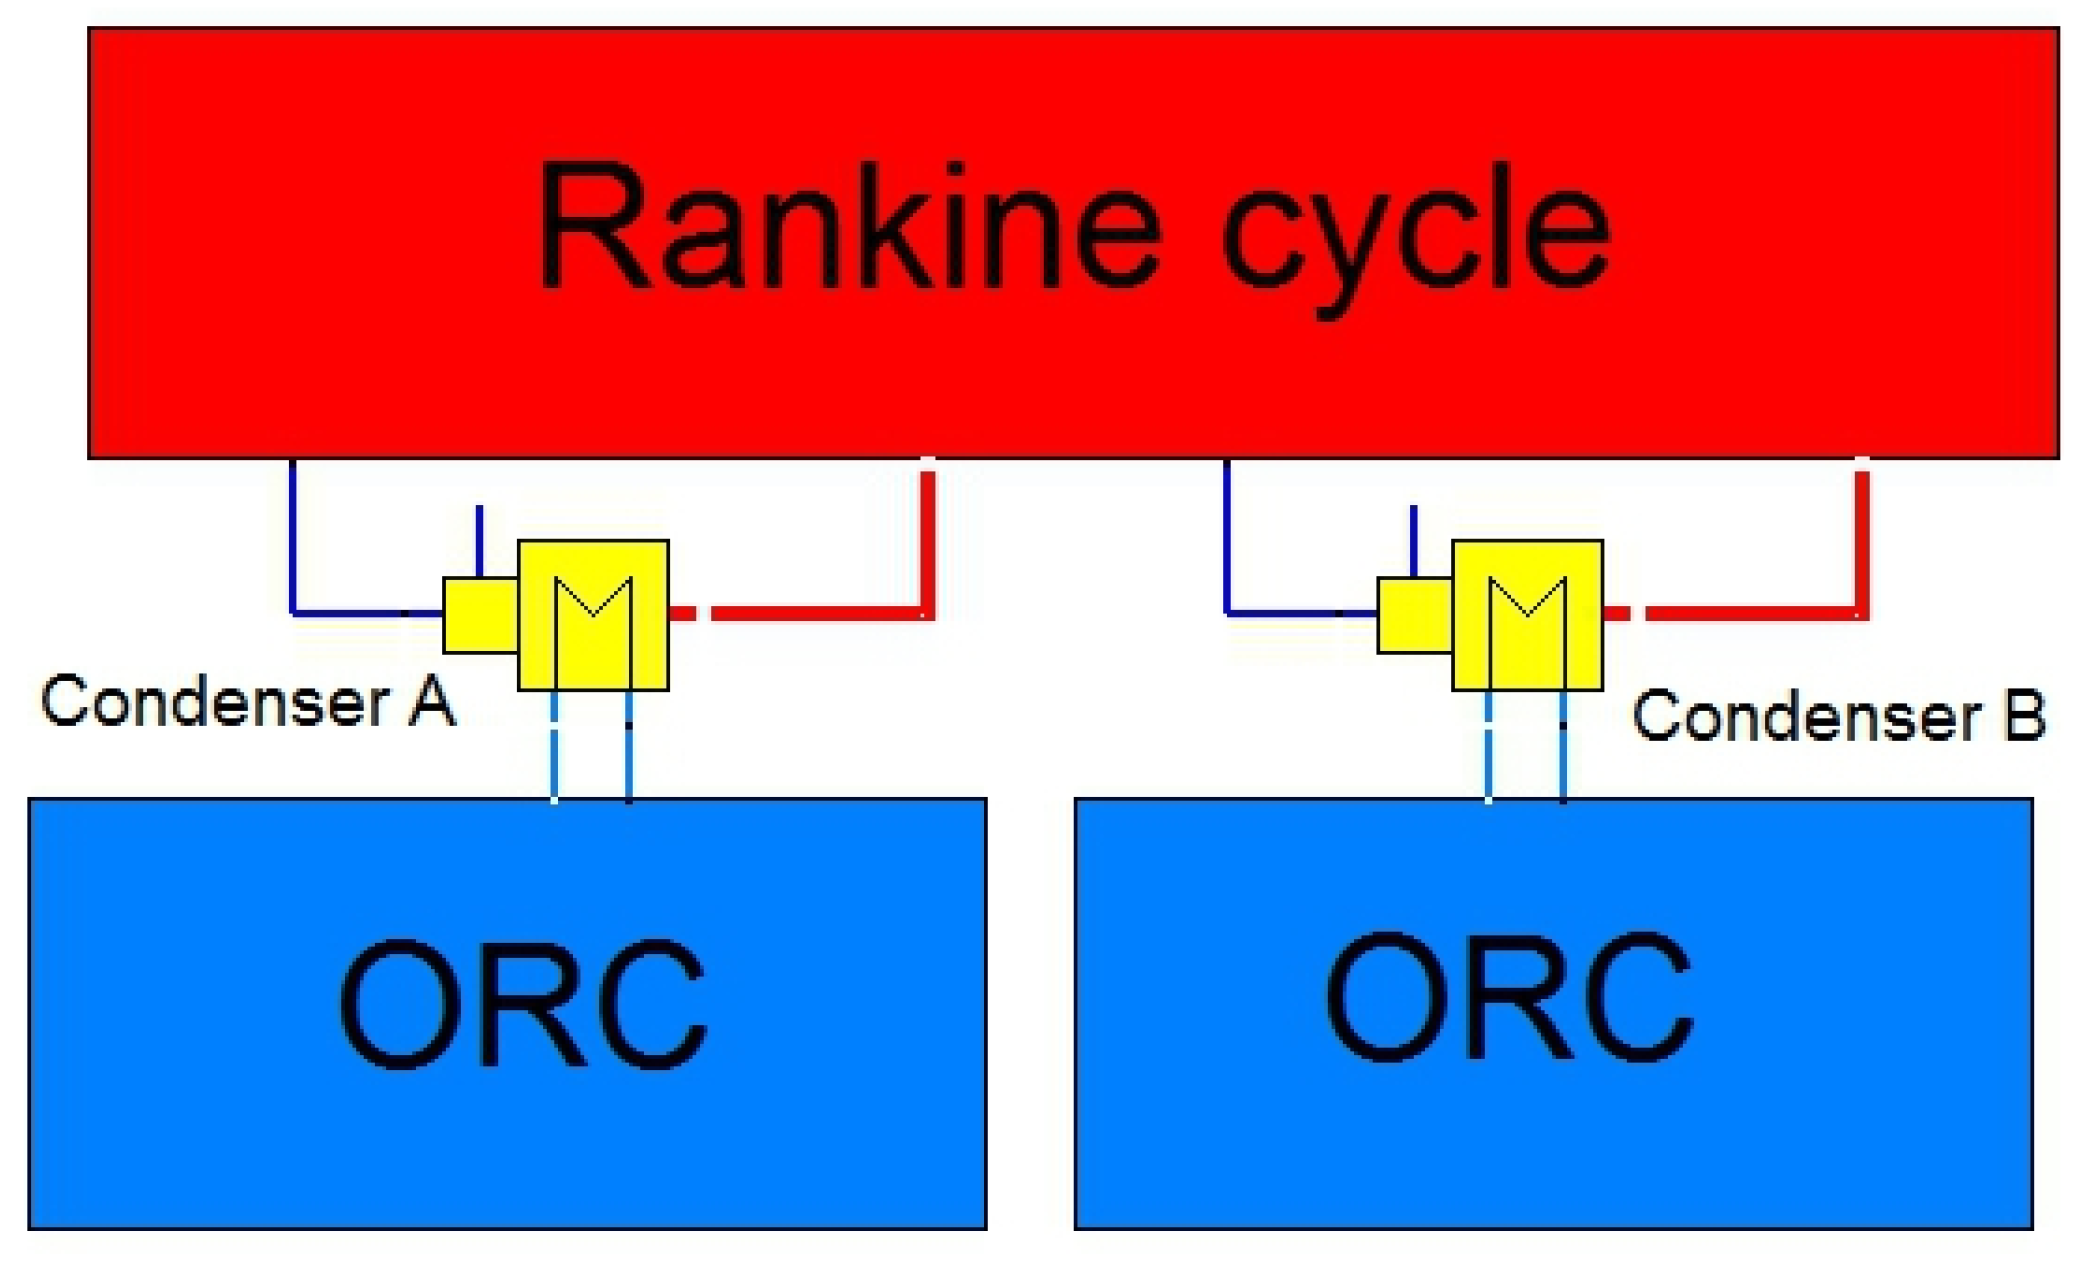
The analyzed utility-scale steam Rankine cycle employs a steam turbine with two double low-pressure (LP) exhausts. The steam from the LP exhausts is condensed in two steam condensers (A and B) placed in a serial arrangement,
Figure 15. The cold cooling water from the cooling tower (CT) flows through condenser A first, then through condenser B. Since the temperature of the cooling water at the entrance to condenser B is higher compared to condenser A, the pressure (and saturation temperature) in condenser B is higher compared to condenser A (
Table 11). The hot cooling water from condenser B is circulated back to the CT.
For the purpose of the analysis, it was assumed that the heat rejected in the steam condensers (latent heat of condensation) can be utilized as the heat input to the ORC. Two ORCs were employed, one for the each condenser. It was also assumed that addition of the bottoming ORC does not affect performance of the existing steam Rankine cycle because the temperature (and corresponding saturation pressure) at which heat is rejected in the condensers A and B remained the same.
Although adding a bottoming ORC to the existing steam Rankine cycle would eliminate the difference in saturation temperature and pressure between condensers A and B, the analysis was performed for conditions corresponding to the condenser A and B operating conditions to illustrate the effect of the heat source temperature. Properties of the ORC heat source used in the analysis are summarized in
Table 11. In addition, the ORC analysis was performed over a range of minimum temperatures and for twelve working fluids listed in
Table 1 to determine the net power output of each of the two ORCs associated with condensers (Cases) A and B. The cycle parameters used in the analysis are summarized in
Table 12.
Since the condenser in the topping steam Rankine cycle would be used as the evaporator in the bottoming ORC, the steam exhausted by the LP turbine exhausts would be condensed in the ORC evaporator providing heat input to the bottoming ORC.
Figure 16 shows the schematic of the combined steam Rankine/ORC cycle.
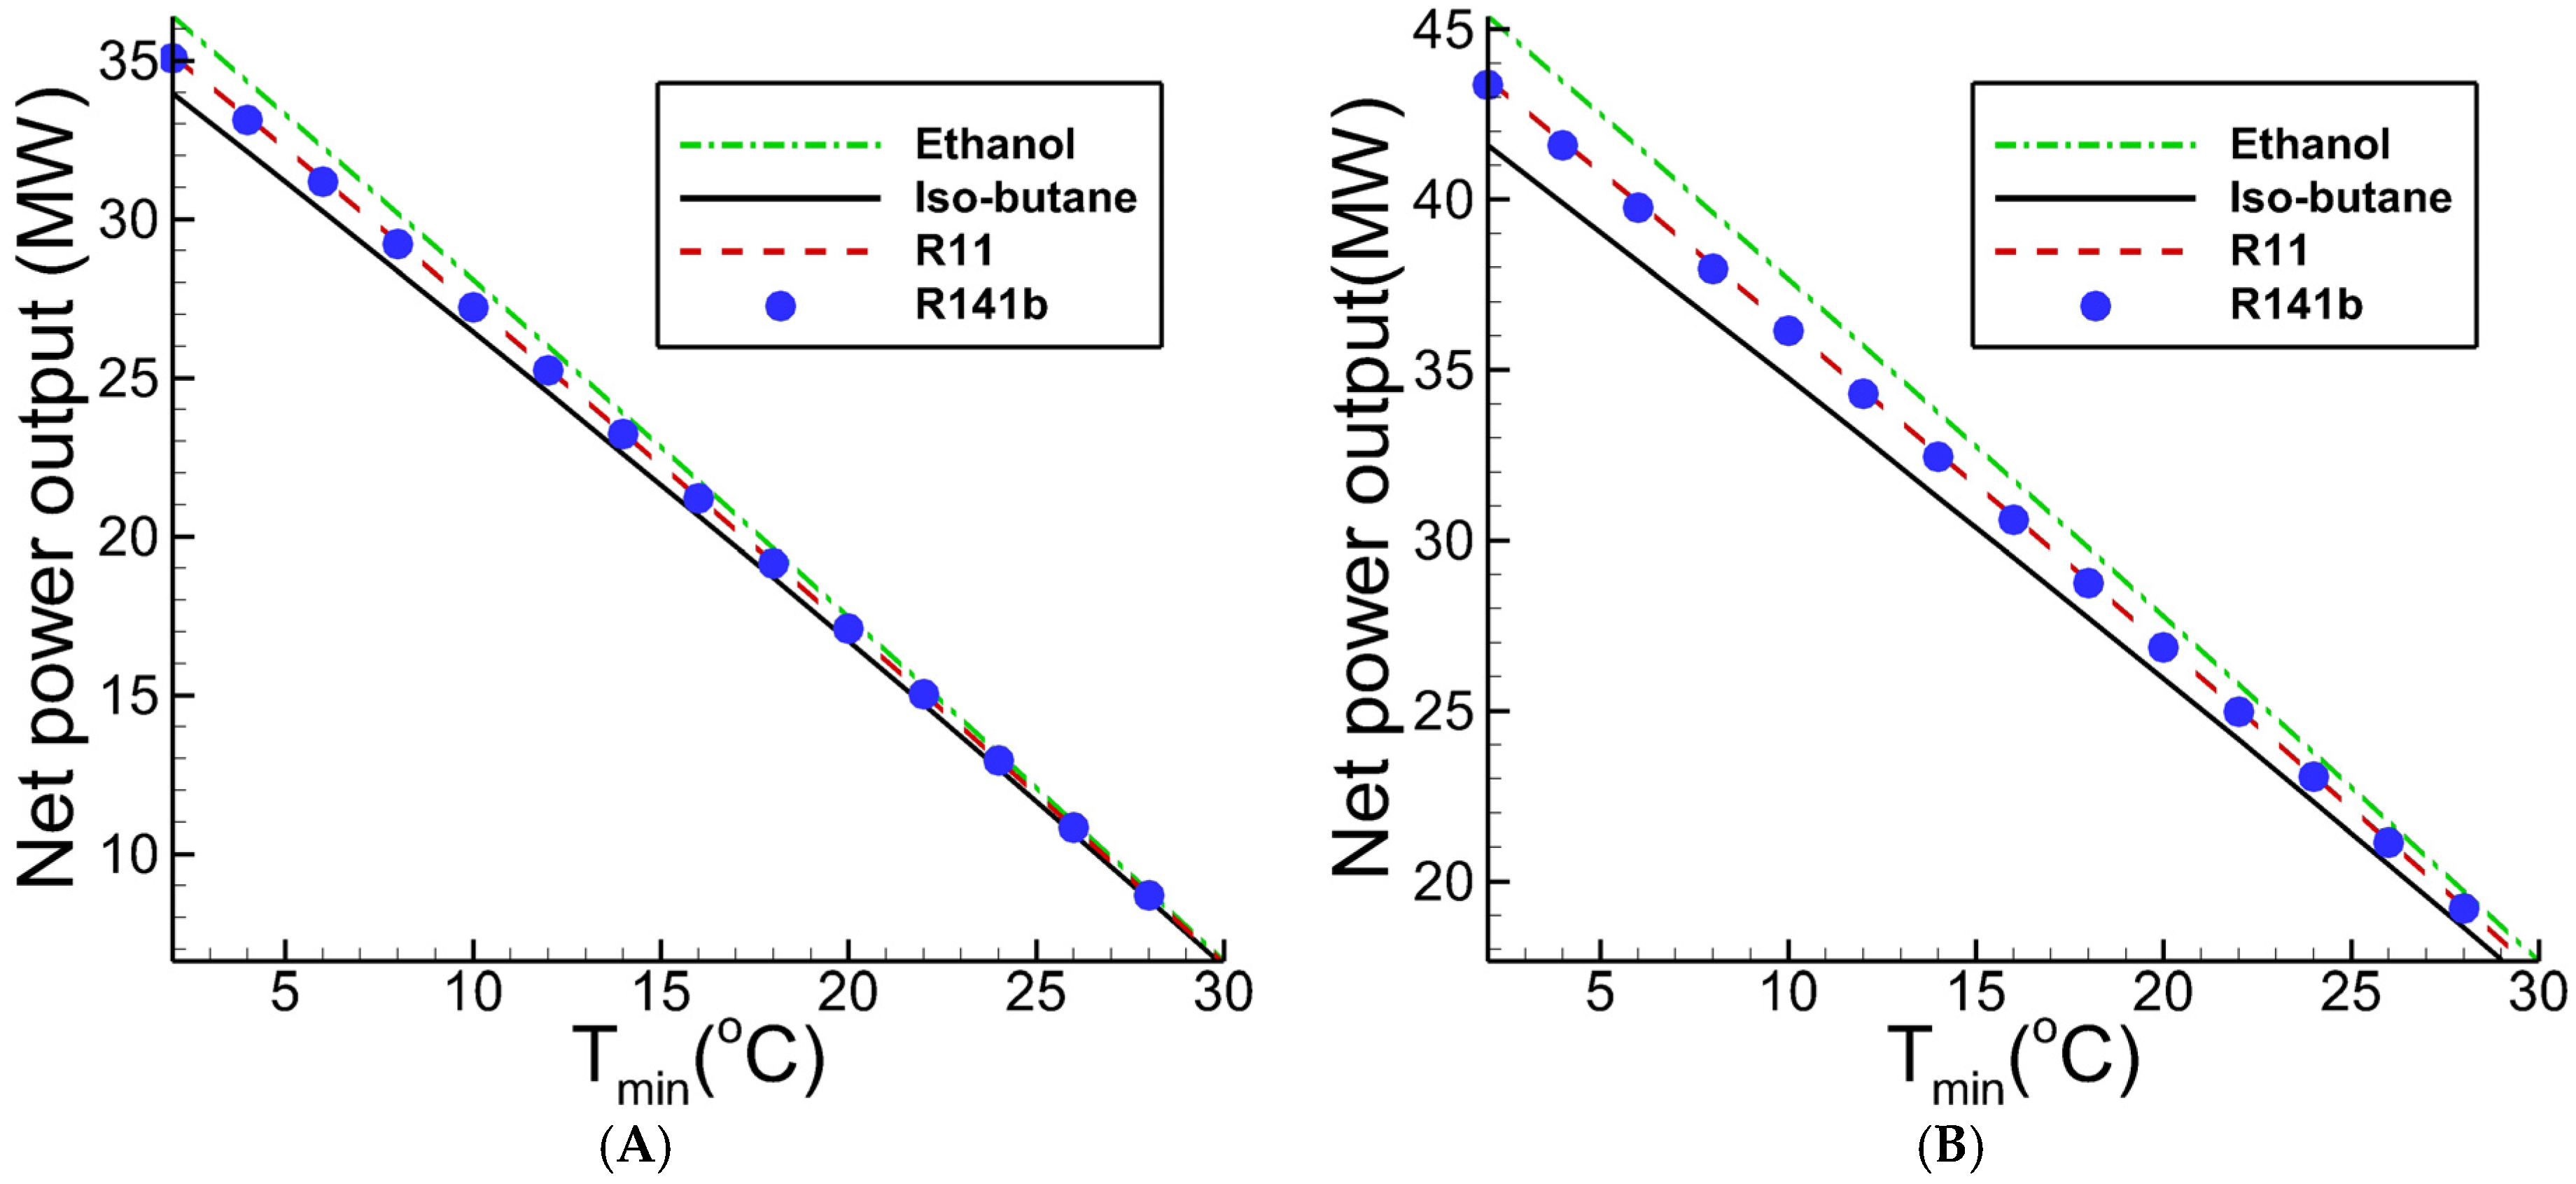
Depending on the geographical location of the steam Rankine power plant, the minimum ORC temperature would follow seasonal variations. A 2 °C to 30 °C range, corresponding to the summer and winter conditions, respectively, was assumed in the analysis. The effect of the minimum temperature and working fluid on the net power output of the bottoming ORC is presented in
Figure 17.
As the results presented in
Figure 17 show, ethanol produces the highest power output for both cases. For Case B (heat source temperature of 49.73 °C) and minimum temperature on 2 °C, one bottoming ORC would provide additional 45 MW power output (90 MW total, or 15% of the current plant output). At the same minimum temperature, the additional power output for Case A would be 36 MW (72 MW total).
As the minimum ORC temperature increases, the power output of the ORC decreases linearly; at the minimum ORC temperature of 30 °C, the ORC power output would be 17.5 MW and 6.5 MW for Cases A and B, respectively. The lower power output is due to the smaller difference between the cycle maximum and minimum temperatures (19.73 °C and 8.38 °C) and, thus, diminishing efficiency of the ORC.
The difference in power output between R11 and R141b is negligible. Since, using R11 and ethanol has flammability and ODP issues, R141b was selected as the best working fluid for the bottoming ORC. With R141b, the maximum additional power output generated by the ORC is 35 and 44 MW for Cases A and B, respectively.
As shown in
Figure 17, during the winter when the minimum temperature is low (around 2 °C), additional power output of 70 to 88 MW can be produced by the bottoming ORC for Cases A and B, respectively. The large difference between the winter (2 °C) and summer (30 °C) temperatures has a significant effect on the ORC power output.
Although adding the bottoming ORC to the steam Rankine cycle can generate more power (i.e., the “fuel free” megawatts), it requires additional the capital investment. The capital investment for the ORC and temperature ranges used in this study is around 3000 $/kWnet. A more detailed analysis is needed to determine LCOE of the Rankine/ORC cycle.


