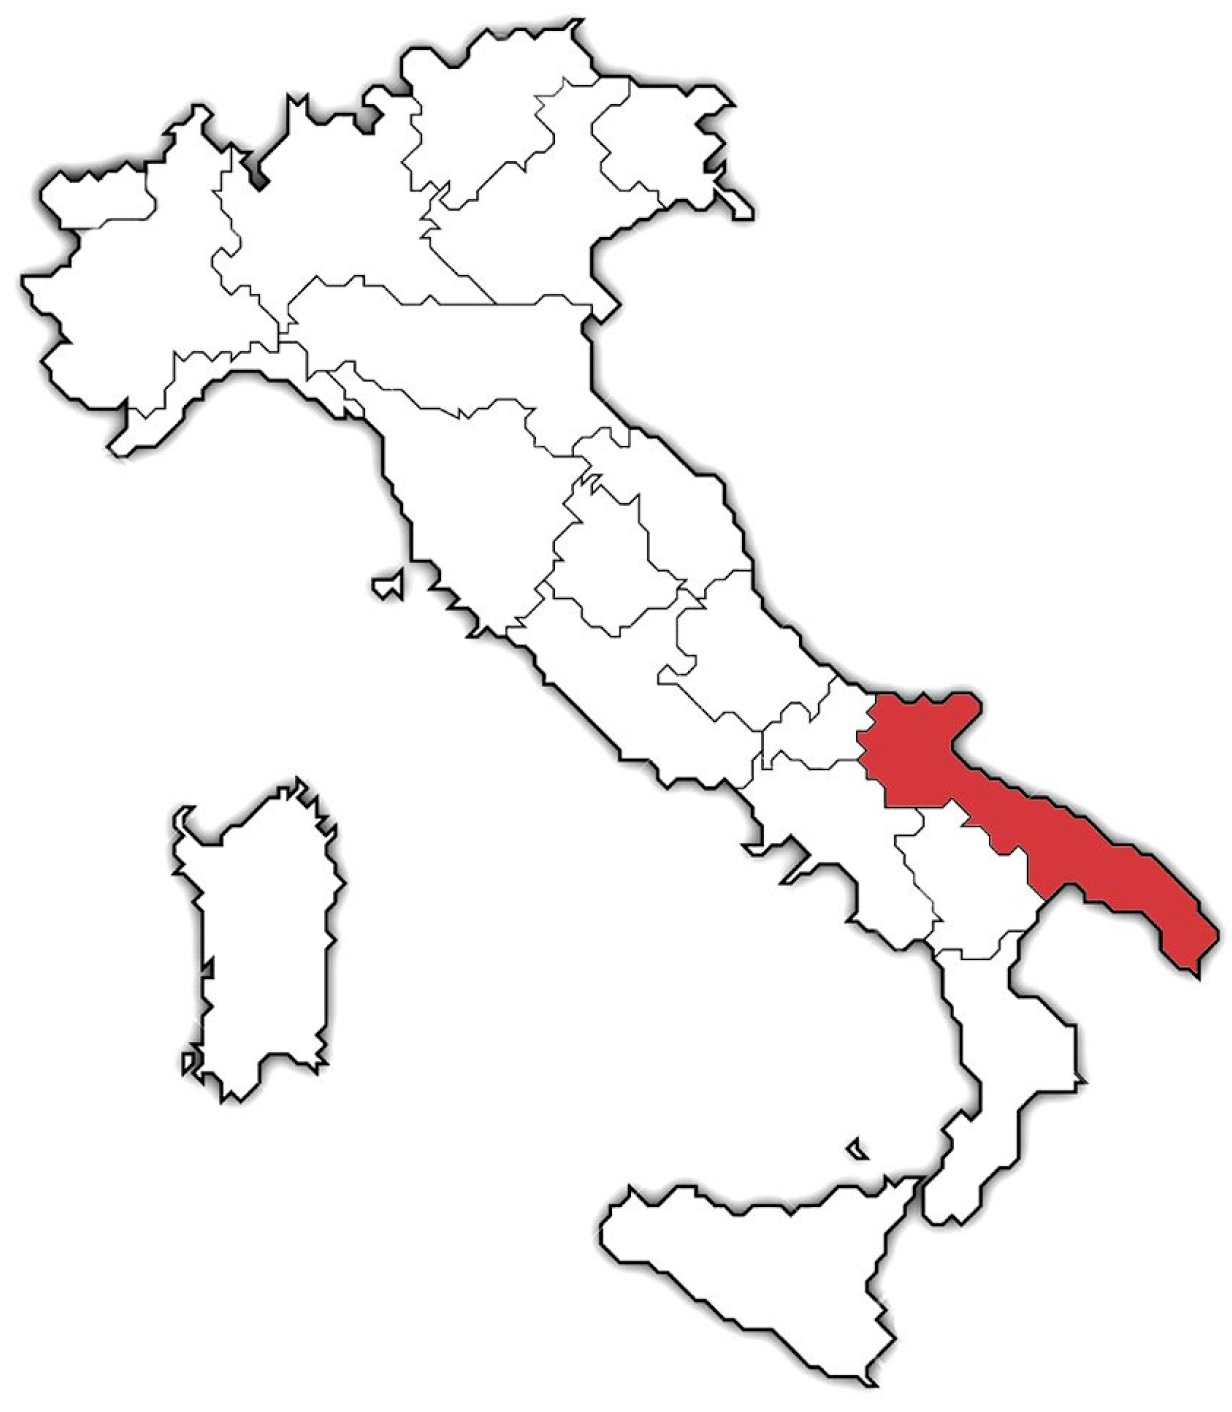
2.1. Context of Study
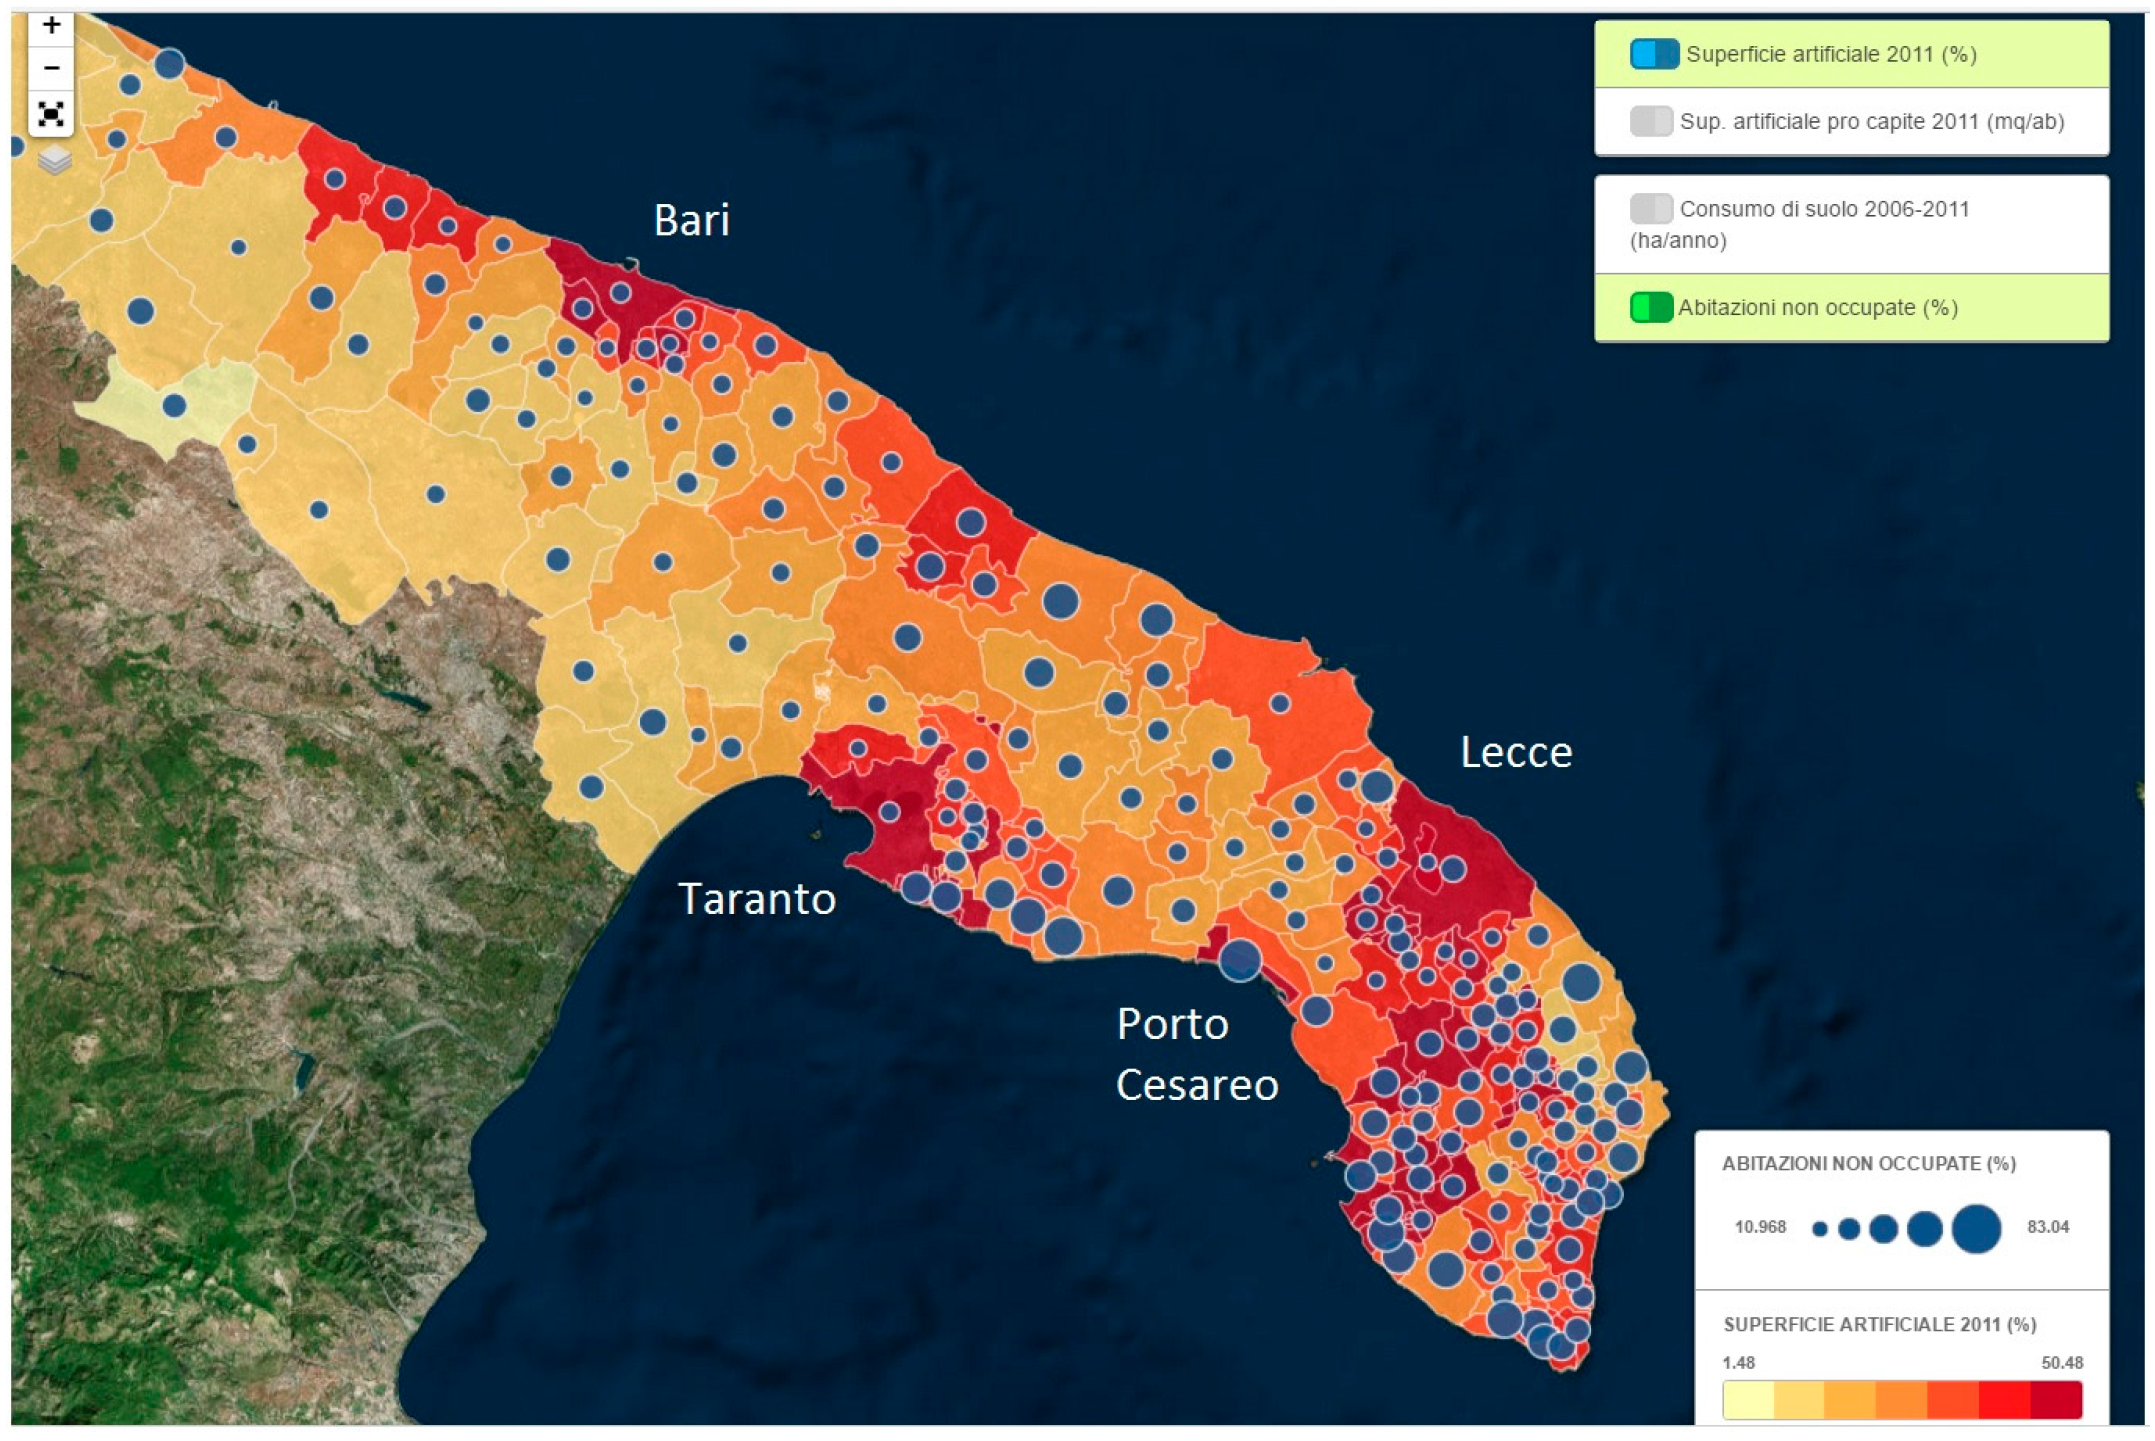
The main area of our studies is the Region of Apulia (
Figure 1) in the southern part of Italy.
In the past, the main cause of urban expansion could have been identified with population growth. In the present, expansion is not easy to explain by direct connection with evident phenomena, such as demographic trends, at least for advanced western economies. In Italy and generally in Southern Europe, the new increasing trend is due to migration fluxes that do not always express a demand for new settlements [
25]. Furthermore, housing stock is partially unutilized, or utilized only part-time. The quiescent housing stock denotes an inefficient balance between land take and environmental losses. The ineffective use of the existing offer of buildings is due to simple dynamics in the real estate market, where promoters look to new constructions that represent a more charitable occasion for a positive cost-benefit balance with respect to the rehabilitation of the existing stock. It still more convenient to buy new soil, than a built plot. The cost-benefit balance increases when moving towards urban perimeters where new plans involve an increase of land prices from some units of euros, to some tens or hundreds of euros per square meter.
The artificial surface at the regional scale in Apulia is less than 9%. We can look at two indicators describing the waste of soil and of built stock and, even better, the variation: the percentage of unoccupied housing stock as a whole, and the quantity of artificial soil per inhabitant. Unoccupied house stock are usually relevant near the coastline and in the interior mountain areas. The first is connected to the seasonal residential activity on the coast and in that part of the countryside that maintains farmlands of great landscape value. The second aspect is related, more generally, to a set of urban policies that favor the expansion of the external urban fringe.
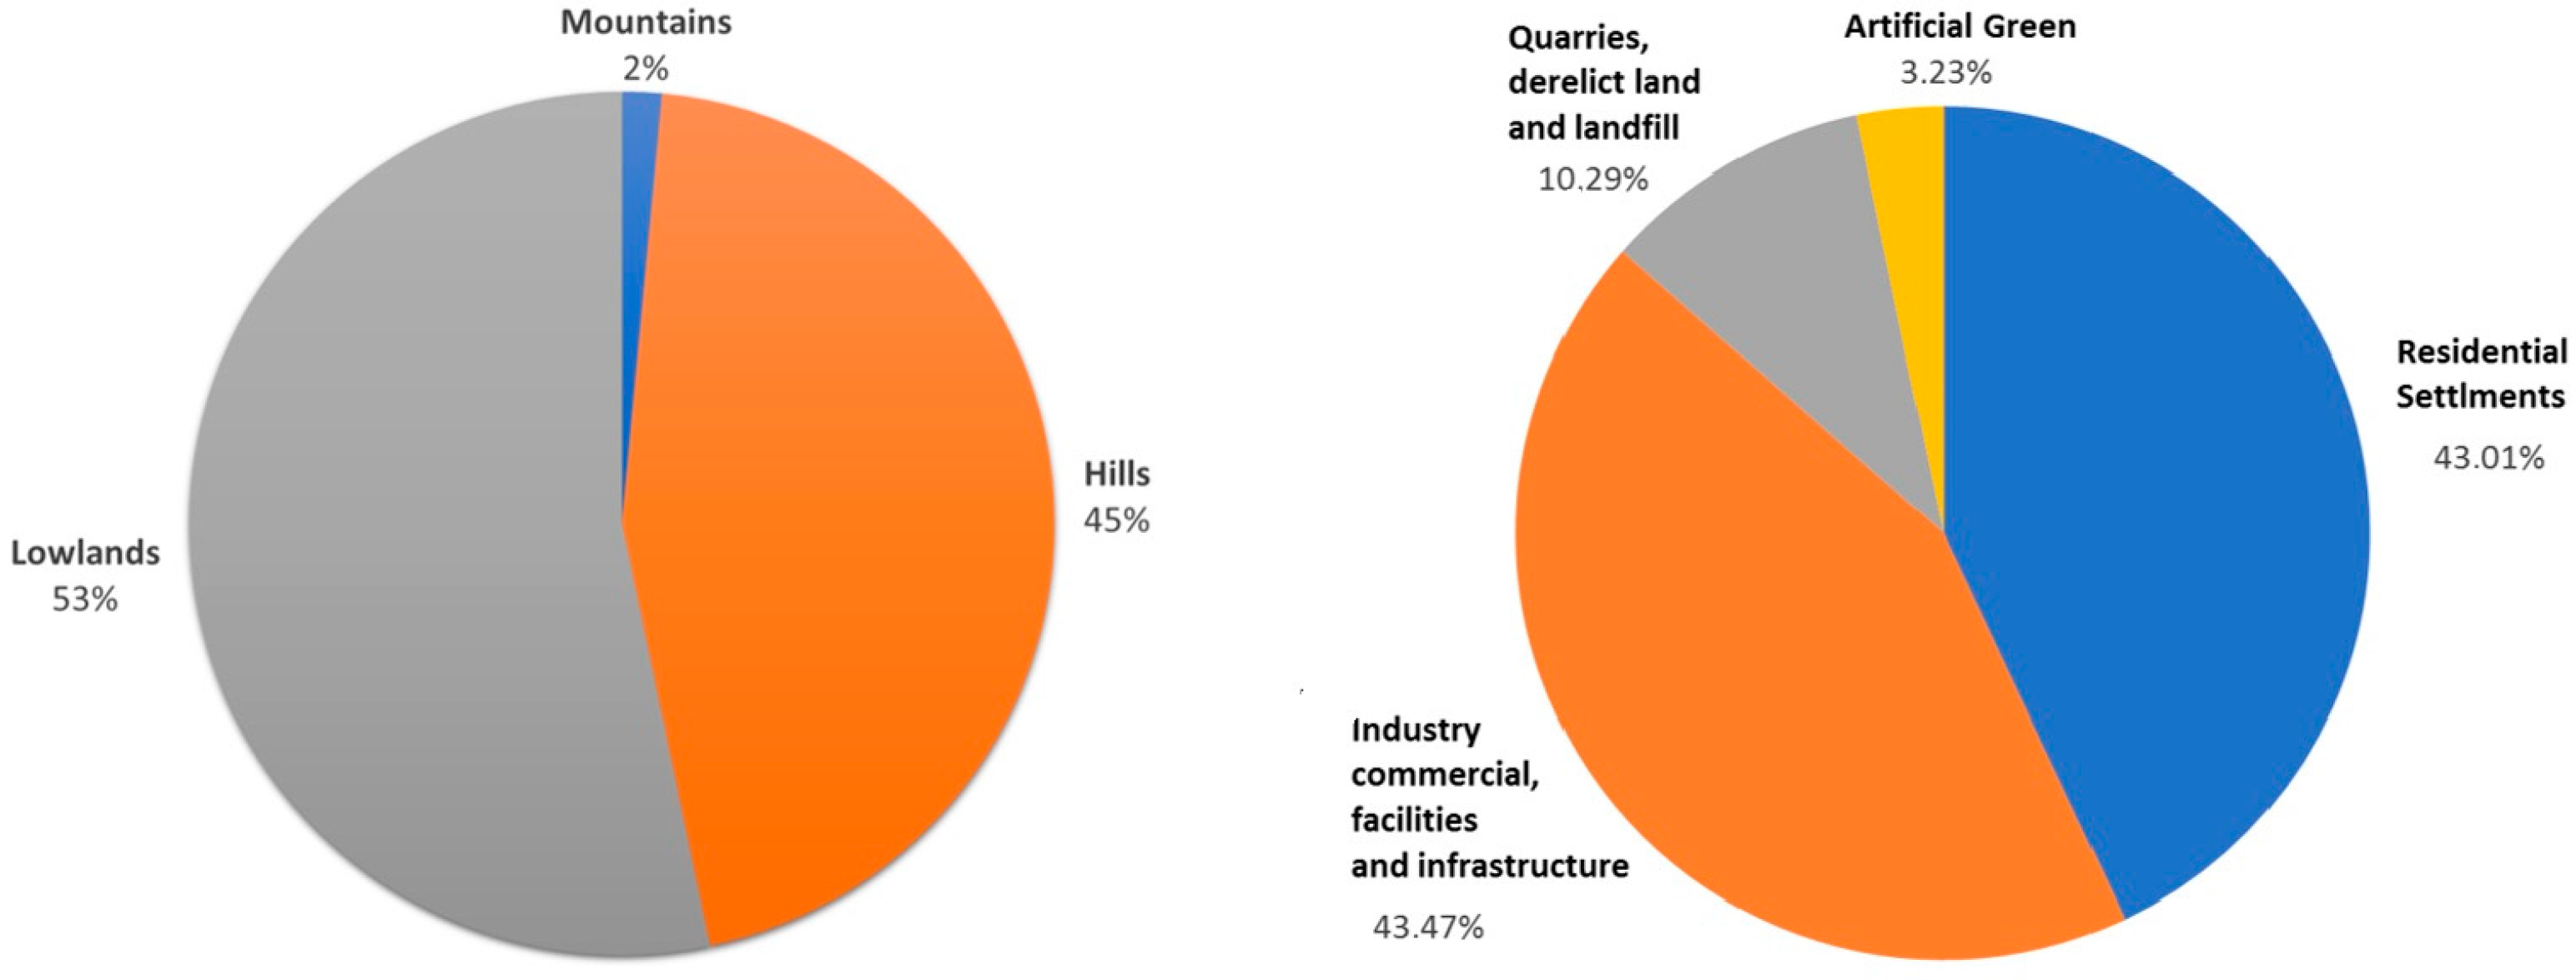
Apulia has a great number of farms among Italian regions: its regional gross product coming from agriculture is relevant, and it has the highest olive and oil production. The oil product of Apulia represents, more or less, one quarter of the national production (370,000 hectares of olive groves, with a production of 800,000 tons in 2014). Grape production, as well, is relevant in the national panorama: the total product is about 1,833,600 tons (in 2011) and occupies 131,077 hectares. The farmland retains most of the landscape value. The regional territory is extended for more than 1,330,000 hectares, with only 1.5% being occupied by mountain, 43% hillside, and 55% flat land (
Figure 2). Apulia was the first Italian region to approve the Regional Landscape Plan (RLP) conforming to the new Italian law on the preservation of cultural heritage (Act no. 47/2004) where farmlands having historical or landscape value have been preserved since 2015.
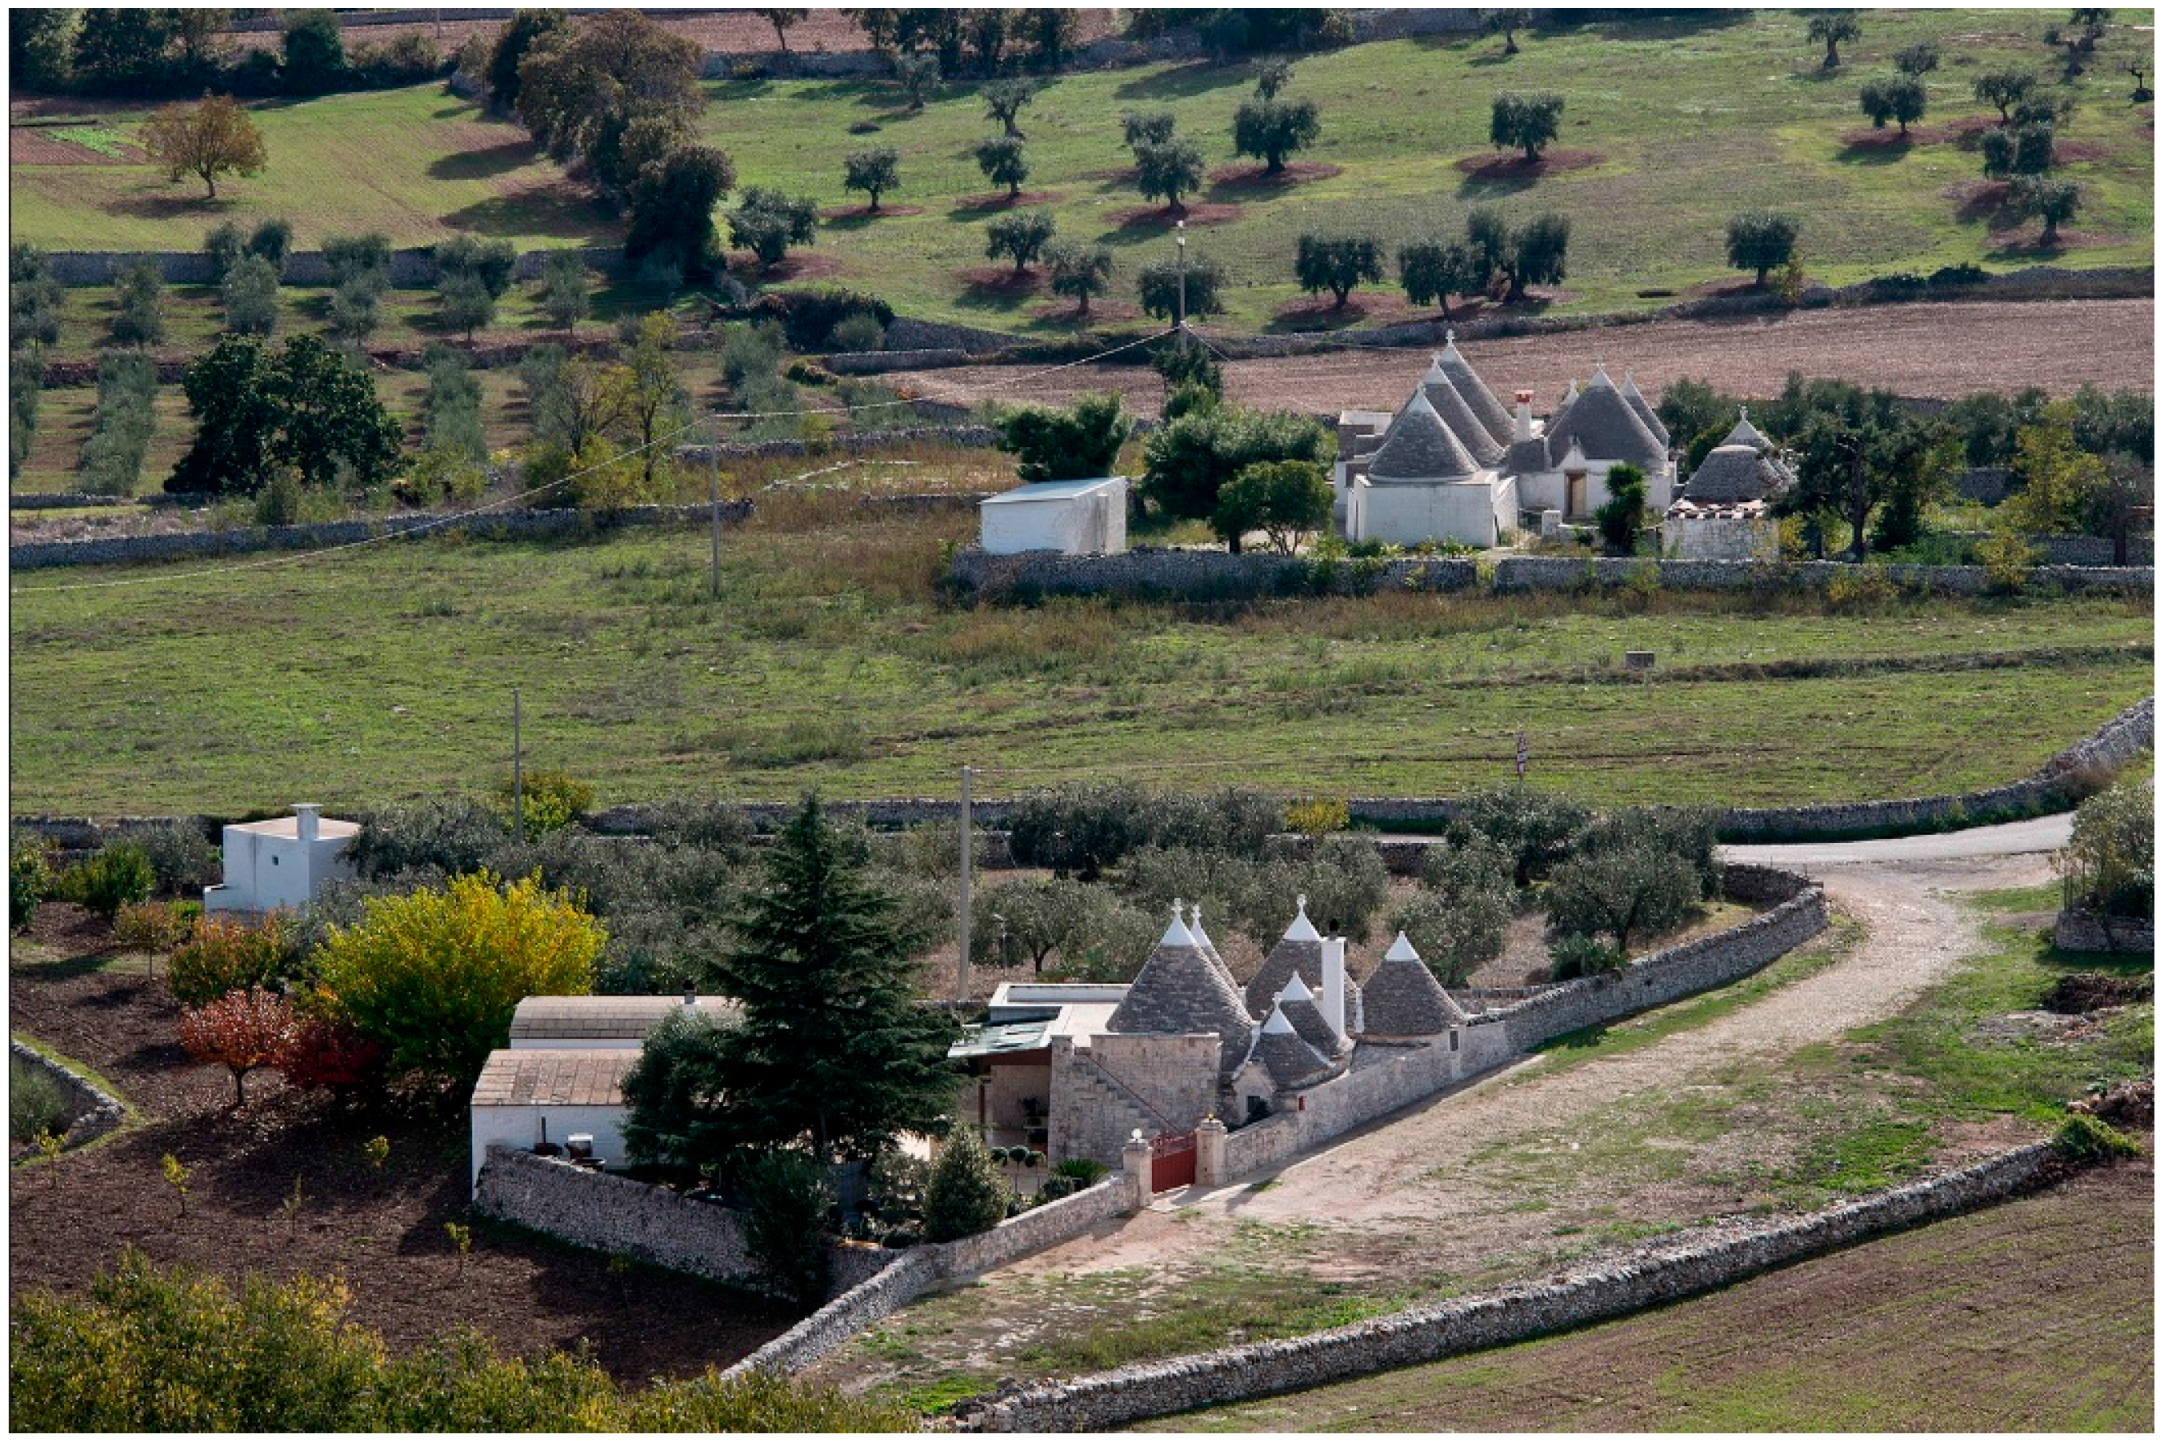
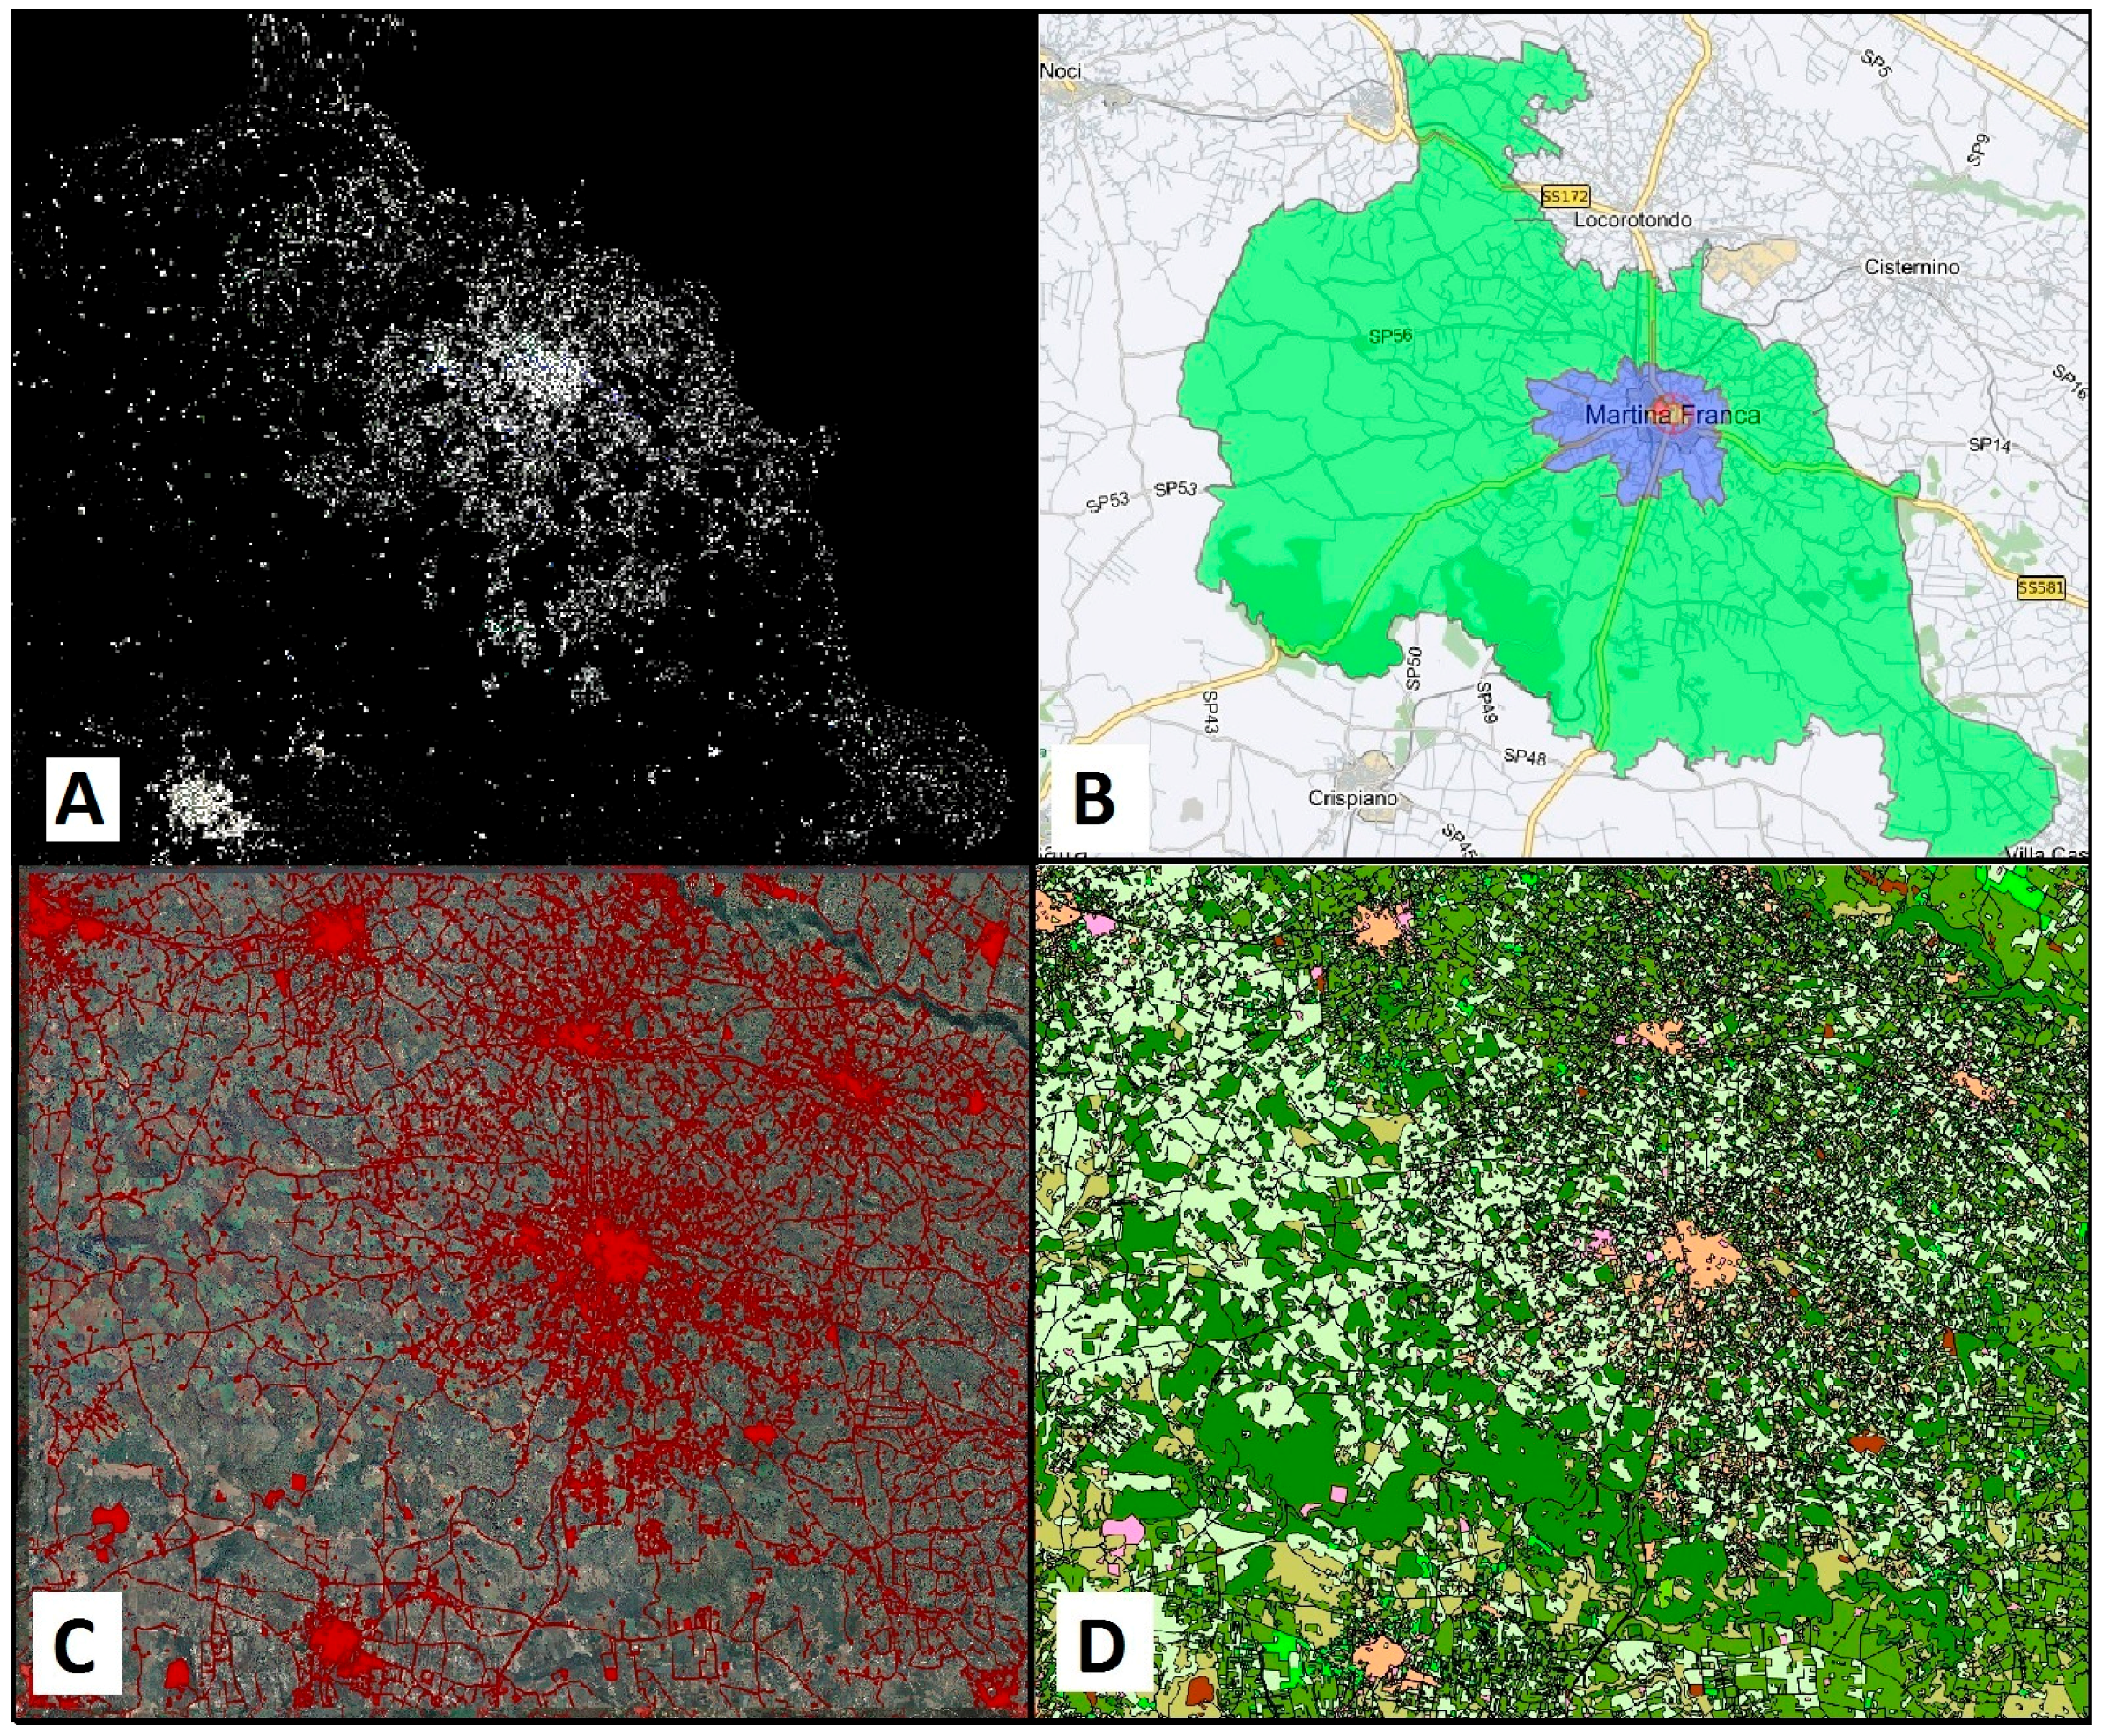
In the countryside, the flat farmlands of “Capitanata” in the County of Foggia, the Murgia Highland, the Itrian Valley, and the Ionian Ravines show one kind of landscape where farmlands, urban settlements, and natural resources still maintain a balance. The rural landscape is made interesting by the appearance of typical constructions made of limestone. The Itrian Valley, in a special way, is one of the most important examples of these landscapes. Inside the Itrian Valley, is “settled farmland” (as it is called in the RLP), i.e., in the countryside, rural settlements are at the lowest density level, and agro-industry activities are well balanced with the traditional rural ones. Such types of farmland occupy a strainer-area between the countryside and the city. The peculiarity of settled farmland in the Itrian Valley is represented by the existence of special stone-made constructions named “Trulli”. Trulli consist of a circular plant and a conic roof, and are built by hand-placed limestone, sometimes linked by plaster and tufa-made mortar. Due to the peculiarity of the landscape, the countryside of the Itrian Valley is suffering because of urban sprawl, which is due to the wish of its own inhabitants to spend the summer in the rural environments. The Itrian Valley is in the central part of the Apulian region, and its greater urban center, Martina Franca, is located in the countryside in a triangle surrounded by the cities of Taranto, Bari, and Brindisi.
At the same time, Apulia contains the largest coastline among Italian regions (about 784 km, 12% of the whole Italian coastline). The most populated settlements are on the coastline, alternating with rocky coast and sandy beach. Apulia, since it contains the most relevant coast in Italy, sees quite a relevant coastal invasion. The economy of sea fruition in Apulia has been characterized since the end of the 1970s, and the model of the single-family seasonal household was spread along the Apulian coast. It corresponds to the easiest way to build—with low-technological characters, and costs—touristic lodgments. Many pieces of the coast retain a high value of landscape and biodiversity, but are being spoiled by the economic demand for building new touristic settlements. The coastal municipalities cover about 30% of the extents of Apulia. The artificialization of soil between 2006 and 2011 has been near 35% of the whole region. Sixty-five percent of the coast is considered in the Regional Landscape Plan as a major piece of the “Core Areas for the Ecological Network for Biodiversity” and, therefore, is subject to primary protection. Despite this, in Apulia, a wide demand of coastal seasonal settlements concern land use and urban plans. The phenomenon has been a growing trend over the last decades due to the increase in the tourism flows. In Apulia, Salento is the most emblematic example [
24,
26]. According to the National Institute of Statistics (ISTAT), in 2014, approximately four million tourists showed some daily presence in Salento [
27]. The Salento coast represents the tourist area of major interest with predominantly receptive systems composed of hotels, residences, guest houses, and bed and breakfasts. Salento is the location where we discover some of the highest proportions of land consumption due, mainly, to unauthorized housing.
2.2. Institutional Background
An important role in the evolution of soil take in Apulia (and all over Italy) is due to the regulations and laws that allow a fast increase of artificial soil, in favor of new urban expansion, based on formal acknowledgements between territorial institutions (state, region, and municipalities, depending on the case), despite the existing environment-concerned local planning regulations. Since the beginning of the 1970s, the Italian government has produced new institutional tools, aiming at ensuring the offer of soil for new industrial activities, in order to locate increasing labor forces or for new residential settlements in favor of the demand of popular housing. There was a period of migration towards northern cities and, generally, from small towns to larger metropolitan areas. The exploitation of manufacturing activities was the basis of the mainframe of new town planning policies, and workers’ neighbors were created. The main answer to the need for soil was the “Law for Housing” no. 865 of 1971. The “Law for Housing” increased the possibility of expropriating soils for new settlements, independently from the indication of general urban master plans. In the planning system, two new instruments were introduced: the plans for “social housing” (EPSH) and for “productive settlements” (EPPS). A peculiar aspect of EPSH and EPPS is the character of “need and urgency”, which acknowledges some actions that are not coherent with the local planning regulations, as the distribution of land use of artificial soil shows (
Figure 3). Firstly, the municipalities can change their plan provision by authorizing a new land-use for productive settlements and social housing in countryside landscapes “in absence of immediately further available soil”: in such cases, even the RLP has limited possibility to stop the expansion. Secondly, when public property is not available, the municipalities can expropriate private land with a quick procedure. The main consequence of this is the expropriation of soil for farmland (with a small property value) that becomes industrial or residential (with a high property value). This formal land-use change makes the land value (in €/m
2) increase by a minimum of 10 times and by a maximum of 100 times.
A second instrument is the “Program Agreement” (PA) among regional and local institutions, introduced by Law no. 142/1990. The “Program Agreement” aims to instantly authorize the so-called “Activities of Public Interest”. “Public Interest” can regard social facilities (hospitals, universities, power stations, roads, commercial harbors, pipelines, waste disposal, etc.), or private economic activities that are capable of increasing the offer of jobs in the so-called strategic sectors (e.g., tourist villages or harbors, golf courses). Many manufacturing activities in the countryside, touristic settlements and facilities on the coast, or popular quarters where farmland existed, were born, and still are, are springing up, thanks to these norms.
2.3. Data and Surveys
As stated in the introduction, most of the data have been elaborated by the MITO Lab at the Polytechnic University of Bari. Readable data for the Apulian regional territory in
Table 2 have been calculated for each one of the 258 municipalities and will be published with a joint effort of the MITO Lab with the Centre of Research on Land Take (CRCS), managed by the National Institute of Urbanism (INU) and the Polytechnic University of Milan [
28]. Data, and the indicators managed inside the “observatory for soil saving” of the MITO surveys for different aspects of “land consumption” and “soil take”, aim to find the causes, and to consider the tools for reducing the phenomena. If we consider the different reports and studies on the matter, it shows that the concept and the measure of soil take is not defined uniquely in the literature. When using the term “land consumption” it is always necessary to specify what kind of changes are being referred to, moving always in the context of changes that determine the irreversible loss of all or some of the ecological functions of soils [
16].
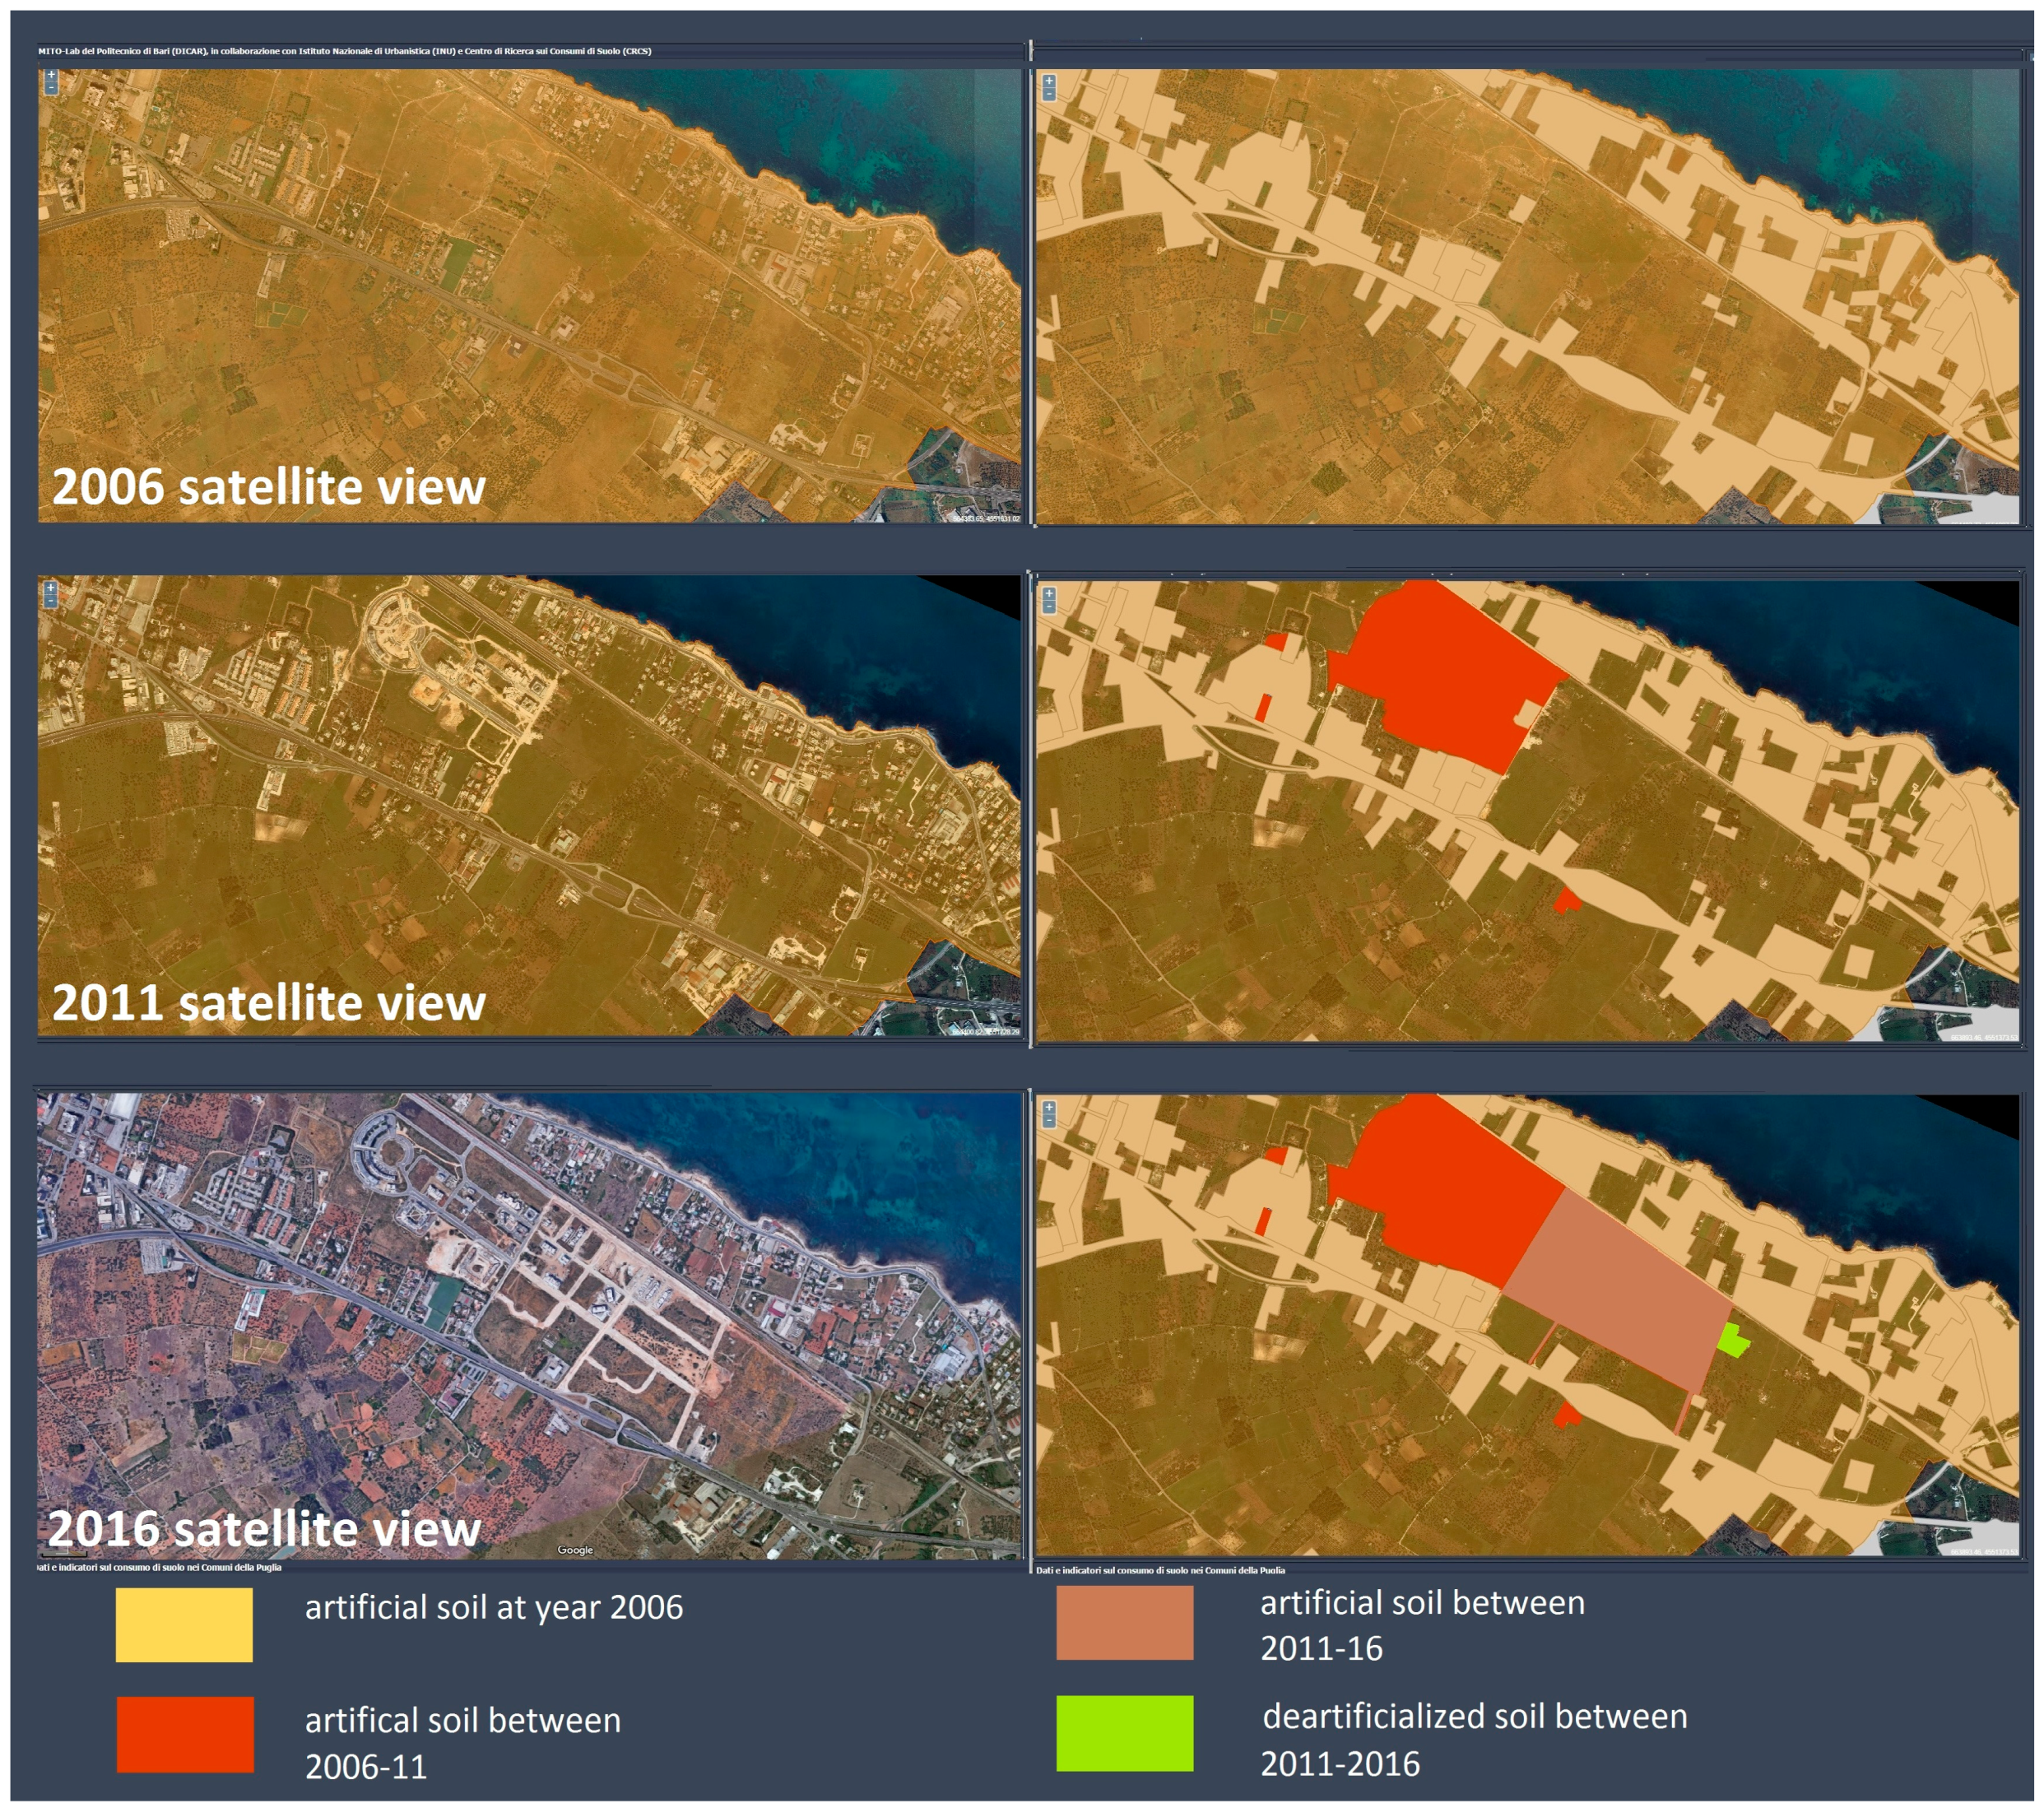
What we have done in our research is conduct analysis of the transition from one land use to another. The transition has been determined by common geoprocessing tools, such as the overlay of land use maps of different years, in order to put the changes into evidence. The main source is the regional land use map (RLUM). RLUM has been provided for 2006 and 2011, and the 2016 upgrade will soon be available. Maps are produced by the regional government, and are based on the land use nomenclature (
Table 3) by CORINE (acronym of the European Program “Coordination of information on the environment”) land cover (CLC). It is easy to understand that, in most cases, the waterproof built surfaces (dwellings, sheds, schools, or hospitals, etc.), or just covered surfaces (road network, parking areas, etc.), alternate with empty areas (gardens, fallow residual spaces, etc.) where the whole, or a piece of, ecological functions of the agricultural and natural soils have been kept. The size of the grid, used to develop the land use map, is important information. RLUM describes the land use on a basic grid unit of 50 × 50 m
2.
The economic dimension is depicted by the MLV (multiplier of land value), for a land use set in each municipality. Information has been drawn from the observatory of the property market by the National Tax Agency (OMI), and from various surveys provided by private national networks of real estate agencies. This investigation aimed to find a link between the occupation of land and socio-economic characteristics of property and construction markets in the local context. We see, in some way, that the creation of unearned plus value (to be recaptured) linked with the waste of soil, showed an example of inefficient use of land. The typical evidence of the waste of soil is in the seasonal use of the building stock, in the case of the regional coastline: seasonal users “duplicate their living environment” by keeping a main flat in the winter and a secondary flat in the summer.
2.4. Matrix of Land Use Transition
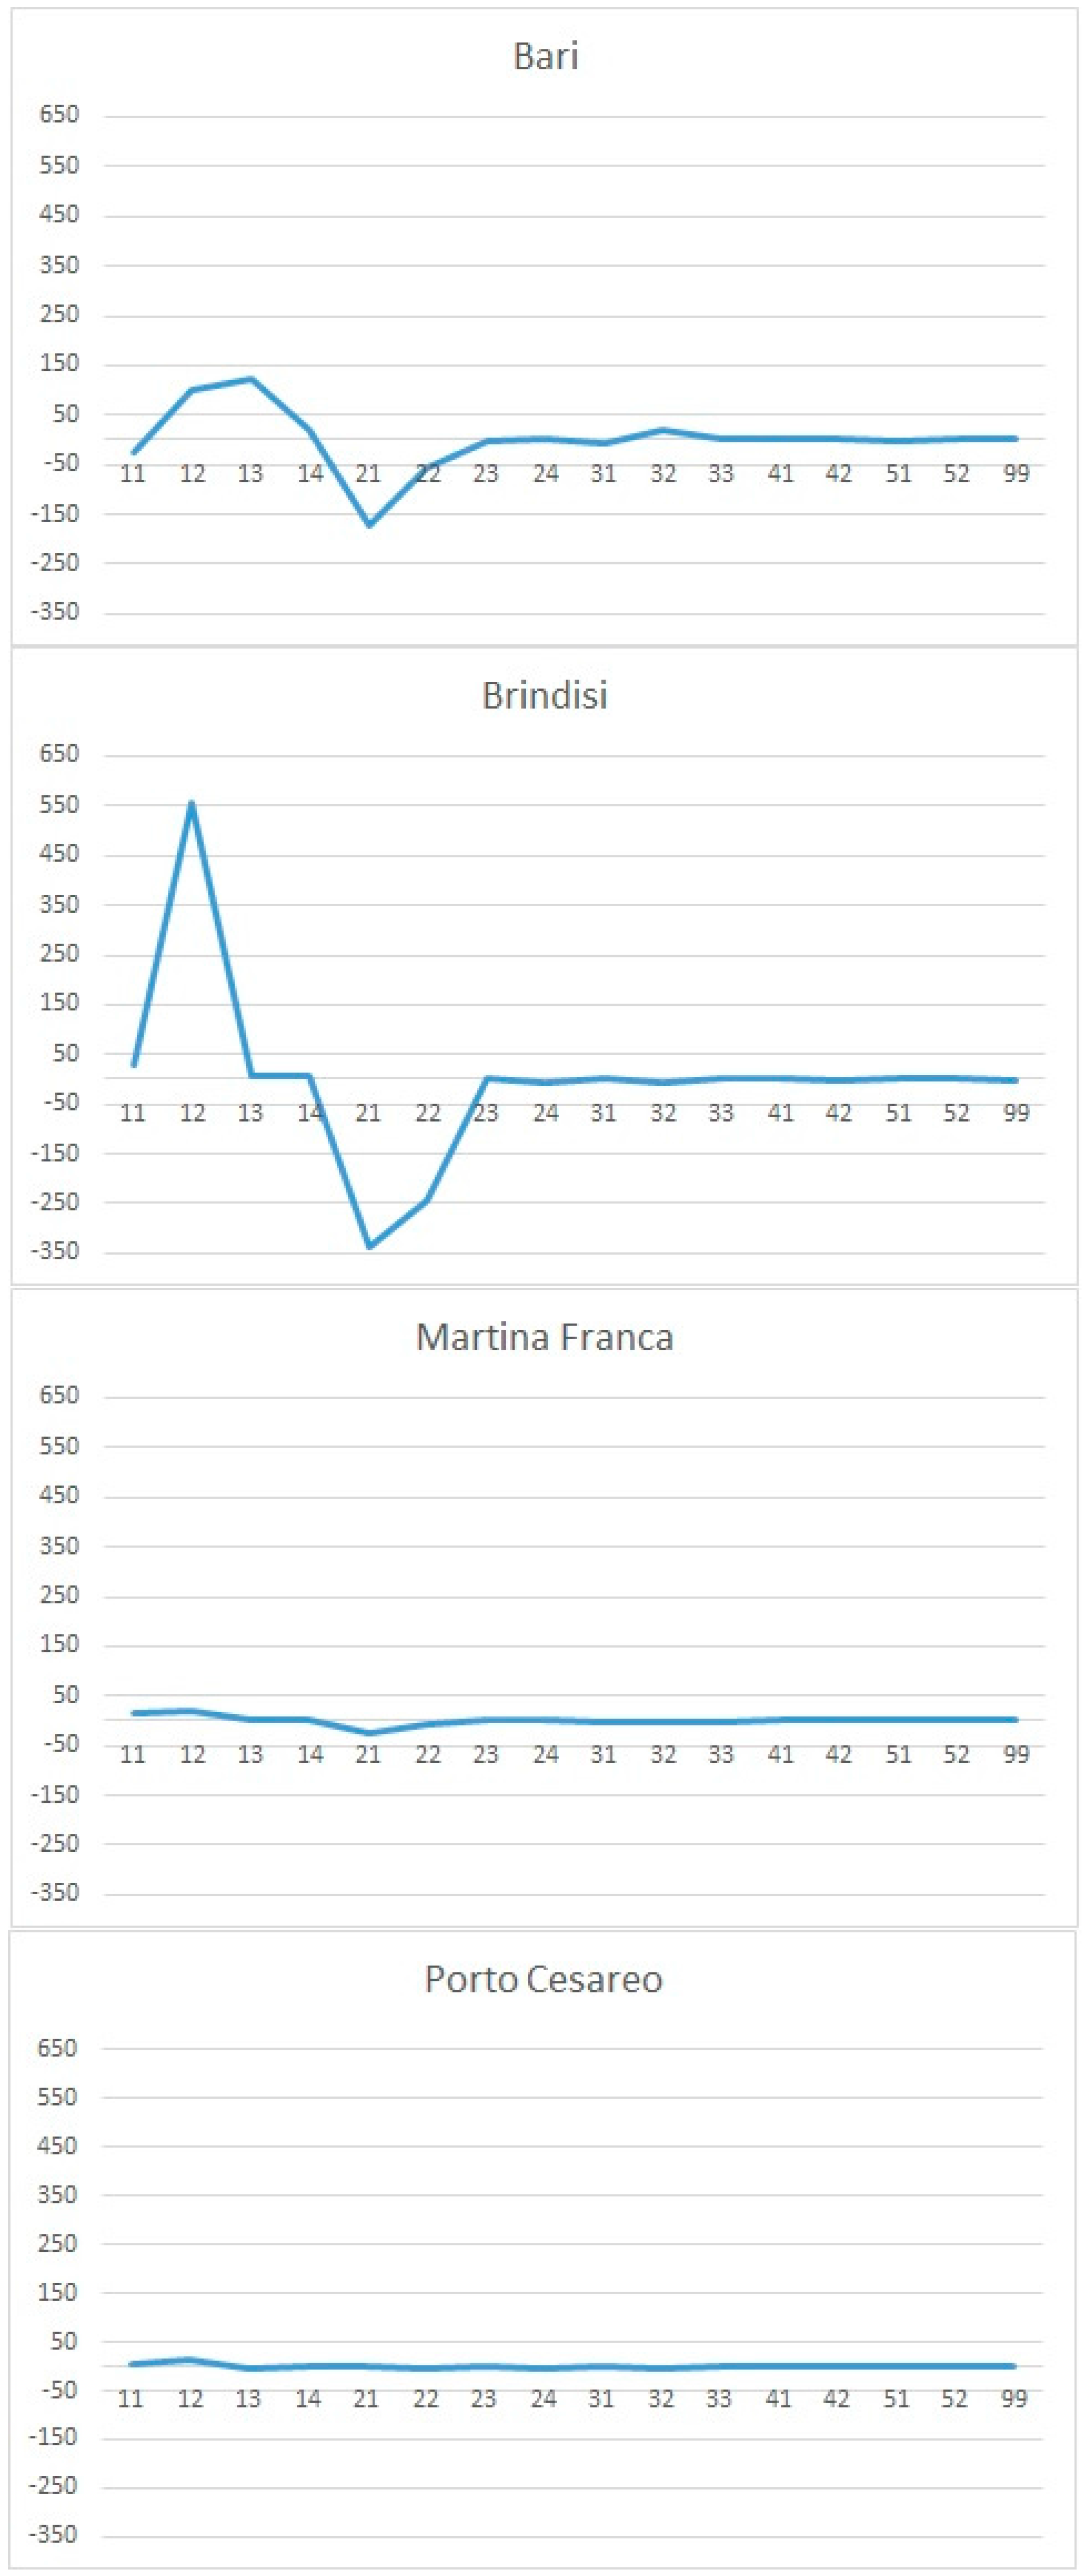
To analyze the change of land use, we consider two approaches. First, the “differential” approach is based on a general analysis of CLC referring to two different time lines; in this case it is possible to calculate the variation of the sum of a macro-class of surfaces between a given time line (for example all artificial surface variation). The method requires a database of information containing two vectors (a vector of land uses at time “i” and vector of land uses at time “j”), that restitute a general balance between artificial and non-artificial surfaces at time at “i” and at time “j”. This method is sufficient to make global differences between coverage at both times “i” and “j”, and the main information is about the global balance between losses and gains. The limitation is due to the impossibility of putting into evidence the single contribution of each decreasing coverage class in favor of each increasing coverage class. For example, if, during a decade, there was a loss of −300 ha of artificial green areas (CLC 1.4) in favor of housing settlements (CLC 1.1.), but 200 hectares of quarries (CLC 1.3) became artificial green areas and 100 hectares of quarries became industrial settlements (CLC 1.2), we can read only that +100 CLC 1.1, −100 CLC 1.4, +100 CLC 1.2 and −300 CLC 1.3, without knowing the internal transitions and we lose, therefore, the quali-quantitative dimension of the analysis.
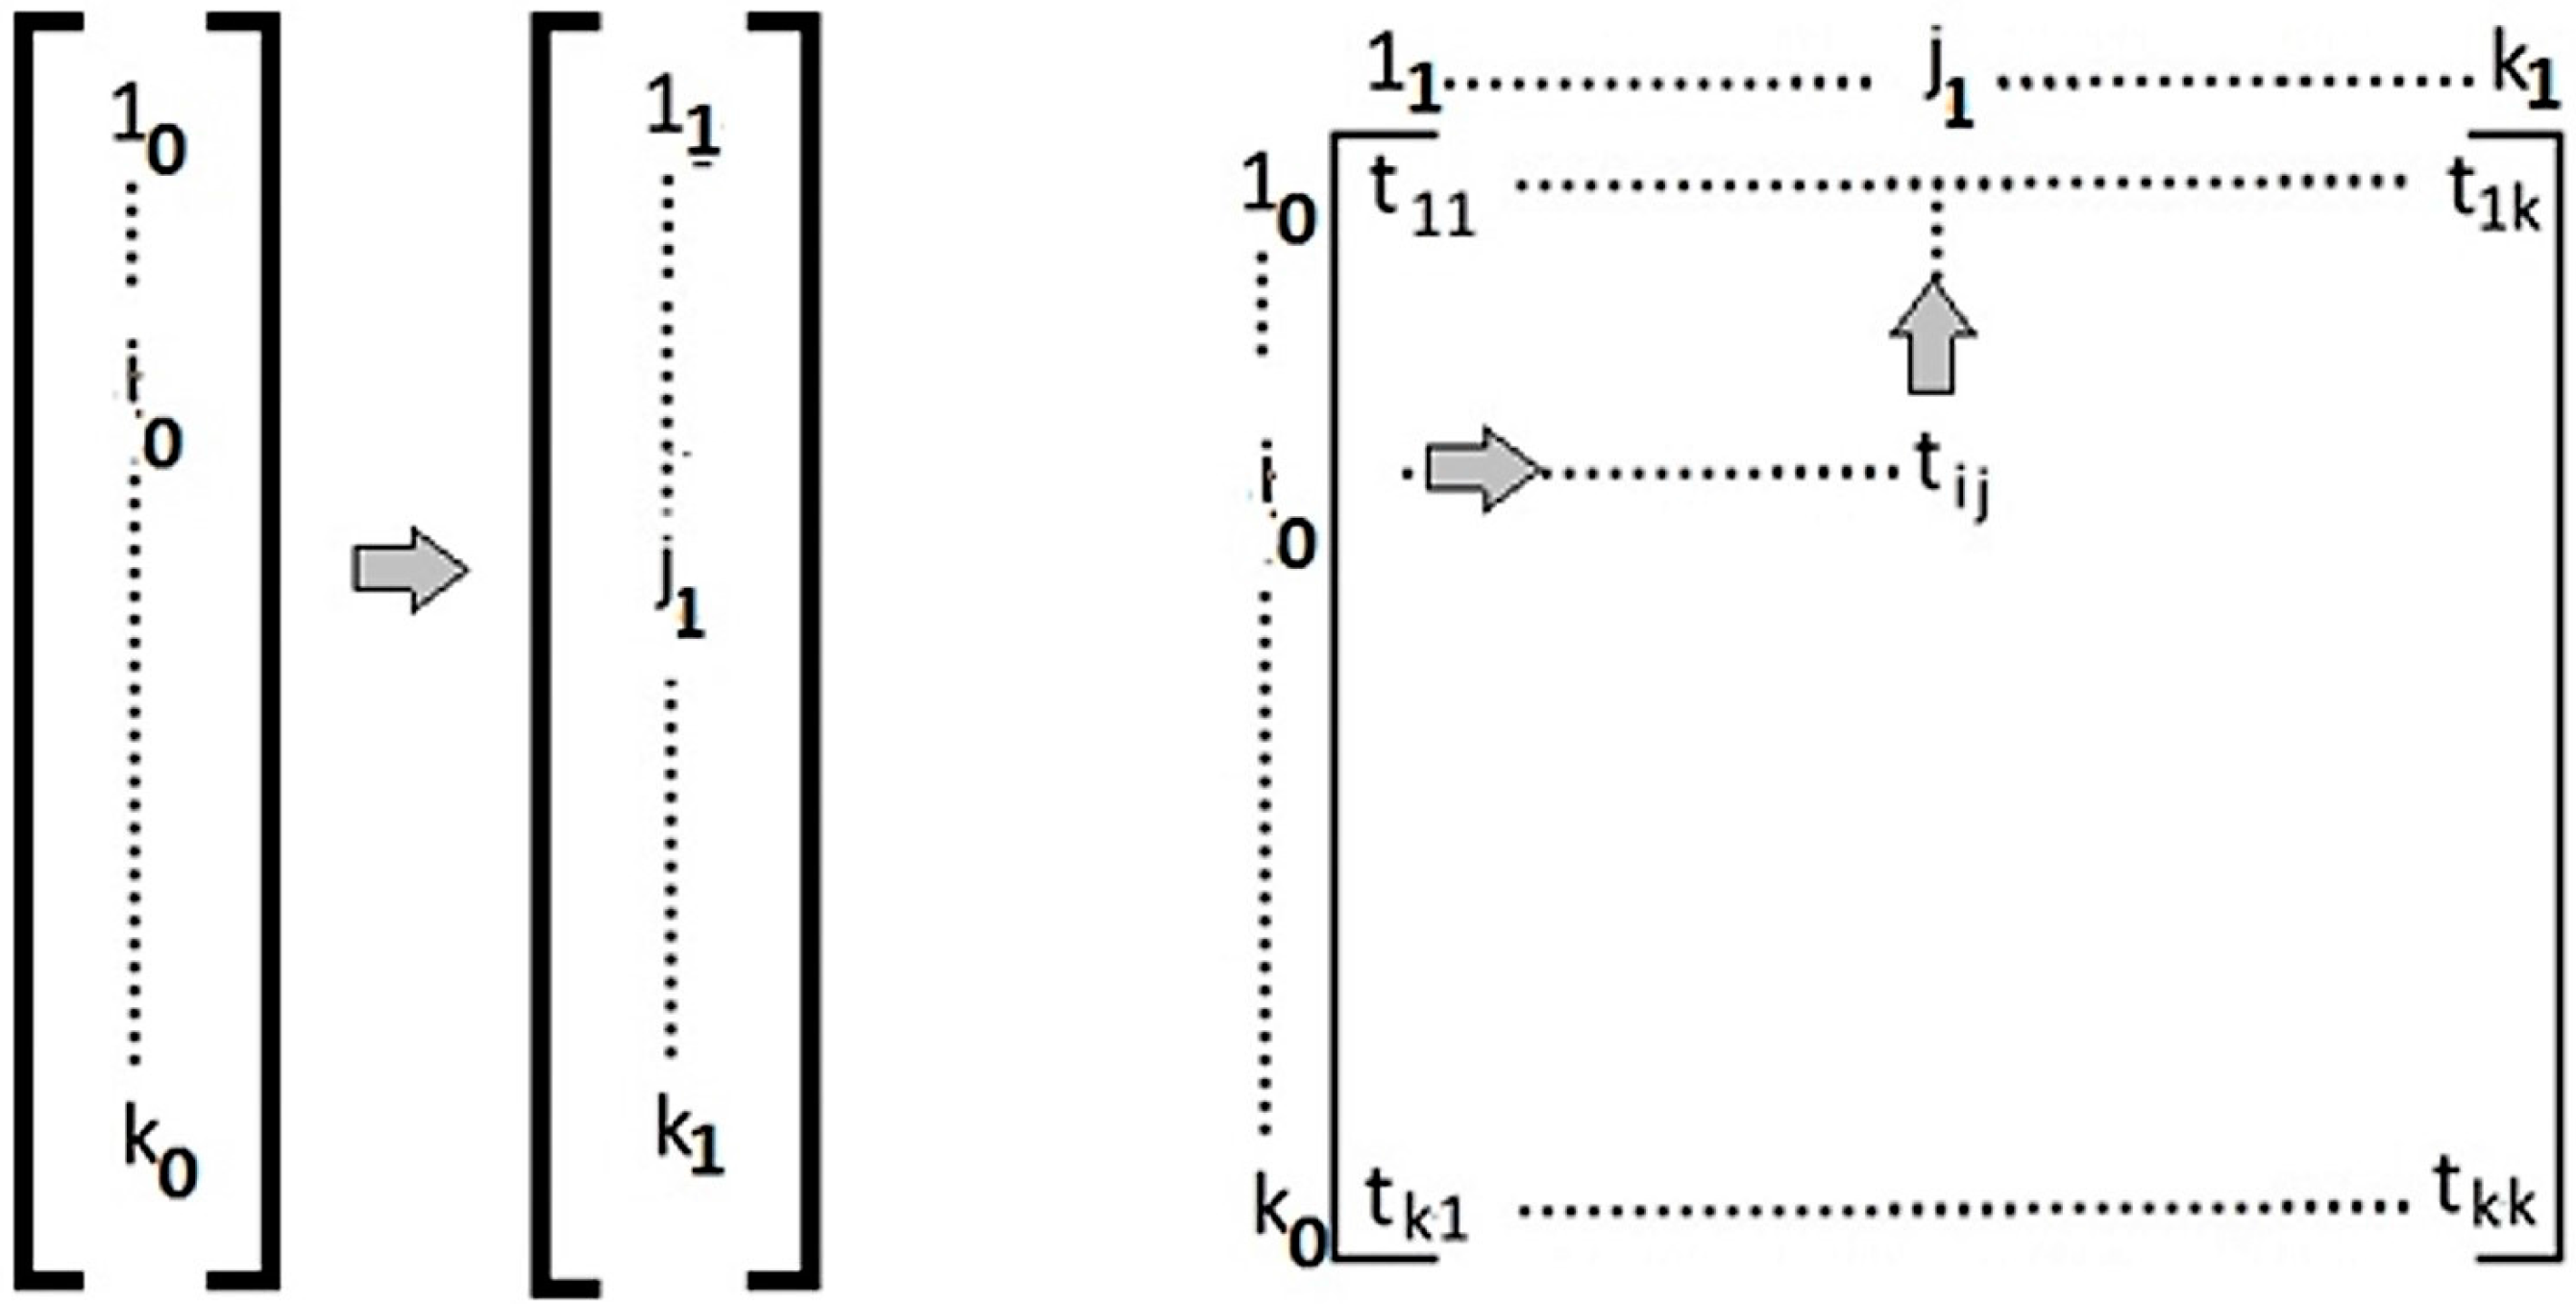
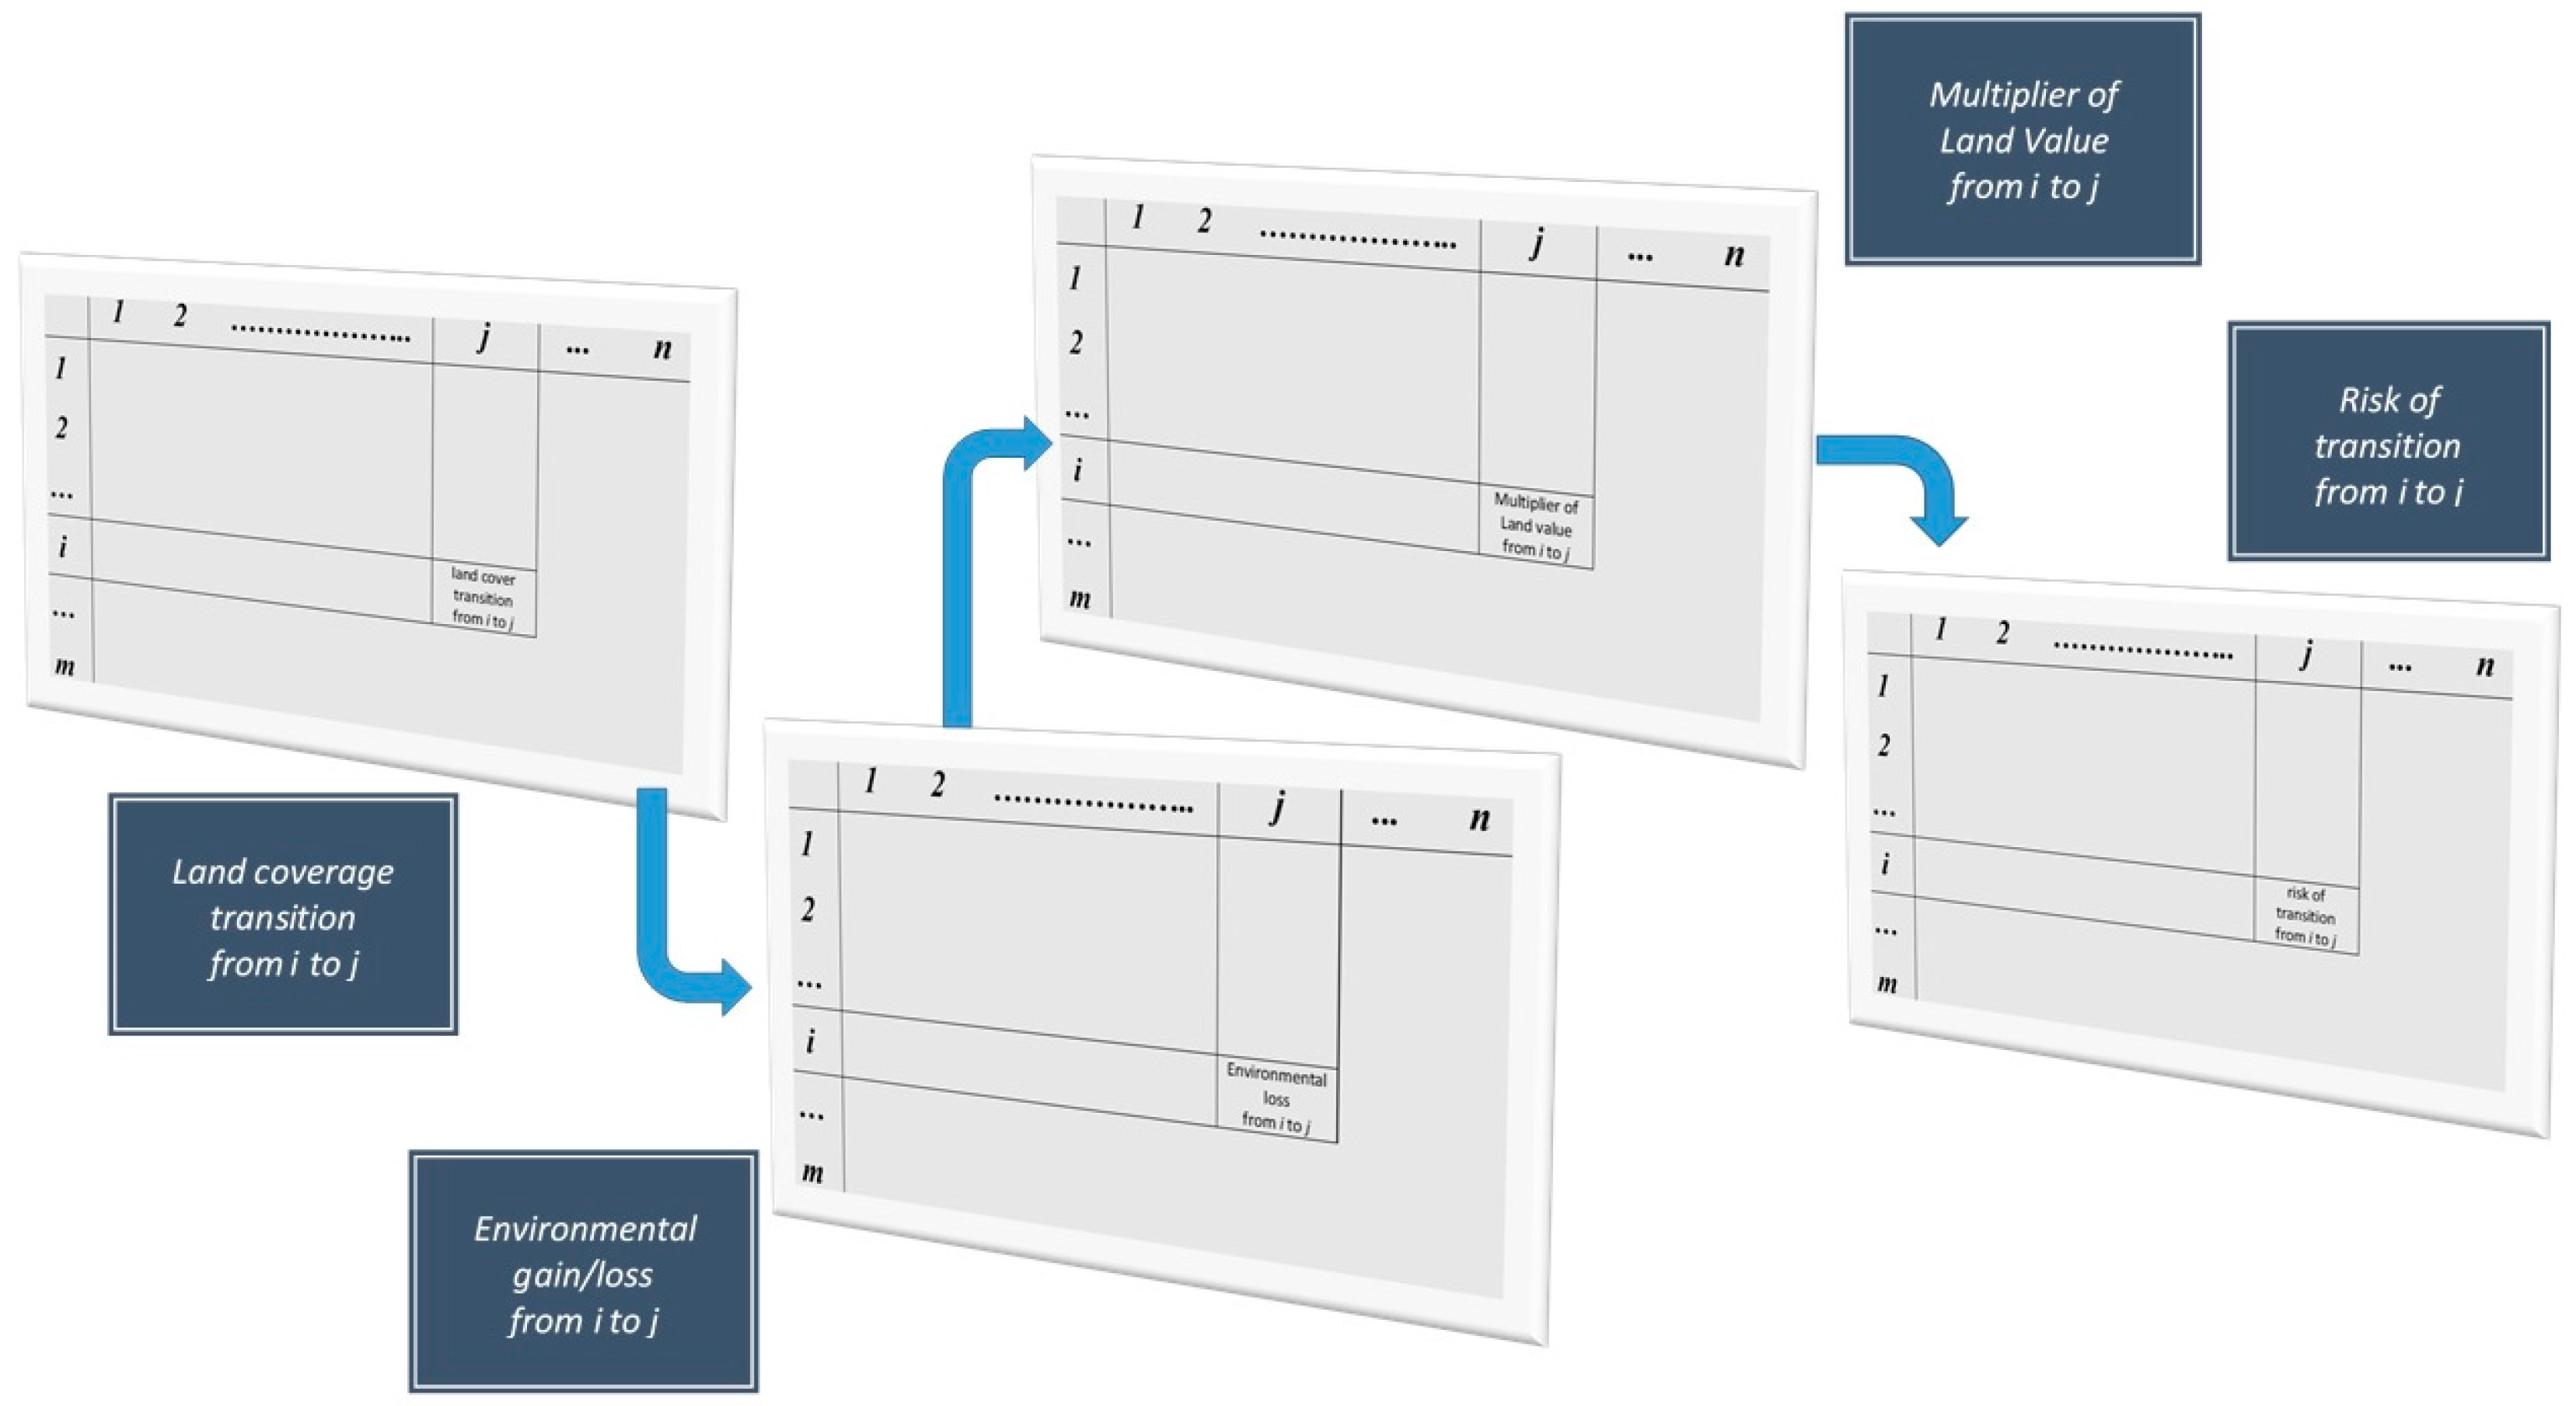
The second approach attempts to follow each single “flow” trough a more complex “matrix of land use transition” (MLUT) [
29]. The method requires a more complex geographical database (the GIS of soil covers). In order to use the method, a MLUT should be established with which the single streams by a cover i to j are distinctly countable from those from j to i or k to j (
Figure 4). By doing so, it is possible to account for the losses for each class, before having a whole balance in the system. Furthermore, it is also possible to read the loss and gains of cover due to a relocation of the original covers. For example, the growth of forests in a region may be the result of a loss of wooded area in the lowlands and an increase in the highlands (with all different ecological and economic implications). In this case, the transition matrix enables the detection of any decrease in separate and distinct ways by increments, for instance, by weighting each change, taking into account a criterion of importance for each land cover class.
2.5. Matrix of Land Value Transition
We set a further transition due to a weighting system of the pressure given due to the demand of real estate development. This second transition was measured by the multiplier of land value (MLV). MLV is a measure of the effect due to the change from past to actual land use, or from actual to potentially planned new land use. The transition of values is represented in the second couple of rows, where the multiplier calculates the increase of value in the Equations (1) and (2):
where:
VT2: is the total value at the time 2;
VuT1: is the unit value at the time 1;
MLV: is the multiplier of land value (MLV) from time 1 to time 2; and
∆SHa: is the surface interested by the transition from the land use at the time 1 to the land use at the time 2.
The increase/decrease of buildability can generate a plus/minus value, and is a key to analyze the causes of seeking new soils. Buildability represents, as well, the main cause of risk due to artificialization by ordinary planning implementation and due, as well, to extraordinary interventions. For this reason, the indicator of transition represented by MLV is a good weighting of the plus-value deriving from soil change.
The change from agrarian to urban land use represents a classical example of plus-value generation due to an expansive planning process [
30,
31]. On such occasions the revenue’s-costs ratio registers a strong improvement, due to the difference between the ex ante and ex post land value. The promoter buys a future possible buildable area at the sale price of agrarian soil, and when the promoter sells the same area just after it has been built, the ratio between the agrarian and buildable soil increases. Such a change often represents an unearned plus-value. Several traditional planning procedures supported such plus-value creation in the past. Most are imputable to the weakness of local administration in managing sustainable scenarios in conjunction with the pressures of entrepreneurs and land promoters. Looking at the artificial soil of Apulia, it can be observed that the artificial soil represents less than 10% of the land coverage: the environmental impact related to 10% of the artificial soil is very impressive and can affect the whole environment; as Fishel [
32] affirms, although the amount of land may not be crucial, the way we use it is, especially in urban areas.
The matrix of transition for land use has been set to analyze the use while recollecting the sentence of Fishel. Starting from land use transition, a matrix of land value transition can be produced. The worst happens when the transition of soils are economically supported by high MLV, and, at the same time, create a heavy loss of environmental capital (
Figure 5). In this case, the last transition for soil resources represents a change between a state of lower environmental risk of damage, to a higher one (
Figure 5). The consequent impact is land degradation that can be multidimensionally assessed [
33].
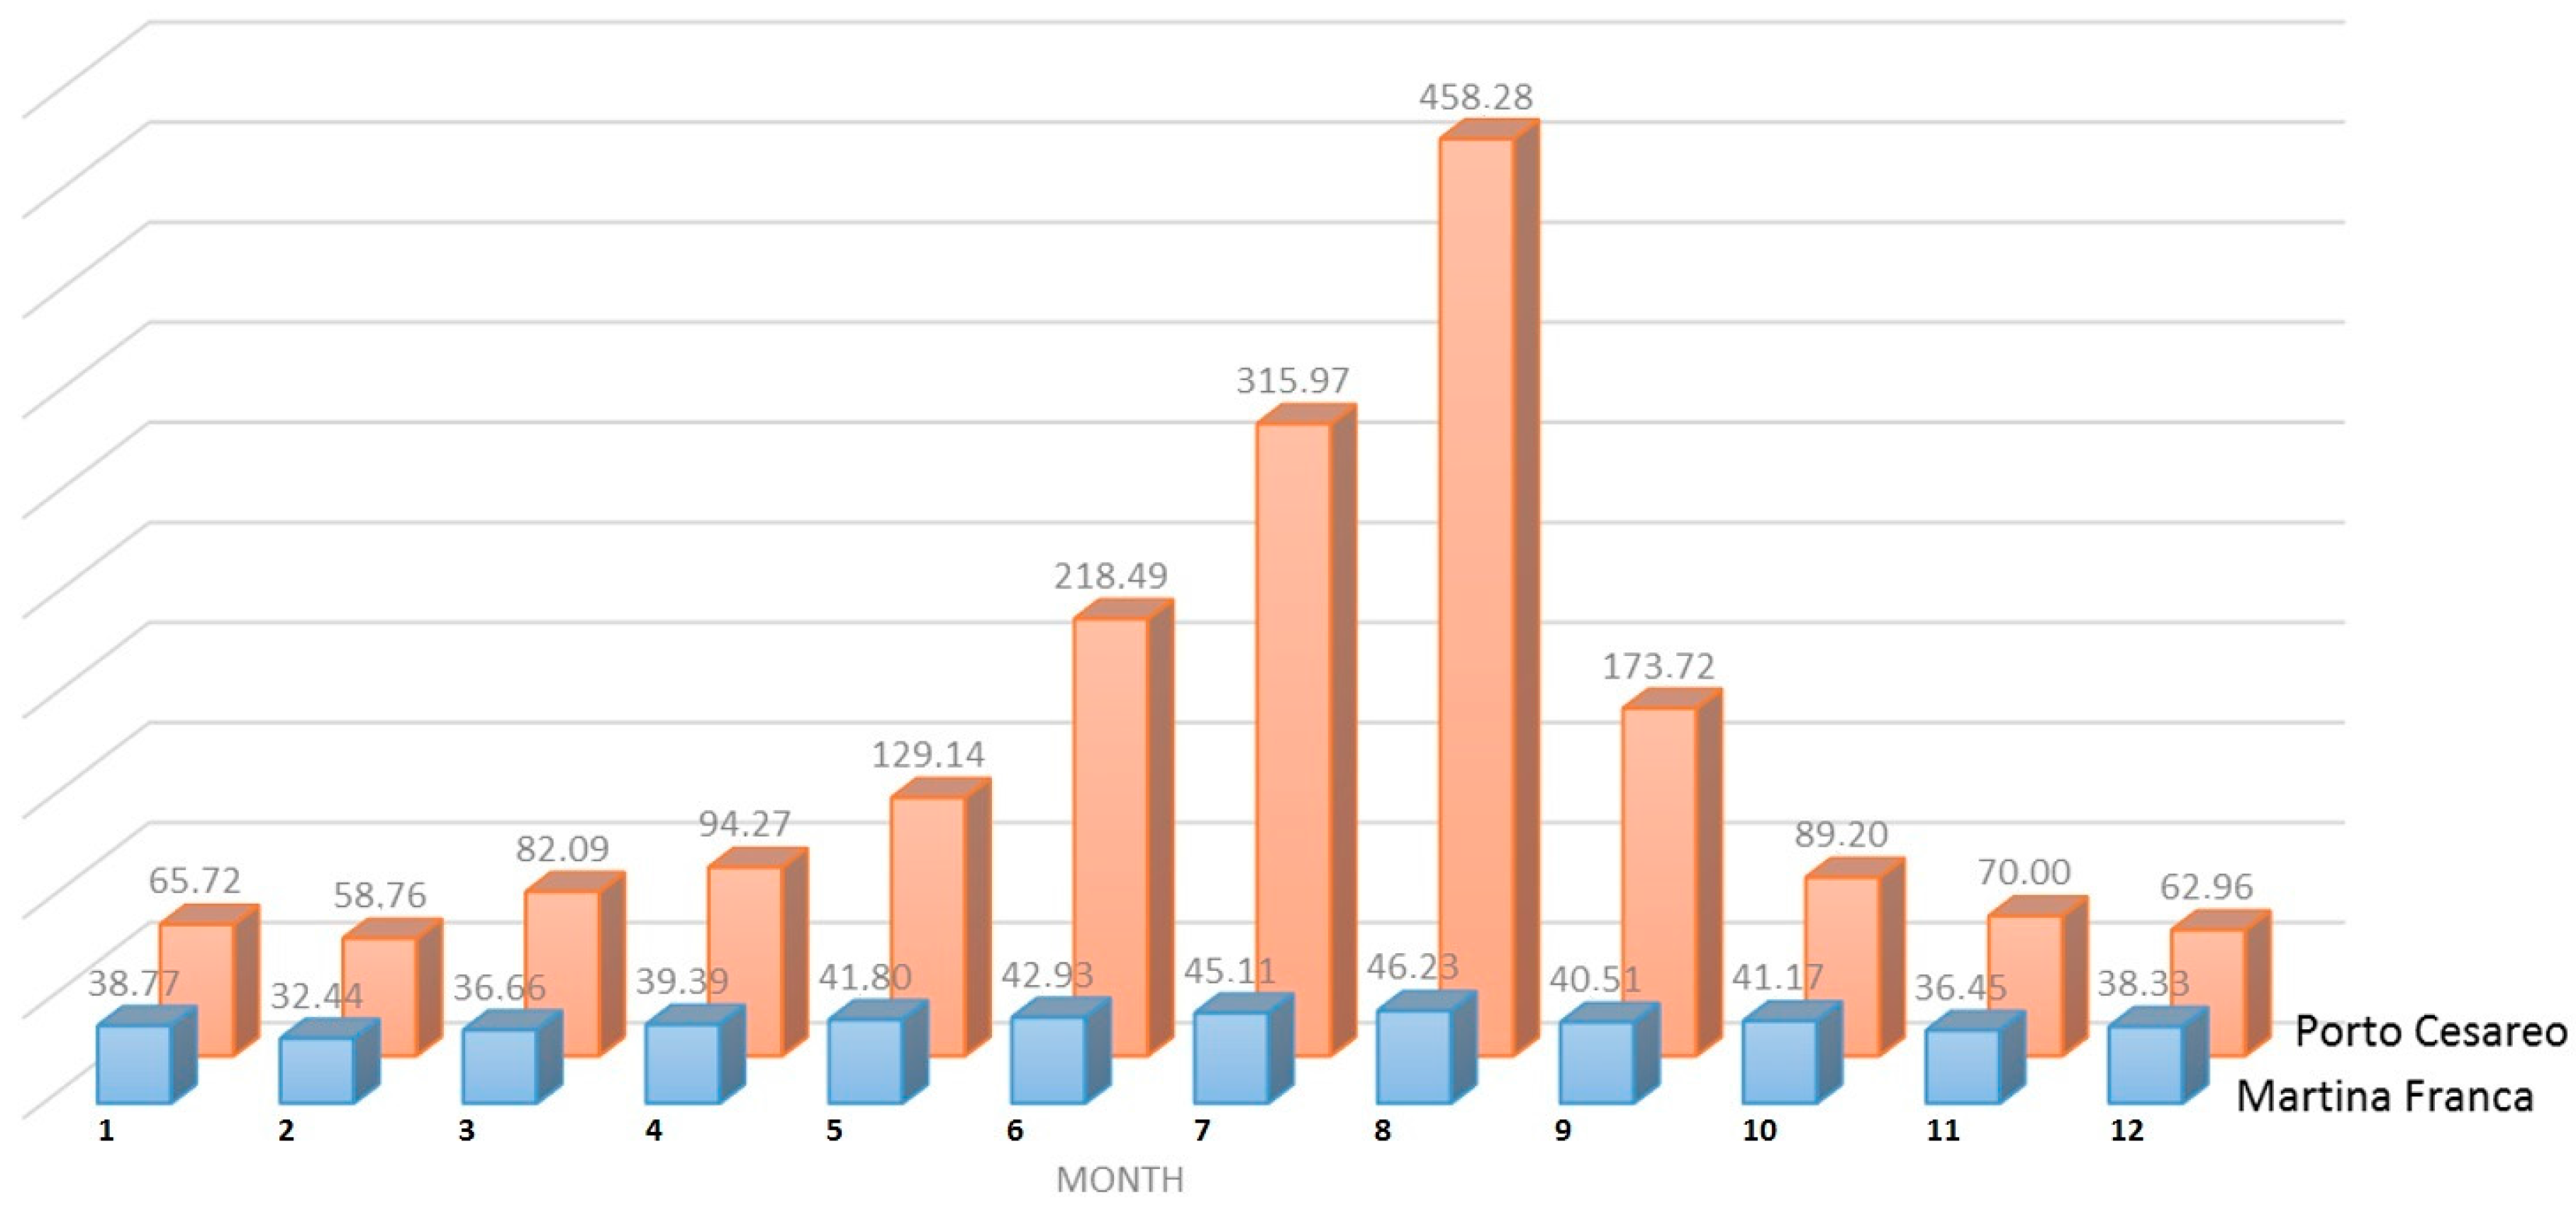
2.7. Case Studies on Driving Factors at the Local Scale
As it is easy to understand, dynamics that generate new soil consumption are connected with the real estate market. The increase of land value due to town planning regulation is due to buildability deriving from new urban expansion, more than by renewing old properties. This assumed economic competitiveness of new expansion despite the rehabilitation will be proved. In the following paragraphs, we analyze the typical forms of transition of land use and we propose a method to quantify the economic phenomenon of the “unearned” land plus-value, and to measure the effectiveness of pursuing plus values. Then, we emphasize peculiarities emerging from our case study (Results). Finally, we judge the efficiency of some solutions, considering the real possibility of recapturing land plus-values, and comparing improvement for expansions with better reuse (Discussion and Conclusions).The case studies are as follows: (i) the maritime city of Porto Cesareo, where the highest percentage of unoccupied housing stock has been detected; (ii) the City of Martina Franca, the largest urban center of the Itrian Valley, with a relevant housing sprawl in a prized rural landscape; (iii) the City of Brindisi, where the highest coverage of solar farms has been found; and, finally (iv) the Regional Capital City (Bari), where most recent expansion has been produced by a “Program Agreement”.


