Equity in Microscale Urban Design and Walkability: A Photographic Survey of Six Pittsburgh Streetscapes

Abstract
:1. Introduction
2. Methods
2.1. Study Area
2.2. Assessing Walkability
2.3. Walking Survey
2.4. Data Interpretation
3. Results
3.1. Urban Design
3.1.1. Imageability
3.1.2. Enclosure
3.1.3. Human Scale
3.1.4. Transparency
3.1.5. Complexity
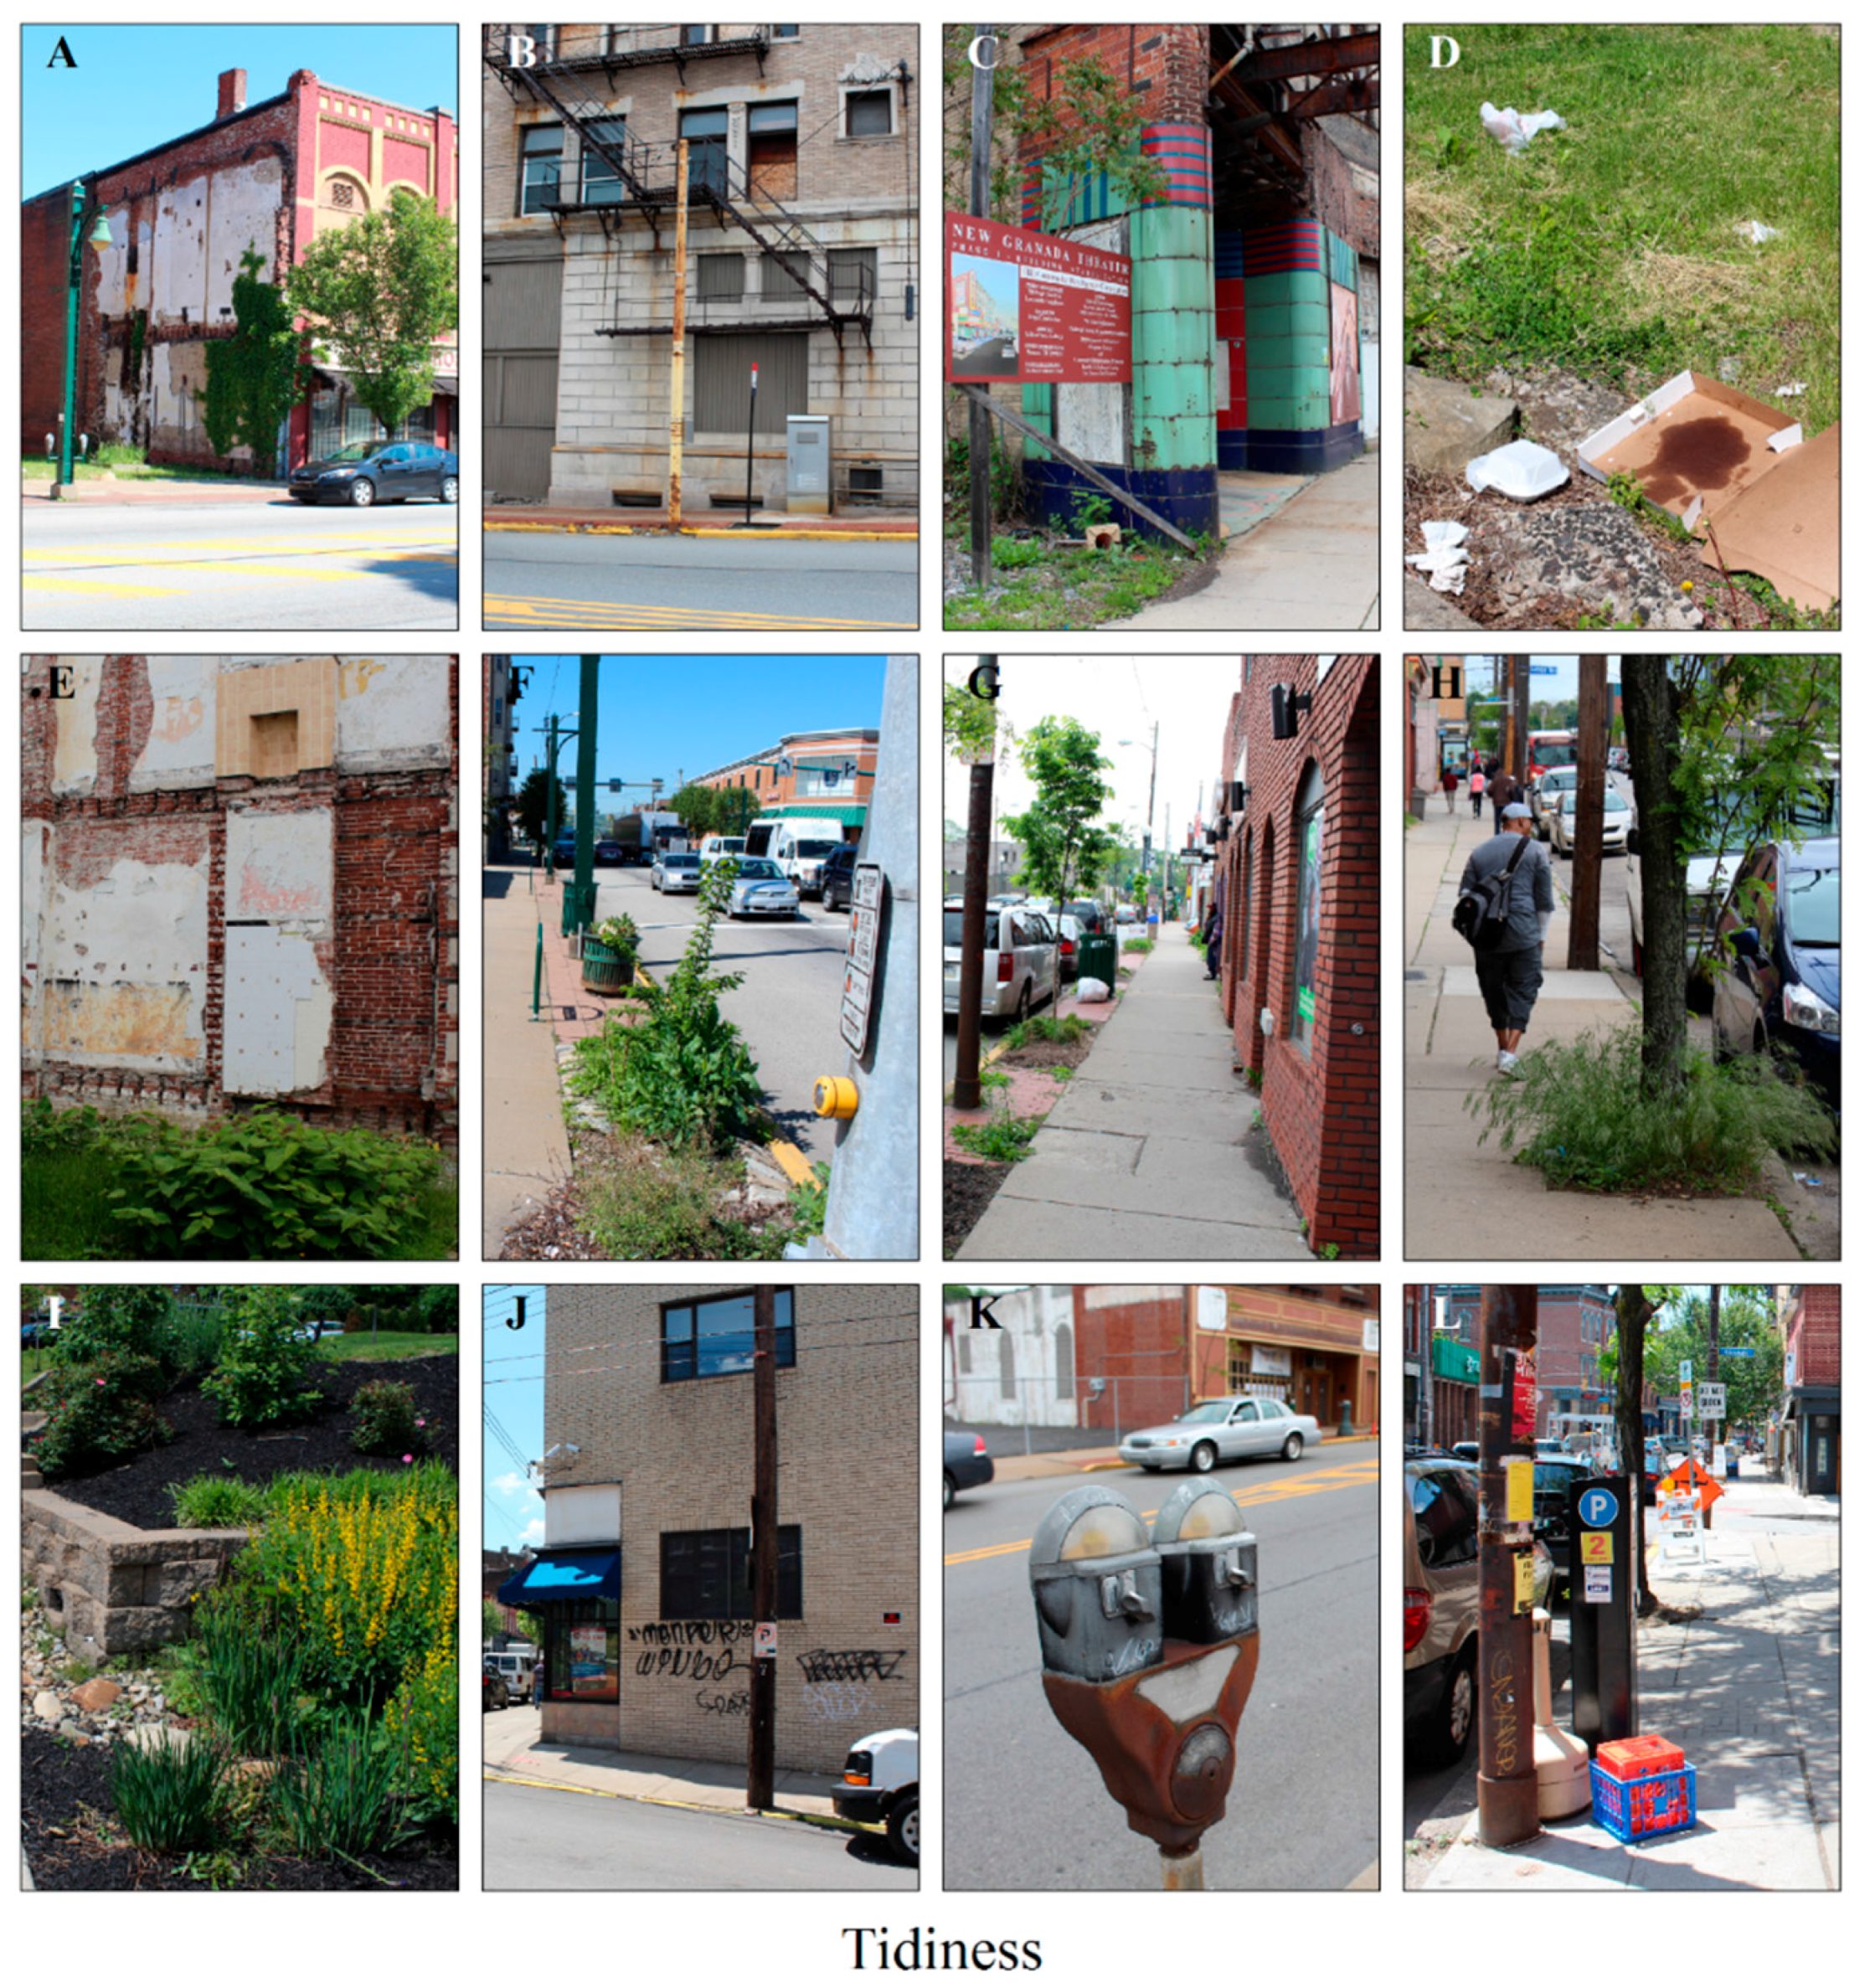
3.1.6. Tidiness
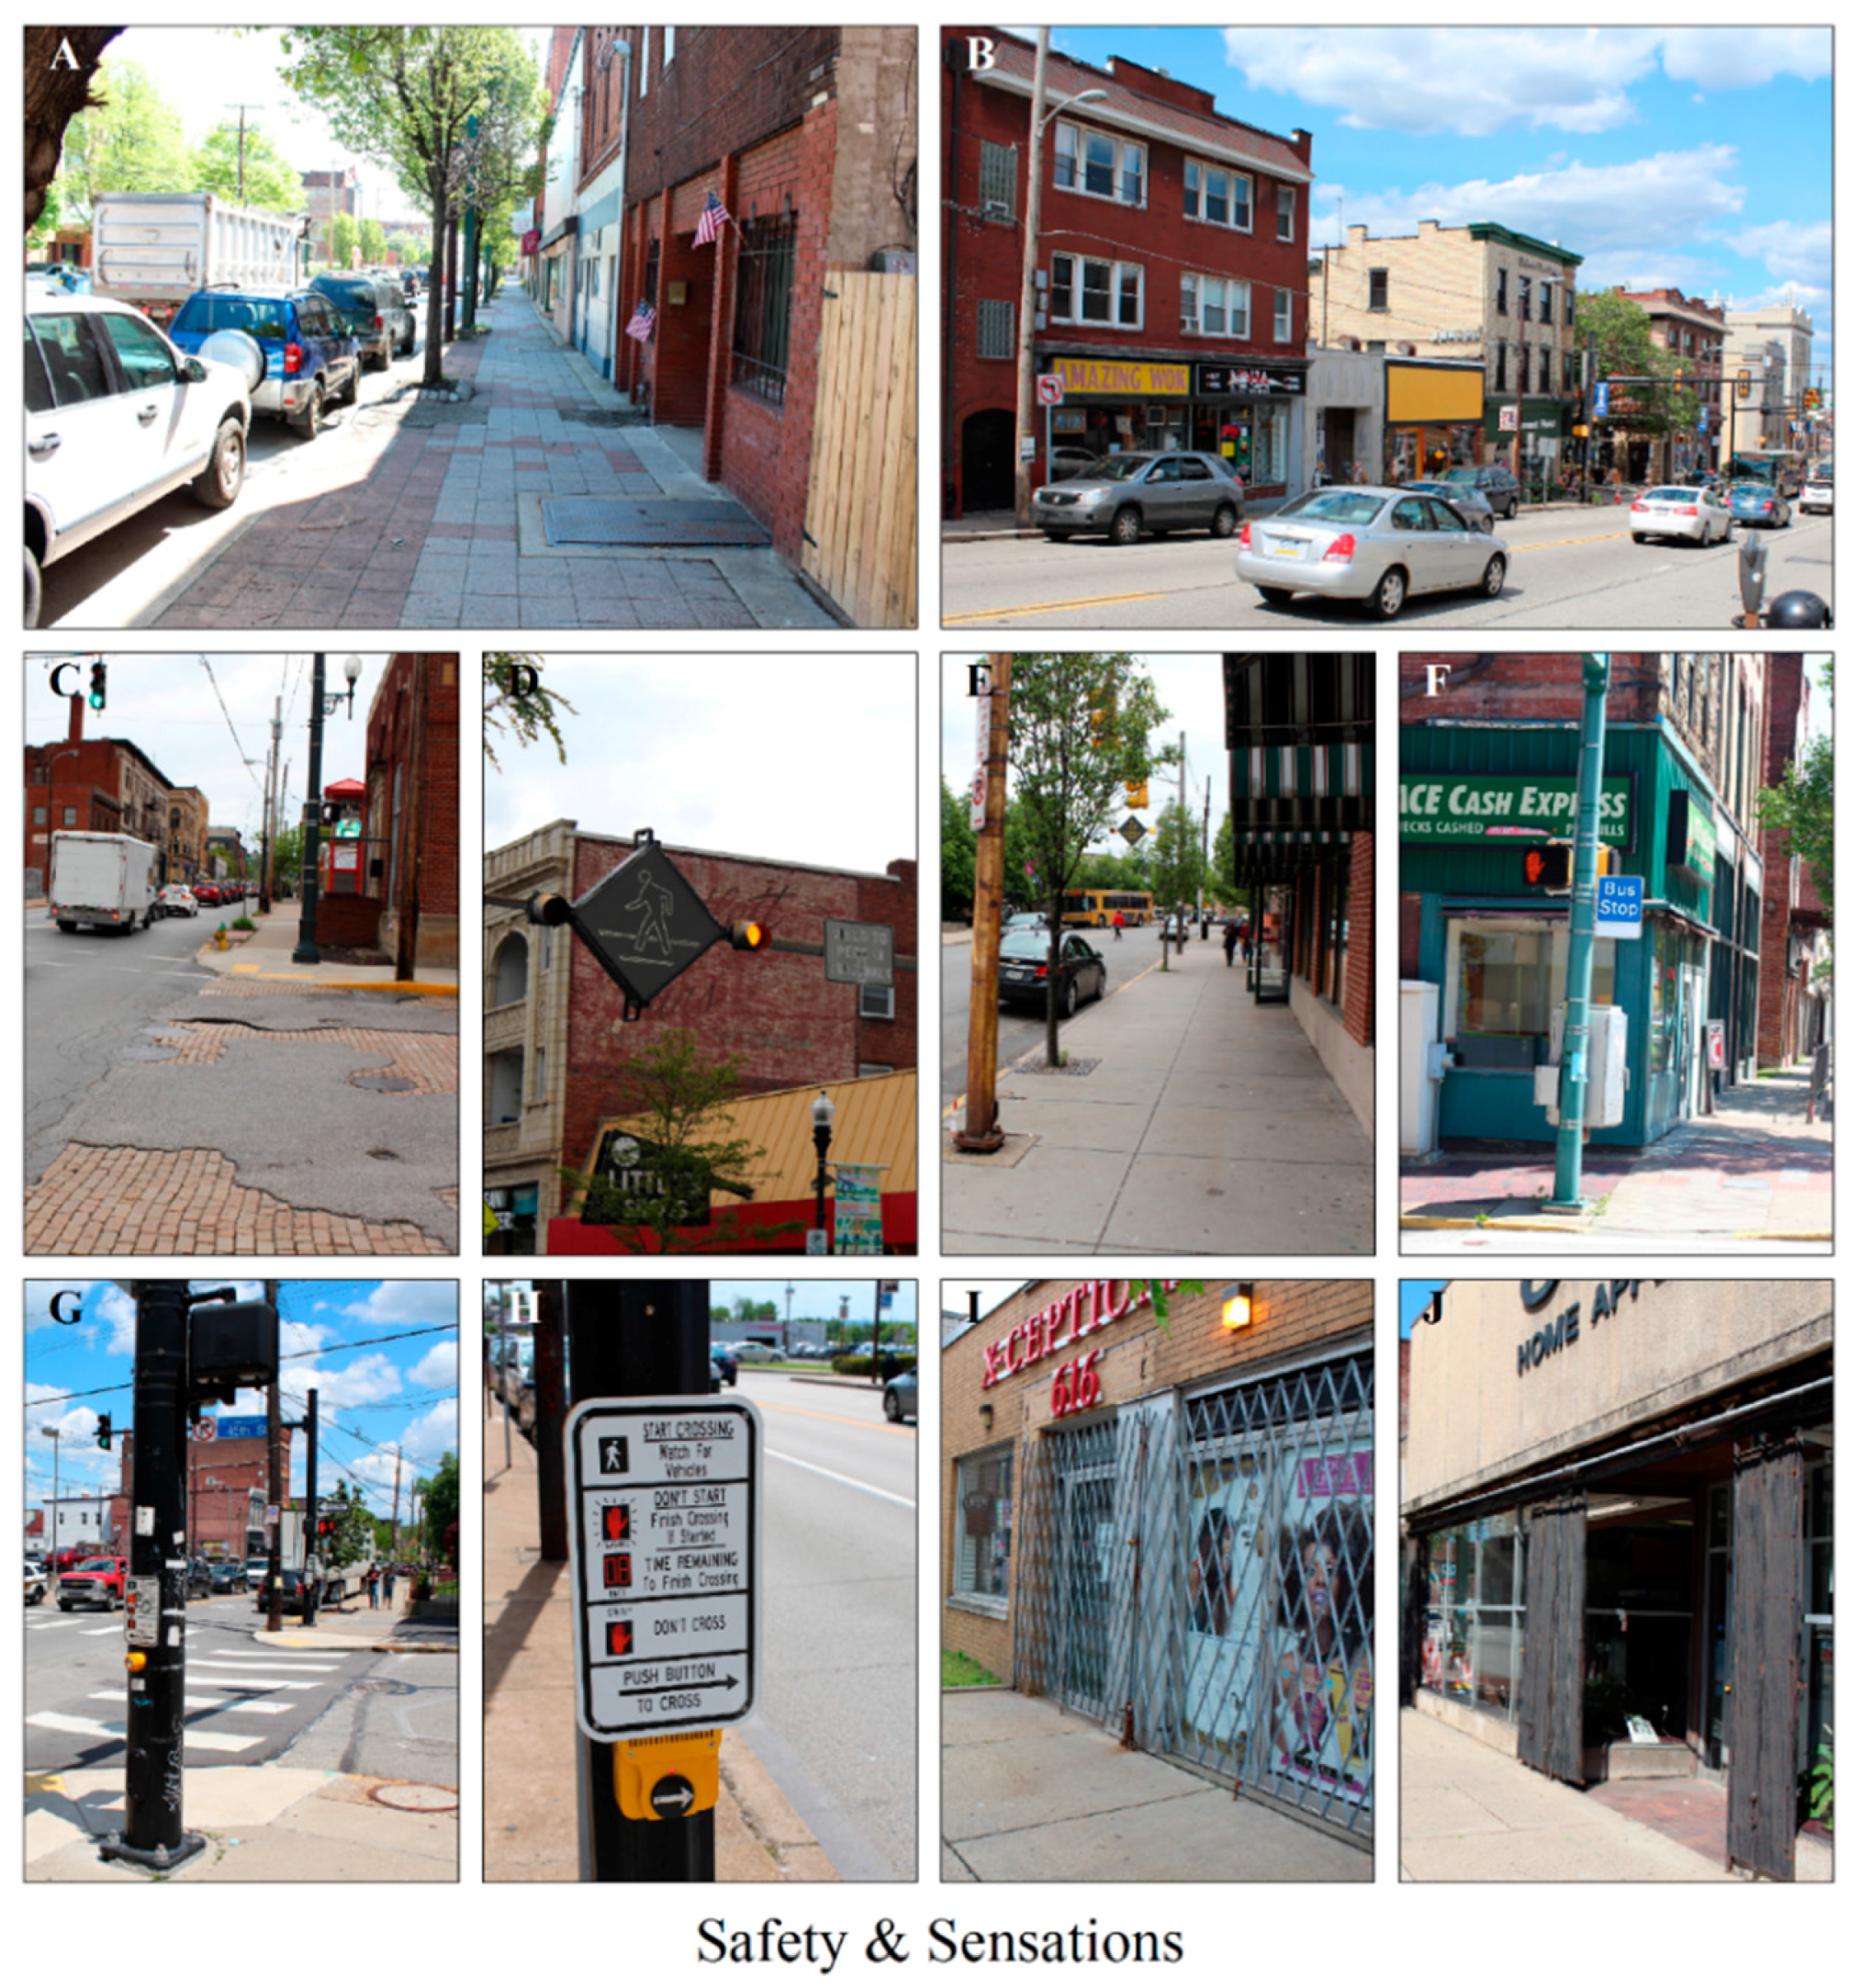
3.1.7. Safety and Sensations
3.2. Pedestrian Activity
4. Discussion and Conclusions
Acknowledgments
Conflicts of Interest
References
- Quastel, N.; Moos, M.; Lynch, N. Sustainability-as-density and the return of the social: The case of Vancouver, British Columbia. Urban Geogr. 2012, 33, 1055–1084. [Google Scholar] [CrossRef]
- Bereitschaft, B. Neighborhood change among creative-cultural districts in mid-sized U.S. metropolitan areas, 2000–2010. Reg. Stud. Reg. Sci. 2014, 1, 158–183. [Google Scholar]
- Riggs, W. Inclusively walkable: exploring the equity of walkable housing in the San Francisco Bay Area. Local Environ. 2016, 21, 527–554. [Google Scholar] [CrossRef]
- Greenberg, M.; Renne, J. Where does walkability matter the most? An environmental justice interpretation of New Jersey data. J. Urban Health Bull. N. Y. Acad. Med. 2005, 82, 90–100. [Google Scholar] [CrossRef] [PubMed]
- Deehr, R.C.; Shumann, A. Active Seattle: Achieving walkability in diverse neighborhoods. Am. J. Prev. Med. 2009, 37, S403–S411. [Google Scholar] [CrossRef] [PubMed]
- Shamsuddin, S.; Rasyiqah Abu Hassan, N.; Fatimah Llani Bilyamin, S. Walkable environment in increasing the liveability of a city. Procedia Soc. Behav. Sci. 2012, 50, 167–178. [Google Scholar] [CrossRef]
- Frank, L.D.; Engelke, P. Impacts of the built environment on health: Walkable places and the exposure to air pollution. Int. Reg. Sci. Rev. 2005, 28, 193–216. [Google Scholar] [CrossRef]
- Lovasi, G.S.; Neckeman, K.M.; Quinn, J.W.; Weiss, C.C.; Rundle, A. Effect of individual or neighborhood disadvantage on the association between neighborhood walkability and body mass index. Am. J. Public Health 2009, 99, 279–284. [Google Scholar] [CrossRef] [PubMed]
- Sallis, J.F.; Saelens, B.; Frank, L.; Conway, T.L.; Slymen, D.J.; Cain, K.L.; Chapman, J.E.; Kerr, J. Neighborhood built environment and income: Examining multiple health outcomes. Soc. Sci. Med. 2009, 68, 1285–1293. [Google Scholar] [CrossRef] [PubMed]
- Speck, J. Walkable City: How Downtown Can Save America, One Step at a Time; Farrar, Straus and Giroux: New York, NY, USA, 2012. [Google Scholar]
- Saelens, B.E.; Handy, S.L. Built environment correlates of walking: A review. Med. Sci. Sports Med. 2008, 40, 550–566. [Google Scholar] [CrossRef] [PubMed]
- Ewing, R.; Cervero, R. Travel and the built environment: A meta-analysis. J. Am. Plan. Assoc. 2010, 76, 265–294. [Google Scholar] [CrossRef]
- Frank, L.D.; Sallis, J.F.; Conway, T.L.; Chapman, J.E.; Saelens, B.E.; Bachman, W. Many pathways from land use to health. J. Am. Plan. Assoc. 2006, 72, 75–87. [Google Scholar] [CrossRef]
- Coffee, N.T.; Howard, N.; Paquet, C.; Hugo, G.; Daniel, M. Is walkability associated with a lower cardiometabolic risk? Health Place 2013, 21, 163–169. [Google Scholar] [CrossRef] [PubMed]
- Berke, E.M.; Gottlied, L.M.; Moudon, A.V.; Larson, E.B. Protective association between neighborhood walkability and depression in older men. J. Am. Geriatr. Soc. 2007, 55, 526–533. [Google Scholar] [CrossRef] [PubMed]
- Frumkin, H. Urban Sprawl and Public Health. Public Health Rep. 2002, 117, 201–217. [Google Scholar] [CrossRef]
- Frank, L.D.; Greenwald, M.J.; Winkelman, S.; Chapman, J.; Kavage, S. Carbonless footprints: Promoting health and climate stabilization through active transportation. Prev. Med. 2010, 50, S99–S105. [Google Scholar] [CrossRef] [PubMed]
- Leyden, K.M. Social capital and the built environment: The importance of walkable neighborhoods. Am. J. Public Health 2003, 93, 1546–1551. [Google Scholar] [CrossRef] [PubMed]
- French, S.; Wood, L.; Foster, S.A.; Giles-Corti, B.; Frank, L.; Learnihan, V. Sense of community and its association with the neighborhood built environment. Environ. Behav. 2013, 46, 677–697. [Google Scholar] [CrossRef]
- Gilderbloom, J.I.; Riggs, W.W.; Meares, W.L. Does walkability matter? An examination of walkability’s impact on housing values, foreclosures and crime. Cities 2015, 42, 13–24. [Google Scholar] [CrossRef]
- Litman, T. Economic value of walkability. World Transp. Policy Pract. 2004, 10, 5–14. [Google Scholar] [CrossRef]
- Sohn, D.W.; Moudon, A.V.; Lee, J. The economic value of walkable neighborhoods. Urban Des. Int. 2012, 17, 115–128. [Google Scholar] [CrossRef]
- Jacobs, J. The Death and Life of Great American Citie; Random House: New York, NY, USA, 1961. [Google Scholar]
- Alexiou, A.S. Jane Jacobs: Urban Visionary; Rutgers University Press: New Brunswick, NJ, USA, 2006. [Google Scholar]
- McClay, W.M.; McAllister, T.V. Why Place Matters: Identity and Civic Life in Modern America; McClay, W.M., McAllister, T.V., Eds.; New Atlantis Books: New York, NY, USA, 2014. [Google Scholar]
- Pucher, J.; Renne, J.L. Socioeconomics of urban travel: Evidence from the 2001 NHTS. Transp. Q. 2003, 57, 49–77. [Google Scholar]
- Chakraborty, J.; Tobin, G.A.; Montz, B.E. Population evacuation: Assessing spatial variability in geophysical risk and social vulnerability to natural hazards. Nat. Hazards Rev. 2005, 6, 23–33. [Google Scholar] [CrossRef]
- Kim, S. Assessing mobility in an aging society: Personal and built environment factors associated with older people’s subjective transportation deficiency in the US. Transp. Res. Part F 2011, 14, 422–429. [Google Scholar] [CrossRef]
- Currie, G.; Delbosc, A. Car Ownership and low income on the urban fringe—Benefit or hindrance? In Proceedings of the 32nd Australasian Transport Research Forum (ATRF), Auckland, New Zealand, 29 September–1 October 2009. [Google Scholar]
- Leslie, E.; Coffee, N.; Frank, L.; Owen, N.; Bauman, A.; Hugo, G. Walkability of local communities: Using geographic information systems to objectively assess relevant environmental attributes. Health Place 2007, 13, 111–122. [Google Scholar] [CrossRef] [PubMed]
- Frank, L.D.; Sallis, J.F.; Saelens, B.E.; Leary, L.; Cain, K.; Conway, T.L.; Hess, P.M. The development of a walkability index: Application to the neighborhood quality of life study. Br. J. Sports Med. 2010, 44, 924–933. [Google Scholar] [CrossRef] [PubMed]
- Kim, Y.-J.; Woo, A. What’s the score? Walkable environments and subsidized households. Sustainability 2016, 8, 396. [Google Scholar] [CrossRef]
- Porta, S.; Renne, J.L. Linking urban design to sustainability: formal indicators of social urban sustainability field research in Perth, Western Australia. Urban Des. Int. 2005, 10, 51–64. [Google Scholar] [CrossRef]
- Ewing, R.; Handy, S. Measuring the unmeasurable: Urban design qualities related to walkability. J. Urban Des. 2009, 14, 65–84. [Google Scholar] [CrossRef]
- Cutts, B.B.; Darby, K.J.; Boone, C.G.; Brewis, A. City structure, obesity; environmental justice: An integral analysis of physical and social barriers to walkable streets and park access. Soc. Sci. Med. 2009, 69, 1314–1322. [Google Scholar] [CrossRef] [PubMed]
- Duncan, D.T.; Aldstadt, J.; Whalen, J.; Melly, S.J.; Gortmaker, S.L. Validation of Walk Score® for estimating neighborhood walkability: An analysis of four US metropolitan areas. Int. J. Environ. Res. Public Health 2011, 8, 4160–4179. [Google Scholar] [CrossRef] [PubMed]
- Koschinsky, J.; Talen, E. Affordable housing and walkable neighborhoods: A national urban analysis. Cityscape J. Policy Dev. Res. 2015, 17, 13–56. [Google Scholar]
- Neckerman, K.M.; Lovasi, G.S.; Davies, S.; Purciel, J.Q.; Feder, E.; Raghunath, N.; Wasserman, B.; Rundle, A. Disparities in urban neighborhood conditions: Evidence from GIS measures and field observation in New York City. J. Public Health Policy 2009, 30, S264–S285. [Google Scholar] [CrossRef] [PubMed]
- Costa, P.; Lopes, R. Urban design, public space and the dynamics of creative milieu: A photographic approach to Bairro Alto (Lisbon), Gràcia (Barcelona) and Vila Madalena (São Paulo). J. Urban Des. 2015, 20, 28–51. [Google Scholar] [CrossRef]
- Bereitschaft, B. Equity in neighbourhood walkability? A comparative analysis of three large U.S. cities. Local Environ. 2017. [Google Scholar] [CrossRef]
- Ewing, R.; Handy, S.; Brownson, O.C.; Winston, E. Identifying and measuring urban design qualities related to walkability. J. Phys. Act. Health 2006, 3, 223–240. [Google Scholar] [CrossRef]
- Lynch, K. The Image of the City; Joint Center for Urban Studies: Cambridge, MA, USA, 1960. [Google Scholar]
- Alexander, C.; Ishikawa, S.; Silverstein, M.; Jacobson, M.; Fiksdahl-King, I.; Angel, S. A Pattern Language: Towns, Buildings, Construction; Oxford University Press: New York, NY, USA, 1977. [Google Scholar]
- Lennard, S.H.C.; Lennard, H.L.; Bert, P. Livable Cities—People and Places: Social and Design Principles for the Future of the City; Gondolier Press: Southhampton, NY, USA, 1987. [Google Scholar]
- Rapoport, A. History and Precedent in Environmental Design; Kluwer Academic Publishers, Plenum Press: New York, NY, USA, 1990. [Google Scholar]
- Perkins, D.D.; Meeks, J.W.; Taylor, R.B. The physical environment of street blocks and resident perceptions of crime and disorder: Implications for theory and measurement. J. Environ. Psychol. 1992, 12, 21–34. [Google Scholar] [CrossRef]
- Loukaitou-Sideris, A. Is it safe to walk? Neighborhood safety and security considerations and their effects on walking. J. Plan. Lit. 2006, 20, 219–232. [Google Scholar] [CrossRef]
- Borst, H.C.; Vries, S.I.; Graham, J.M.A.; van Dongen, J.E.F.; Bakker, I.; Miedema, H.M.E. Influence of environmental street chracteristics on walking route choice of elderly people. J. Environ. Psychol. 2009, 29, 477–484. [Google Scholar] [CrossRef]
- Pikora, T.; Giles-Corti, B.; Bull, F.; Jamrozik, K.; Donovan, R. Developing a framework for assessment of the environmental determinants of walking and cycling. Soc. Sci. Med. 2003, 56, 1693–1703. [Google Scholar] [CrossRef]
- Villaveces, A.; Nieto, L.A.; Ortega, D.; Rios, J.F.; Medina, J.J.; Gutierrez, M.I.; Rodriguez, D. Pedestrians’ perceptions of walkability and safety in relation to the built environment in Cali, Columbia, 2009–2010. Inj. Prev. 2012, 18, 291–297. [Google Scholar] [CrossRef] [PubMed]
- Cullen, G. The Concise Townscape; Van Nostrand Publishing: New York, NY, USA, 1971. [Google Scholar]
- Harvey, C.; Aultman-Hall, L. Measuring urban streetscapes for livability: A review of approaches. Prof. Geogr. 2016, 68, 149–158. [Google Scholar] [CrossRef]
- Jacobs, A. Great Streets; MIT Press: Cambridge, MA, USA, 1993. [Google Scholar]
- Mooney, S.J.; DiMaggio, C.J.; Lovasi, G.S.; Neckerman, K.M.; Bader, M.D.M.; Teitler, J.O.; Sheehan, D.M.; Jack, D.W.; Rundle, A.G. Use of Google Street View to assess environmental contributions to pedestrian injury. Am. J. Public Health 2016, 106, 462–469. [Google Scholar] [CrossRef] [PubMed]
- Morçöl, G.; Wolf, J.F. Understanding business improvement districts: A new governance framework. Public Adm. Rev. 2010, 70, 906–913. [Google Scholar] [CrossRef]
- Alfonzo, M. To walk or not to walk? The hierarchy of walking needs. Environ. Behav. 2005, 37, 808–836. [Google Scholar] [CrossRef]
- Litman, T.A. Economic value of walkability. In Proceedings of the Transportation Research Board, 82nd Annual Meeting, Washington, DC, USA, 14–15 September 2009; pp. 2703–2731. [Google Scholar]
- Maibach, E.; Steg, L.; Anable, J. Promoting physical activity and reducing climate change: Opportunities to replace short car trips with active transportation. Prev. Med. 2009, 49, 326–327. [Google Scholar] [CrossRef] [PubMed]
- Rogers, S.H.; Gardner, K.H.; Carlson, C.H. Social capital and walkability as social aspects of sustainability. Sustainability 2013, 5, 3473–3483. [Google Scholar] [CrossRef]
- U.S. Green Building Council (USGBC). LEED 2009 for Neighborhood Development. 2009. Available online: http://www.usgbc.org/sites/default/files/LEED%202009%20RS_ND_07.01.14_current%20version.pdf (accessed on 26 June 2017).
- Immergluck, D. Large redevelopment initiatives, housing values and gentrification: The case of the Atlanta beltline. Urban Stud. 2009, 46, 1725–1747. [Google Scholar] [CrossRef]
- Levy, D.K.; Comey, J.; Padilla, S. In the face of gentrification: Case studies of local efforts to mitigate displacement. J. Afford. Hous. Community Dev. Law 2007, 16, 238–315. [Google Scholar]
- Ley, D.; Dobson, C. Are there limits to gentrification? The contexts of impeded gentrification in Vancouver. Urban Stud. 2008, 45, 2471–2498. [Google Scholar] [CrossRef]
- Kim, J. Achieving mixed income communities through infill? The effect of infill housing on neighborhood income diversity. J. Urban Aff. 2016, 31, 280–297. [Google Scholar] [CrossRef]


| Neighborhood | ||||||
|---|---|---|---|---|---|---|
| Squirrel Hill | Homestead | Lawrenceville | Wilkinsburg | Dormont | Hill District | |
| Walk Score® | 92 | 90 | 85 | 83 | 75 | 77 |
| Social Vuln. | Low | High | Low | High | Low | High |
| # Block Groups | 3 | 1 | 2 | 2 | 3 | 3 |
| Main Corridor | Forbes Ave. | E 8th Ave. | Butler St. | Penn Ave. | W. Liberty Ave. | Centre Ave. |
| Population | 3673 | 1212 | 2317 | 886 | 3429 | 2907 |
| % 65+ | 18.8 | 23.5 | 15.0 | 23.1 | 11.2 | 30.3 |
| % Poverty | 9.4 | 40.5 | 17.5 | 31.0 | 9.0 | 40.4 |
| % Minority | 7.4 | 76.6 | 17.9 | 92.1 | 3.2 | 89.4 |
| % No College | 10.6 | 48.3 | 36.9 | 56.4 | 32.5 | 63.5 |
| % Service Occ. | 6.0 | 36.4 | 18.0 | 42.2 | 20.0 | 37.2 |
| Pedestrians/minute | 5.75 | 1.75 | 5.11 | 1.85 | 2.5 | 3.65 |
| Neighborhood | Squirrel Hill | Homestead | Lawrenceville | Wilkinsburg | Dormont | Hill District |
|---|---|---|---|---|---|---|
| Walk Score | 92 | 90 | 85 | 83 | 75 | 77 |
| Imageability | ||||||
| historic buildings | ||||||
| courtyards, plazas, parks | ||||||
| major landscape features | ||||||
| place signs/identifiers | ||||||
| Enclosure | ||||||
| contiguous street wall | ||||||
| limited sight lines | ||||||
| overhangs & vegetation | ||||||
| road width to building height | ||||||
| Human Scale | ||||||
| street furniture | ||||||
| building height & setback | ||||||
| street vendors | ||||||
| Transparency | ||||||
| first floor windows | ||||||
| active uses/occupied storefronts | ||||||
| Complexity | ||||||
| pedestrian activity | ||||||
| businesses density | ||||||
| business type variety | ||||||
| building identifier variety | ||||||
| building color & design variety | ||||||
| outdoor dining | ||||||
| public art | ||||||
| street performers/entertainers | ||||||
| Safety & Sensations | ||||||
| crosswalks & ped. infrastructure | ||||||
| traffic density & speed | ||||||
| noise | ||||||
| smells | ||||||
| Tidiness | ||||||
| sidewalk condition | ||||||
| storefront/building condition | ||||||
| litter | ||||||
| graffiti | ||||||
| healthy/maintained vegetation | ||||||
| Condition: | Good | Moderate | Poor |
© 2017 by the author. Licensee MDPI, Basel, Switzerland. This article is an open access article distributed under the terms and conditions of the Creative Commons Attribution (CC BY) license (http://creativecommons.org/licenses/by/4.0/).
Share and Cite
Bereitschaft, B. Equity in Microscale Urban Design and Walkability: A Photographic Survey of Six Pittsburgh Streetscapes. Sustainability 2017, 9, 1233. https://doi.org/10.3390/su9071233
Bereitschaft B. Equity in Microscale Urban Design and Walkability: A Photographic Survey of Six Pittsburgh Streetscapes. Sustainability. 2017; 9(7):1233. https://doi.org/10.3390/su9071233
Chicago/Turabian StyleBereitschaft, Bradley. 2017. "Equity in Microscale Urban Design and Walkability: A Photographic Survey of Six Pittsburgh Streetscapes" Sustainability 9, no. 7: 1233. https://doi.org/10.3390/su9071233
APA StyleBereitschaft, B. (2017). Equity in Microscale Urban Design and Walkability: A Photographic Survey of Six Pittsburgh Streetscapes. Sustainability, 9(7), 1233. https://doi.org/10.3390/su9071233