Article

Error Source Analysis and Correction of GF-3 Polarimetric Data

1
Key Laboratory of Technology in Geo-spatial Information Processing and Application System, Institute of Electronics, Chinese Academy of Sciences, Beijing 100190, China
2
Institute of Electronics, Chinese Academy of Sciences, Beijing 100190, China
3
University of Chinese Academy of Sciences, Beijing 100190, China
*
Author to whom correspondence should be addressed.
Remote Sens. 2018, 10(11), 1685; https://doi.org/10.3390/rs10111685 (registering DOI)
Submission received: 23 September 2018 / Revised: 20 October 2018 / Accepted: 23 October 2018 / Published: 25 October 2018
(This article belongs to the Section Remote Sensing Image Processing)

Abstract

:
The GaoFen-3 (GF-3) satellite is the first polarimetric synthetic aperture radar (PolSAR) satellite in China. With a designed in-orbit life of 8 years, it will provide large amounts of PolSAR data for ocean monitoring, disaster reduction, and many other applications. The polarimetric data quality is essential for all these applications, so the analysis and calibration of the polarimetric error sources are very important for GF-3. In this study, we established a full-link error model for GF-3 PolSAR system. Based on this model, we comprehensively analyzed the quantitative effects of the main error sources including the composition, figured out characteristics of the phase imbalance introduced by the antenna, and pointed out the error sources which have to be corrected. Furthermore, the polarimetric correction method for GF-3 PolSAR system is proposed. Finally, assisted by several external calibration experiments, polarimetric errors of GF-3 data are efficiently corrected during in-orbit-test phase.

1. Introduction

The first multi-polarization SAR in China, GaoFen-3 (GF-3) satellite, was launched on 10 August 2016. Table 1 shows all the GF-3 work modes and the imaging capability of each mode, where the satellite has 12 work modes including Strip, Scan, Sliding-Spotlight Mode, and also Wave Imaging Mode for marine applications. All working modes of GF-3 are available in either left- or right-looking orientation. Through the combination and switching of multiple imaging modes, the GF-3 satellite can acquire multi-polarization imagery, and can achieve a spatial resolution of 1 m to 500 m and a swap width ranging from 10 km to 650 km [1,2]. Therefore, the GF-3 satellite can meet the needs of a wide-range surveys and detailed investigation of specific areas. With a design life of 8 years, the GF-3 satellite will obtain a large amount of data and play an important role in remote sensing applications of China, including ocean monitoring [3], disaster reduction, water conservancy [4], meteorology, and so on.
As the first full Polarimetric SAR (PolSAR) satellite in China, the quality of the PolSAR image is on a high degree of attention. However, the data acquisition of a PolSAR system is affected by many error sources, such as magneto-ionic propagation [5], central electronic equipment, antenna [6], satellite attitude [7], and so on. Therefore, the calibration and the correction of the polarimetric error is a very important procedure for generating the high quality PolSAR image products. The GF-3 satellite obtains full-polarization images by alternately transmitting horizontal (H) and vertical (V) polarized pulses and receiving backscattering signals in both H and V polarization [8]. It possesses two Full Polarized Strip Modes (QPSI and QPSII). The ground range resolution and the swath width of QPSI are 8 m/30 km while QPSII are 25 m/40 km. With these Full Polarized Modes, there are more than 40 beams in both right- and left-looking orientation, while the look angle ranges from 18.8° to 42.8°. Additionally, all beams have multiple options of bandwidth and pulse duration. With these multiple polarization modes, multiple beams and multiple bandwidths, GF-3 PolSAR can obtain more than 250 kinds of data under different system conditions, which may cause different polarimetric errors. So, GF-3 polarimetric calibration tasks face the challenge of guaranteeing the PolSAR data quality in each observing case. The product generation software of the GF-3 ground segment was developed by the Institute of Electronics, Chinese Academy of Sciences (IECAS) (details are described in [9]). In this study, we provide the methods used for the polarimetric error source analysis and calibration, and also the quality assessment results of GF-3 polarimetric data after polarimetric correction.
At present, SAR satellites with the capability of polarimetric observation such as SIR-C, RADARSAT-2, TerraSAR-X and ALOS-2 have been successfully launched and calibrated for polarization errors, which provide good references for GF-3 data processing. SIR-C utilized corner reflectors and distributed targets such as grassland to accomplish the polarimetric calibration task [10]. RADARSAT-2, based on amplitude information of rainforest from RADARSAT-1, used the scattering characteristics of the rainforest to eliminate polarimetric distortion [11,12]. TerraSAR-X used the method proposed by Quegan and relied on the distributed targets that satisfy reciprocity and symmetry [13]. ALOS-2 placed corner reflectors in the rainforest region and used the extended Freeman-Van zyl calibration method to extract distortion parameters [14]. In summary, there are quite a number of reports on the external calibration methods for PolSAR satellites. However, as for the various observing cases of GF-3, doing external calibration for every observing case is so time-consuming that very difficult to complete the polarimetric calibration for all GF-3 PolSAR data during the five-month in-orbit-test phase. A more efficient and affordable method is needed for GF-3 polarimetric calibration mission. In this study, several assisted data with external reference calibrators, polarimetric calibration and correction of GF-3 data is efficiently performed during the in-orbit-test phase. The key point of this correction process is that error parameters that must be calibrated by the external calibration are reduced by the establishment of error model and influence analysis of error sources for GF-3 polarimetric system, especially including the analysis of the error component of the antenna part.
The organization of this study is as follows. In Section 2, the full-link error model of polarization observation is given. Then, Section 3 introduces every error source in the error model and comprehensively analyzes their influence on the GF-3 polarization observation. Based on this, the correction method of GF-3 polarimetric data is proposed in Section 4, and the point-target method and the distributed-target method are used to assess the quality of the corrected data. The evaluation results show that the polarimetric correction method is effective and that the quality of corrected PolSAR data satisfies requirements of GF-3 polarimetric performance. Discussion and conclusions are drawn in Section 5 and Section 6, respectively.

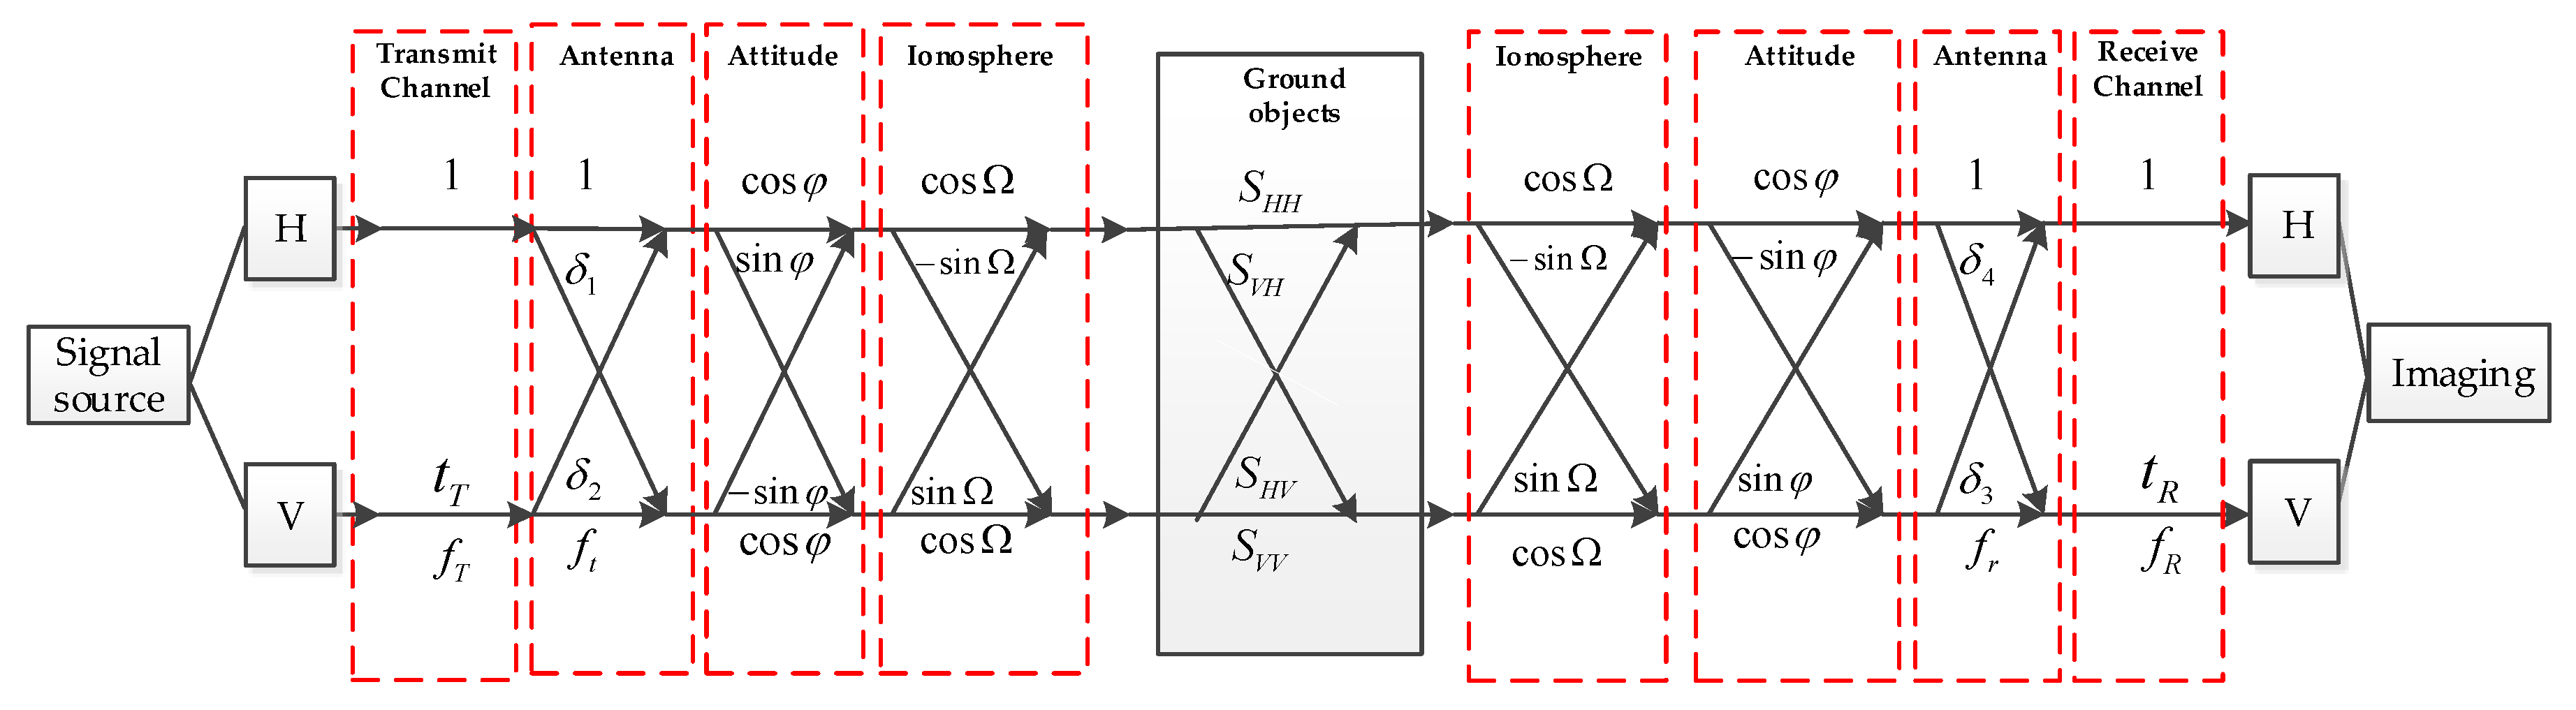
2. Error Model of Polarization Observation

For the GF-3 satellite, pulses are produced by the signal source, pass through the transmit channel, are then radiated by horizontal (H) and vertical (V) antenna array, and finally irradiate ground objects through the ionosphere. As the polarization transformer, ground objects change the polarization direction of the wave. Electromagnetic waves reflected by ground objects again pass through the ionosphere, are received by the H and V antenna array, pass through the H and V receive channels, and are recorded as raw echoes, which serve as the input of the PolSAR image product generator. To describe this complex process with error sources, a full-link error model for GF-3 PolSAR system is proposed in this study and is shown in Figure 1. Channel imbalances stand for the difference of V channel relative to the H channel, so the H channel is set as “1” in Figure 1.
As shown in Figure 1, error contributions throughout the GF-3 PolSAR system include 5 parts: 1) channel imbalances ( f T , f R ) introduced by transmit and receive channel; (2) sampling delay errors ( t T , t R ) introduced by transmit and receive channel; (3) crosstalks ( δ i ) and channel imbalances ( f t , f r ) caused by antenna array [6]; (4) polarization orientation angle (POA, φ ) aroused by satellite attitude [7]; (5) Faraday rotation angle (FR, Ω ) introduced by ionosphere [15]. Combining the influence of all of the error sources, the relationship between measure scattering matrix (M) and real scattering matrix (S) is expressed as Equation (1):
[ M H H M H V M V H M V V ] = A e j Θ [ 1 0 0 f R ] [ 1 δ 3 δ 4 f r ] [ cos φ sin φ sin φ cos φ ] [ cos Ω sin Ω sin Ω cos Ω ] × [ S H H ( t , τ ) S H V ( t t T , τ ) S V H ( t t R , τ ) S V V ( t t T t R , τ ) ] × [ cos Ω sin Ω sin Ω cos Ω ] [ cos φ sin φ sin φ cos φ ] [ 1 δ 2 δ 1 f t ] [ 1 0 0 f T ]
where A and Θ are absolute amplitude and phase factors of system, M p q is the measured signal for the polarization p q , S p q is the target scattering value for the polarization p q , t and τ mean the time axis of range and azimuth, respectively. Here, p q means different polarization combinations, where received by p polarization and transmitted by q polarization.

3. Influence Analysis of Error Source

Based on the above full-link error model of GF-3 polarization observation, this section details all error sources and their calibration methods. Additionally, the influence of every error source on GF-3 polarization observation is quantitatively analyzed, and the main error sources which have to be corrected are pointed out.

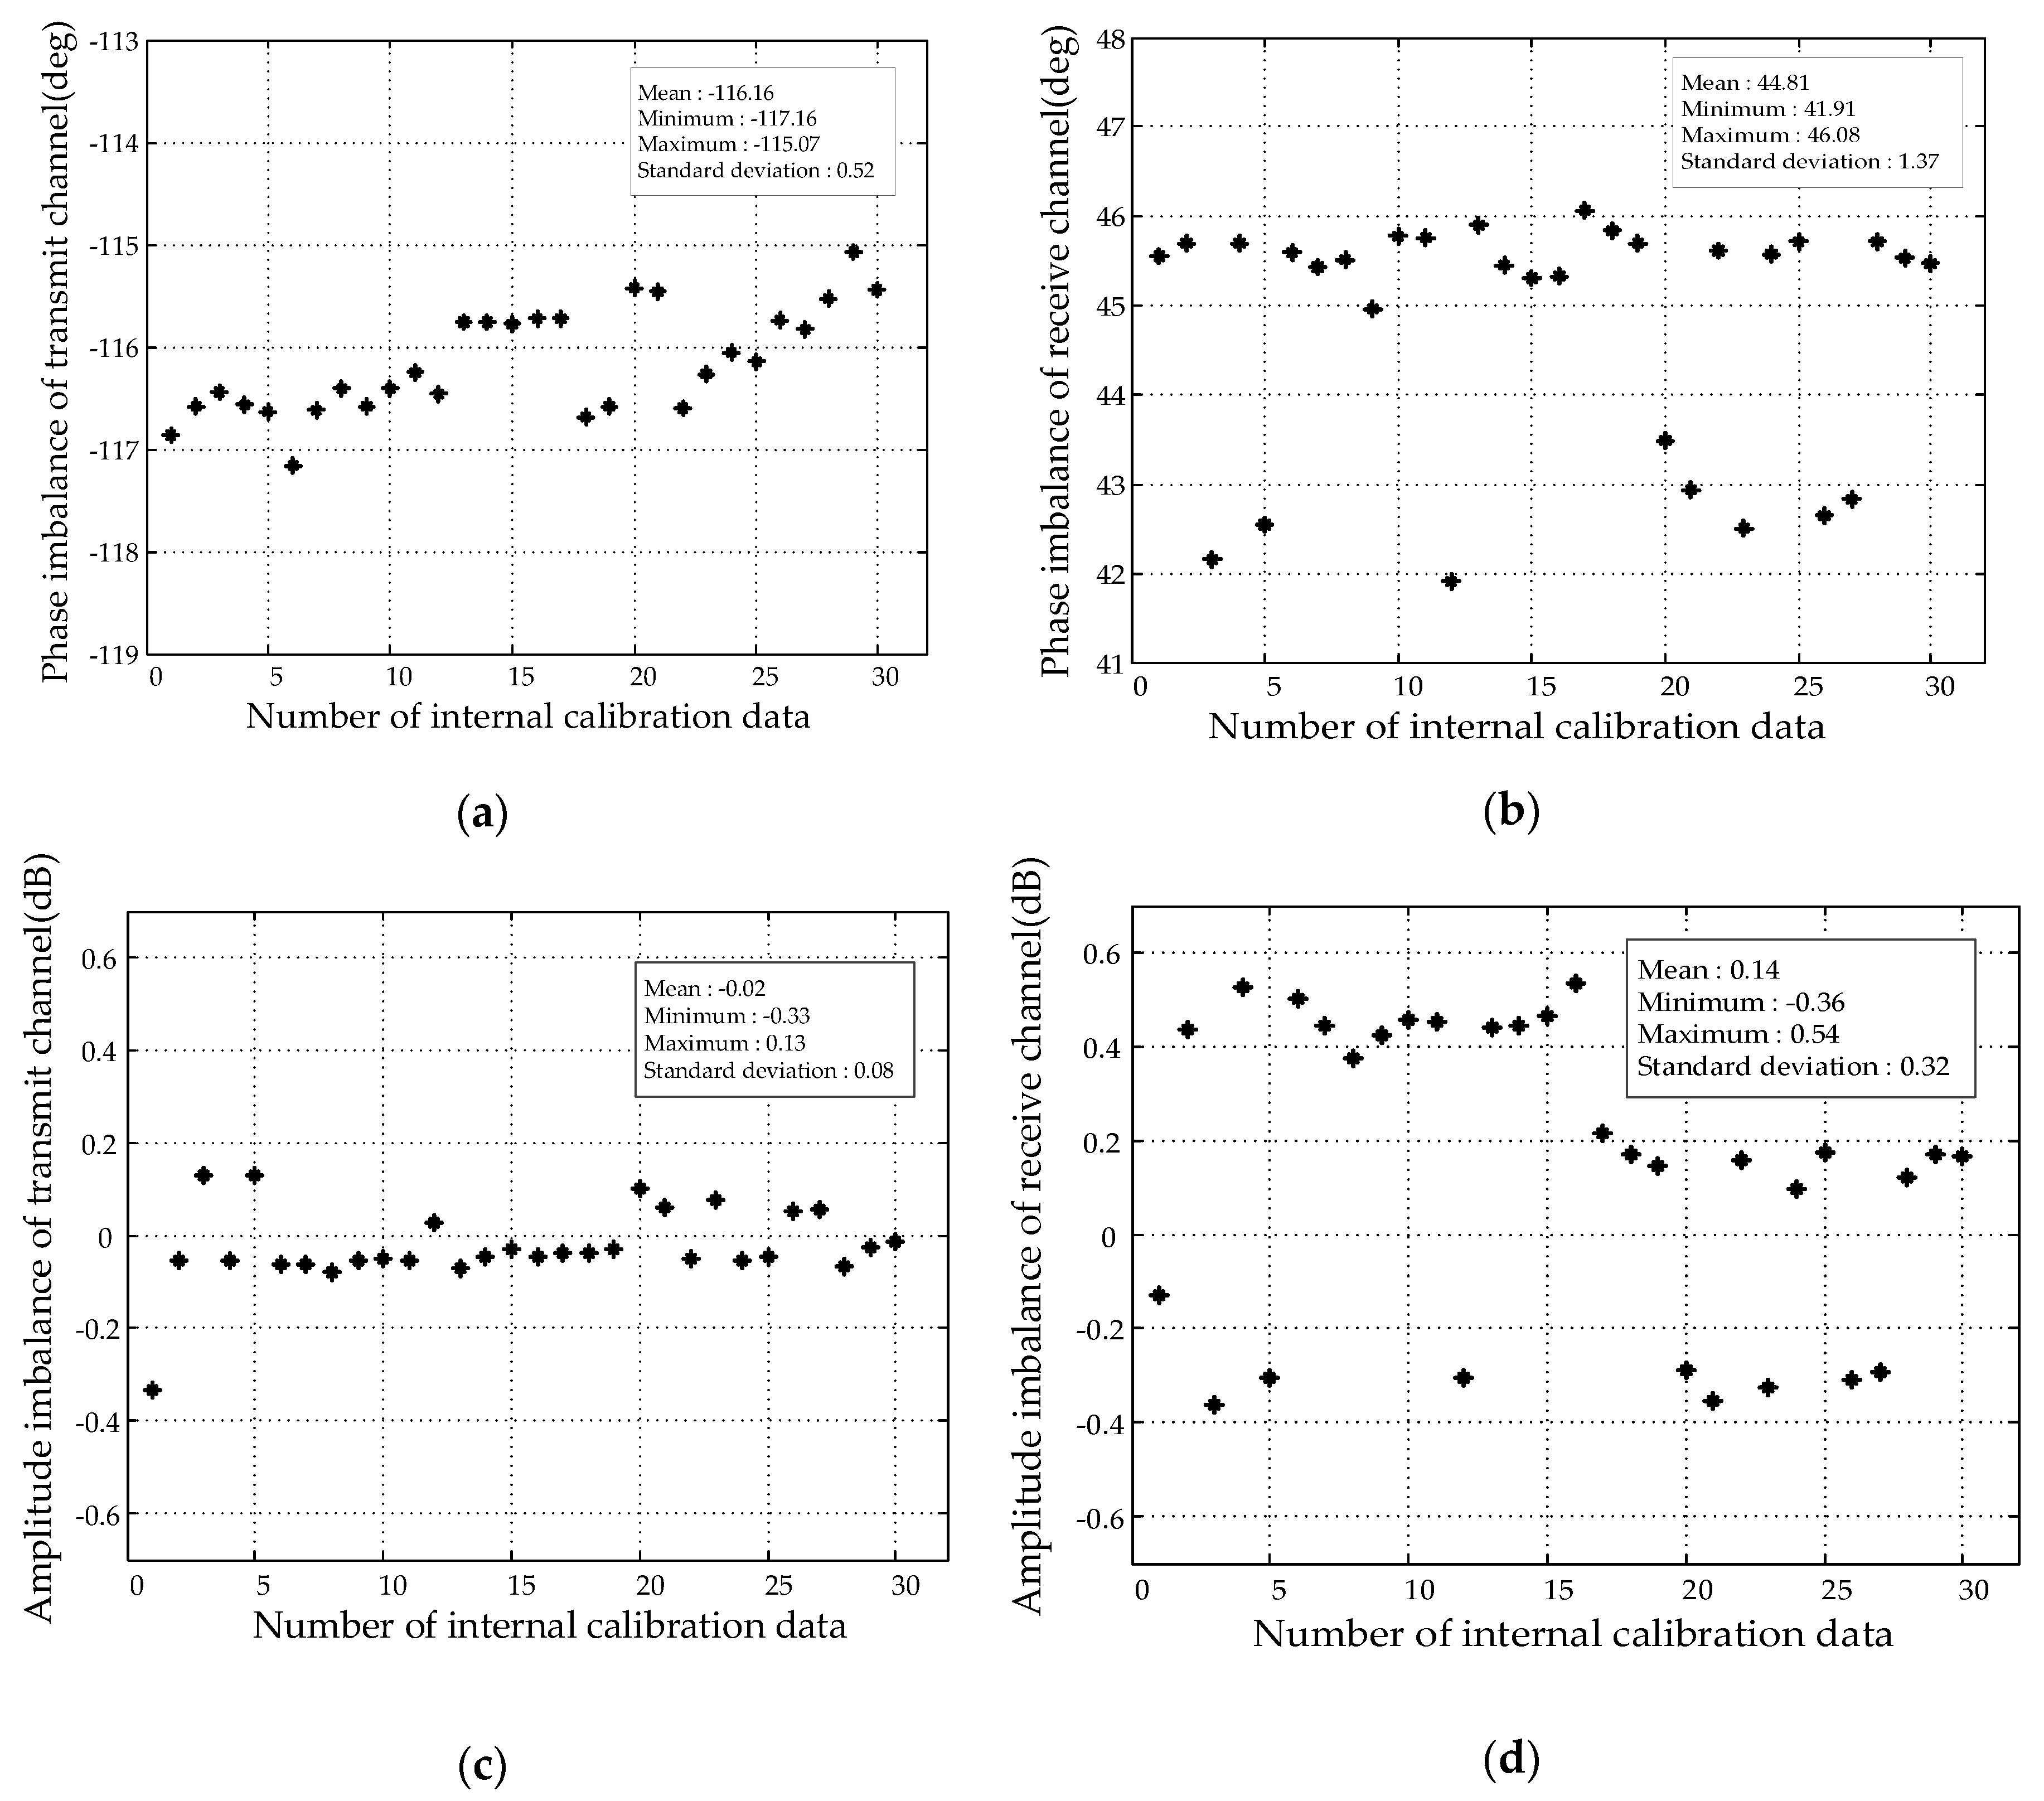
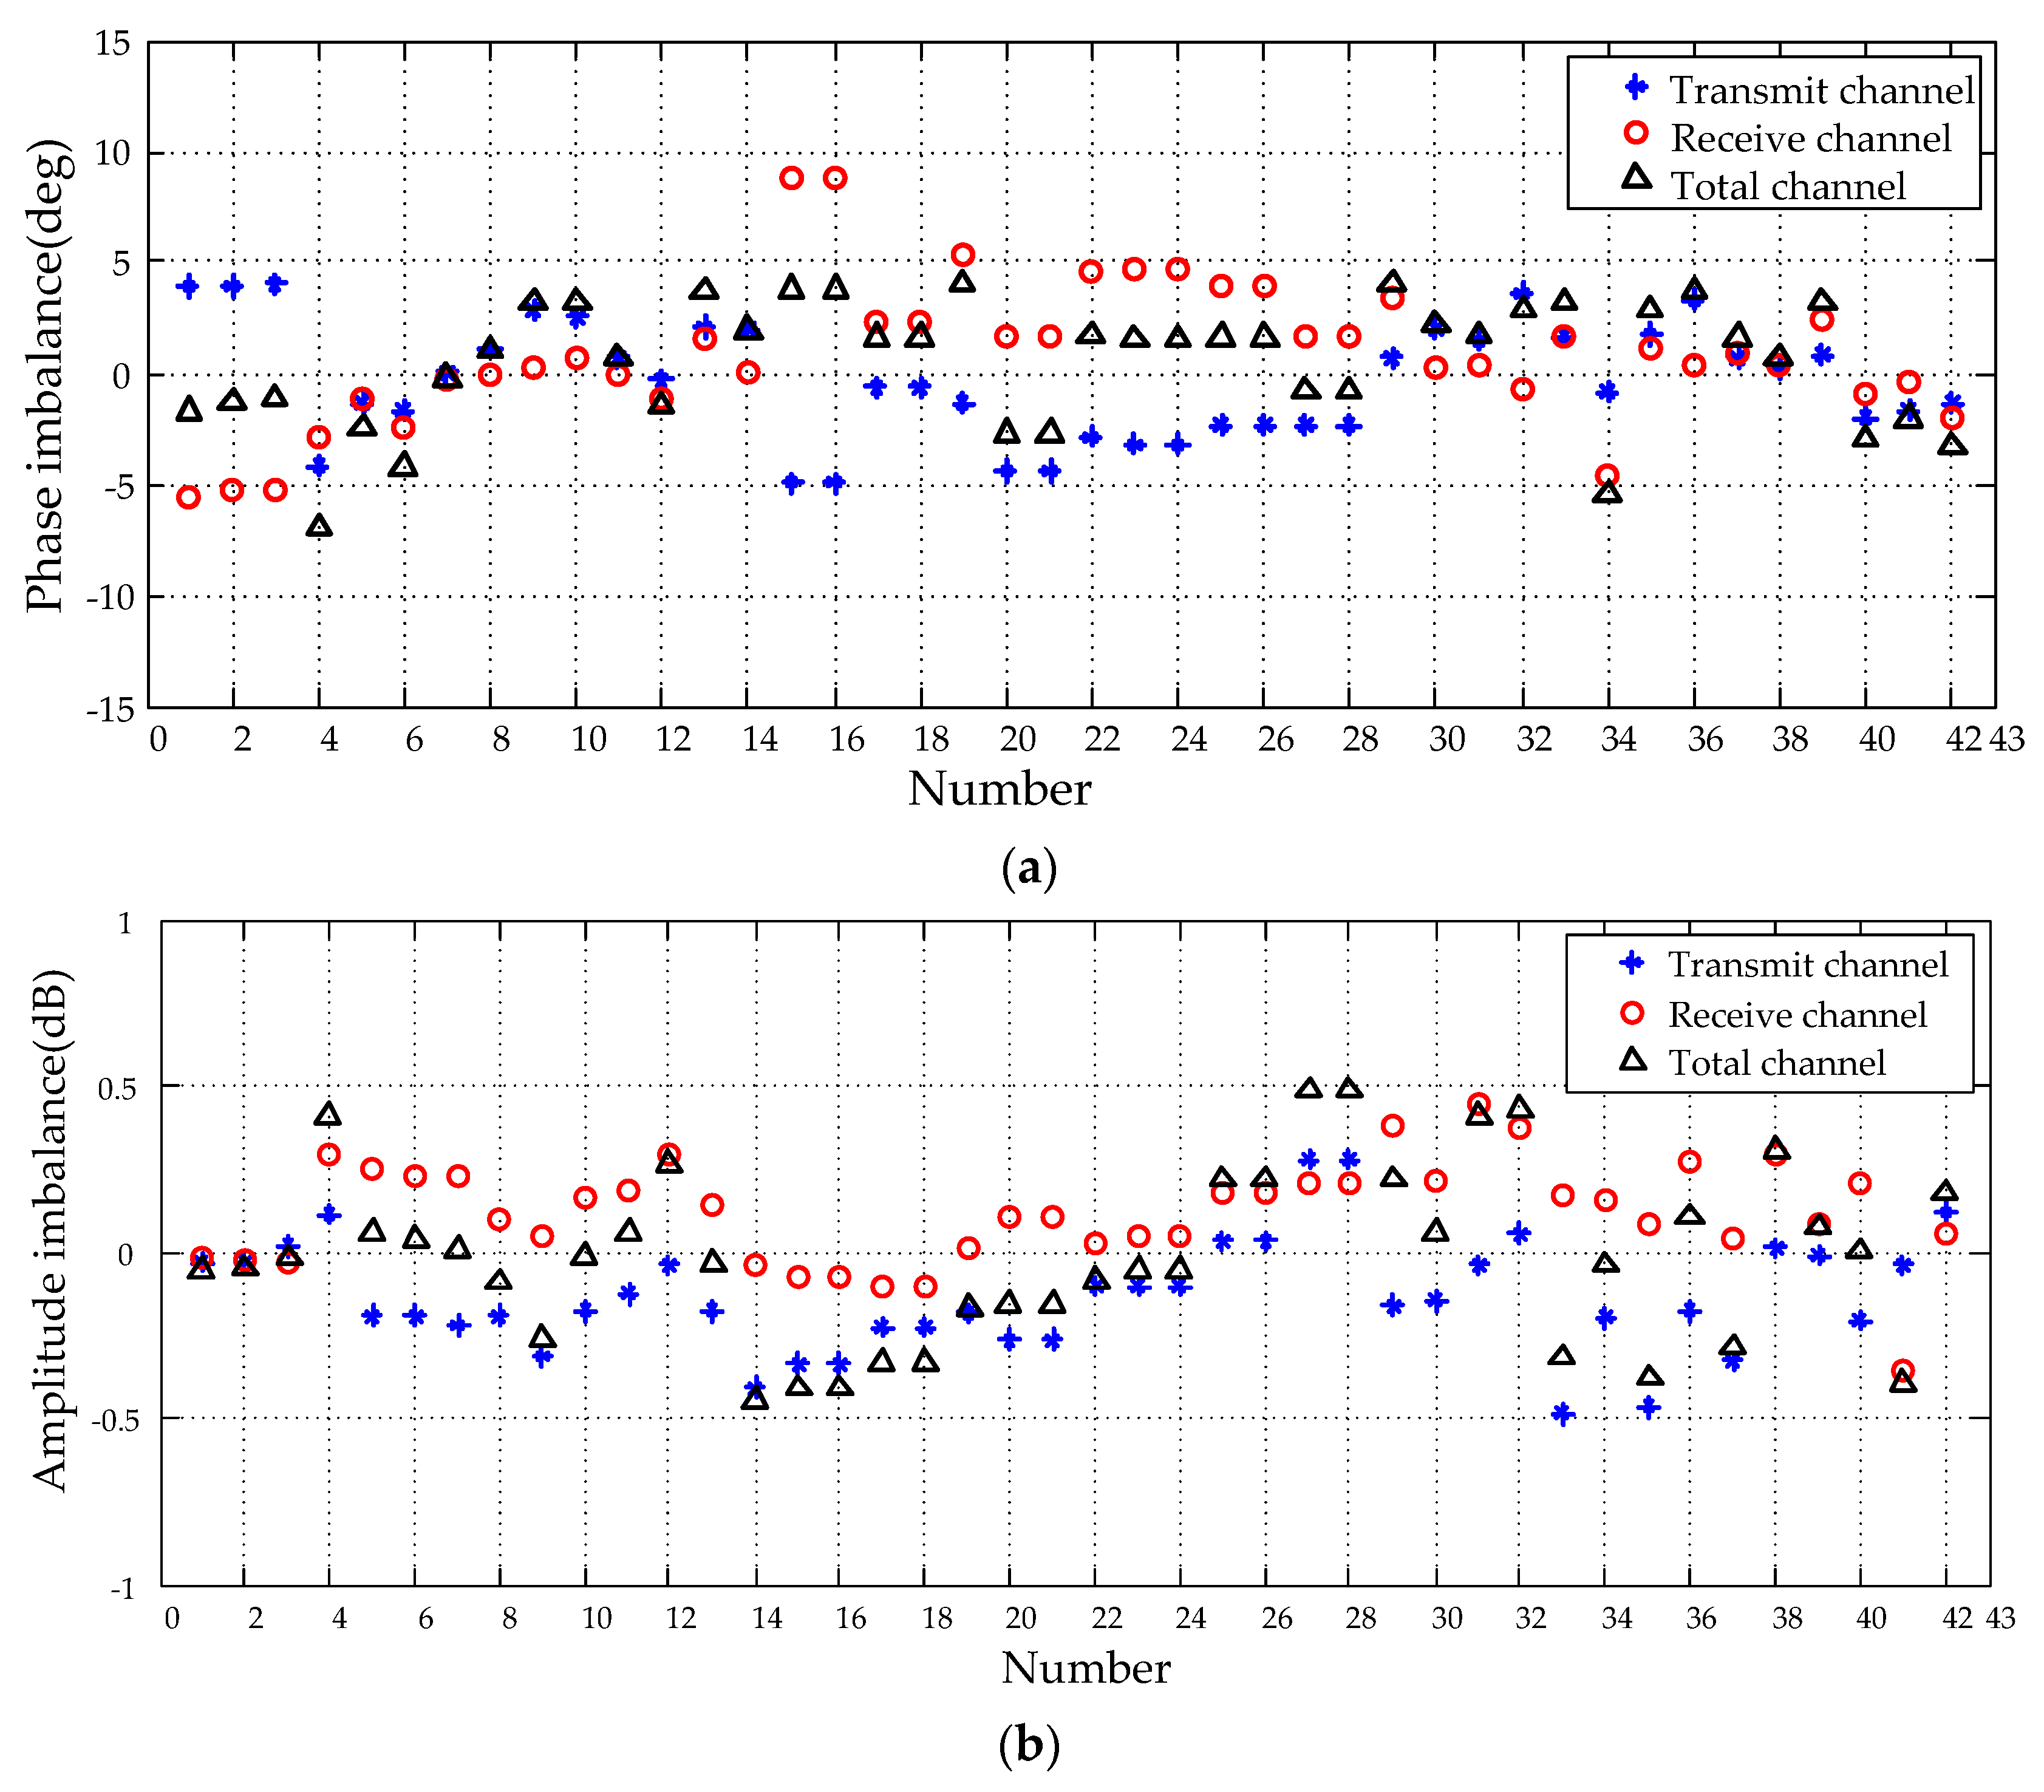
3.1. Channel Imbalances of Transmit and Receive Channel

Due to the non-ideality of the hardware, gains are different between H and V polarization channels. Choosing the H polarization as a basis, the ratio of gain between V and H polarization channels is defined as an imbalance, including amplitude and phase. In this study, complex values f T and f R stand for imbalance of transmit and receive channel, respectively.
Like other space-borne PolSAR satellites [16,17,18], the GF-3 satellite implements an internal calibration system [2]. Internal calibration can track the performance of the radar system by transmitting calibration pulses and receiving them through a dedicated internal calibration loop [19]. Fully considering various requirements of calibration elements, the internal calibration system of GF-3 satellite is designed with multiple calibration loops to improve the calibration accuracy and meet the quantitative application. More details of GF-3 internal system can be found in [8]. Therefore, the imbalance of transmit and receive channel can be determined from the data obtained by the internal calibration system, namely as “internal calibration data” [2,16]. This estimation process can be summarized as follows:
(1)
Extract the four suitable echoes (HH, HV, VH, VV) of the internal calibration loop covering transmit and receive channel from the internal calibration data;
(2)
Do pulse compression and extract the peak amplitude and phase of the four compressed pulses, then calculate the imbalances between the polarization channels;
(3)
Extract the pulses of the reference internal calibration loop, and get the peak amplitude and phase of the compressed pulses, calculate the imbalances caused by the internal calibrator itself.
(4)
Eliminate the imbalances in (3) from the imbalances in (2), then the results of f R and f T can be calculated.
Here, 30 internal calibration data groups of GF-3 Full Polarized Mode are processed to analyze the real situation of channel imbalances. To make the results more representative, these 30 data groups span over four months and cover various beams and bandwidths, the detailed information of which is shown in Table 2. Figure 2 shows the results of f R and f T extracted from these experimental data, which are numbered by using bandwidth as the primary key and time as the secondary key, and sorted in an ascending manner. Results in Figure 2 suggest that phase imbalances are obviously large and non-ignorable. Most amplitude imbalances of transmit channel are small, only 10% of the results are more than 0.1 dB. The receive channel has a larger amplitude imbalance, in which most values distribute around 0.4 dB and some results exceed the requirement of less than 0.5 dB. Thus, imbalances of transmit and receive channel need to be corrected. In addition, imbalance of the receive channel has a large fluctuation where the difference between minimum and maximum is over 4° in phase and close to 0.9 dB in amplitude, while the imbalance of the transmit channel is relatively stable. The difference between transmit and receive channel is mainly due to the fact that the amplifier of the transmit channel operates in the saturation region, while that of the receive channel works in the linear region. In summary, imbalances between the transmit and receive channels have a non-negligible effect on the GF-3 polarization observation and should be well corrected. Variability of them means that f R and f T must be calculated in a timely fashion from the internal calibration data for high accuracy.

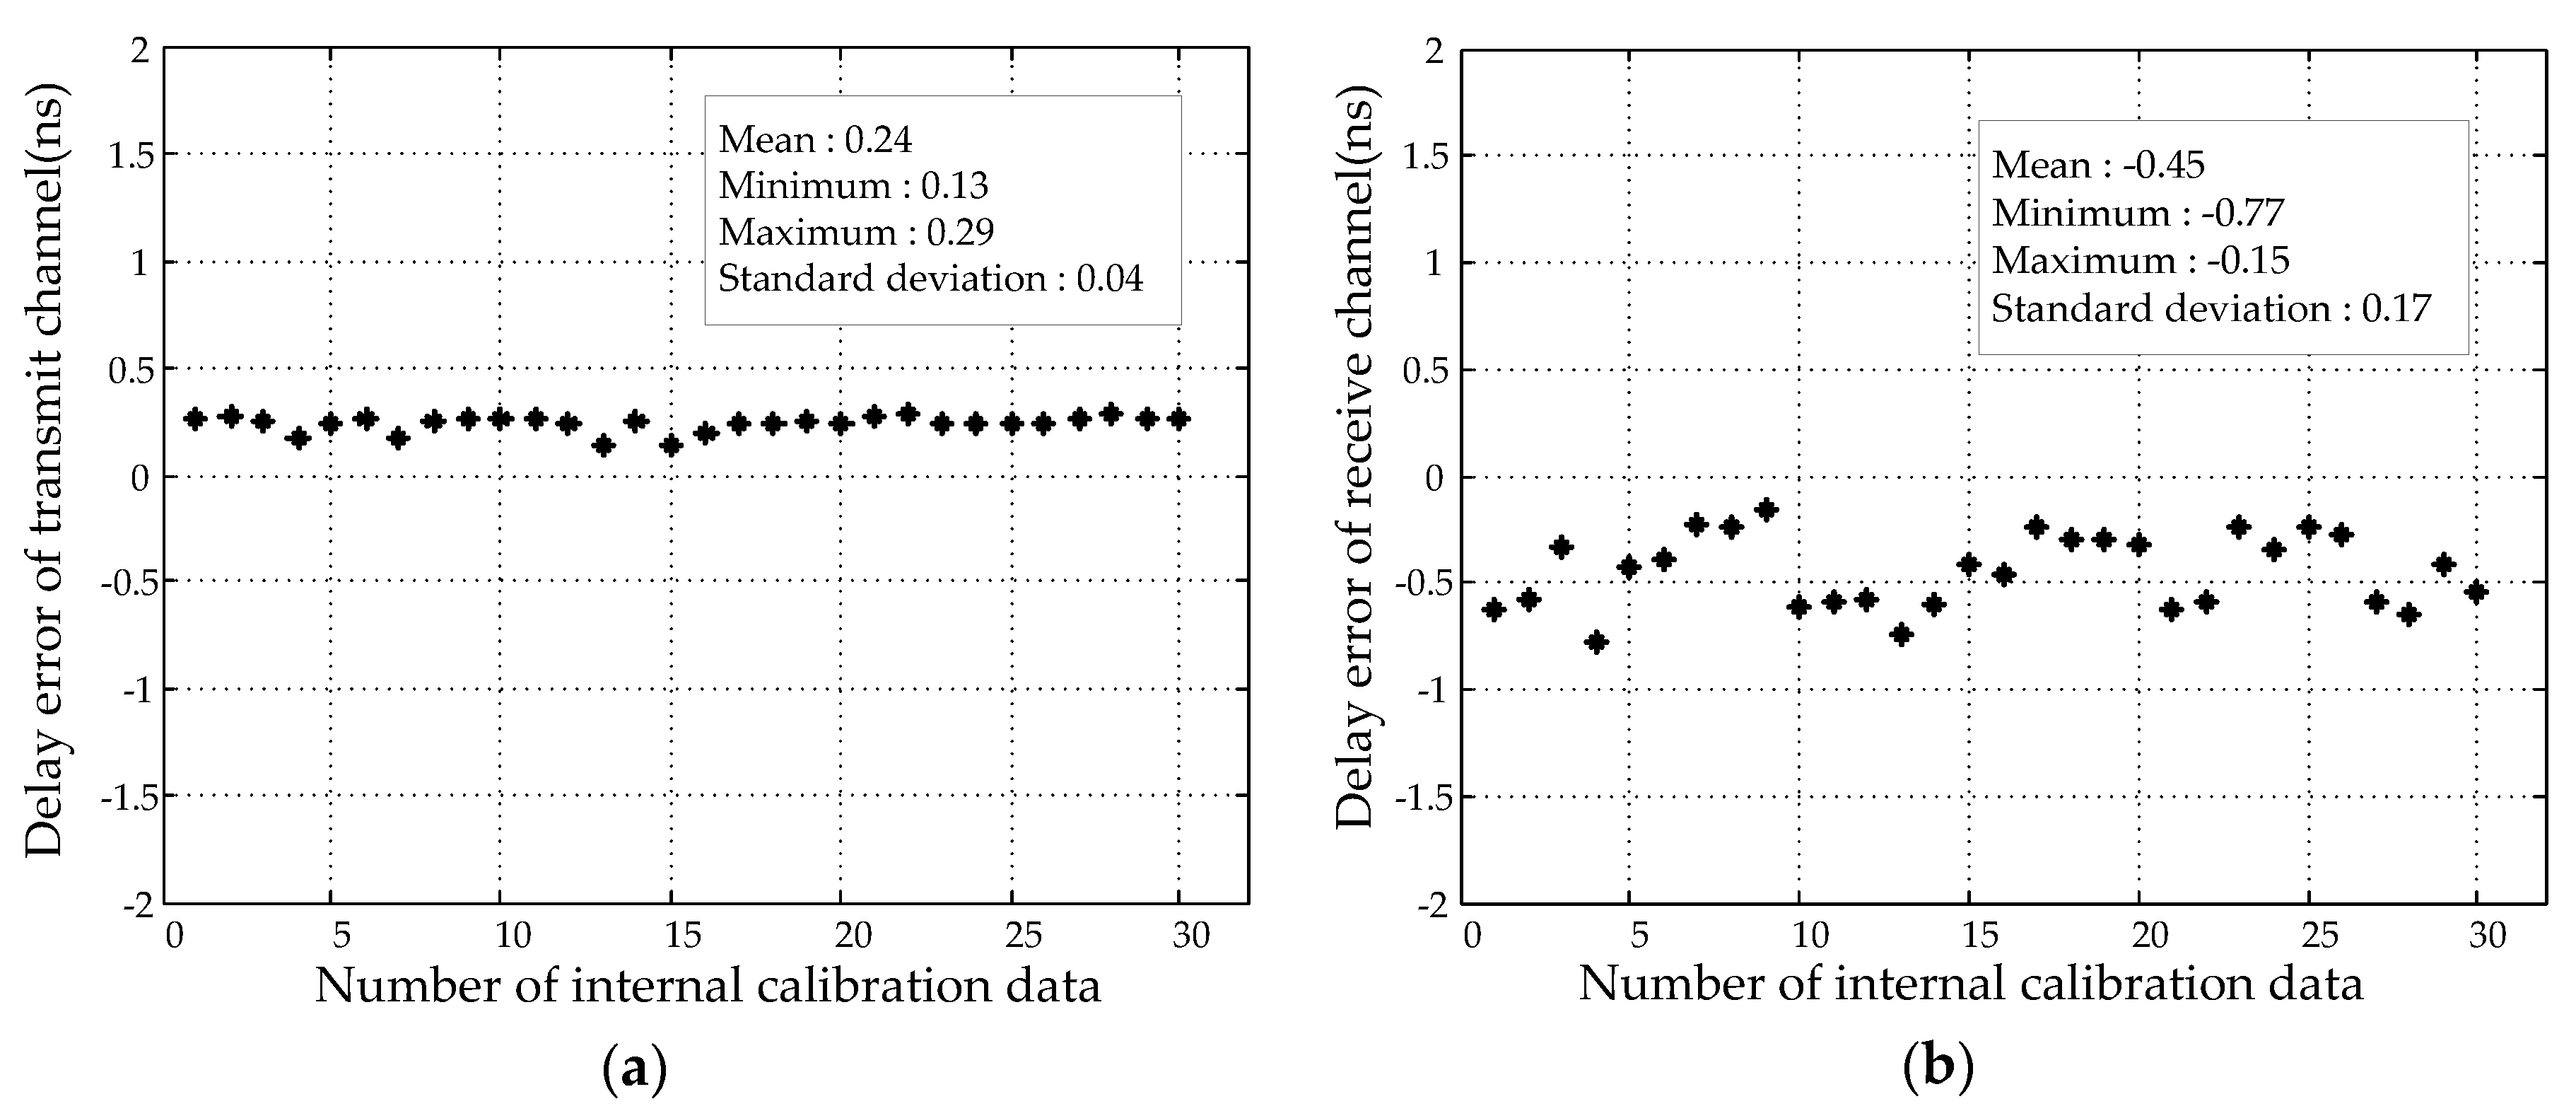
3.2. Sampling Delay Error

Transmit and receive channels not only affect the amplitude and phase of signal, but also produce different delays on the signal [20]. The delay inconsistency between channels leads to the mismatch of four images at range and further affects the application of PolSAR data. The sampling delay error can be measured by the delay difference of V relative to H channel. As shown in Figure 1, these differences of transmit and receive channel are denoted as t T and t R , respectively.
Similar to the extract of channel imbalance in Section 3.1, the sampling delay error can be obtained by comparing the time difference at the peak value of four internal calibration signals after pulse compression. Delay errors of 30 data groups are shown in Figure 3 including statics of all results where the data and number of data is same with the Figure 2. Similar to the imbalance of transmit/receive channel, the t R is more volatile than t T . However, all the delay errors are less than 1 ns. As the minimum sampling interval of range is 15 ns, it can be considered that the channel delay of GF-3 satellite has good consistency and that the influence of sampling delay error can be ignored.

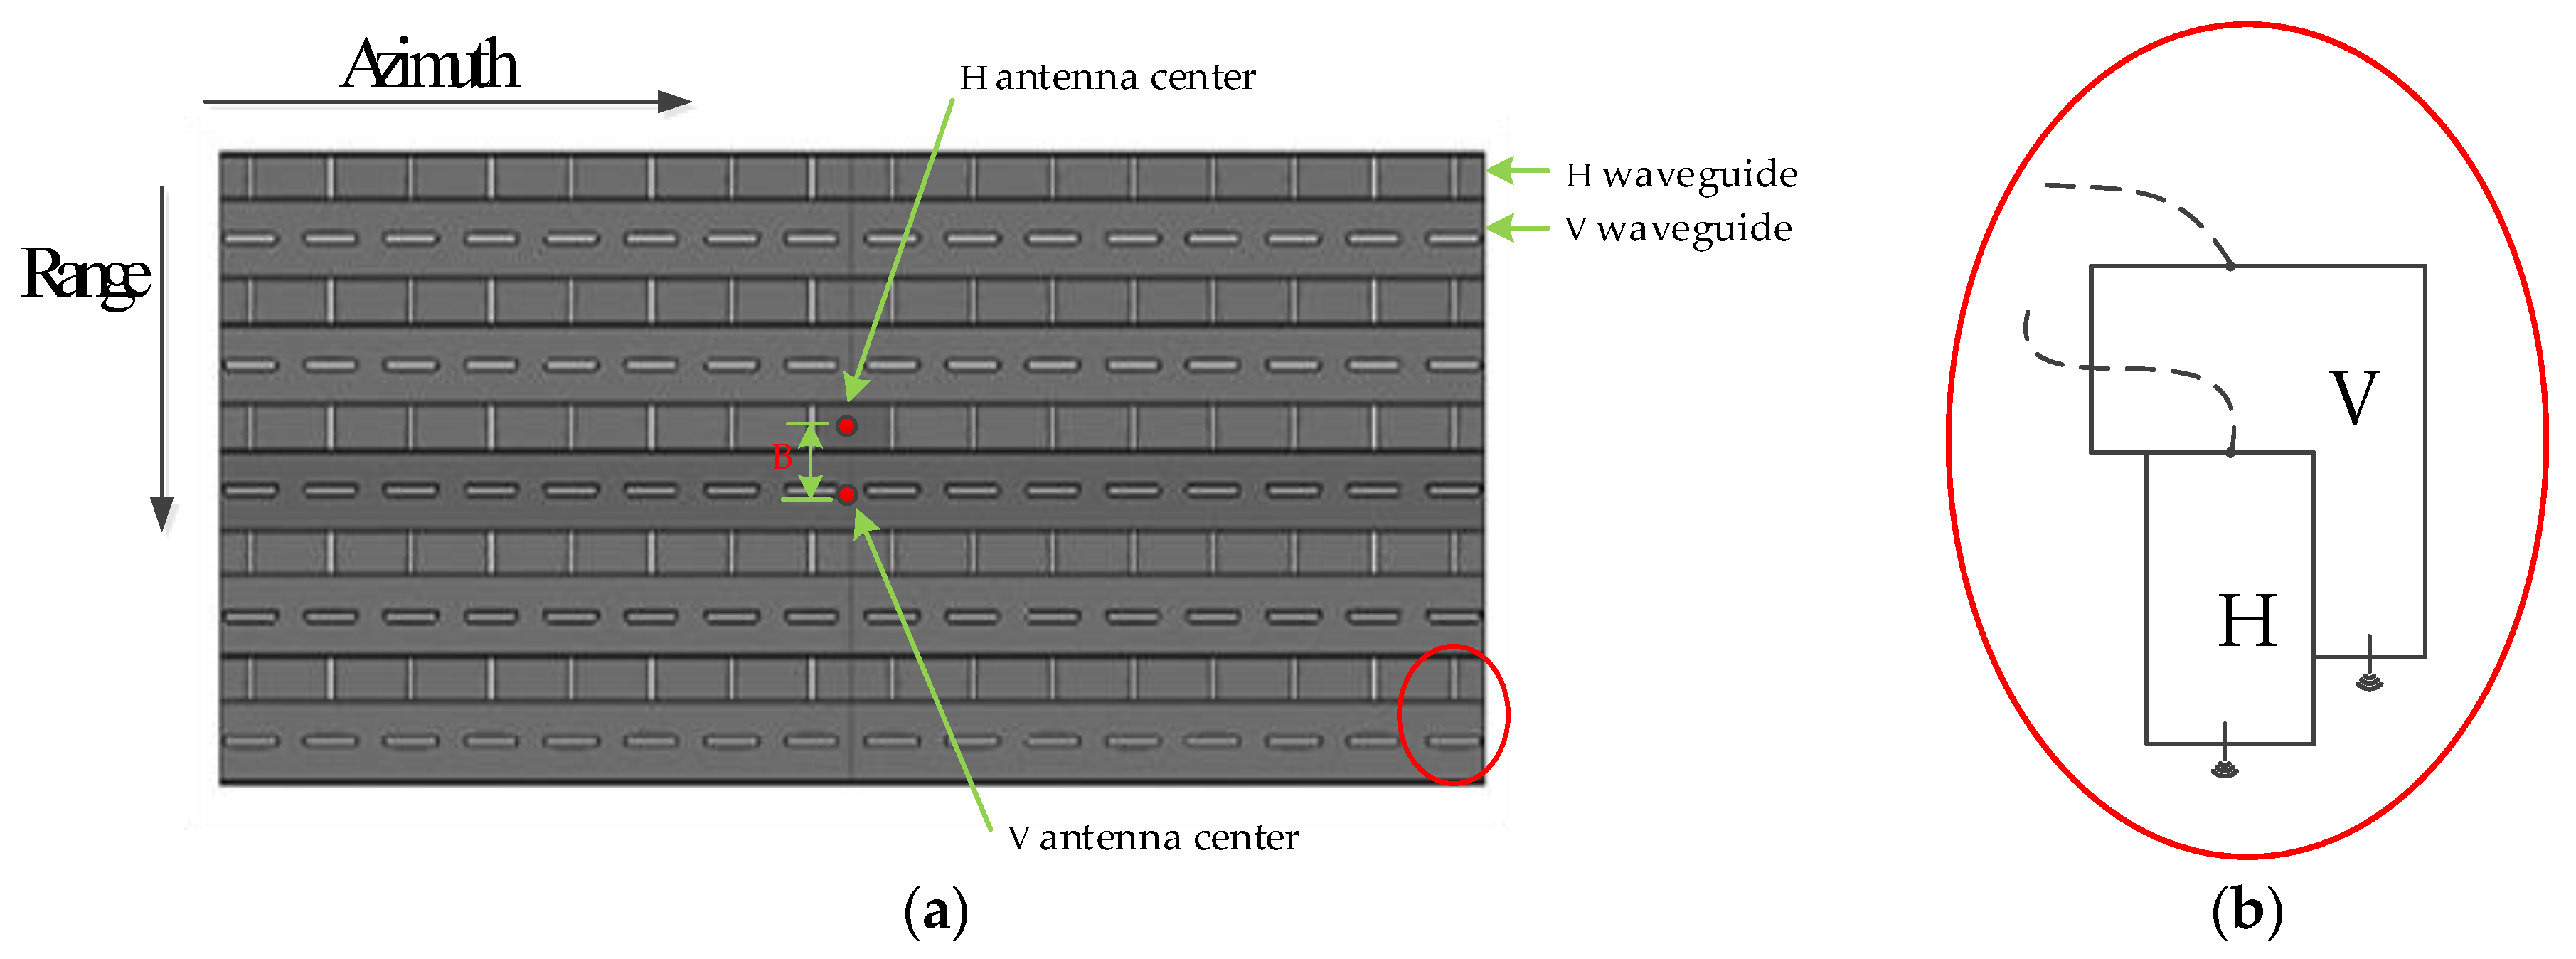
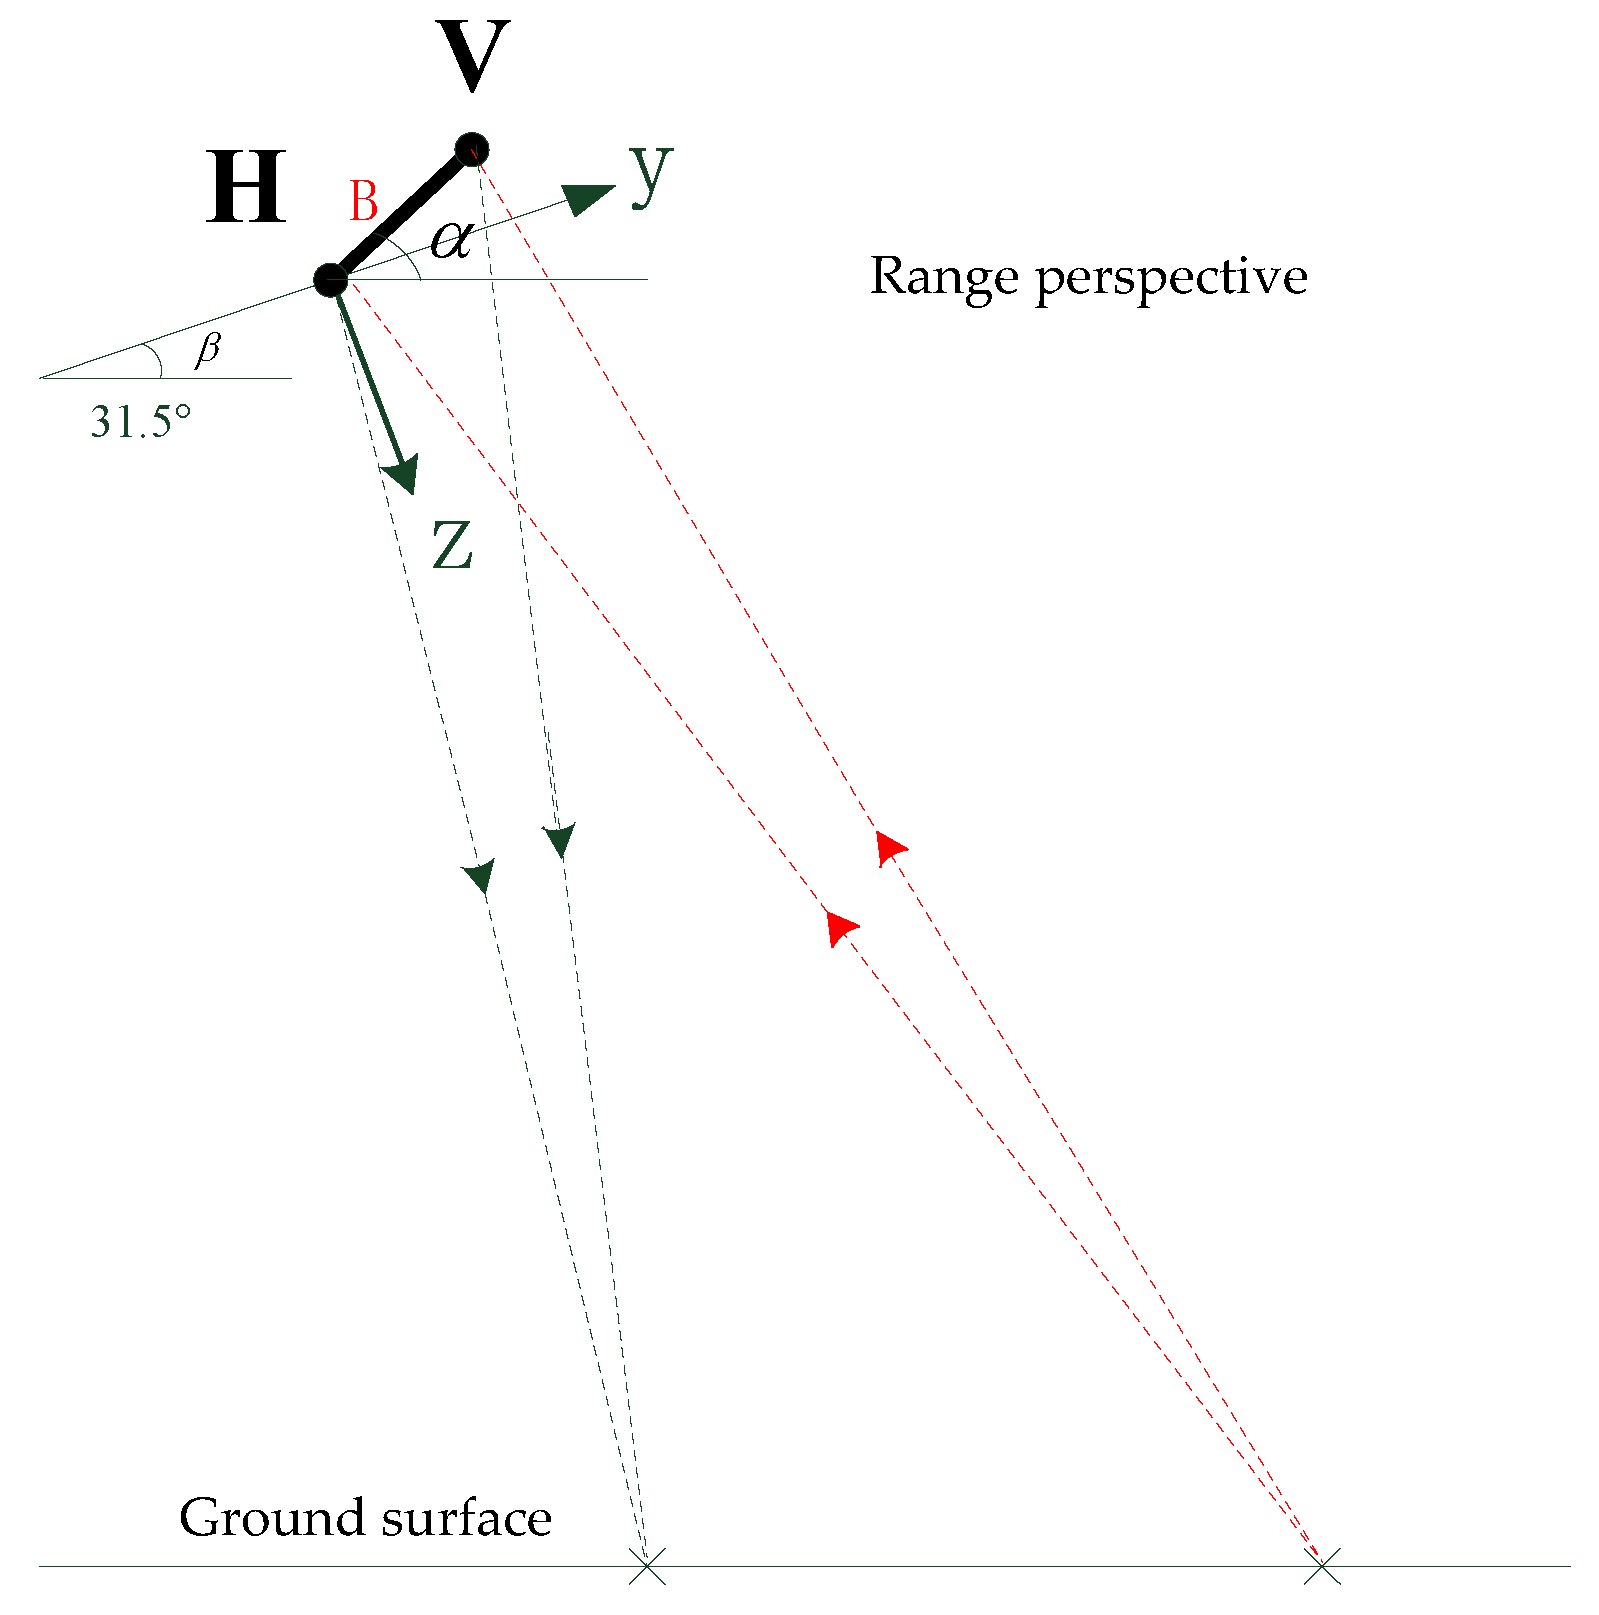
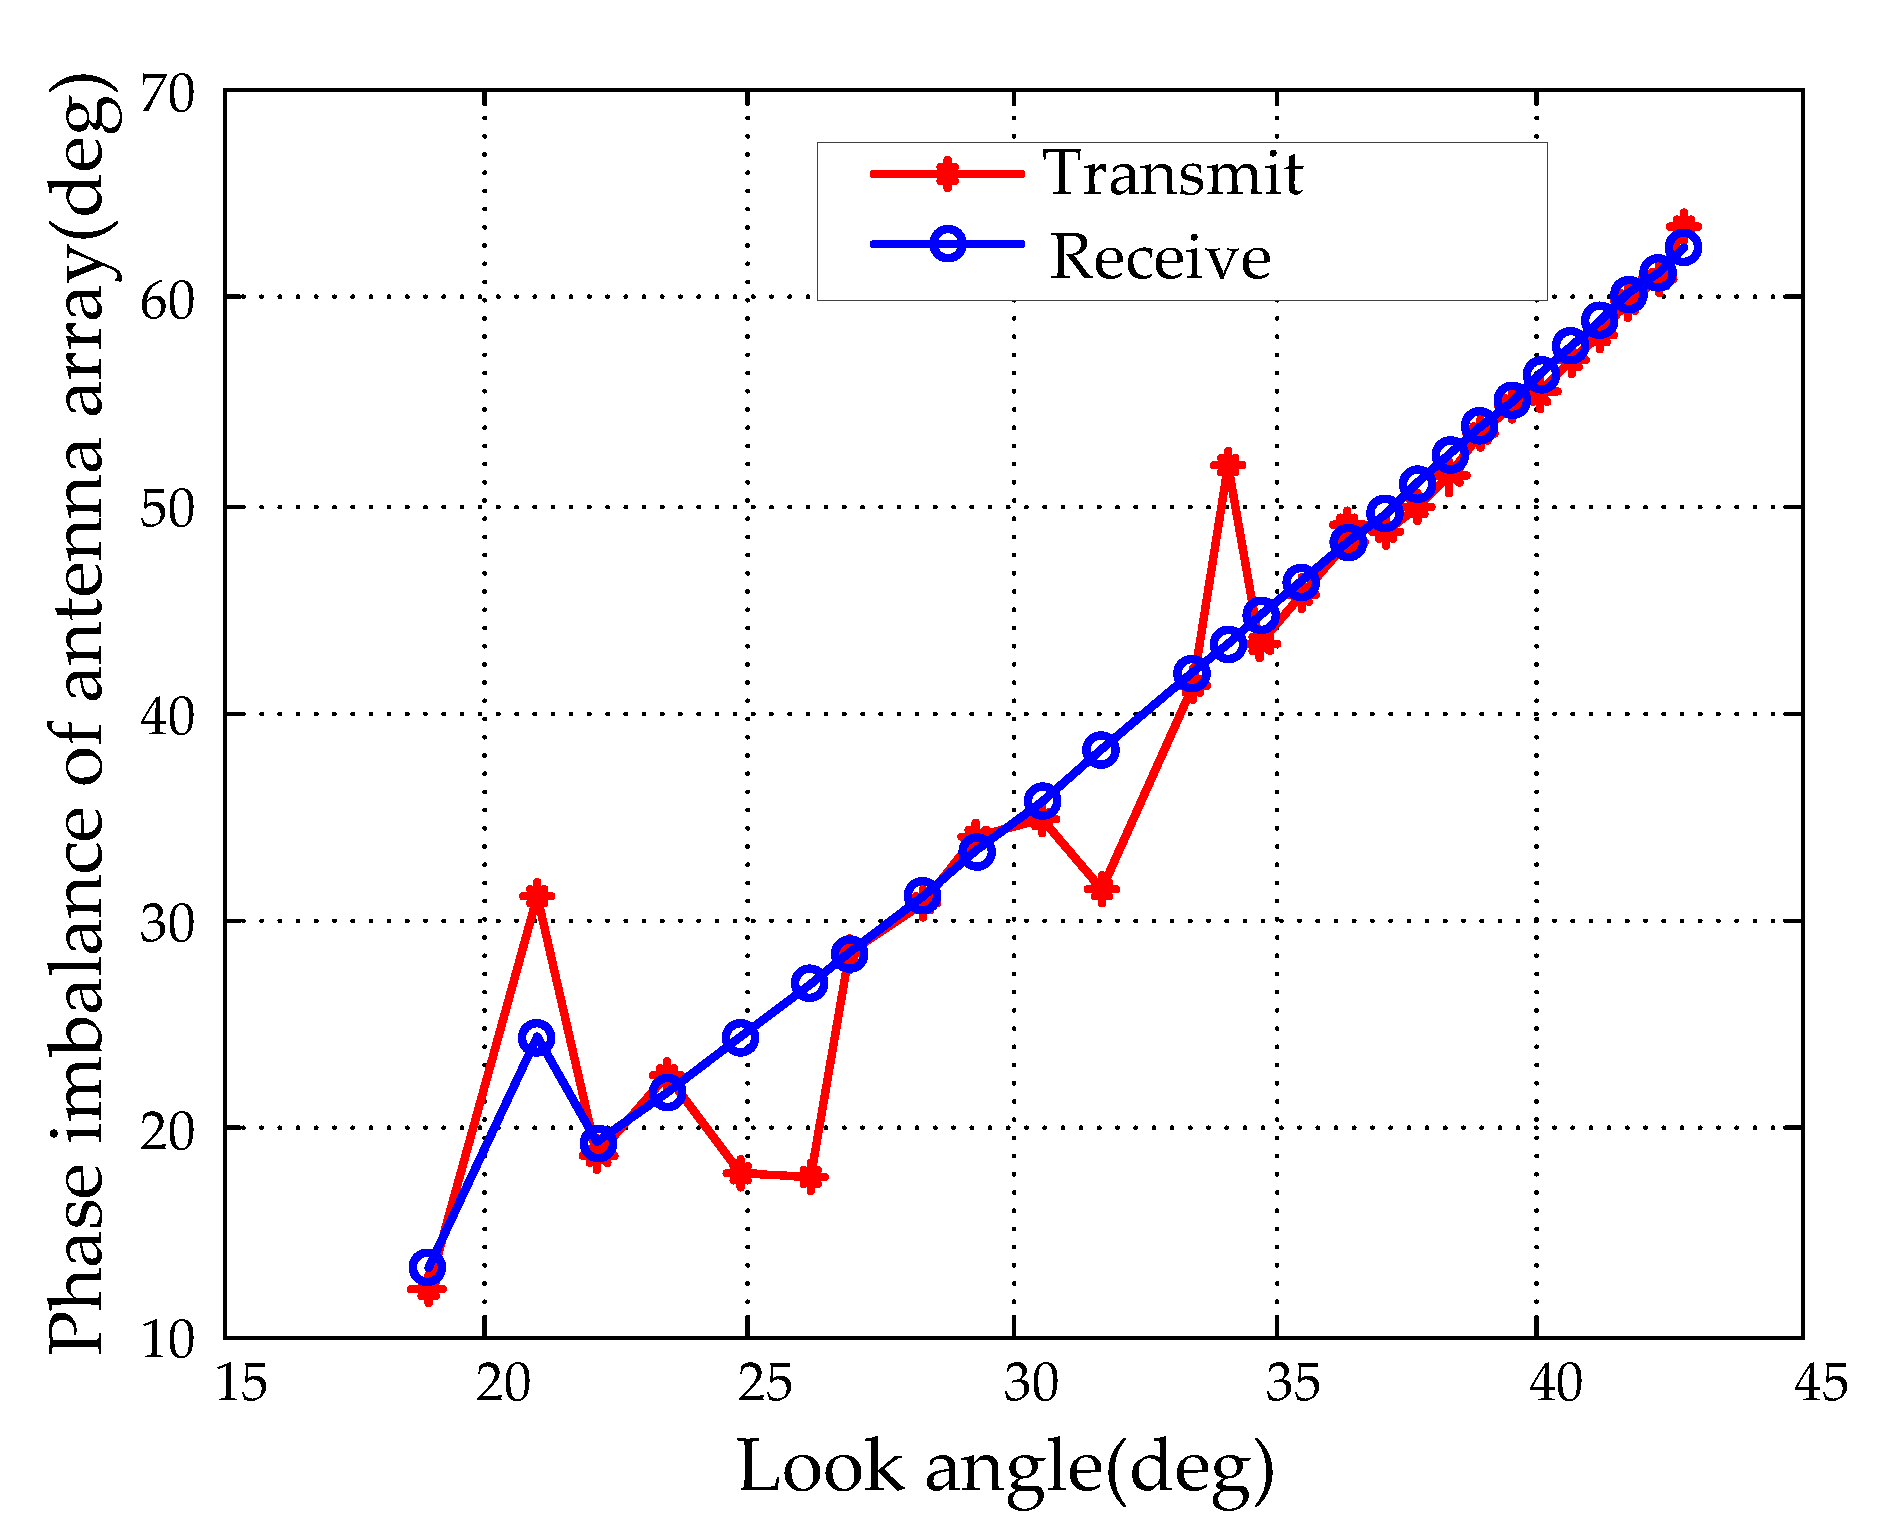
3.3. Error of the Antenna Array

For the antenna, there are crosstalks ( δ 1 , δ 2 , δ 3 , δ 4 ) and channel imbalances ( f t , f r ) simultaneously affecting polarization observation [6]. GF-3 satellite uses dual-polarization slotted waveguide array, in which the isolation of waveguide port is more than 65 dB and the cross-polarization level within scanning range is less than −55 dB at central frequency [21]. Furthermore, before satellite launching, the ground test result shows that polarization isolation of GF-3 global antenna is better than 35 dB [22,23], which is also proved by the follow-up quality assessment results (in Section 4.2). Hence, the GF-3 antenna is highly isolated and crosstalks have negligent influence on the PolSAR data. In addition, the amplitude imbalance of the antenna is eliminated by antenna pattern correction in the imaging process, which is proved to be quite stable. Therefore, we focus on the phase imbalance which needs to be corrected. Specific sources of the phase imbalance include three aspects: (1) No coincidence of H and V antenna center; (2) Differences of H and V waveguides; (3) Distinction of amplitude and phase weighting between H and V antenna. Here, we describe these three error components in detail.
(1) No coincidence of H and V antenna center
The slotted waveguide array of the GF-3 satellite is composed of alternately arranged H and V waveguides [21], as shown in Figure 4a, so there is a slight difference between H and V antenna center, i.e., there is a baseline (B) between the H and V antenna. The geometric relationship is shown in Figure 5, where x axis is the azimuth direction of the antenna, which is perpendicular and into the paper, y axis is the range direction of the antenna array as shown, and z axis is perpendicular to x-y plane. Here, H is the H polarization antenna center, V is the V antenna center, B is the baseline between H and V antenna, β is the angle between the y axis and the ground surface, and α is the angle between B and the ground surface. It should be mentioned that the baseline (B) does not coincide with the y axis, which is due to the different sizes of H and V waveguides, as shown in Figure 4b.
Set the look angle as ϕ , according to the principle of signal propagation, phase imbalances caused by differences between H and V antenna center are derived by Equation (2). In addition, this difference will also introduce the sampling delay error. However, the error is less than 0.05 ns, which results in an ignorable mismatch at range.
( θ r , 1 = 2 π B sin ( α ϕ ) λ θ t , 1 = 2 π B sin ( α ϕ ) λ
(2) Differences of H and V waveguides
In GF-3 system, the H waveguide is different with the V waveguide in size (see Figure 4b), which results in different delay effects on the signal. Although the delay error causes a very small mismatch at range, the phase difference introduced by the delay difference cannot be neglected. The phase difference is represented by C, and then phase imbalances can be expressed as Equation (3). The external calibration is needed to get the exact value of C because it cannot be precisely measured before launch. However, as the waveguide shape and size are constant, the value of C is quite stable. Hence, a few external calibration experiments can fulfill the measure work of C. For example, by using three experimental data with low-, mid-, high-incidence angles. In this study, external calibration experiments using polarimetric active radar calibrators (PARCs) [24] are performed according to three different beams including Q7, Q17, Q25 for GF-3, look angles of which are 29.36°, 36.41°, and 41.18°, respectively.
{ θ r , 2 = C θ t , 2 = C
(3) Distinction of amplitude and phase weighting between H and V antenna
The GF-3 satellite adopts a large-scale active phased array antenna [22]. The pattern of the entire antenna array is obtained by the weighted superposition of multiple array elements [25]. However, weights of amplitude and phase are different at different polarization, which leads that the phase of antenna pattern potentially being inconsistent. The GF-3 antenna has good phase consistency over the effective beam width, so the effect of this factor can be corrected using the peak phase of antenna pattern [21]. We can obtain the peak phase of the transmit and receive antenna in different polarization (denoted as H T ( ϕ ) , V T ( ϕ ) , H R ( ϕ ) and V R ( ϕ ) ) by the high-accuracy antenna model of GF-3 [21]. Then, phase imbalances of this part can be written as Equation (4):
{ θ r , 3 = V R ( ϕ ) H R ( ϕ ) θ t , 3 = V T ( ϕ ) H T ( ϕ )
Based on the above analysis of three factors, the phase imbalance ( θ t , θ r ) caused by antenna array is expressed as Equation (5).
( θ r = 2 π B sin ( α ϕ ) λ + C + V R ( ϕ ) H R ( ϕ ) θ t = 2 π B sin ( α ϕ ) λ + C + V T ( ϕ ) H T ( ϕ )
In this equation, the value C is calibrated by external calibration method, the parameters α and B in the first part, and the phases of the antenna patterns in the third part, are provided by the producer of the antenna. The phase imbalance of entire antenna array under different view angle is obtained and shown in Figure 6. Hence, this phase imbalance is increasing with the increase of the view angle. Polarization data with different beams are corrected using different θ t and θ r in polarimetric correction.

3.4. Satellite Attitude Error

The SAR satellite attitude control error can lead to polarimetric error, because the polarimetric state of incident and scattering wave can be expanded with a certain polarimetric basis corresponding to the desired polarization antennas. Under the influence of the satellite attitude control error, the antenna rotates from the desired attitude, then the polarimetric basis will be rotated by a certain angle φ , which is defined as POA [26]. The POA can be calculated by Equation (6) using the attitude angle (yaw, roll and pitch) [7]:
φ = tan 1 ( sin ϕ sin θ p cos ϕ cos θ p sin θ y cos θ p cos θ y )
where θ p , θ y are the pitch angle, the yaw angle difference from the desired angle, and ϕ is the look angle. Here, the desired attitude is according to the yaw and pitch steering performed by GF-3 satellite, which is aimed at minimizing the Doppler centroid caused by earth rotation [27].
Analyzing the impact of POA on dihedral and triangle corner reflectors, we find that this error does not affect the measurement of trihedral corner reflector, but results in poor isolation of dihedral corner reflector. Crosstalk of GF-3 PolSAR is required to be less than −35 dB, then the POA should be controlled within 0.5°. The attitude control error of GF-3 is within 0.03°, so the POA caused by the attitude control error is quite small. We get the measured attitude and the desired attitude, and calculated the POAs of PARCs in 4 scenes of GF-3 polarization data. Results, shown in Table 3, suggest that the theoretical POA is very small and produces a crosstalk less than −75 dB which can be ignored.
On the other hand, the actual POA in imagery can be estimated by the PARC. After the calibration of channel imbalances, the measured scattering matrix M P A R C of PARC, the real scattering matrix of which is [0, 0; 1, 0] and becomes
M P A R C A e j Θ cos ( Ω + φ R ) cos ( Ω φ R ) [ tan ( Ω + φ R ) + δ 3 0 1 tan ( Ω φ R ) + δ 2 ]
where φ R means the real POA, other parameters have the same meaning as in Equation (1). Equation (7) suggests that the difference between HH and VV is caused by φ R and δ 2 δ 3 . The amplitudes of the PARC scattering matrix in Table 4 imply that difference between HH and VV is very small. Therefore, it can be considered that the actual POA introduced by attitude has a negligible effect on GF-3 polarization observation.

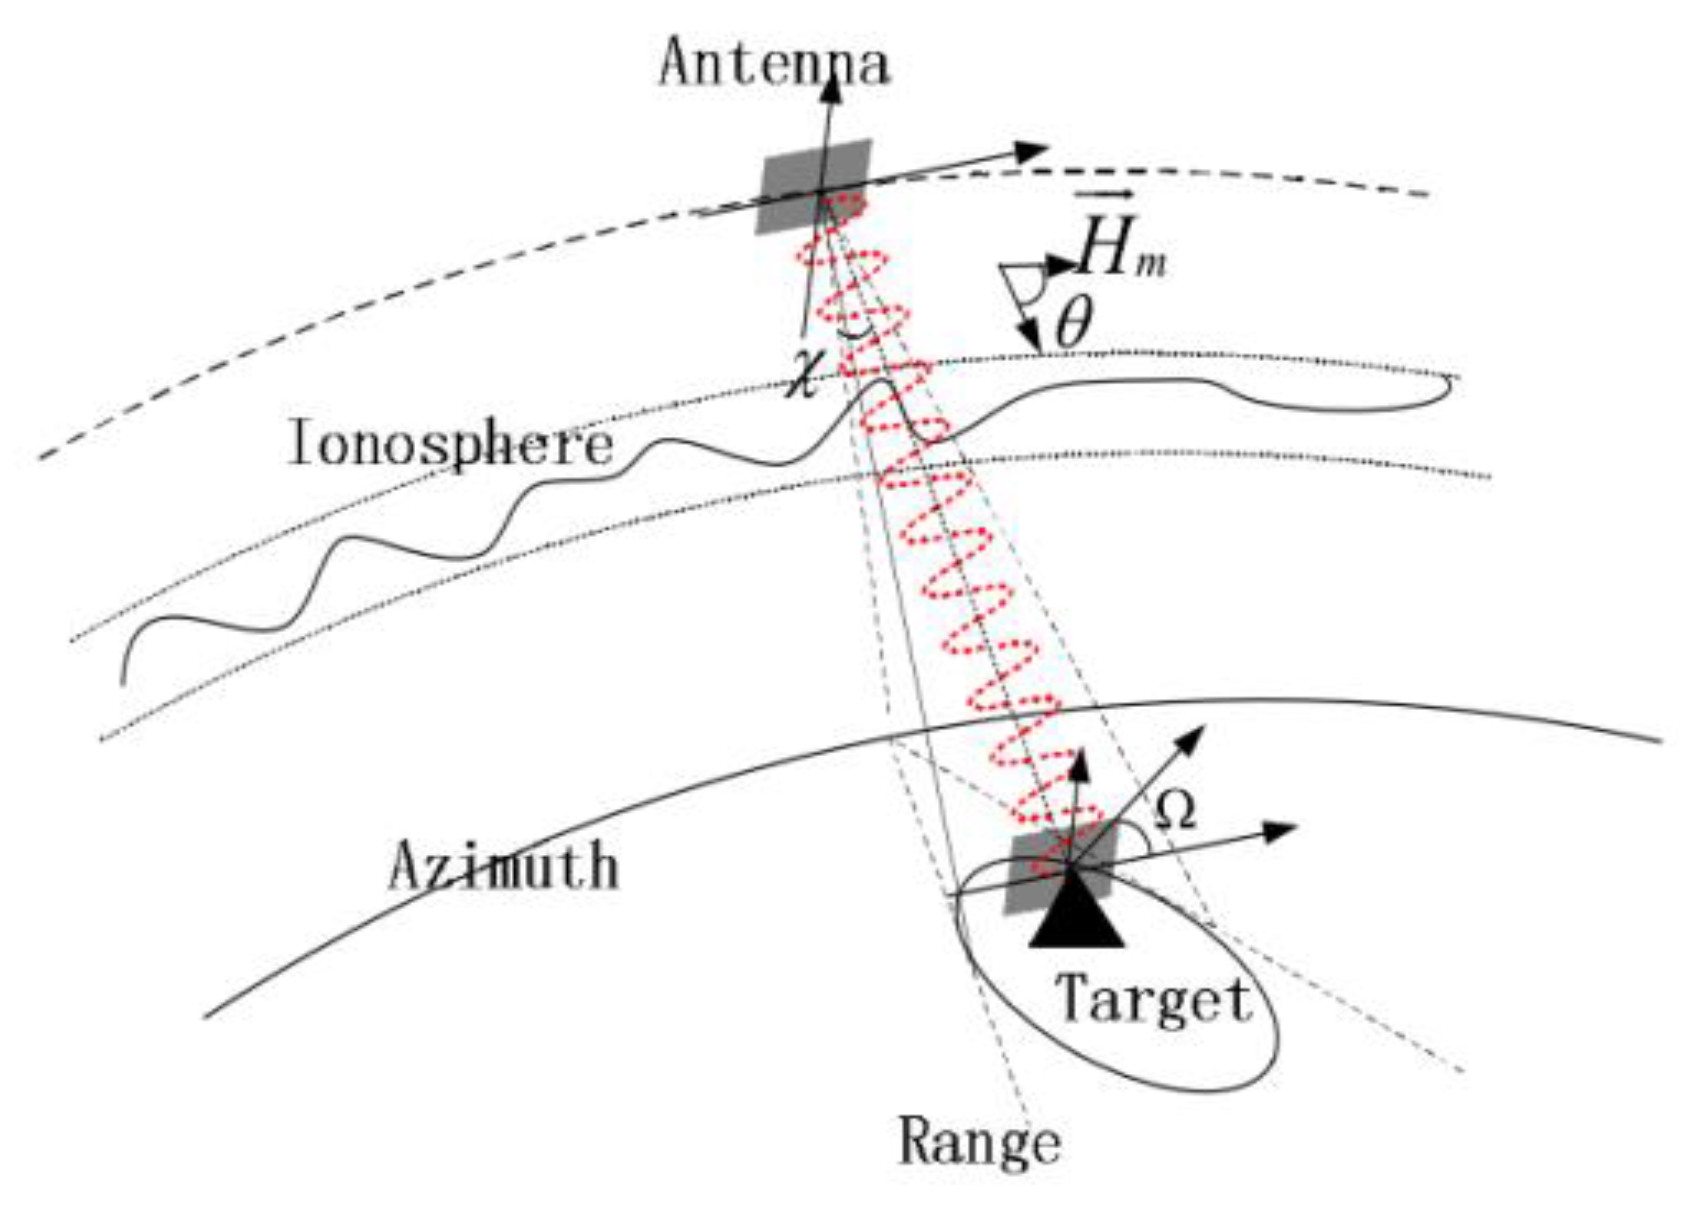
3.5. Ionosphere Effect

The orbit height of the GF-3 satellite is about 755 km, hence a large number of free electrons in the ionosphere will affect the transmission of the electromagnetic wave, as shown in Figure 7. When a linearly polarized wave traverses the ionosphere, it is split into two circularly polarized waves, rotating in opposite senses. When leaving the ionosphere, these waves recombine, but the resulting linear polarization is rotated relative to the original, a phenomenon known as Faraday rotation. P. Wright et al. pointed out that a one-way Faraday rotation (FR) of more than 5° to 8° adversely affects the retrieval accuracy of geophysical parameters [15]. Freeman also argued that the one-way FR within 5° is acceptable for most land applications [28]. Therefore, in this study, if the one-way FA is within 5°, the correction for FR is considered to be unnecessary.
The FR can be predicted utilizing the beam parameters and the ionospheric total electron content (TEC) [15] by Equation (8).
Ω ( K / f 2 ) B cos ( θ ) sec ( ϕ ) T E C
where Ω is the one-way FR, B is the local geomagnetic field, f is the radio center frequency, θ is the angle between the magnetic field and the satellite pointing vector, ϕ is the view angle, K is a composite constant. According to TEC values available at Center for Orbit Determination in Europe, TEC typically ranges from 5 to 20, emerges at a maximum of about 50 at weak solar activity and at a 100 during periods of intense solar activity. And the mean and the maximum of global geomagnetic fields near a year are obtained from the National Geographic Data Center. Under different TEC and geomagnetic field, C-band (5.6 cm wavelength) FR is calculated and shown in Table 5. As shown in Table 5, under normal conditions, FR is less than 0.18°, and the worst value is 0.6°. When intense solar activity happens, the extreme value reaches 1.21°. It can be seen that all of them are far smaller than 5°, and can be left uncorrected.
The FR also can be detected from the actual data [29]. There are several common FR estimation methods, of which the Bickel and Bates [5] method is less affected by noise, residual crosstalk and channel imbalance [15,30], and has a good estimation result, so we apply this method to five groups of GF-3 measured data with different latitudes. Data information and FR estimation are shown in Table 6. The estimated FR angles of these real data are less than 0.1°, which is smaller than the estimation precision of this method [31]. Thus, these results cannot stand for the exact value of FR, but can confirm that the FR dose is very small. Generally, the predicted and estimated values of FR both suggest that the influence of ionosphere on GF-3 polarization observation is negligible.

4. Polarization Correction and Verification

Based on the above influence analysis of error source, this section describes the polarization correction procedure of the GF-3 satellite. The point-target method and distributed-target method are used to verify the effectiveness of the correction method by assessing the quality of corrected data.

4.1. Polarization Correction Method

Through the analysis of the previous section, conclusions about GF-3 polarization system are summarized, including that: (1) imbalances of transmit/receive channel need to be corrected; (2) the consistency of the channel sample delay is quite good; (3) crosstalks and amplitude imbalances of antenna array are small, but phase imbalance of different beams is different and needs to be corrected; (4) the POA caused by satellite attitude is negligible; (5) the FR is acceptable. Then, ignoring these negligible terms, the error model of GF-3 PolSAR can be rewritten as Equation (9):
M = A e j Θ R T S T = A e j Θ [ 1 0 0 f R e j θ r ] [ S H H S H V S V H S V V ] [ 1 0 0 f T e j θ t ]
where f T and f R are imbalances of transmit and receive channel, including phase and amplitude imbalances, analyzed in Section 3.1, θ t and θ r are phase imbalances caused by the antenna array and analyzed in Section 3.3.
The task of GF-3 polarimetric calibration is to estimate and correct all errors throughout the complete PolSAR system for all data. Section 3 introduces the estimation of distortion parameters. Then, the correction process of GF-3 polarimetric data is as follows:
(1)
The fixed phase difference in Equation (3) is calibrated by three group data with PARCs [16];
(2)
Based on the result of step 1, the phase imbalances θ t and θ r are calculated by Equation (5);
(3)
Channel imbalances f T and f R are extracted by the internal calibration corresponding to imaging data;
(4)
According to the results of step 2 and 3, the distortion matrixes R and T are obtained;
(5)
The M is corrected to obtain the true scattering matrix (S) using Equation (9).
The whole correction process relies on several external calibration data with PARCs, and the correction of GF-3 polarimetric data is efficiently accomplished during the in-orbit testing phase. And, according to this polarization correction method, we developed the correction software and deployed it to the product generation software of the GF-3 ground segment. It performs polarization correction on the PolSAR data after imaging, which ensures the polarimetric quality of the PolSAR image products.

4.2. Quality Assessment of Corrected Data

To evaluate the performance of this method and also to monitor the quality of corrected polarimetric data, data quality assessment is necessary. The desired amplitude and phase of channel imbalances are less than 0.5 dB and 10°, and the isolation is desired to be higher than 35 dB. To analyze the quality assessment of corrected data, the point-target method and the common distributed-targets method are used to extract the residual channel imbalance and isolation in imagery.
(1) Point-Target Assessment
The point-target method is often used to evaluate calibration accuracy after polarization calibration [32]. This method utilizes corner reflectors which are artificially placed in the observation scene to estimate the isolation δ t r i a n g l e , amplitude imbalance f t r i a n g l e and phase imbalance P t r i a n g l e in the image domain. As a commonly used trihedral corner reflector, these measures can be calculated by the Equation (10).
{ δ t r i a n g l e = 20 log 10 ( max ( a b s ( M H V / M H H ) , a b s ( M V H / M H H ) ) ) f t r i a n g l e = 20 log 10 ( a b s ( M V V / M H H ) ) P t r i a n g l e = p h a s e ( M V V / M H H )
where M i j is the measured scattering component of the trihedral corner reflector.
Using the point-target method, polarization accuracy of five groups of GF-3 polarization datasets containing the trihedral corner reflector are analyzed. The results are shown in Table 7 where “Mode” means different beam. These results reveal that isolation of these data is better than 37 dB and the imbalance of VV channel relative to HH channel is within 0.2 dB in amplitude and less than 5.3° in phase. The quality of five group data has satisfied the requirements of polarization applications; therefore, the correction method proposed in this paper is effective.
(2) Common Distributed-Targets Assessment
The point-target analysis of corrected data reveals the preliminary conclusion that the proposed polarization correction method effectively corrects the polarization errors. To fully confirm this conclusion, more GF-3 PolSAR data need to be assessed. However, the point-target method relies on corner reflectors and cannot be widely used for polarimetric data assessment of the GF-3 entire polarization system. Hence, the method based on common distributed targets [23], is applied to assess the polarization quality of GF-3 using more data. This method does not depend on calibrators and particular distributed targets, which can meet the need of normalized quality assessment, and can give quantitative results of channel imbalance and isolation. Though the accuracy of the common distributed-target method is lower than the point-target method, the method is with high feasibility to verify the validity of the proposed polarization correction method for the GF-3 polarimetric system.
Here, the quality of 43 calibrated PolSAR images is analyzed by using the method based on common distributed targets. These data are from 24 beams with the view angle ranging from 18.9° to 41.2°, include multiple bandwidths and pulse durations, and span time of six months. Assessment results of these data are shown in Figure 8, where these data are numbered by using view angle as the primary key and time as the secondary key, and sorted in ascending way. In addition, the imbalance in this result figure denotes the difference between VV and HH channel. Despite the view angle or bandwidth of data being different, channel imbalances of all data observed at different times are basically maintained within 0.5 dB in amplitude and do not exceed 10 ° in phase. Furthermore, Figure 8c implies that isolations of all data are high (better than 35 dB), which demonstrate that the GF-3 antenna is highly isolated, as described in Section 3.3.
In summary, the quality assessments show that the isolation is better than 35 dB, and the channel imbalance is within 0.5 dB in amplitude and within 10 ° in phase. This accuracy reaches the expected quality requirements of GF-3 PolSAR data. Therefore, the polarization correction method based on full-link error analysis effectively completes the polarimetric correction work of GF-3 data.

5. Discussion

As product quality is of crucial importance, the polarimetric error must be calibrated and corrected for the GF-3 satellite. In the above sections, we presented the calibration of polarimetric error for GF-3 PolSAR system. The designed polarimetric performances of GF-3 satellite were 0.5 dB and 10° relative accuracy between channels, and cross-pol leakage below −35 dB. The comprehensive assessment results by the common distributed target showed that the quality of corrected PolSAR data had reached this expected goal. Besides, for the more accurate five measures in Table 7, the performance was assessed to be around 0.2 dB, 5° and −37 dB.
Until now, various calibration methods focused on the determination of polarimetric error including channel imbalances, crosstalks, and FR using the external reference objects—particular distributed target and standard corner reflector [6,31,32,33]. Simultaneously, existing PolSAR satellites also used external calibration methods to solve distortion parameters and usually depended on the Amazon Rainforest and triangle corner reflector [11,14]. As to the polarimetric calibration task of GF-3, there are many kinds of data and the aim is to have completed the initial calibration of all data within 5 months. Hence, detailed analysis about the system should be done so as to perform a more efficient and affordable external calibration. Moreover, the GF-3 antenna is highly isolated, which causes fewer parameters to be calibrated [22,23]. And, the GF-3 has the capacity of internal polarimetric calibration and precisely models the antenna before satellite launching [21], which helps us to get more information about the error of SAR system and antenna.
Based on previous studies on the errors of antenna, attitude, and ionosphere [5,6,7], we considered more details by combining the actual conditions of GF-3 to give the full-link error model for the first time and the calibration way of GF-3 polarization error. Especially, we pointed out the specific sources of antenna phase imbalance and found that no coincidence of H and V antenna center at range caused this phase imbalance larger with the view angle increasing. Though the error model and these analyses are for GF-3, these works can provide references for the calibration of follow-up PolSAR satellites. It should be noted that the external calibration was still used to extract the absolute phase imbalance in Section 3.3 [24], but only for three typical beams. In addition, the accuracy of antenna model greatly affects the quality of corrected data. With time passage and the device aging, this model now used may be inadequate. However, this problem could be solved by the internal calibration such as single T/R channel calibration and phase encoding calibration. These calibration modes can help us to understand the working status of single T/R channel. So, we will monitor system changes by internal calibration and data quality in real time.

6. Conclusions

In this study, the error sources affecting GF-3 polarization observation are analyzed comprehensively, including: (1) the channel imbalance of the transmit/receive channel; (2) sampling delay error introduced by the transmit/receive channel; (3) the isolation and channel imbalance of the antenna array; (4) the POA caused by satellite attitude; (5) the FR introduced by the ionosphere. And, based on the specific influence of each error source on the GF-3 polarization data and using three groups of data with PARCs, the polarization correction of GF-3 PolSAR system is efficiently achieved during the in-orbit testing phase.
Based on common distributed targets and corner reflectors, assessment results of the corrected PolSAR data of GF-3 suggest that the amplitude and phase of channel imbalances are basically maintained within 0.5 dB and 10°, and the isolation is higher than 35 dB, which achieve the designed requirement of GF-3 polarimetric performance. Currently, the proposed correction process has been applied to the product generation software of the GF-3 ground segment. In the future, variation in the channel imbalance and delay error will be monitored by internal calibration. And the quality of GF-3 polarization data should be normally evaluated to ensure the provision of good-quality data for applications.

Author Contributions

S.J., X.Q., B.H., J.S. and C.D. initiated the research. X.Q. established the full-link error model in Section 2. Under supervision of X.Q., S.J. performed the experiments and analysis. S.J. wrote the manuscript, and X.Q., B.H., J.S. and C.D. revised the manuscript. All authors read and approved the final version of the manuscript.

Funding

This research was supported by the National Science Foundation of China under Grant No.61331017 and the GF-3 High-Resolution Earth Observation System under Project (30-Y20A12-9004-15/16, 03-Y20A11-9001-15/16).

Acknowledgments

The authors thank the support from The 14th Research Institute of China Electronics Technology Group Corporation, and China Center for Resources Satellite Data and Application.

Conflicts of Interest

The authors declare no conflict of interest.

References

  1. Ding, C.; Liu, J.; Lei, B.; Qiu, X. Preliminary Exploration of Systematic Geolocation Accuracy of GF-3 SAR Satellite System. J. Radars 2017, 6, 11–16. [Google Scholar]
  2. Zhang, Q. System Design and Key Technologies of the GF-3 Satellite. Acta Geod. Cartogr. Sin. 2017, 46, 269–277. [Google Scholar]
  3. Jianchao, F.; Deyi, W.; Jianhua, Z.; Derui, S.; Min, H. National Sea Area Use Dynamic Monitoring Based on GF-3 SAR Imagery. J. Radars 2017, 6, 456–472. [Google Scholar]
  4. Shengyang, L.; Zhihui, X.; Ziqi, C.; Ao, Z.; Wenyong, Y. Application of GF-3 Satellite Imagery in Yellow River Flood Monitoring. Water Resour. Informatiz. 2017, 5, 22–26. [Google Scholar]
  5. Bickel, S.H.; Bates, R.H.T. Effects of magneto-ionic propagation on the polarization scattering matrix. Proc. IEEE 1965, 53, 1089–1091. [Google Scholar] [CrossRef]
  6. Van Zyl, J.J. Calibration of polarimetric radar images using only image parameters and trihedral corner reflector responses. Geosci. Remote Sens. IEEE Trans. 1990, 28, 337–348. [Google Scholar] [CrossRef]
  7. Ming, F.; Hong, J.; Zhang, L. Improved Calibration Method of the Airborne Polarimetric SAR. In Proceedings of the International Asia-Pacific Conference on Synthetic Aperture Radar, Seoul, Korea, 26–30 September 2011; pp. 1–3. [Google Scholar]
  8. Sun, J.; Yu, W.; Deng, Y. The SAR Payload Design and Performance for the GF-3 Mission. Sensors 2017, 17, 2419. [Google Scholar] [CrossRef] [PubMed]
  9. Han, B.; Ding, C.; Zhong, L.; Liu, J.; Qiu, X.; Hu, Y.; Lei, B. The GF-3 SAR Data Processor. Sensors 2018, 18, 835. [Google Scholar] [CrossRef] [PubMed]
  10. Sarabandi, K.; Pierce, L.E.; Dobson, M.C.; Ulaby, F.T. Polarimetric calibration of SIR-C using point and distributed targets. IEEE Trans. Geosci. Remote Sens. 1995, 33, 858–866. [Google Scholar] [CrossRef]
  11. Luscombe, A.P.; Chotoo, K.; Huxtable, B.D. Polarimetric calibration for RADARSAT-2. In Proceedings of the IEEE 2000 International Geoscience and Remote Sensing Symposium, IGARSS 2000, Honolulu, HI, USA, 24–28 July 2000; pp. 2197–2199. [Google Scholar]
  12. Thompson, A.A.; Luscombe, A.; James, K.; Fox, P. RADARSAT-2 Mission Status: Capabilities Demonstrated and Image Quality Achieved. In Proceedings of the European Conference on Synthetic Aperture Radar, Friedrichshafen, Germany, 2–5 June 2008; pp. 1–4. [Google Scholar]
  13. Martínez, N.G.; Miguel, B.G.; Pescador, A.L.; Revenga, P.C.; Borge, J.C.N. Cross-calibration of full polarimetric RIX and TerraSAR-X data. In Proceedings of the IEEE 2012 International Geoscience and Remote Sensing Symposium, Munich, Germany, 22–27 July 2012; pp. 5864–5867. [Google Scholar]
  14. Touzi, R.; Shimada, M. Calibration and validation of polarimetric ALOS2. In Proceedings of the Geoscience and Remote Sensing Symposium, Milan, Italy, 26–31 July 2015; pp. 4113–4116. [Google Scholar]
  15. Wright, P.A.; Quegan, S.; Wheadon, N.S.; Hall, C.D. Faraday rotation effects on L-band spaceborne SAR data. Geosci. Remote Sens. IEEE Trans. 2003, 41, 2735–2744. [Google Scholar] [CrossRef]
  16. Luscombe, A.P.; Thompson, A. RADARSAT-2 calibration: Proposed targets and techniques. In Proceedings of the IGARSS ‘01. IEEE 2001 International Geoscience and Remote Sensing Symposium, Sydney, Australia, 9–13 July 2001; pp. 496–498. [Google Scholar]
  17. Braeutigam, B.; Gonzalez, J.H.; Schwerdt, M.; Bachmann, M. Radar Instrument Calibration of TerraSAR-X. In Proceedings of the European Conference on Synthetic Aperture Radar, Friedrichshafen, Germany, 2–5 June 2008; pp. 1–4. [Google Scholar]
  18. Schwerdt, M.; Schmidt, K.; Ramon, N.T.; Alfonzo, G.C.; Döring, B.; Zink, M.; Prats, P. Independent verification of the Sentinel-1A system calibration. In Proceedings of the Geoscience and Remote Sensing Symposium, Quebec City, QC, Canada, 13–18 July 2014; pp. 994–1007. [Google Scholar]
  19. Wang, S.; Qi, H.; Yu, W. An Internal Calibration Scheme for Polarimetric Synthetic Aperture Radar System. IEEE Trans. Geosci. Remote Sens. 2010, 49, 15–20. [Google Scholar] [CrossRef]
  20. Luscombe, A.P. RADARSAT-2 SAR image quality and calibration operations. Can. J. Remote Sens. 2004, 30, 345–354. [Google Scholar] [CrossRef]
  21. Ren, B.; Zhao, L.; Zhu, F. Design of C-band Multi-polarized Active Phased Array Antenna System for GF-3 Satellite. Spacecr. Eng. 2017, 26, 68–74. [Google Scholar]
  22. Sun, J.; Yu, W.; Deng, Y. Design of Working Modes and Payload of SAR for GF-3 Satellite. Spacecr. Eng. 2017, 26, 61–67. [Google Scholar]
  23. Jiang, S.; Qiu, X.; Han, B.; Hu, W. A Quality Assessment Method Based on Common Distributed Targets for GF-3 Polarimetric SAR Data. Sensors 2018, 18, 807. [Google Scholar] [CrossRef] [PubMed]
  24. Hong, J.; Wang, Y.; Yi, M.; Zhu, Y.; Li, L.; Ming, F. A Revised Polarimetric Calibration Method for GF-3 SAR with Active Radar Transponder. In Proceedings of the 2017 Progress in Electromagnetics Research Symposium—Fall (PIERS—FALL), Singapore, 22–25 May 2017. [Google Scholar]
  25. Stiglitz, M.R.; Callahan, J. Phased-Array Antenna Handbook; Artech House: Norwood, MA, USA, 1994. [Google Scholar]
  26. Jinping, Z.; Bo, R.; Fuguo, Z. A study on pattern model of phased array based on the characteristics of array elements. Mod. Radar 2016, 38, 65–69. [Google Scholar]
  27. Fiedler, H.; Boerner, E.; Mittermayer, J.; Krieger, G. Total zero Doppler Steering-a new method for minimizing the Doppler centroid. IEEE Geosci. Remote Sens. Lett. 2005, 2, 141–145. [Google Scholar] [CrossRef]
  28. Freeman, A.; Saatchi, S.S. On the detection of Faraday rotation in linearly polarized L-band SAR backscatter signatures. Geosci. Remote Sens. IEEE Trans. 2004, 42, 1607–1616. [Google Scholar] [CrossRef]
  29. Meyer, F.J.; Nicoll, J.B. Prediction, Detection, and Correction of Faraday Rotation in Full-Polarimetric L-Band SAR Data. IEEE Trans. Geosci. Remote Sens. 2008, 46, 3076–3086. [Google Scholar] [CrossRef]
  30. Nicoll, J.; Meyer, F.; Jehle, M. Prediction and detection of Faraday rotation in ALOS PALSAR data. In Proceedings of the Geoscience and Remote Sensing Symposium, 2007 (IGARSS 2007), Barcelona, Spain, 23–27 July 2007; pp. 5210–5213. [Google Scholar]
  31. Freeman, A. Calibration of linearly polarized polarimetric SAR data subject to Faraday rotation. IEEE Trans. Geosci. Remote Sens. 2004, 42, 1617–1624. [Google Scholar] [CrossRef]
  32. Shimada, M. Model-Based Polarimetric SAR Calibration Method Using Forest and Surface-Scattering Targets. IEEE Trans. Geosci. Remote Sens. 2011, 49, 1712–1733. [Google Scholar] [CrossRef]
  33. Whitt, M.W.; Ulaby, F.T.; Polatin, P.; Liepa, V.V. A general polarimetric radar calibration technique. IEEE Trans. Antennas Propag. 1991, 39, 62–67. [Google Scholar] [CrossRef]
Figure 1. The entire propagation path of electromagnetic wave and the full-link error model for GF-3 PolSAR system.
Remotesensing 10 01685 g001
Figure 2. Imbalance of transmit and receive channel extracted by internal calibration: (a) phase imbalance of transmit channel; (b) phase imbalance of receive channel; (c) amplitude imbalance of transmit channel and (d) amplitude imbalance of receive channel.
Remotesensing 10 01685 g002
Figure 3. Sampling delay error of (a) transmit channel and (b) receive channel extracted by internal calibration.
Remotesensing 10 01685 g003
Figure 4. Dual-polarized slotted waveguide antenna: (a) Antenna array, (b) Structure of H and V waveguide, where (b) is an enlargement of the red circle in (a).
Remotesensing 10 01685 g004
Figure 5. The geometric relationship of H and V antenna center at range.
Remotesensing 10 01685 g005
Figure 6. Phase imbalance caused by antenna array under different view angle.
Remotesensing 10 01685 g006
Figure 7. Schematic of electromagnetic wave through the ionosphere.
Remotesensing 10 01685 g007
Figure 8. Quality assessment results of corrected data estimated by distributed-target method: (a) amplitude imbalance; (b) phase imbalance; and (c) isolation.
Remotesensing 10 01685 g008aRemotesensing 10 01685 g008b
Table 1. Observation patterns of the GaoFen-3 (GF-3) satellite.
No.Work ModesIncidence Angle (°)Look Number
A × E
Resolution (m)Imaging Bandwidth (km)Polarization Mode
NominalAzimuthRangeNominalSize
1Spotlight (SL)20~501 × 111.0~1.50.9~2.510×1010 × 10Optional single polarization
2Ultra-fine strip (UFS)20~501 × 1332.5~53030Optional single polarization
3Fine strip I (FSI)19~501 × 1554~65050Optional dual polarization
4Fine strip II (FSII)19~501 × 210108~1210095~110Optional dual polarization
5Standard strip (SS)17~503 × 2252515~3013095~150Optional dual polarization
6Narrow scan (NSC)17~501 × 65050~6030~60300300Optional dual polarization
7Wide scan (WSC)17~501 × 810010050~110500500Optional dual polarization
8Global (GLO)17~532 × (2~4)500500350~700650650Optional dual polarization
9Full Polarized Strip I (QPSI)20~411 × 1886~93020~35full polarization
10Full Polarized Strip II (QPSII)20~383 × 2252515~304035~50full polarization
11Wave imaging (WAV)20~411 × 210108~125×55 × 5full polarization
12Extended (EXT)Low10~203 × 2252515~30130120~150Optional dual polarization
high50~603 × 2252520~308070~90Optional dual polarization
Table 2. Data information for the real situation analysis of channel imbalances, where U means uniform distribution.
Amount of DataNumber of Covered BeamsCovered Look Angles (deg)Options of Bandwidth and Pulse DurationTime Span (months)
3016Almost U (18.9~42.75)64
Table 3. Theoretical polarization orientation angles (POAs) of 4 scene data with polarimetric active radar calibrator (PARC).
Number1234
ModeQ9Q15Q17Q25
Look angle (deg)29.3635.536.4141.18
φ (deg)−0.0030.005−0.001−0.001
Table 4. Amplitude of the PARC scattering matrix.
NumberHH (dB)HV (dB)VH (dB)VV (dB)HH-VV (dB)
1−43.8−74.00−43.6−75.5
2−43.4−77.10−45.1−58.4
3−41.4−68.30−40.1−57.2
4−45.8−71.00−44.5−61.7
Table 5. Prediction Faraday rotation (FR) of GF-3 satellite.
TECCommon Value (5~20)Maximum at Weak Solar Activity (about 50)Maximum at Intense Solar Activity (about 100)
BMeanMaximumMaximum
Ω (deg)<0.18<0.6<1.21
Table 6. Estimation FR of GF-3 PolSAR data.
Number12345
Latitude (deg)4.3824.4531.8944.0551.7
Ω (deg)0.020.070.040.020.05
Table 7. Quality assessment results estimated by corner reflector.
NumberModeAmplitude Imbalance (dB)
VV/HH
Phase Imbalance (deg)
VV-HH
Isolation (dB)
HV/HH or VH/HH
1Q9−0.035.238.7
2Q150.042.137.1
3Q170.133.642.0
4Q25−0.051.739.9
5Q25−0.12−0.4337.0

