1. Introduction
Land use change in the tropics has a significant impact on the carbon cycle, and thus global climate change, but it is poorly quantified [
1,
2]. In mitigating climate change through conserving and enhancing forest carbon stocks, monitoring the changes in land cover and land use provides crucial information for policy development and enforcement in areas such as forest conservation, watershed, and environmental protection [
2]. While there are sufficient data on deforestation provided by systematic and free-to-use remote sensing [
3], what happens to land after deforestation (or the drivers of deforestation) varies by location [
4] and there are no global products providing these data, making local classification of the resulting land use necessary for both carbon accounting and policy implementation purposes.
There are a number of ways in which the area of different land cover and land use types within an area, and how they are changing, can be assessed. These range from agricultural census surveys to various types of remote sensing. The most commonly used approaches in the tropics include wall-to-wall mapping using remotely sensed images and/or sample-based approaches for area estimation [
5,
6,
7,
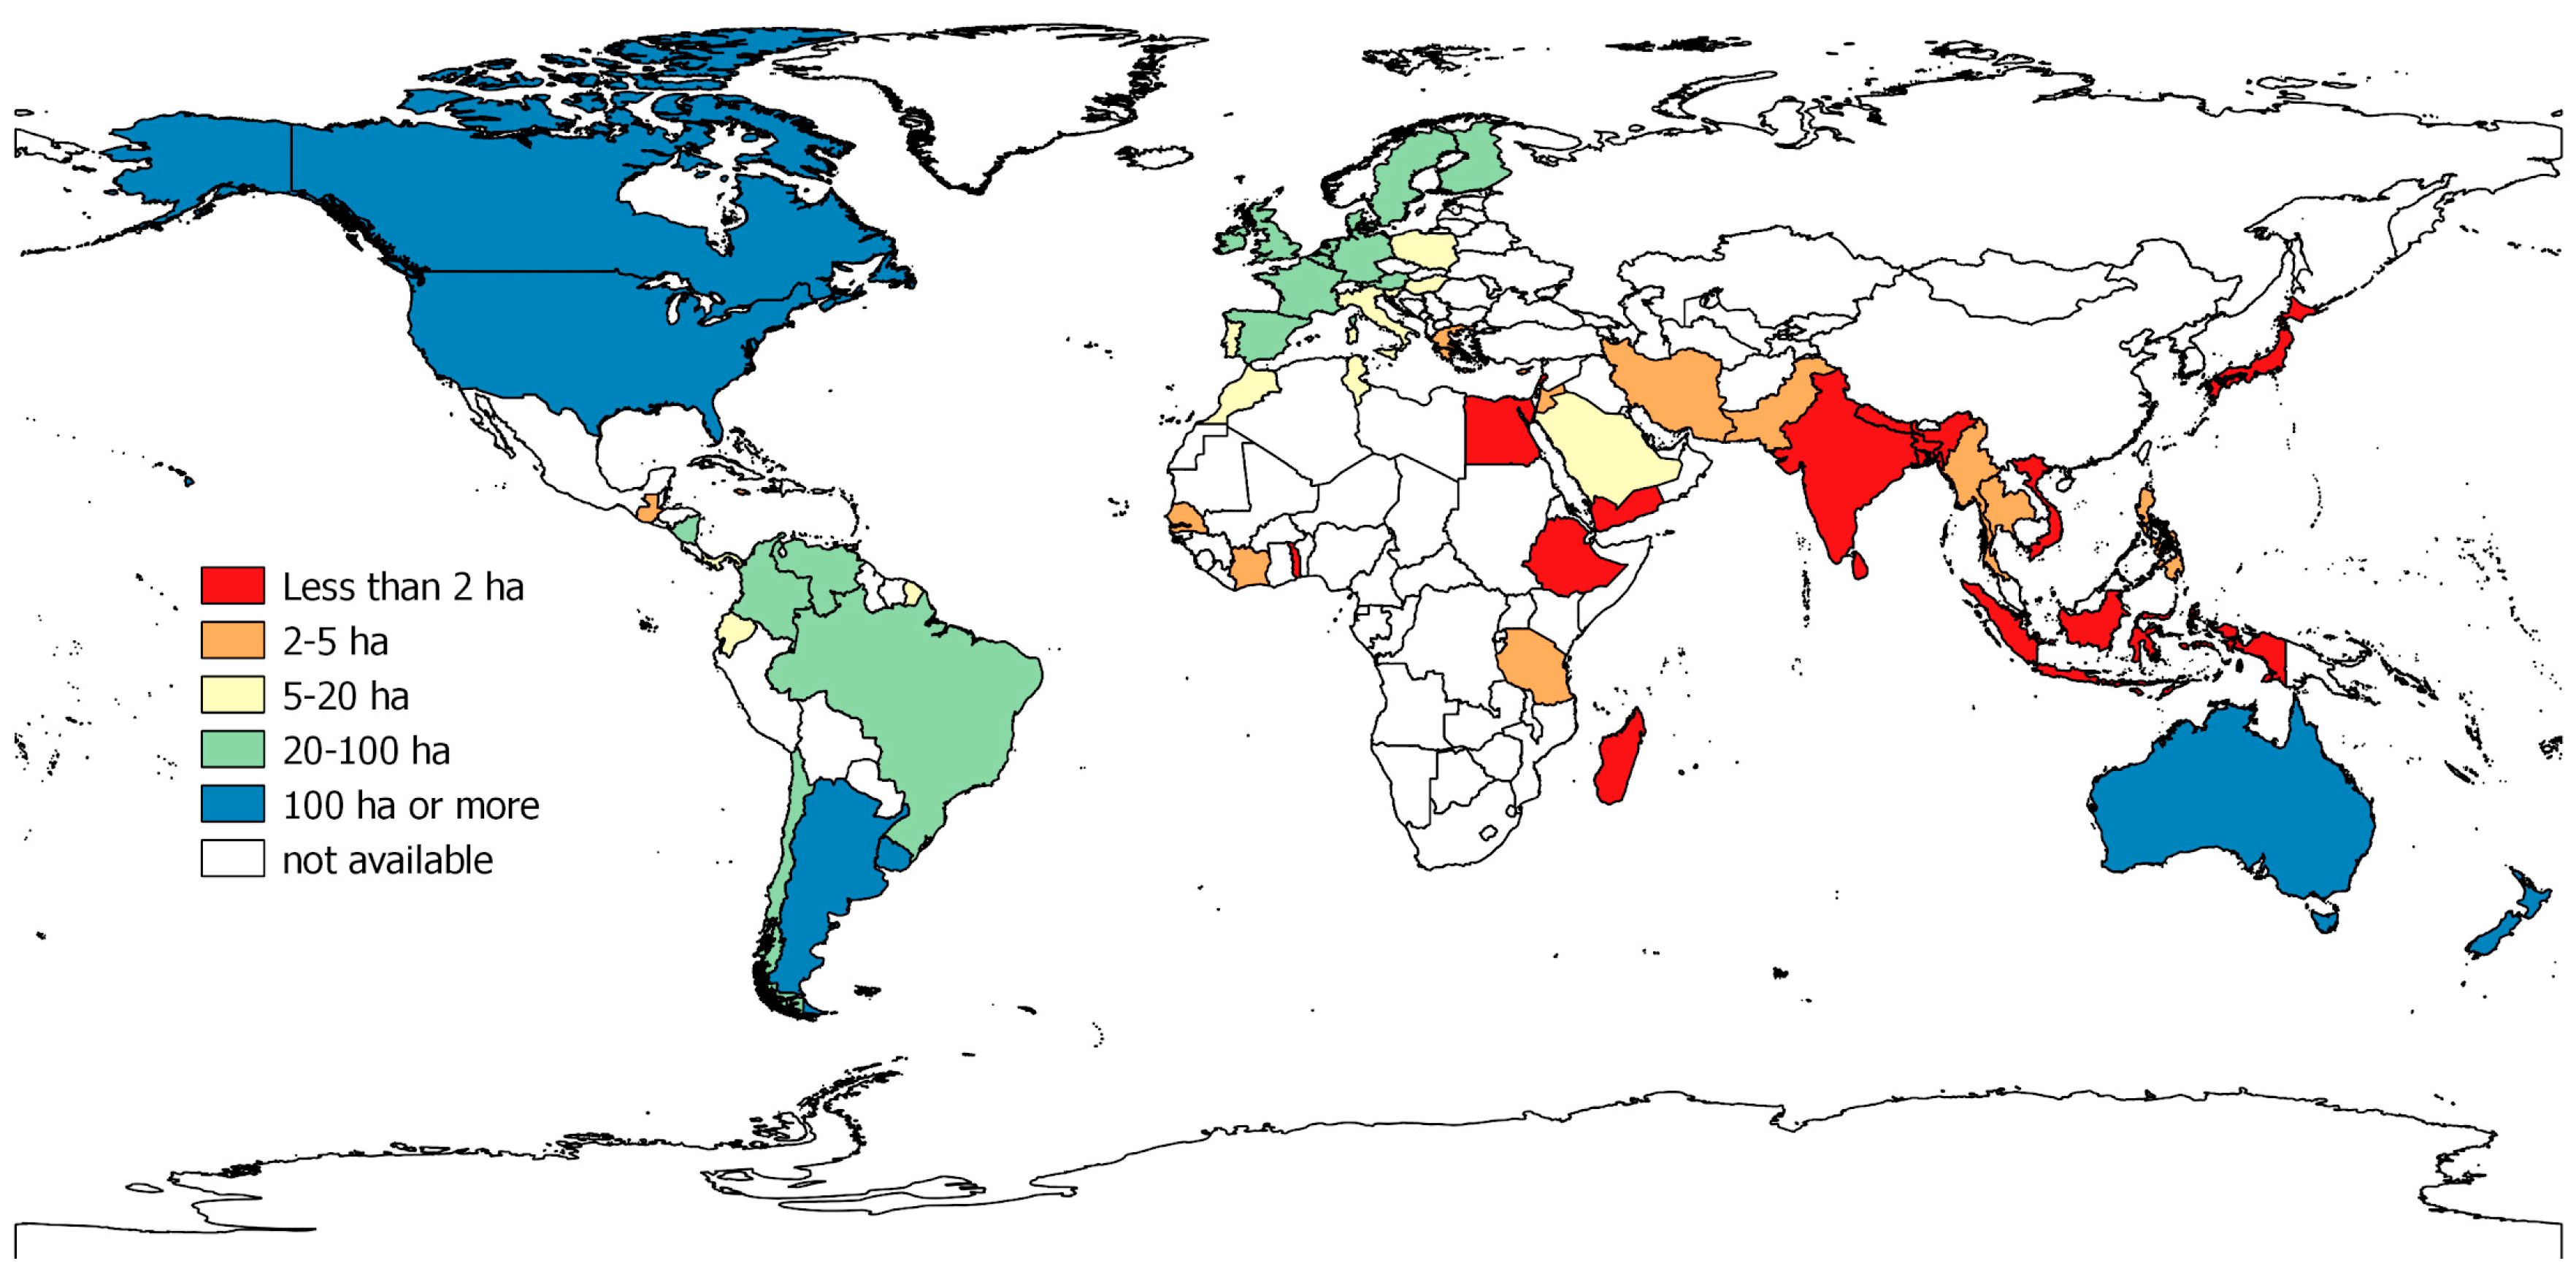
8]. However, classifying landscapes can be challenging in the tropics today, as the average farm size has been decreasing in developing countries [
9,
10]. In Asia, this change has been especially pronounced, with the average size of agricultural holdings falling from 2.5 hectares in 1950 to one hectare in 2000, where the fragmentation of holdings driven by population growth is prevalent (
Figure 1) [
10,
11]. More recently, rubber production has shifted from being dominated by large plantations, to being dominated by smallholders in Southeast Asia, resulting in 80% of global rubber production being managed by smallholders with plantations 2–3 ha in size [
12]. To overcome the challenge of this decrease in patch size, high spatial resolution images from unmanned aerial vehicles (UAV, ground resolutions typically 1–50 cm) and hyperspatial satellites such as WorldView-3 (WV3, with the highest resolution band at a 31 cm resolution) can be used, which provide detailed visual information on vegetation on the ground. While these images typically feature few spectral bands (normally optical RGB plus potentially one infrared band), limiting their ability to differentiate land cover types based on spectral characteristics, their high resolution enables the human eye to differentiate most land cover types based on, for example, the shape and density of trees, and the advancement of object-based classification methods has meant that automated processes can also take advantage of this spatial information to produce accurate classifications [
13,
14,
15,
16]. However, the high costs and complexity of both the object-based image analysis, and the high cost and low availability of data at a sufficient resolution, remain as challenges for wider application [
17,
18].
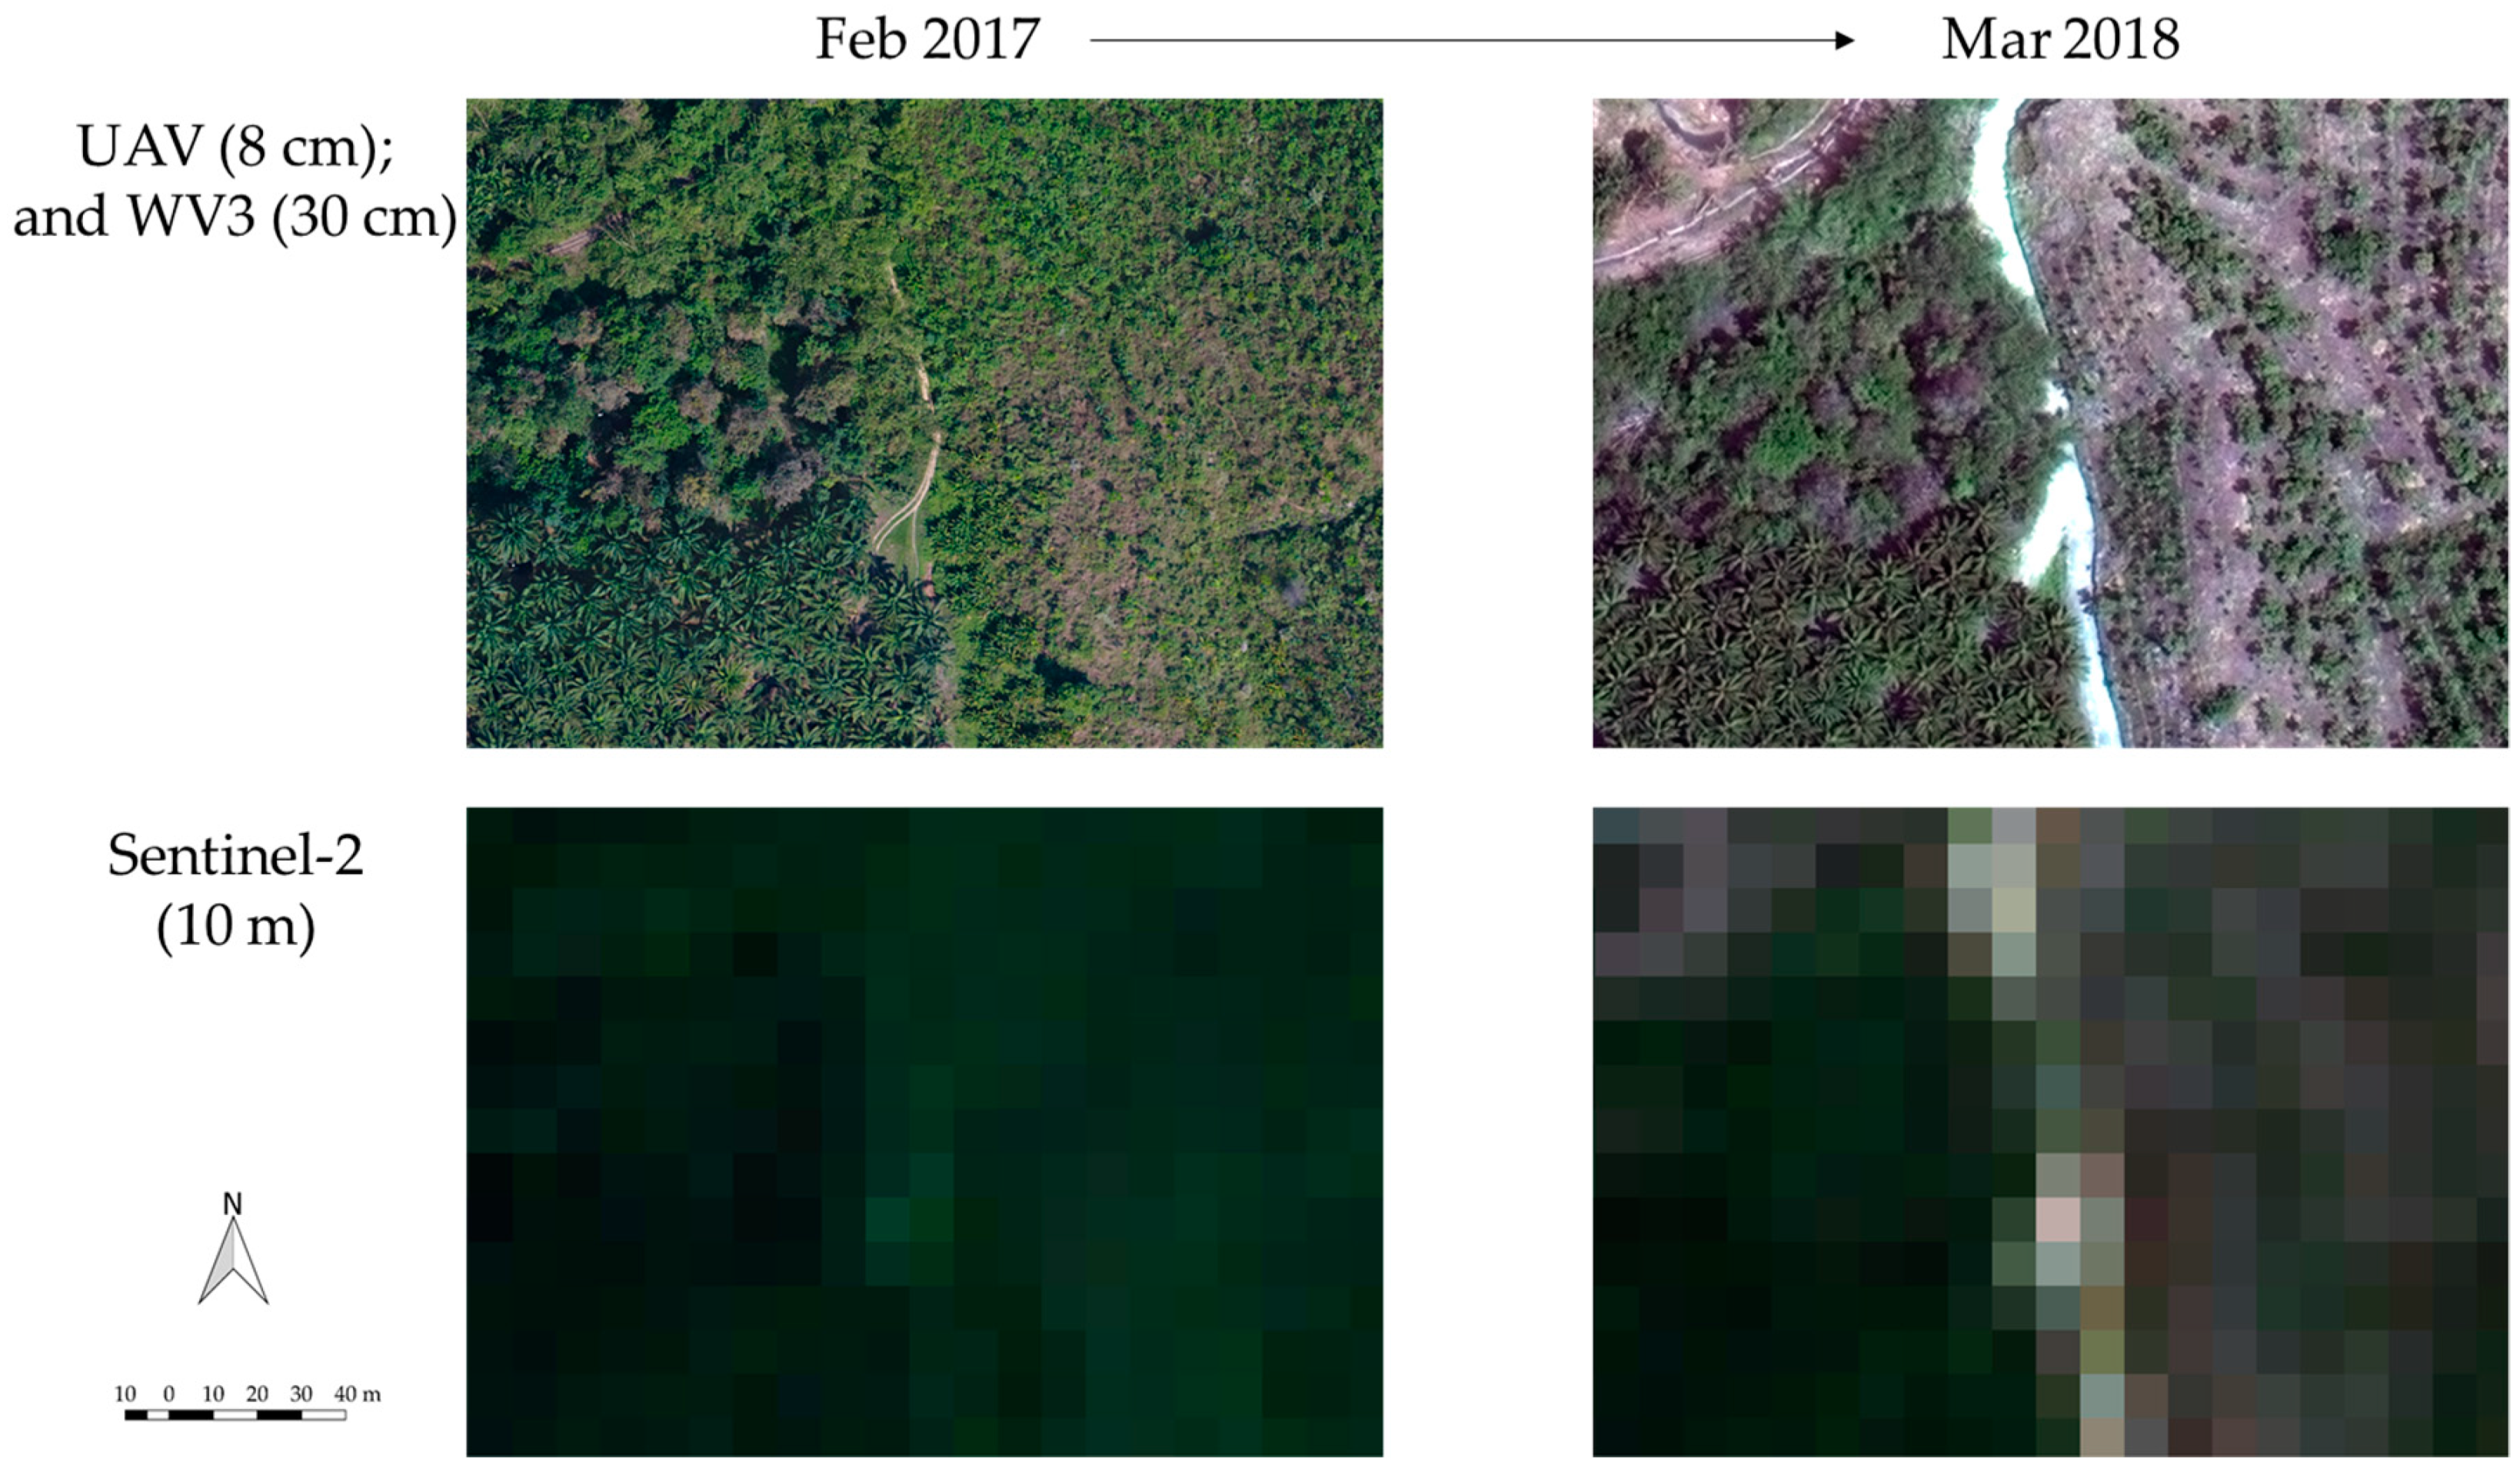
Our study investigated whether publicly available data, namely Sentinel-2 (S2), can map complex landscapes in Southern Myanmar, including oil palm, rubber, and betel nut plantations using a Random Forest classifier on Google Earth Engine. Unlike UAV and WV3 data, widely available satellite data (which is typically at best a 10–30 m resolution, with the standard platforms of Landsat and Sentinel-2) cannot be used to visually detect individual trees (
Figure 2). However, Sentinel-2 has great potential for mapping vegetation types in complex landscapes as it is a multispectral instrument with 13 bands, some of which (for example, the ‘red edge’ bands) cover very narrow portions of the spectrum, less than 20 nm wide, giving it some of the advantages in classification that were traditionally only available to a true hyperspectral sensor. The resolutions of the bands vary, with four at a 10 m resolution, and the rest at a 20 or 60 m resolution. Taking advantage of the spectral bands with a 10–20 m pixel size, several studies have estimated the extent of land cover types (e.g., cropland, wetland, snow cover) and produced maps of certain forest types (e.g., savanna, deciduous forests) and urban landscapes [
19,
20,
21,
22,
23,
24]. Furthermore, with a high revisit frequency of five days, agricultural monitoring systems are being developed using Sentinel-2 data, taking advantage of its temporal as well as spectral resolution [
25]. However, to our knowledge there has been no attempt to classify a landscape with as complex a mixture of small patches of similar tree crops as our study site in Myanmar using S2 data, despite the prevalence of such landscapes across the tropics. This is likely because hyperspatial images are typically used to conduct such classifications (but over small spatial areas, due to limited data availability and the high cost of purchasing/collecting and processing such data). Furthermore, S2 data, along with other satellite data, are generally considered for and associated with broader scale analyses.
Classification methods using machine learning algorithms such as decisions trees, support vector machines, and Random Forests are becoming more popular because of their high accuracy and ability to process complex datasets and produce good results with large numbers of input classification bands and training points [
26,
27,
28]. Random Forests were selected to classify the S2 data, as it is an algorithm proven to improve the classification accuracy compared to simpler methods, due to its ensemble learning techniques, and it is thus often applied for multispectral and hyperspectral satellite imagery in small areas [
28,
29,
30]. We also incorporated a texture index in the classification, in order to take advantage of the 10 m information in some S2 bands (even though we performed the classification at 20 m, the resolution of most S2 bands), as local texture is known to increase accuracy [
14,
31].
Mapping using complex machine learning classifier models and many classifier layers requires a large amount of representative datasets to train the classifier while avoiding over-fitting [
32,
33]. Therefore, the quality and quantity of training samples affect the classification results [
32,
33,
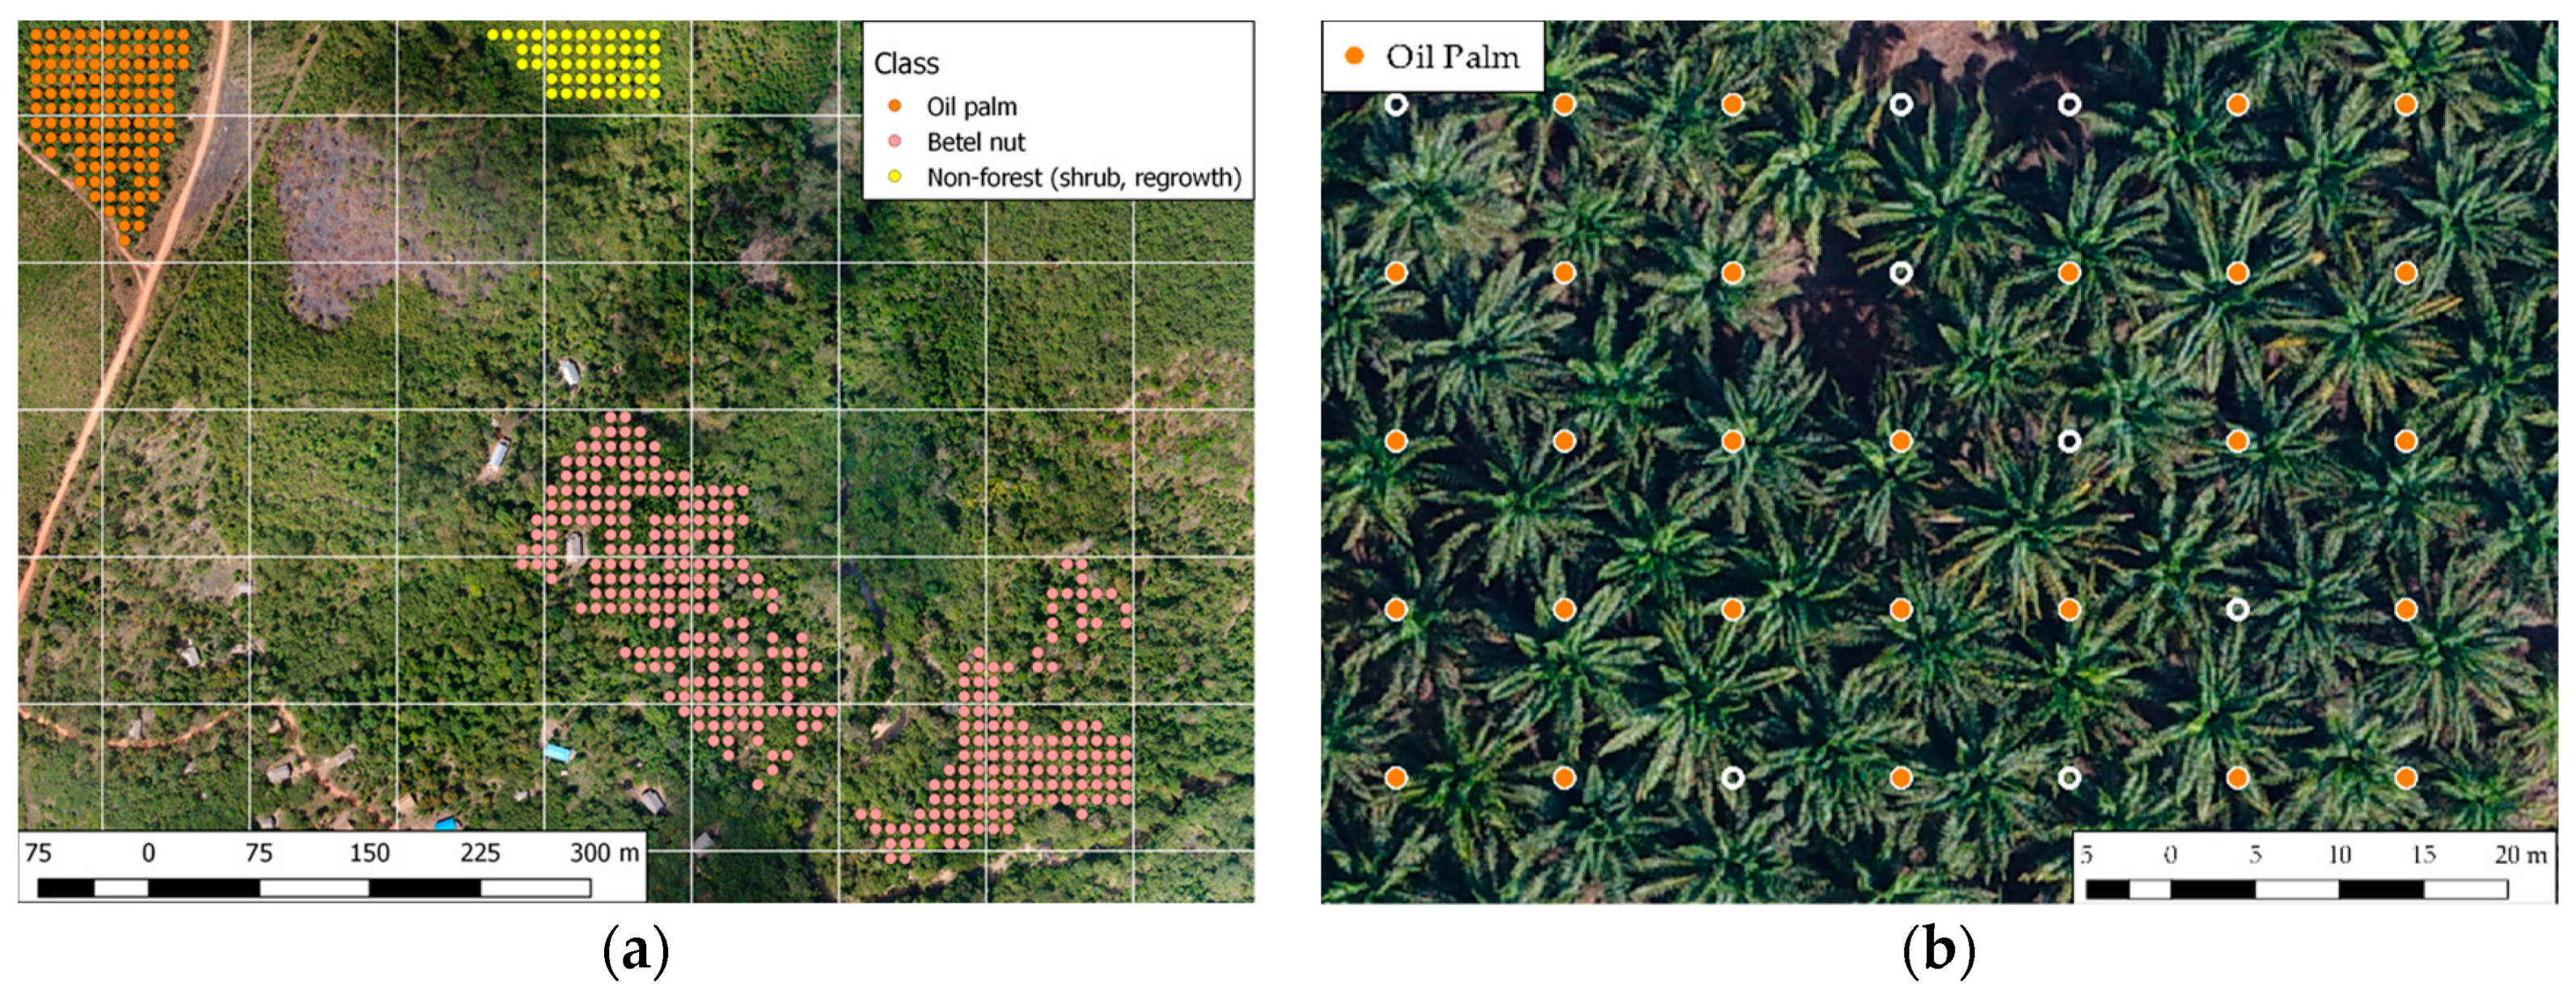
34]. Such samples can be collected from the field or high resolution images, which allows users to see individual trees [
33,
35]. We used high resolution images from UAV and WorldView-3 to manually delineate reference data through object recognition, producing a dataset with similar characteristics to ground truth points collected in the field, but at a much lower financial and time cost per point.
In summary, the study aimed to answer the following questions: (1) how accurately we can map areas with small plantations with S2 using a Random Forest classifier; and (2) are such maps accurate and consistent enough that they could be used to confidently detect area changes over a 12-month period? Using our sites in Southern Myanmar as a case study, we are proposing a cost-effective, simple, and transparent approach for mapping small plantations in increasingly common and complex landscapes, which can be applied in other parts of Asia and Africa, where this type of landscape and rapid landcover change are prevalent.
3. Results
3.1. Classification Accuracy
Using the reference samples from high resolution imagery as training data for a Random Forest classifier with 30 trees and four prediction variables, Sentinel-2 data were able to classify both areas at overall accuracy rates of 95% and higher for all the four images (
Figure 6 and
Table 6). This overall accuracy figure indicates the proportion of the area mapped correctly [
56].
Accuracy rates per class were also consistently high across the classes, with more than 84.7% and 93.5% median accuracy rates for user’s accuracy (UA) and producer’s accuracy (PA), respectively (
Table 7 and
Table 8). UA is the proportion of the area mapped as a particular class that matches with the testing data, while PA is the proportion of the area that is a particular class in the testing data and is mapped correctly as that class [
56]. Excluding water, the highest average accuracy was 98.4% for rubber (PA), while the lowest average was 84.7% for betel nut (UA).
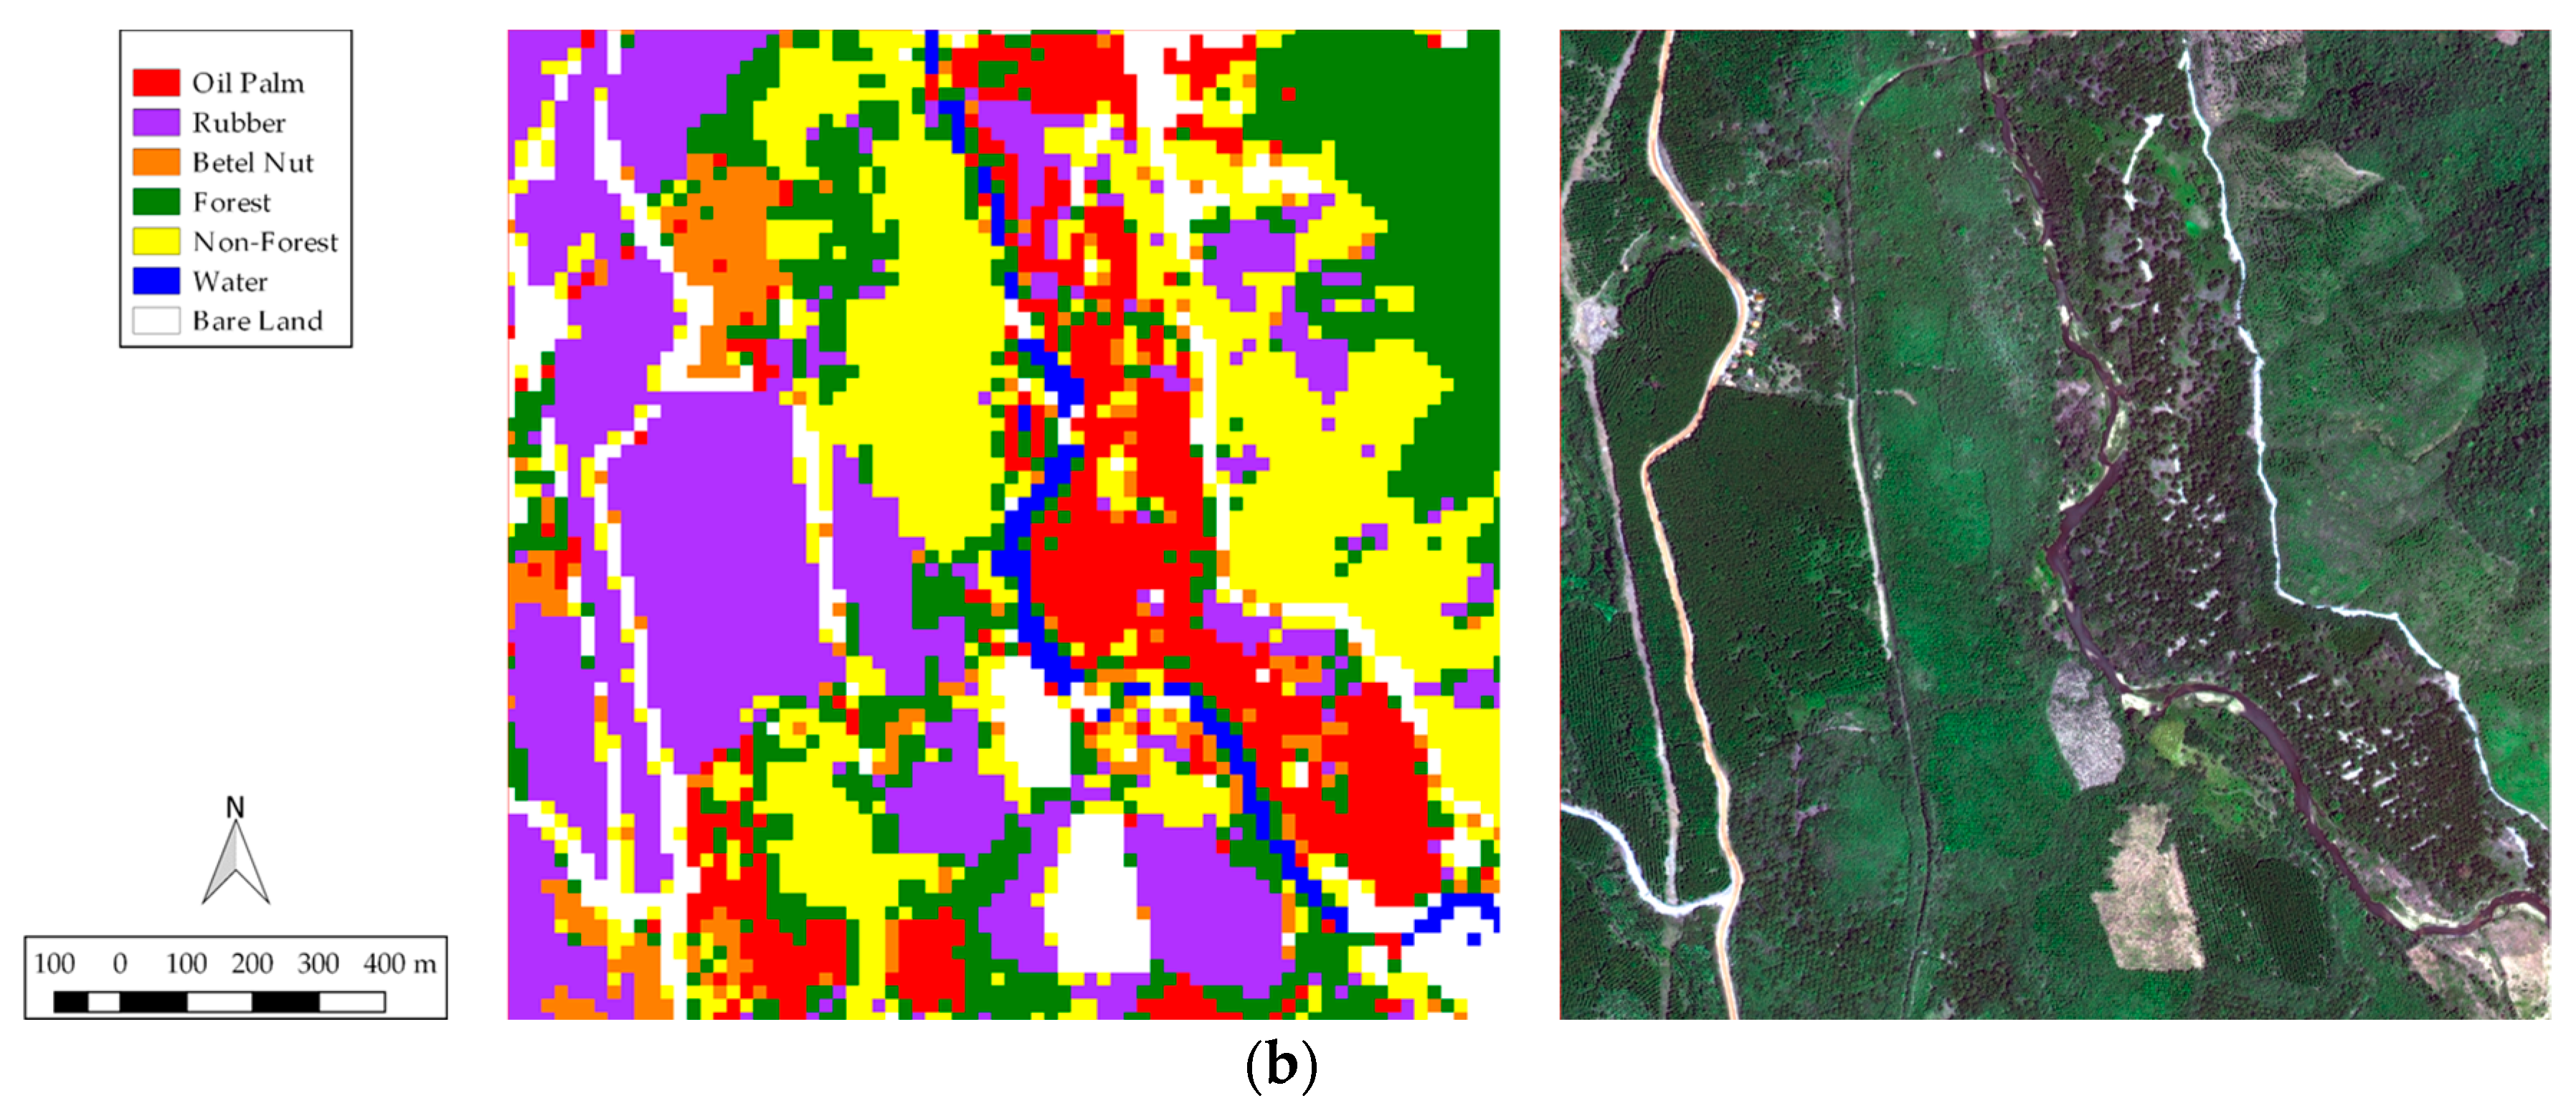
Although the overall accuracy showed that more than 95% of reference data used for validation was correctly classified, by manually investigating the imagery, we found that some areas we knew to be young rubber plantations were classified as shrubs. Furthermore, the areas with dark shadows of trees, rubber plants, or shrubs were sometimes classified as oil palm, along with the edges of rubber plantations or shrubs. Conversely, some oil palm plantations with less shadow contrast (e.g., oil palm plantations that have been poorly weeded and contain shrubs between the trees) were classified as rubber or shrubs. These misclassifications tend to occur more in the larger area (Area A) and also in the area further from the closest reference data.
3.2. Area Change with Sentinel-2
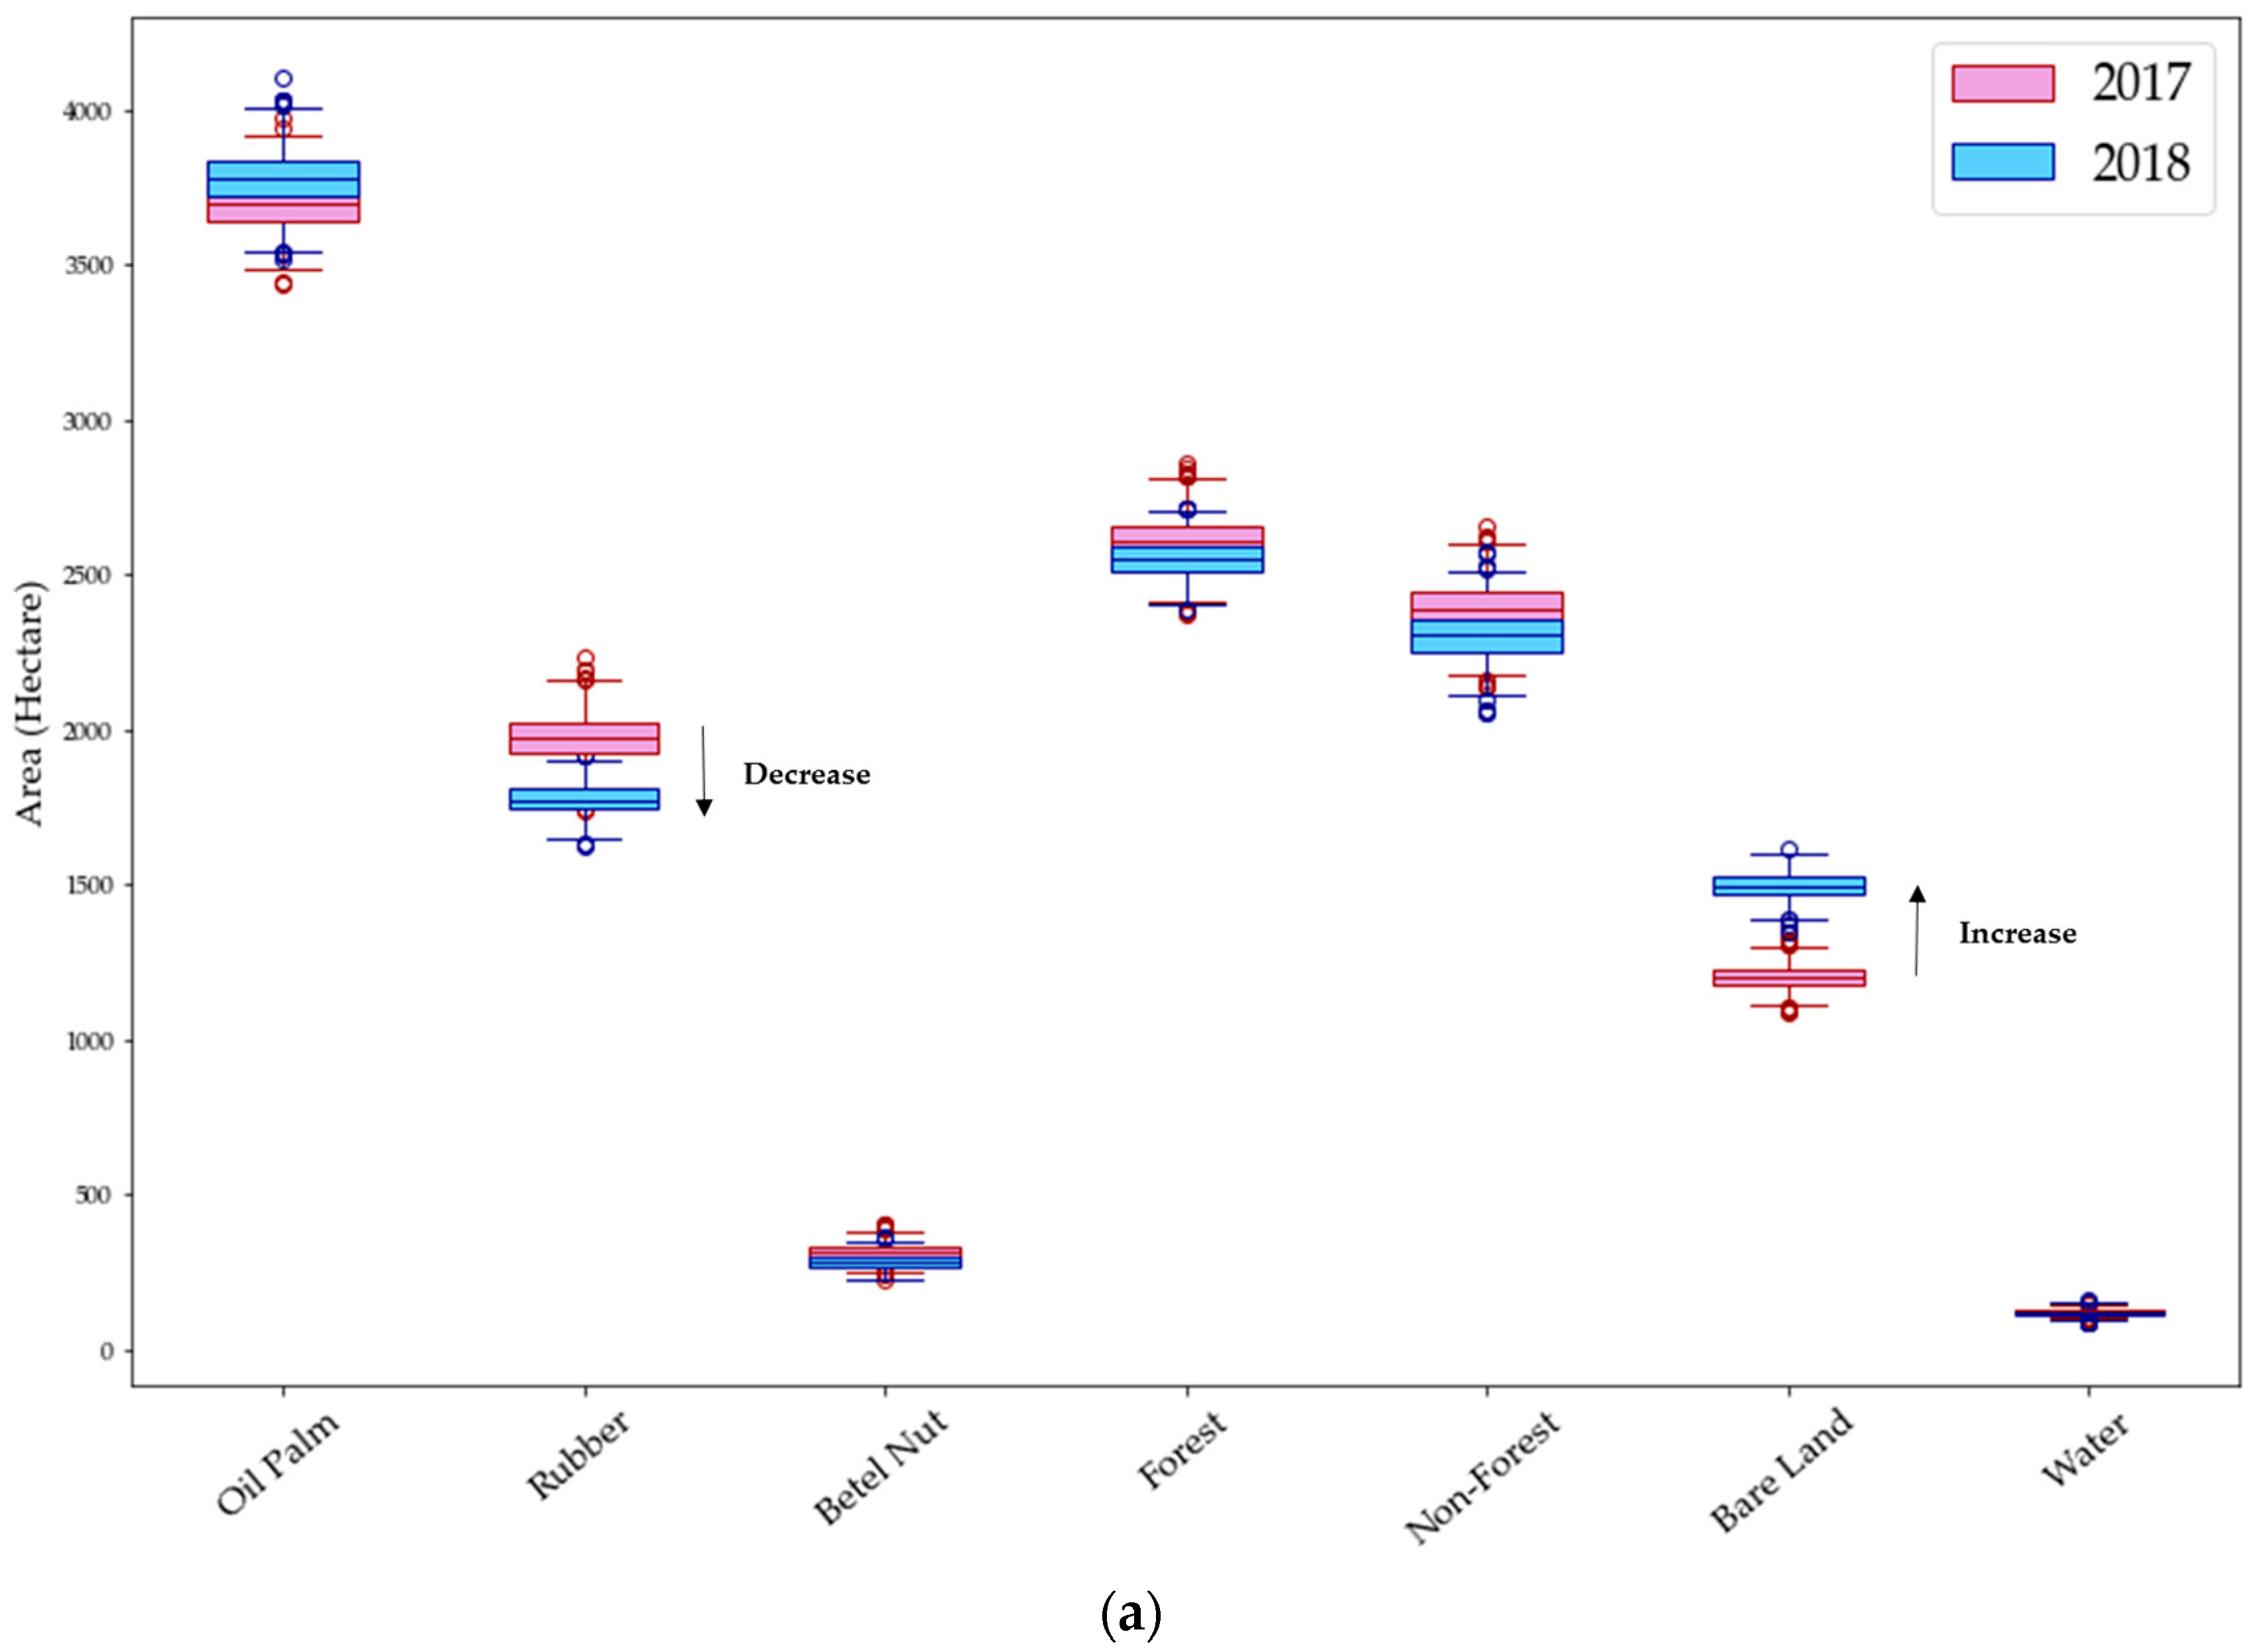
The area changes from 2017 to 2018 were examined by considering the differences between the years, compared to the spread of values from the 1000 iterations.
Figure 7 shows boxplots for each area in 2017 and 2018: the median value of the area size (hectare) of each class, the minimum and maximum values, and the 25th and 75th percentiles indicating 50% of the distribution of the data. We considered it likely that there was a significant change if there was no overlap in the interquartile ranges of the two sets of data (represented graphically as no overlap in the box portion of the boxplots in
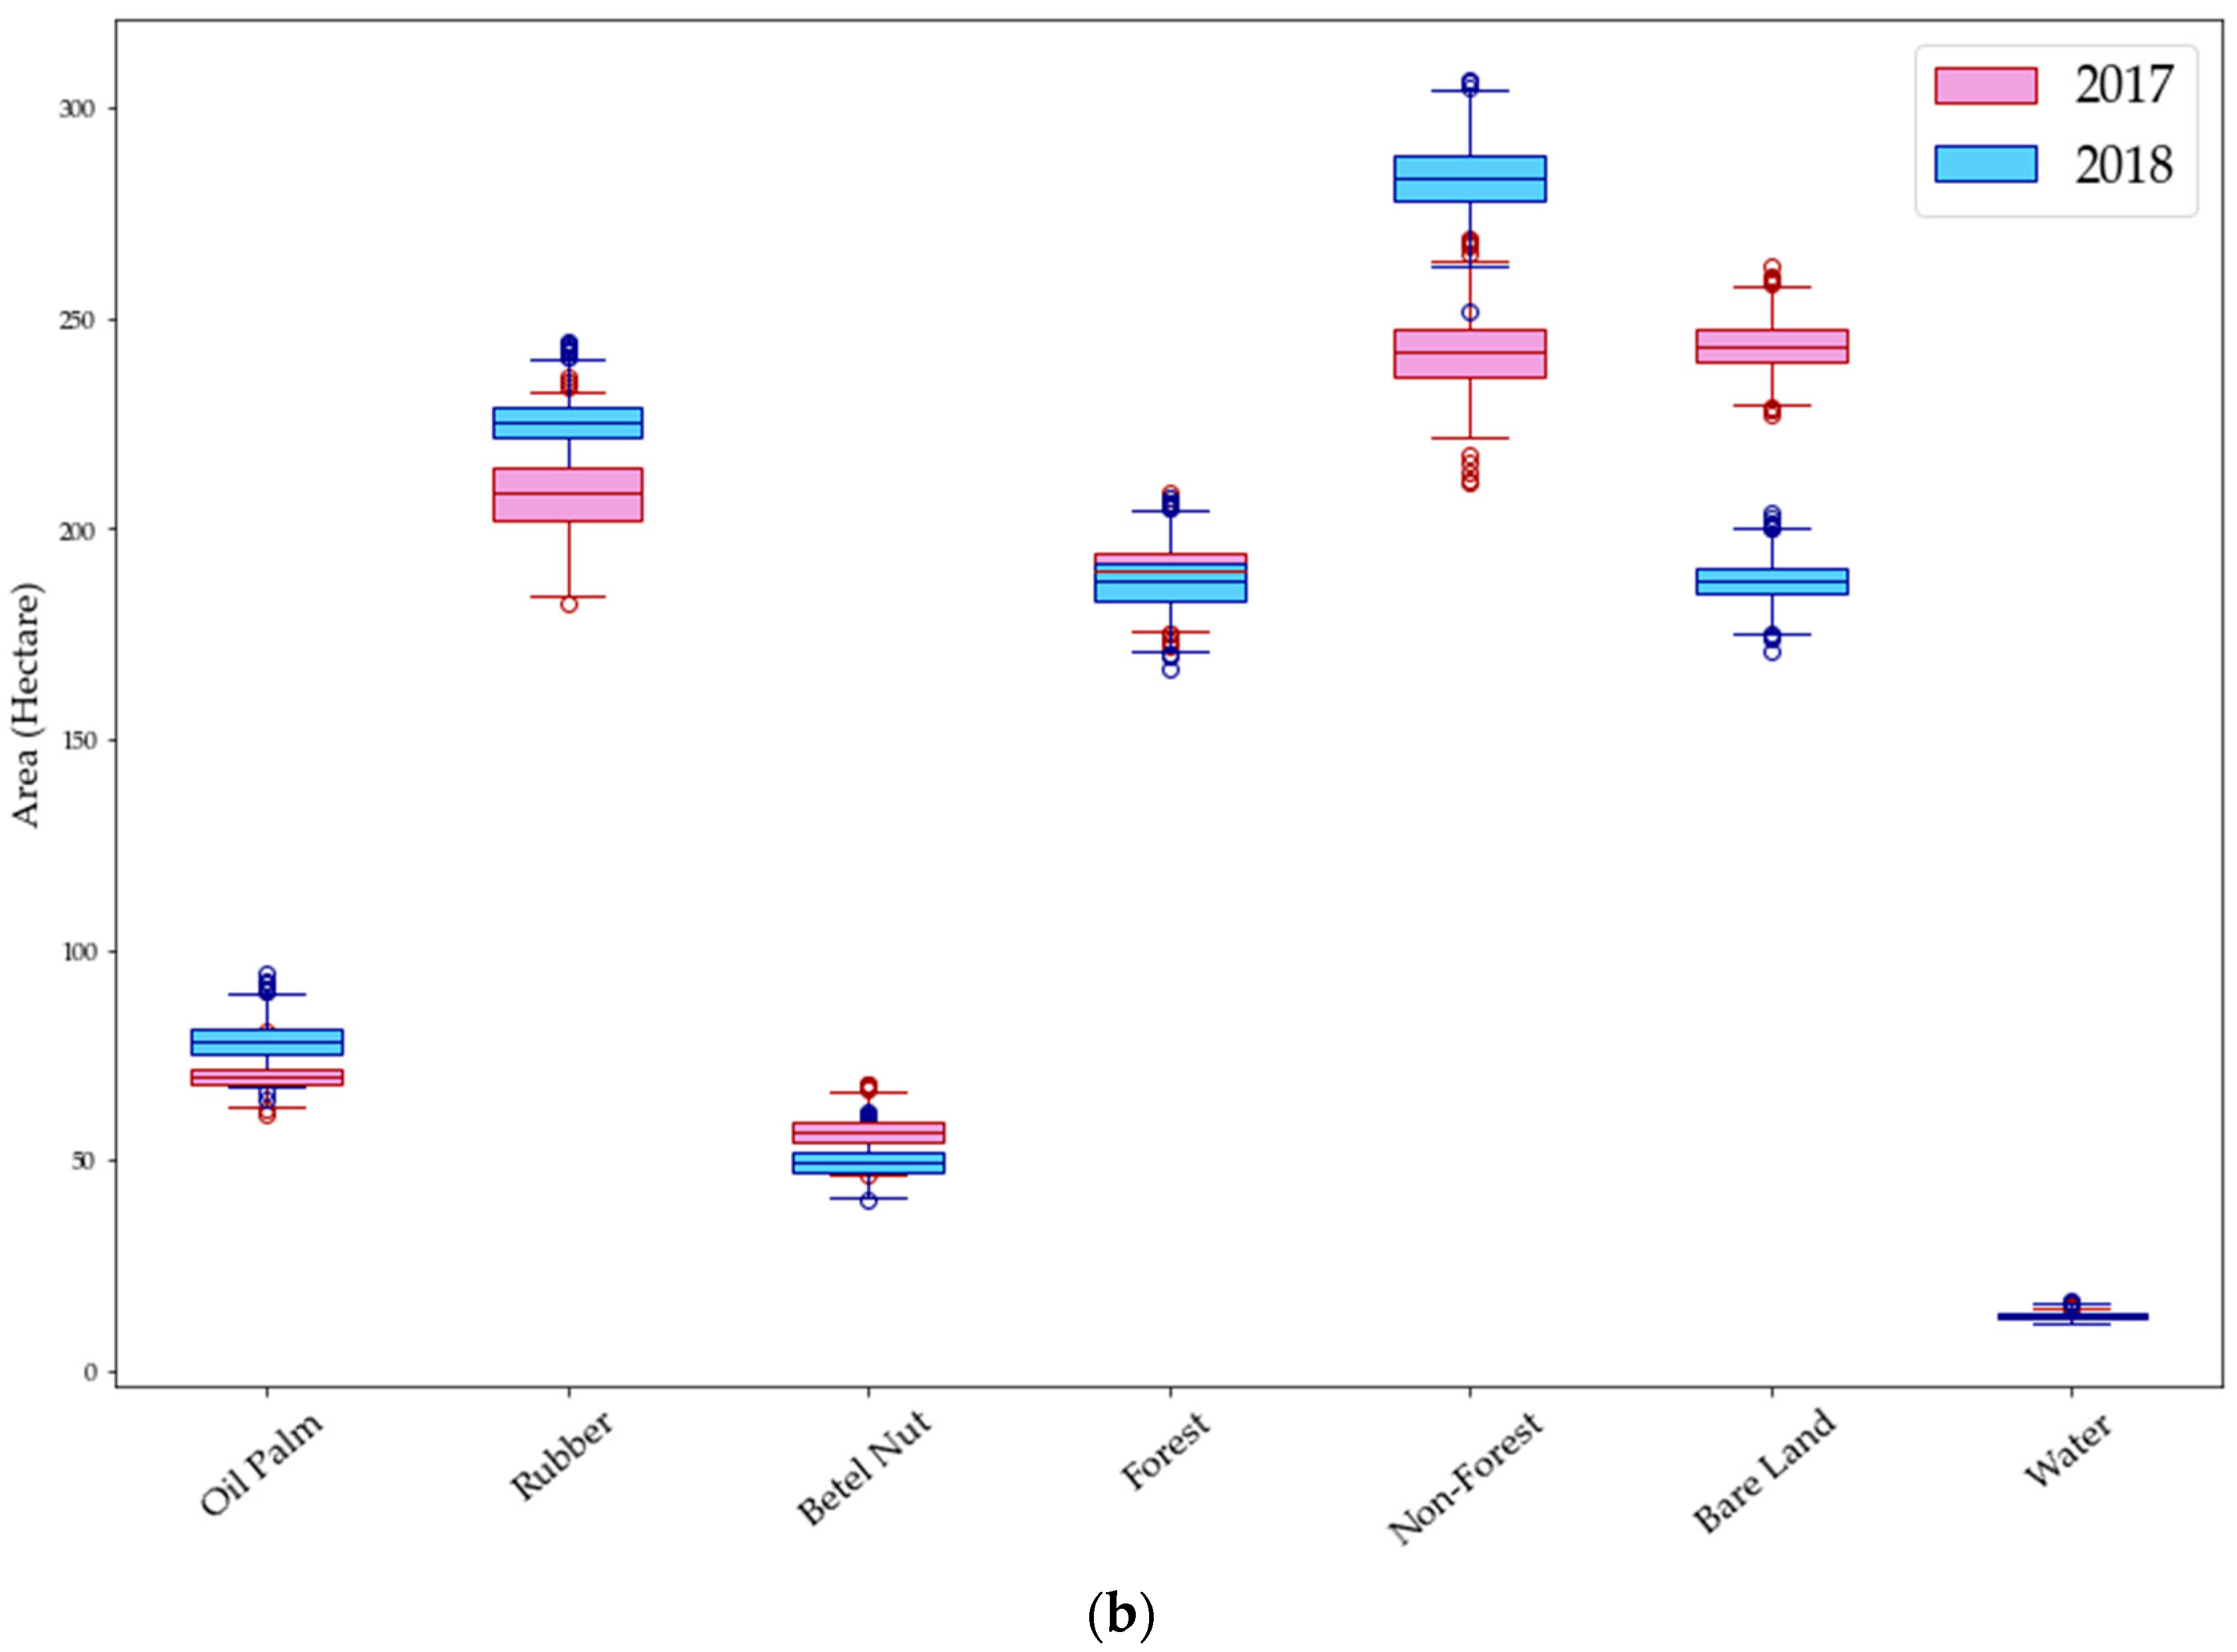
Figure 7). In Area A, the changes were significant for three classes: rubber, betel nut, and bare land. In Area B, most of the classes show differences in area, except for forest and water classes (
Figure 7).
Taking the median values of the results, in Area A, bare land increased by 24%. This indicates the clearing of trees between 2017 and 2018, which seems to be accompanied by decreases in betel nut and shrub areas. The rubber plantations also showed a decline of 10%; however, the visual interpretation shows a clear increase of rubber, especially in the south of Area A. This may be due to an overestimation of rubber plantations in 2017, as most of the rubber plantations were young, making them difficult to distinguish from other classes, especially shrubs, resulting in more pixels classified as rubber sporadically across the area, as well as around the edges of various vegetation types.
In Area B, shrub area and oil palm plantations increased by 17% and 11%, respectively. It should be noted that increases in plantations do not indicate planting of the crop between 2017 and 2018, as such new plantations are more likely to be classified as bare land or shrubs. Rather, the increases show the growth of crops that were planted a few years earlier, to the point where they become detectable. The rubber plantations also show an increase of 8%. Similarly to Area A, most of the rubber plantations were young in 2017, and the classified map shows a widespread increase of rubber in 2018. These increases in plantations and shrubs are consistent with a decrease in bare land.
4. Discussion
The main advantage of Sentinel-2 (S2) data is its multispectral instruments with 13 bands, which we believe was the main factor in achieving high accuracy rates (
Figure S1). Therefore, for the purpose of classification, it is not necessary to have a spatial resolution sufficient to see individual trees in order to differentiate tree crops. In fact, the level of accuracy achieved in this study (>95%) is higher than the average accuracy rates achieved with hyperspatial images with object-based classification methods [
14,
15,
16].
The high spatial resolution of S2, at 10 to 20 m, should be sufficient to classify even very small plantations, making it the ideal tool for mapping fragmented landscapes. While this study used the 20 m spatial resolution for classification, using lower spatial resolutions will likely achieve an even higher accuracy, depending on the purpose of classification and the type (and size distributions) of plantations in the area. In addition, more texture indices may improve the performance of the classifier.
A close examination of the maps, however, revealed limitations of classification accuracy when classifying a large area. The difficulty in classifying the area without reference data nearby implies that more reference data are necessary. However, adding more data will be limited, depending on the computation capacity of the program used. Therefore, the target area has to be limited to a certain extent, considering the computational burden, time, and labour, when classifying complex landscapes.
Furthermore, the levels of maturity or growth of plantations in the reference data affect the ability of the classifier, as evidenced by the impacts of young rubber plantations in 2017. As young plantations tend to confuse the classifier, it is recommended that the year or area where sufficient reference data with mature plantations are available is selected, and it should be accepted that plantations of particular species will only become visible in the classification after a few years of growth. While it is possible to classify crops like betel nut plantations that exist in small patches made of small trees, it remains as a challenge to classify young plantations themselves.
It is also important to note that the results are sensitive to each and every reference data point, which are entirely based on the judgement and skill of the interpreter. In addition to a priori knowledge of the area, precision and meticulousness in selecting reference data is required, especially when classifying complex landscapes at a high resolution. In this study, reference data were selected from where the interpreter can be certain about the class based on the images and knowledge of the area. Therefore, by excluding the areas with possibly mixed classes where they are difficult to classify, the reported accuracy may be higher than reality. This could be fixed by creating a test dataset from random, rather than a selection of ‘ideal’, points. However, the difficulty here is that error would then exist in the test dataset, confusing the interpretation of results.
5. Conclusions
Sentinel-2 (S2) data can successfully classify complex landscapes with small plantations, forests, and shrubs with more than a 95% overall accuracy against independent test data. While different trees crops are not visibly distinguishable in S2 images, when trained with reference data, S2 can classify small plantations such as rubber and betel nut trees with more than a 94% and 85% accuracy, respectively. However, quantifying the changes between 2017 and 2018 presented a challenge due to the dominance of young rubber plantations in 2017 in these particular study areas. The interpretation of the results is therefore limited to: the increase of bare land in Area A, due to the clearing of betel and rubber trees; and the decrease of bare land in Area B due to the increase of shrubs, oil palm, and rubber plantations, which are likely to have been planted a few years earlier. The results show a contrast in the level of activities in tree clearing and the trend of rubber plantations in two areas.
The accuracy results indicate the strength of Sentinel-2’s multispectral bands in producing accurate classifications of similar land cover classes at a high (20 m) resolution. However, it should be noted that a large amount of reference data is required to classify complex landscapes with confidence, which restricts the size of the area to be classified, given limitations in terms of the collection of training points and the analysis of data.


