Article

Long-Term Ground-Based Measurements of Aerosol Optical Depth over Kuwait City

by
Panagiotis Kokkalis
1,*,
Hala K. Al Jassar
1,
Stavros Solomos
2,
Panagiotis-Ioannis Raptis
3,
Hamad Al Hendi
1,
Vassilis Amiridis
2,
Alexandros Papayannis
4,
Hussain Al Sarraf
5 and
Marwan Al Dimashki
6
1
Department of Physics, Kuwait University, P.O. Box 5969, Safat 13060, Kuwait
2
Institute for Astronomy, Astrophysics, Space Application and Remote Sensing, National Observatory of Athens, Penteli, 15236 Athens, Greece
3
Institute for Environmental Research and Sustainable Development, National Observatory of Athens, Penteli, 15236 Athens, Greece
4
Laser Remote Sensing Laboratory, National Technical University of Athens, 157 80 Zografou, Greece
5
Department of Mathematics and Natural Sciences, American University of Kuwait, P.O. Box 3323, Safat 13034, Kuwait
6
Environment Public Authority, P.O. Box 24395, Safat 13104, Kuwait
*
Author to whom correspondence should be addressed.
Remote Sens. 2018, 10(11), 1807; https://doi.org/10.3390/rs10111807
Submission received: 28 September 2018 / Revised: 6 November 2018 / Accepted: 10 November 2018 / Published: 15 November 2018
(This article belongs to the Section Atmospheric Remote Sensing)

Abstract

:
We analyze ten years (2008–2017) of ground-based observations of the Aerosol Optical Depth (AOD) in the atmosphere of Kuwait City, in Middle East. The measurements were conducted with a CIMEL sun-sky photometer, at various wavelengths. The daily average AOD at 500 nm (AOD500) is 0.45, while the mean Ångström coefficient (AE), calculated from the pair of wavelengths 440 and 870 nm, is 0.61. The observed high AOD500 values (0.75–2.91), are due to regional sand and dust storm events, which are affecting Kuwait with a mean annual frequency of almost 20 days/year. The long-term record analysis of AOD500 and AE, shows a downward and upward tendency respectively, something which could be attributed to the continuous expansion and industrialization of the main city of Kuwait, in combination with the simultaneous increase of soil moisture over the area. By utilizing back trajectories of air masses for up to 4 days, we assessed the influence of various regions to the aerosol load over Kuwait. The high aerosol loads during spring, are attributed to the dominance of coarse particles from Saudi Arabia (AOD500 0.56–0.74), a source area that contributes the 56% to the mean annual AOD500. Other dust sources affecting significantly Kuwait originated from the regions of Iraq and Iran with contribution of 21%.

1. Introduction

It has been already identified and commonly accepted, that aerosols are holding a very important role to the Earth’s climate (e.g., [1]). Despite the numerous scientific efforts during the last decades towards our better understanding of aerosol effects on climate, their large spatial and temporal variability, heterogeneity and spectral varying behavior still cause significant uncertainties at global scales [1]. At regional scales, aerosols can affect the climate via radiation forcing and interaction with cloud but also degrade air quality, visibility and public health. Especially, interest has been raised to aerosols with spectrally varying absorption (e.g., [2,3,4,5]) such as dust that are responsible for the largest part of radiative forcing uncertainty [1]. The aim of this study is to investigate a short term aerosol climatology at Kuwait, on the eastern edge of Arabian desert, which is less studied compared to other desert regions and quantify the trends under rapid urban development and alteration of general meteorological conditions.
Within this framework, part of the scientific effort is focused on the improvement and sustainability of continuous measurements, through the establishment of networks dedicated to systematic aerosol observations. Among others, some of the widely known, global and regional networks are the following: the EARLINET (European Aerosol Research LIdar NETwork; [6]), the Micro Pulse Lidar Network (MPLNET; [7]) the AERONET (AErosol RObotic NETwork; [8]), the AeroCAN (Canadian sun photometer network; [9]), the SKYNET (SKYradiometer NETwork; [10,11]) and the GAW-PFR network (Global Atmosphere Watch Precision Filter Radiometer; for example [12]). Main objectives of operational networks are to provide, long-term global climatological aerosol properties but also to validate satellite observations and evaluate global and regional aerosol models.
On the other hand, the development and implementation of satellite sensors (e.g., Moderate Resolution Imaging Spectroradiometer, Spinning Enhanced Visible and Infrared Imager, Cloud-Aerosol Lidar and Infrared Pathfinder Satellite Observations, Atmospheric Dynamics Mission Aeolus, Earth Clouds, Aerosols and Radiation Explorer) for monitoring aerosol properties, can provide an enhancement to uncertainties related to aerosol spatial variability and can also serve to the development of consistent long term climatological datasets [13,14,15]. Nevertheless, ground-based measurements are still valuable, in order to evaluate and correct the aerosol products obtained from space, especially under specific aerosol loads and to cover temporal gaps, as satellite recordings are limited to a small number per day (e.g., [16,17,18,19,20]).
In addition to that, the ground-based atmospheric observations hold a more important role especially over arid and desert areas such as South Africa, Middle East and West Asia, due to the (a) uniqueness of these environments, since they are considered as major dust sources (b) the low availability of such measurements and (c) the lack of space borne instruments to provide trustworthy results over such regions. Many atmospheric studies have been conducted over such arid and semi-arid regions, either in the framework of dedicated field campaigns or describing unique events under specific atmospheric conditions. However, most of them are focused over the arid areas of Africa (e.g., [21,22,23,24]) and Asia (e.g., [25,26]), with some exceptional measurements over the southern borders of Middle East with the Eastern Mediterranean (e.g., [27,28]), leaving the locations near the center of Arabian Peninsula, still unresolved.
Aiming to contribute to the climatological recordings of the area, here we present ten years (2008–2017) of aerosol optical properties, measured in the Middle East and more precisely in Kuwait City, the most significant, by means of population, urban center in Kuwait. Kuwait has the longest available time series of ground-based measurements that is available in the greater Middle East area. So far, a number of studies exist in the literature related to the aerosol levels in Kuwait, following however different instrumentation and methodology. For example, Sabbah et al. [29], studied the long-term variation of aerosol optical properties over Kuwait, by using satellite data obtained from MODIS instrument. On the other hand, during the last 20 years, in situ measurements of dust particles and soil moisture studies are conducted in Kuwait (e.g., [30,31]), however focused mostly on soil conditions and particle shape and composition rather than on their optical properties. Recently Sabbah et al. [32] studied dust and dust storms over Kuwait with ground-based and satellite observations, covering a time period of 5 years (up to 2012).
In this study we report the aerosol levels in the arid area of Kuwait with sun-sky photometric measurements obtained from ground for more than 5 years (2008–2017) and to the best of our knowledge this is the first time that on a statistical basis, these levels are further categorized and linked according to the air mass origin over the area. Our methodology and instrumentation is presented in Section 2. The levels of the aerosol optical properties in the atmospheric column along with their seasonal variability are presented in Section 3.1. In Section 3.2, we utilize cluster analysis in order to identify the major source regions of particles and the typical paths of their transport towards the northern edge of Eastern Arabia, in Kuwait. Finally, our conclusions are provided in Section 4.

2. Materials and Methods

2.1. CIMEL Sun-Sky Radiometer

The sun-sky radiometer is located on the roof of building 33 KH in the Physics Department of Kuwait University, in Khalidiyah campus (29.325°N, 47.971°E, elev.: 42 m, a.s.l.) and operates almost continuously since 2008 up to now. Khalidiyah is an urban area, approximately 4.8 km west from Kuwait City and 10 km away from the coastal line. Moreover, the site location appears to be around 25 km east of the desert areas of the state. The instrument is part of NASA’s global sun photometric network AERONET [8], which includes more than 500 operational stations. The sun-sky photometer is capable of performing automatic measurements of the direct solar irradiance at the common wavelengths of 340, 380, 440, 500, 675, 870, 940, 1020 and 1640 nm and diffuse sky radiance at 440, 675, 870 and 1020 nm, respectively. These measurements are used afterwards to provide, both optical and microphysical aerosol optical properties in the atmospheric column [33,34]. Recently released Version 3 of AERONET direct product includes significant improvements for the direct sun measurements, related to the screening of clouds, the automated data quality assurance, the inclusion of data with higher air masses (up to 7, in contrast with v2 that is up 5) and additionally implements spectral temperature corrections based on laboratory measurements [35,36]. To benefit from the above innovations, in this study we used the level 1.5 version 3 AERONET data products, related to the columnar aerosol optical depth (AOD) and the Ångström exponent (AE), at various wavelengths.

2.2. HYSPLIT Model and Cluster Analysis

The climatological partitioning of air mass trajectories arriving over Kuwait is analyzed with HYSPLIT Lagrangian trajectory model [37]. The model is set up to provide 96 h (4 days) daily back-trajectories for a 10 year period (2008–2017) and for 6 arriving heights (0.5, 1.5, 2.5, 3.5, 5.5, 7.5 km), driven by GDAS (Global Data Assimilation System) reanalysis data, at a resolution of 1° × 1°. Cluster analysis of the 10-year back-trajectories is used to identify the distinctive directional clusters for the arriving air masses. In general, certain limitations on the use of coarse meteorological forcing need to be taken into account for a Lagrangian study (for example the inaccurate representation of convective motions). However, the use of a 10-year-long dataset in this study increases our confidence on the statistical robustness of our results, although systematical errors and limitations of this approach should always be considered when interpreting the results. For the cluster analysis, we used only the trajectories that approach the surface (i.e., include heights below 1.5 km along their paths). These trajectories imply some Planetary Boundary Layer (PBL) residence time for the corresponding air masses and thus are eligible of transporting pollutants towards Kuwait.

2.3. MODIS AOD Dataset

In order to cross check our climatological values and trends of aerosol optical properties, we used also the daily level-2 collection 6.1 MODIS/Terra AOD at 550 nm (AOD550), for the time period 2008–2017. The Terra satellite is sun-synchronous and near polar-orbiting, with a circular orbit of 705 km above sea level, capable of scanning 36 spectral bands across a 2330 km wide swath. Daily overpass data for the specific area were extracted at a spatial resolution of 50 × 50 km2. Narrower area selection will create data gaps due to exact overpass location and previous studies have shown that such spatial resolution provide the optimal viewing for aerosol climatology (e.g., [38]). The overpass time is 10:20 UTC ± 45 min for Kuwait City.

2.4. ESA CCI Soil Moisture Dataset

The Soil Moisture CCI project is part of the ESA Program on Global Monitoring of Essential Climate Variables (ECV) and provides a multidecadal database of satellite observations [39,40,41]. For building this database, data products from multiple microwave instruments have been used. These data products were generated using different retrieving techniques and have different spatial and temporal resolutions. The data records are merged on a daily basis by applying a state of the art quality control [39]. For the present study, we have used the combined (passive and active sensors) product, averaged in the greater Kuwait area (28–30°N, 46–48°E) over the 2008–2016 period.

3. Results & Discussion

3.1. AOD Levels and Seasonal Variation

The aerosol optical properties used in this study, namely the AOD at 500 nm (AOD500) and the Ångström exponent derived from the pair of wavelengths 440 and 870 nm (AE), cover the time period from January 2008 to December 2017 (Figure 1). During this time span, measurements are available on >50% of the days. The observed time gaps are due to system malfunction and/or calibration and upgrade issues (~33%), while the remaining ~17% can be attributed to the existence of clouds or rain.
During the aforementioned time period, various spikes in AOD500 can be observed (Figure 1), which are associated with local sources of particles or strong aerosol loads transported from far away sources. The same pattern is also clear for AE, with the majority of the observations to be around the median value of 0.57, indicating the aerosol coarse mode dominance in the atmospheric column over Kuwait City (Figure 2). The mean daily AOD500 found to be 0.45 ± 0.29, with 50% of the values lying in the range bin 0.15–0.58 and modal AOD interval of 0.34–0.40. The mean daily AE found to be 0.61 ± 0.39, with 50% of the values lying in the range 0.14–0.91 and with 0.12–0.20 representing the modal AE. The basic statistics (i.e., minimum, maximum, 1st quartile—Q1, 3rd quartile—Q3 and median) for all wavelengths are given in Table 1. Some extreme values of AOD500 that can be observed at the tail of the distribution in Figure 2a and reported also in Table 1 (max. AOD500 = 2.91), are due to regional severe dust storms (e.g., [42,43]). These events, account for most of ~65% of the day-to-day variability, observed for AOD500.
Sand and dust storms (SDS) seem to occur mainly during the transitional monsoon seasons of spring and fall, defined as when the daily AOD500 is one standard deviation above the mean value of its distribution (i.e., AOD500 > 0.75) and AE is less than 0.5. Spring (post-Northeast monsoon season) and fall (post-Southwest monsoon season) seasons seems to be mostly affected by SDS. For these events, mean AOD500 and AE values found to be 1.04 ± 0.32 and 0.13 ± 0.01, respectively. May seems to be the month in which SDS events can be observed with the highest frequency, while it seems almost 4–5 times less probable for such events to occur during the fall months (Figure 3). During winter and summer months (monsoon periods), SDS appears with the least frequency, with some exceptional cases however present during February and June. For the entire time period of this study, Kuwait is found to be affected by SDS with a mean annual frequency of 19.4 days/year, ranging from 35 days/year (in 2008) to 13 days/year (in 2017), in agreement with recent studies performed with satellite images and in-situ measurements (i.e., dust traps) [44]. The lasting time period of these events, varies from 1 up to 5 consequent days, with the latter appearing during the months of May and June.
Regarding the annual variability of the total aerosol load, maximum AODs are found at spring with a peak in May and a monthly average value of 0.63, in coincidence with minimum AE of 0.28 (cf. Figure 4). The most intense loads at that month seems to have happened in 2012, while during the next years (2012–2017), lower mean monthly aerosol loads are observed. Minimum AODs are found in the period of December to January (0.26–0.29), with moderate values of AE (~0.92), while, during the rest of the period, AODs vary around the average value. The maximum level of AE (0.96) is observed in December. The same annual pattern seems to be followed also by AOD550, obtained by MODIS combined Dark Target and Deep Blue product averaged within 50 × 50 km2, for the under study time period. Throughout the year the MODIS data seems to deviate up to 15% with respect to the ground based observations. Minimum deviation appears in Autumn (~−1%), while in late winter and spring MODIS may overestimate AOD values by 30% on average. As a consequence, the main seasonal pattern is reproduced by MODIS, namely the spring maximum; however, spring levels are relatively enhanced.
At Figure 5, monthly averaged values of the AERONET level 1.5 products are provided. Level 1.5 inversions data are preferred for climatological studies, even having larger uncertainty, because the quality control for level 2.0, filters out data with Solar Zenith Angles less than 50° and AOD at 440 nm lower than 0.4, leaving non-significant amount of dataset for the calculations [42]. Single Scattering Albedo (SSA) spectral variation through the year, should be consider as an indication for the type of aerosols. Although SSA at 670 nm has always larger values, during winter months it is almost identical to the one at 440 nm, while it is significant lower at larger wavelength. In contrast, for the period from May to October (with the exception of August) this pattern is reversed. Moosmuller et al. [45] linked the iron concentration of mineral dust aerosols to significant lower SSA at 405 nm than 870, which indicates a dominance of these particles during these months. While aerosols associated with urban pollution clearly increase SSA with wavelength [46]. The mixed picture mainly recorded at August should be linked to polluted dust mixture. Size distribution monthly average plot demonstrates significant larger coarse mode around spring-summer months (April–August) which should be linked to higher dust loads. The fine mode has relatively higher concentrations during winter months, where the presence of dust particles is limited and the contribution of urban particles to the total aerosol load is increased.
Figure 6 shows the percentage deviation of the monthly mean values of AOD500 and AE (obtained by AERONET) and AOD500 (obtained by MODIS), by excluding the seasonal influence on the recorded dataset. More precisely, in Figure 6a, a negative trend of the order of 3.3 ± 0.7% per year is observed in terms of the aerosol load, as estimated from the AERONET data (black dashed line). Similar trend 2.9 ± 0.9% is also observed for the AOD550 MODIS dataset (green dashed line in Figure 6a). Both of them have passed statistical significance testing with null hypothesis of an approximate Student’s distribution with 5% significance (p < 0.05). In turn, a positive change of the order of 4.8 ± 0.1%, is depicted in AE (Figure 6b), which indicates that over the years, the size range of the particles observed over the atmospheric column, have been shifted to lower values.
The aforementioned trends can be attributed to the urbanization – industrialization of the main city of Kuwait and to a decrease of dust emission from nearby deserts. The land cover maps presented in Figure 7, were generated using Landsat Image (2006; 15 m resolution) and Spot Image (2010; 5 m resolution). Image Classification and field verification were used to identify the classes showed in Figure 7. As presented here, the land usage of the main city has changed and the more pronounced differences between the years of 2006 and 2010, seems to be related to the degradation of the limited greenery in the built-up areas, as well as to the change of the bare land to greenery-grassland, outside the main built-up area. Moreover, during the last decade Kuwait underwent a rapid urbanization since the population almost doubled, reaching the 4.2 million with a density of 235.56 inhabitants/km2. For example, in 2007, due to the discovery of new oil reserves, Kuwait had the third highest net migration rate in the world at 16.01%, which led to a large and growing immigrant population (http://worldpopulationreview.com/countries/kuwait-population/). Since then, the state has a mean positive growth rate of ~6.5% (http://countrymeters.info/en/Kuwait), leading to an increase of anthropogenic activity and land usage changes, the two main factors considered to be responsible for the observed positive trend of the AE exponent.
Soil-surface conditions (i.e., soil moisture) and surface wind speeds have generally been regarded as the main factors for determining the mobilization of sand and dust in dust-source regions (e.g., [47,48,49,50,51]). The low soil moisture level, seems to be responsible for relaxing the cohesive forces among the particles, leading thus to easiest lift and transportation of coarse dust particles in the atmosphere. The observed high aerosol load, especially during spring season, along with the low AE values, can be attributed to the low soil moisture values that are prevailing in the desert area but also to the observed trends.
For verifying this, monthly de-seasonalized variation of soil moisture in the greater Kuwait is presented in Figure 8, which show an increase trend over the more recent years. In order to make these data comparable an additional filter have been applied, that each month should have at least 25 days with more than 90% quality controlled data points in the area. Only one month has been filtered out with this procedure. In particular, an augmenting trend of 1.9% per year is recorded, which had passed a statistically significant Student’s t test for confidence at 95%. This increase is a factor that weakens dust emissions in the greater area (as shown at Kingmüller et al. [47]), which is linked to the recorded decrease in AOD, especially in coarse mode. Although, soil moisture is only one of the factors affecting the aerosol load, in the dust aerosol dominated area of study, a significant change in the soil conditions could explain an important part of the variation. Especially the very large positive variations in soil moisture, ongoing from summer 2015, are correlated to some of the lowest AODs of the period at both AERONET and MODIS databases.

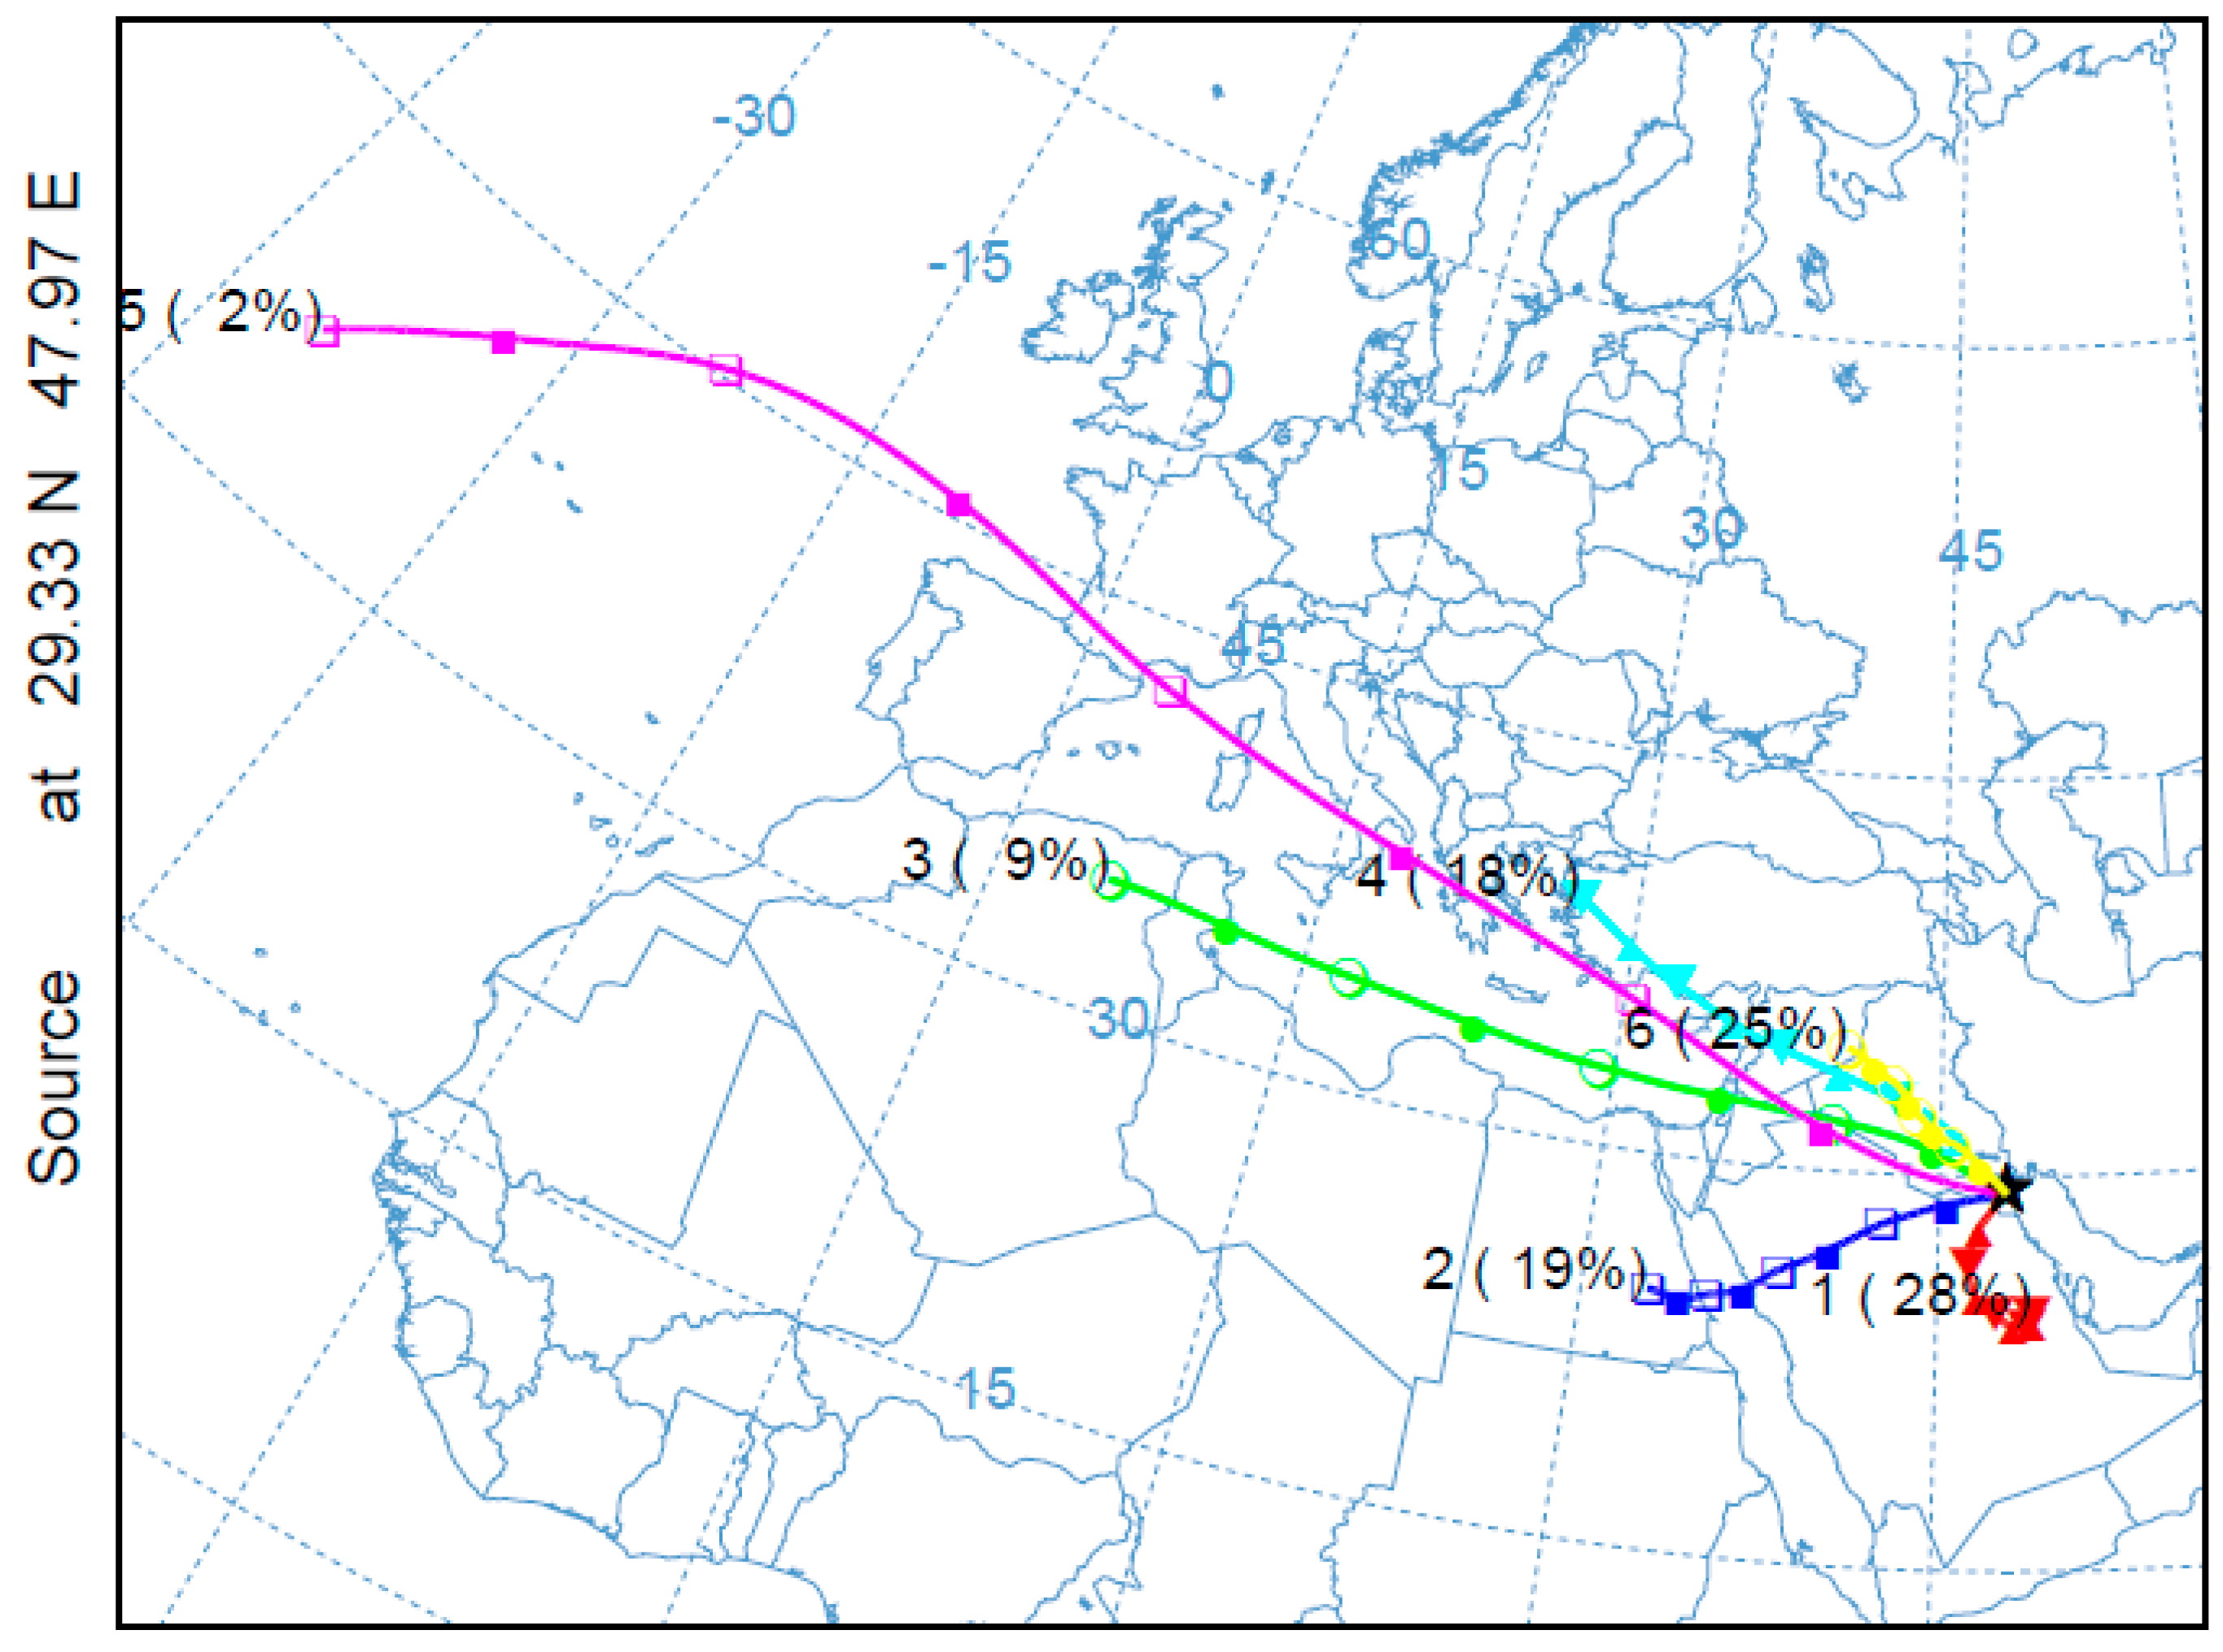
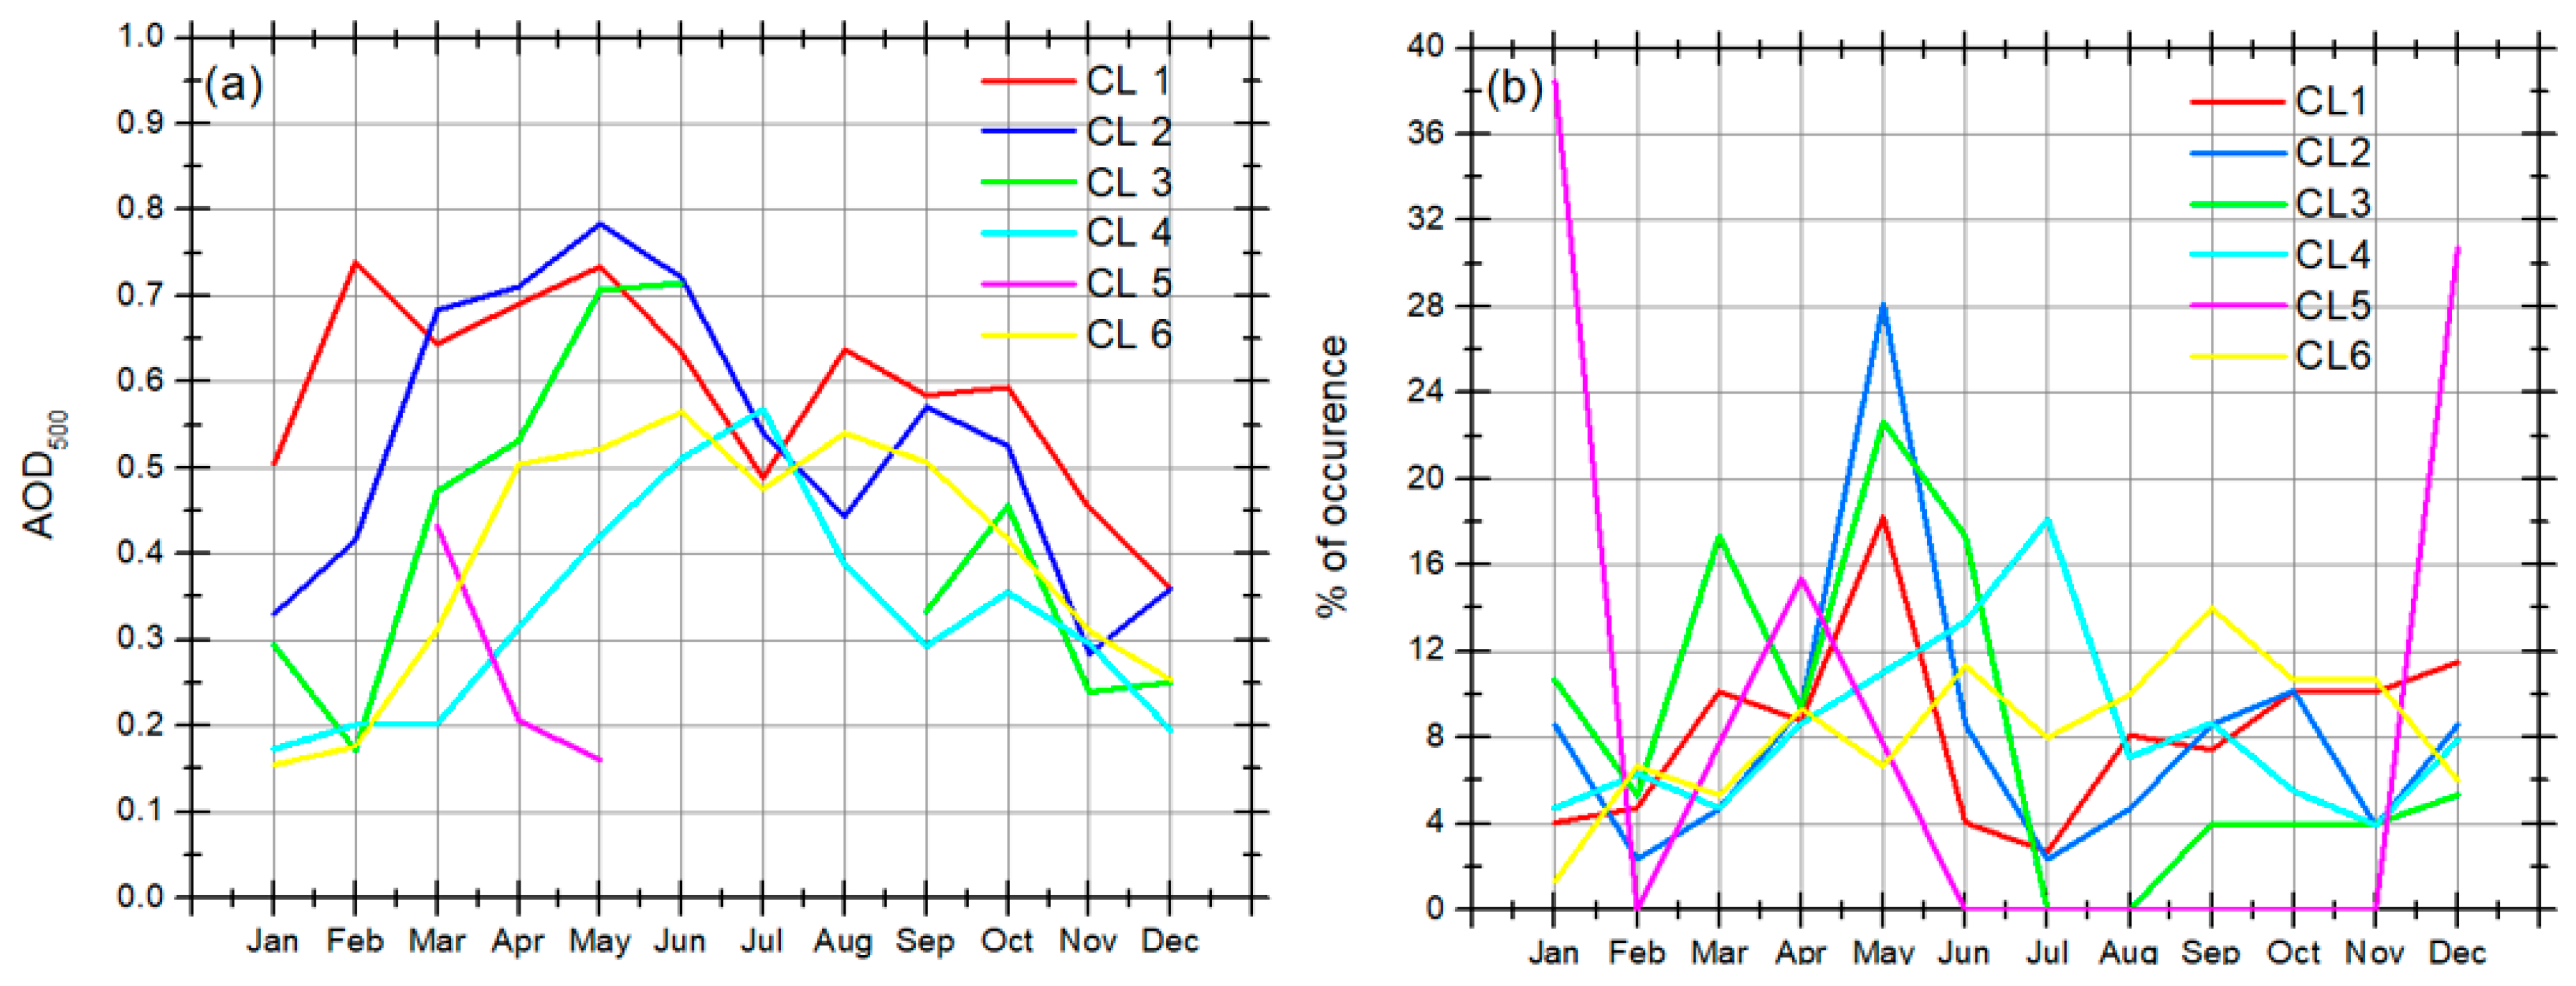
3.2. Origin of Air masses Over Kuwait

The high columnar AOD values observed in Kuwait can be attributed to: (i) the anthropogenic activity and the local sources linked to the aerosol load inside the boundary layer and (ii) apparently to the dominance of dust particles in the atmospheric column. The latter can be further categorized to dust particles that have been transported through high altitudes from transnational regions and to particles circulated within the boundary layer, originating from local arid and semi-arid sources.
In order to investigate any possible relation between the measured AOD levels and the origin of the air masses arriving over the station, we used HYSPLIT model to generate four day back trajectories for air-parcels arriving at 12:00 UTC over Kuwait at 0.5, 1.5, 2.5 3.5, 5.5 and 7.5 km a.s.l. The HYSPLIT runs were performed for every single day with available AERONET retrievals. These trajectories were further filtered to select only the trajectories approaching the surface and categorized in six major clusters. For each cluster, the corresponding centroid has been determined and drawn. The centroids represent the mean transport path of the air masses arriving over Kuwait (Figure 9).
The general atmospheric circulation at the areas of Arabian Sea and SW Asia is mainly defined by the annual interchange between northeast monsoon season (December–March) and southwest monsoon season (June–September) along with the intermediate transition seasons (spring and fall). The northeast monsoon is characterized by a northeasterly low level flow resulting mainly from the combination of a high pressure system at Siberia with a deep Australian low. The onset of the summer southwest monsoon is identified by the northward shift of the Intertropical Convergence Zone (ITCZ) and the development of the cross-equatorial Somali Jet that enforces the low level southwest winds from the east coast of Africa towards India [52].
The weakening of the northeasterly winter monsoon during the transition spring season is accompanied by the development of low-level thermal heat lows and the establishment of cyclonic flow patterns over the Arabian Peninsula. This circulation type is represented by CL1 28% and CL2 19% in (Figure 9). CL1 represents short range trajectories from the central and east parts of Saudi Arabia while CL2 represents trajectories originating from the northwest parts of Saudi Arabia, Red Sea and Egypt. These pathways imply the mobilization of dust from Arabian Desert sources towards Kuwait and result in high mean AOD500 of 0.55 ±0.02 (Table 2) mostly during March-June (Figure 10a). Moreover, during May, air masses arriving from the Mediterranean coast of Africa over Middle East (Lebanon, Syria, Iraq) (CL3), contribute also to high AOD (AOD500 = 0.47 ± 0.03). The maximum frequency of occurrence for CL1, CL2 and CL3 appears to be in the spring transition period (May) with values of 18.2%, 28.1% and 22.7%, respectively (Figure 10b).
The north sector clusters CL4, CL5 and CL6 are associated with the northerly flow throughout the year and most profound during the summer monsoon period (May–August) and early fall transition season (September) as seen by their frequency of occurrence in (Figure 10b). The mean AOD500 for CL4 is 0.32 ± 0.02, for CL5 0.25 ± 0.02 and for CL6 0.40 ± 0.02 (Table 2). CL4 and CL6 have similar centroids but are separated because they represent different scale transports. CL6 represents short range transport from north sector (mainly Iraq and Iran) while CL4 represents longer range transport from NE sector including Turkey and Eastern Mediterranean. In addition, the pathway of CL4 is more profound during summer months due to the seasonal persistent north winds over the Aegean Sea (Etesian winds). These clusters represent the north Shamal winds that mobilize dust from the nearby arid regions of Iraq and Iran towards Kuwait, with the shorter CL6 cluster being more typical of the channeling of Shamal flow towards the Gulf. The air masses originating from the northeastern Mediterranean and Turkey (CL4) (Figure 9) are also related with the transport of anthropogenic particles from the aforementioned region, linked with the lower AOD500 values (0.32 ± 0.02) (Table 2). The lowest aerosol load (0.25 ± 0.02) is observed for air masses arriving from CL5, which accounts for 2% of the back-trajectories (Table 2) and maximum frequencies during January (38.4%) and December (30.8%) (Figure 10b). Overall, it seems that short trajectories (i.e., CL1, CL2, CL3 and CL6) are related with relatively high AOD values while the long trajectories (i.e., CL4 and CL5) are related with lower AOD observation, with respect to the overall statistically mean value.
The presented air mass cluster analysis over the study area can be further linked with a potential aerosol source type (i.e., dust, natural and anthropogenic, etc.). This approach has been already applied for other regions (e.g., [53,54]) and proved to be a great tool for estimating the contribution of each distinct cluster and consequently of each source type, to the mean AOD500 value. Considering both the percentage appearance of each cluster and the respective mean AOD500 (Table 2), from the direction and the characteristics of the air mass trajectories, we found that the greatest contribution comes from regional and local dust sources. This is shown in Figure 11, where dust particles from Saudi Arabia, accounts for 33% of the average AOD during the whole period of study. It is worth to mention here that including only the trajectories with PBL residence time in our analysis increases the accuracy of the presented source-receptor apportionment. Another important contribution (23%) is dust from western part of Arabian Peninsula transported over short distances, while regional dust sources located in Iran and Iraq contributes 21%. Since it is not to possible to discriminate the natural form anthropogenic contribution linked with CL3 and CL4, these clusters can be merged into one category representing the mixture of dust with anthropogenic (“Polluted dust”). Therefore, air masses of long-range transport from the Mediterranean coast of the African continent along with Turkey and Middle East, contribute another 22%. Finally, only the 1% of the statistically mean AOD500 can be attributed to remote, clean areas.

4. Conclusions

The statistical values of the Aerosol Optical Depth (AOD) over Kuwait, were analyzed and presented in this work, as revealed from ten years of observations (2008–2017). This is the first long term, ground-based dataset presented for the area. The main conclusions of the study can be summarized as follows:
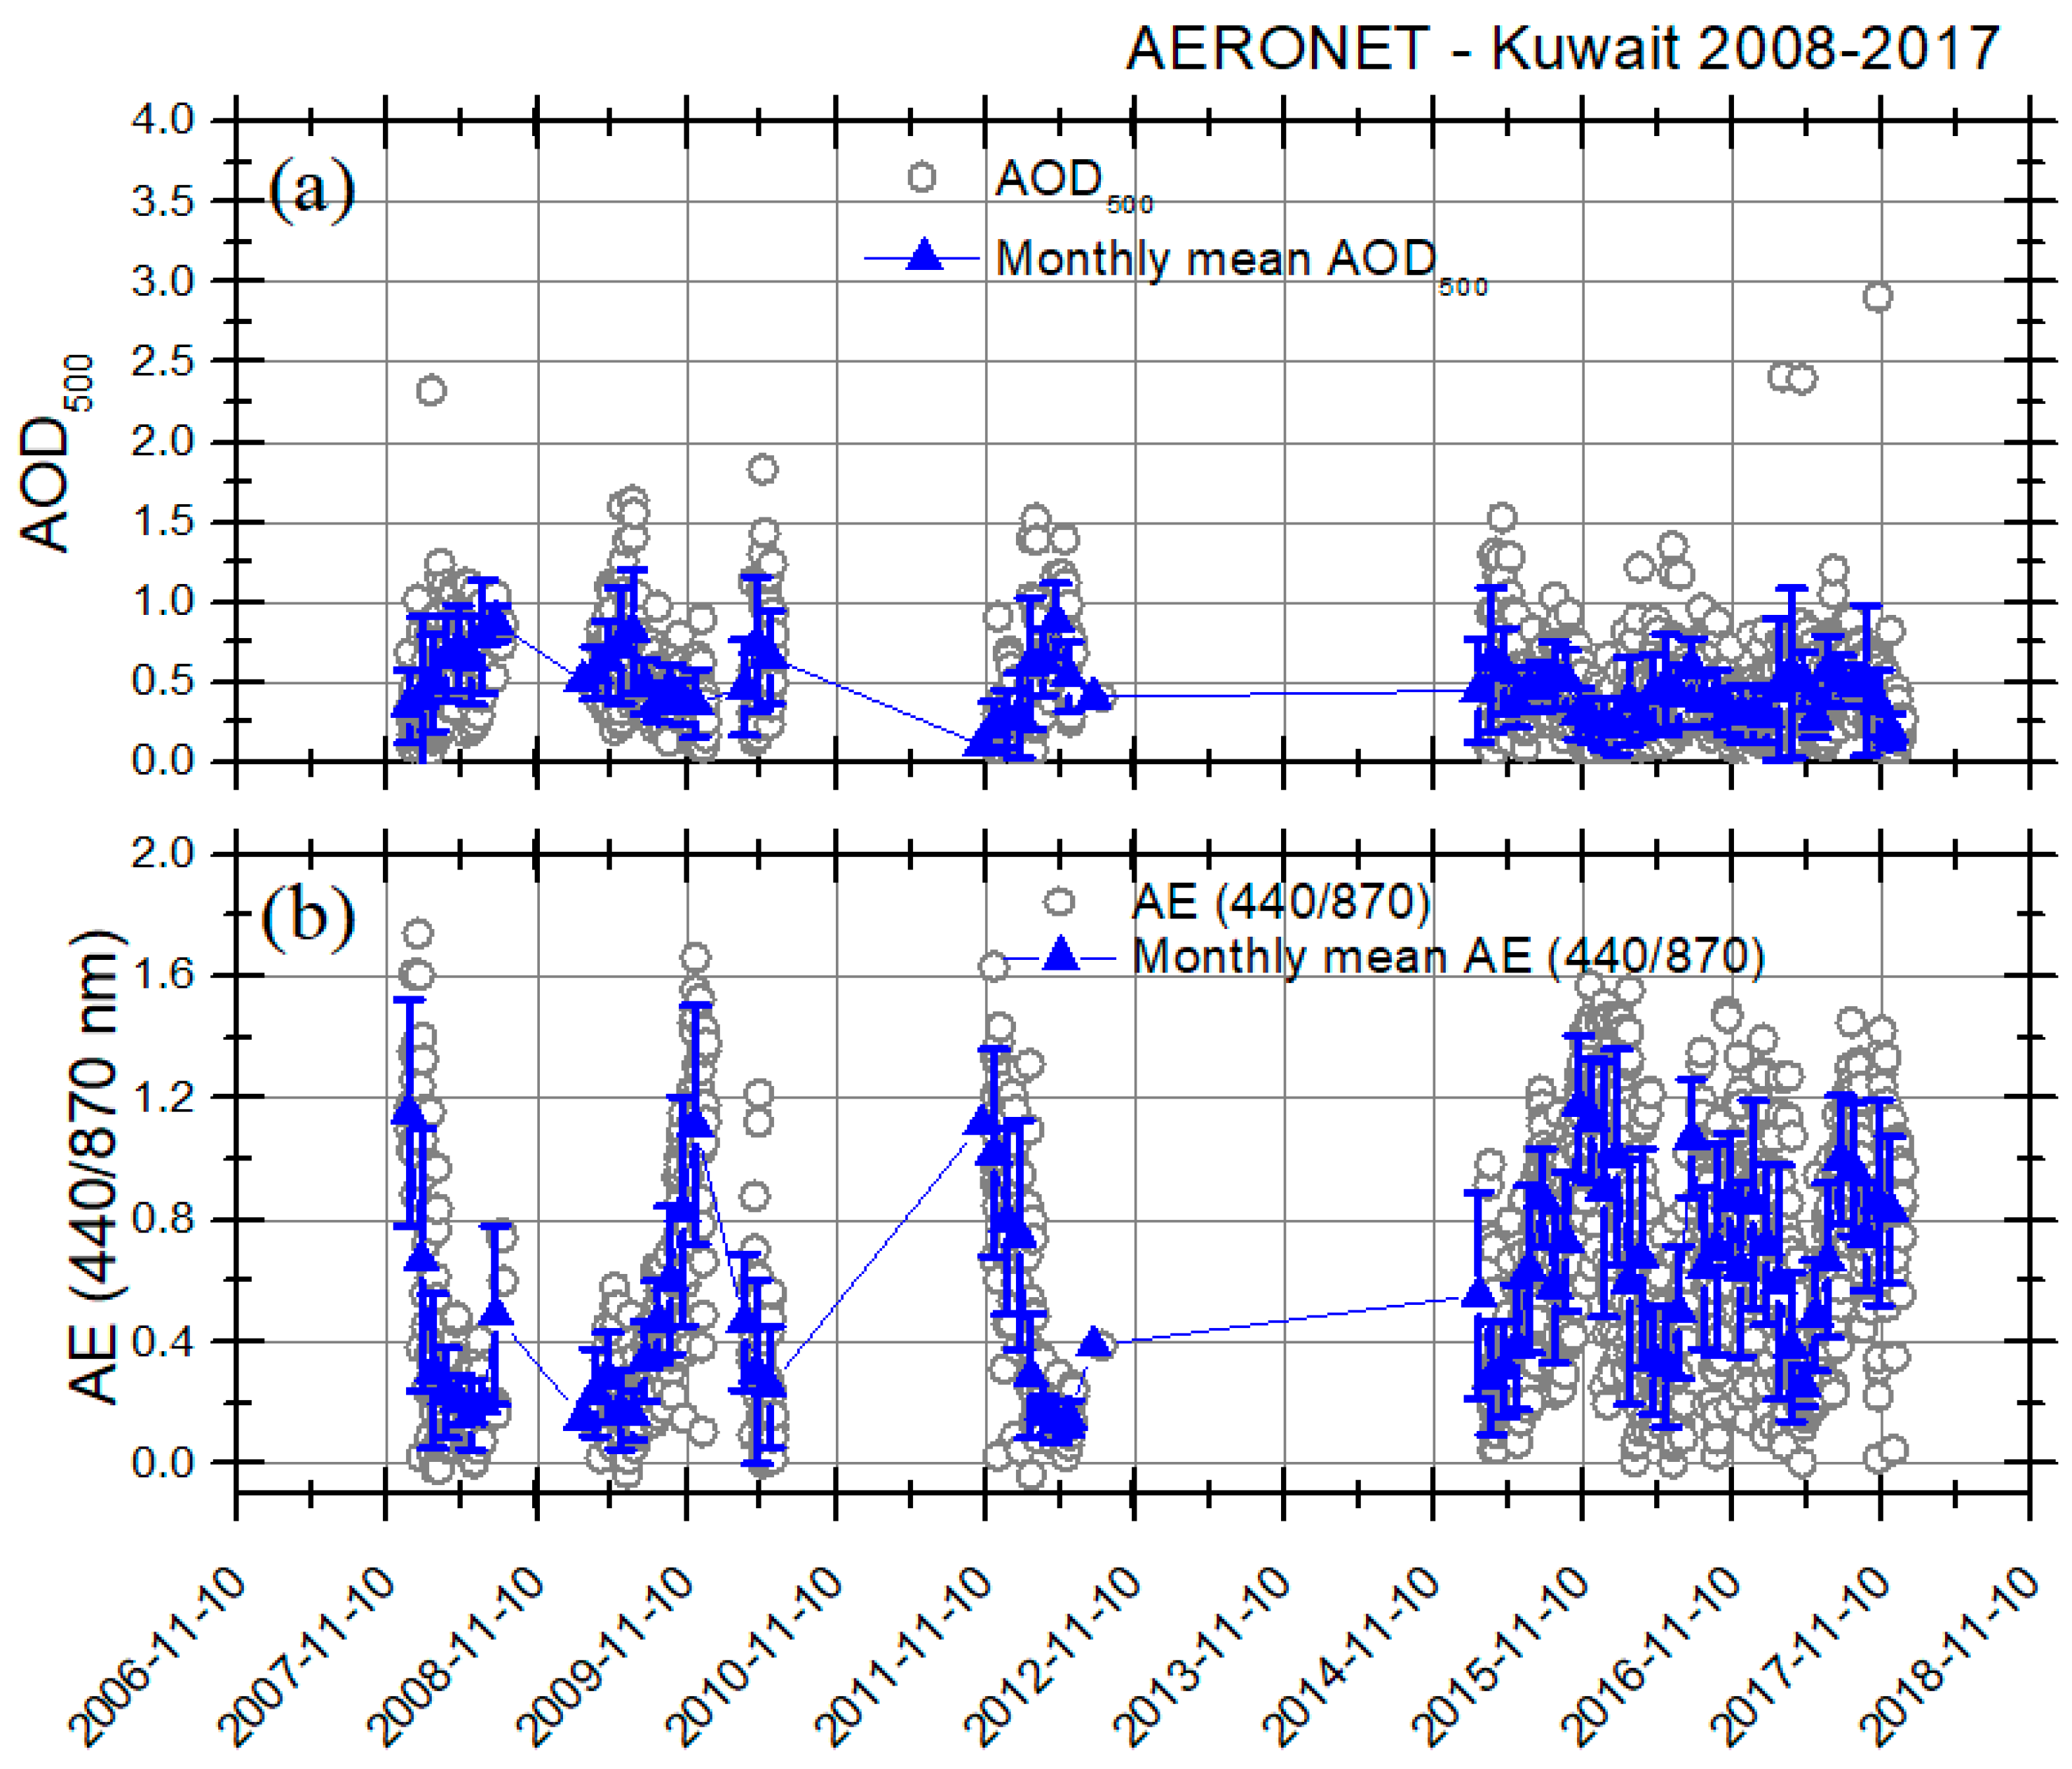
  • Mean daily AOD500 over Kuwait is 0.45 ± 0.29 and the corresponding value of Ångström coefficient (AE 44/870), is 0.61 ± 0.39. These values are indicative of the strong sources of particulate matter in the area, which contribute to the degradation of air quality at the regional scale.
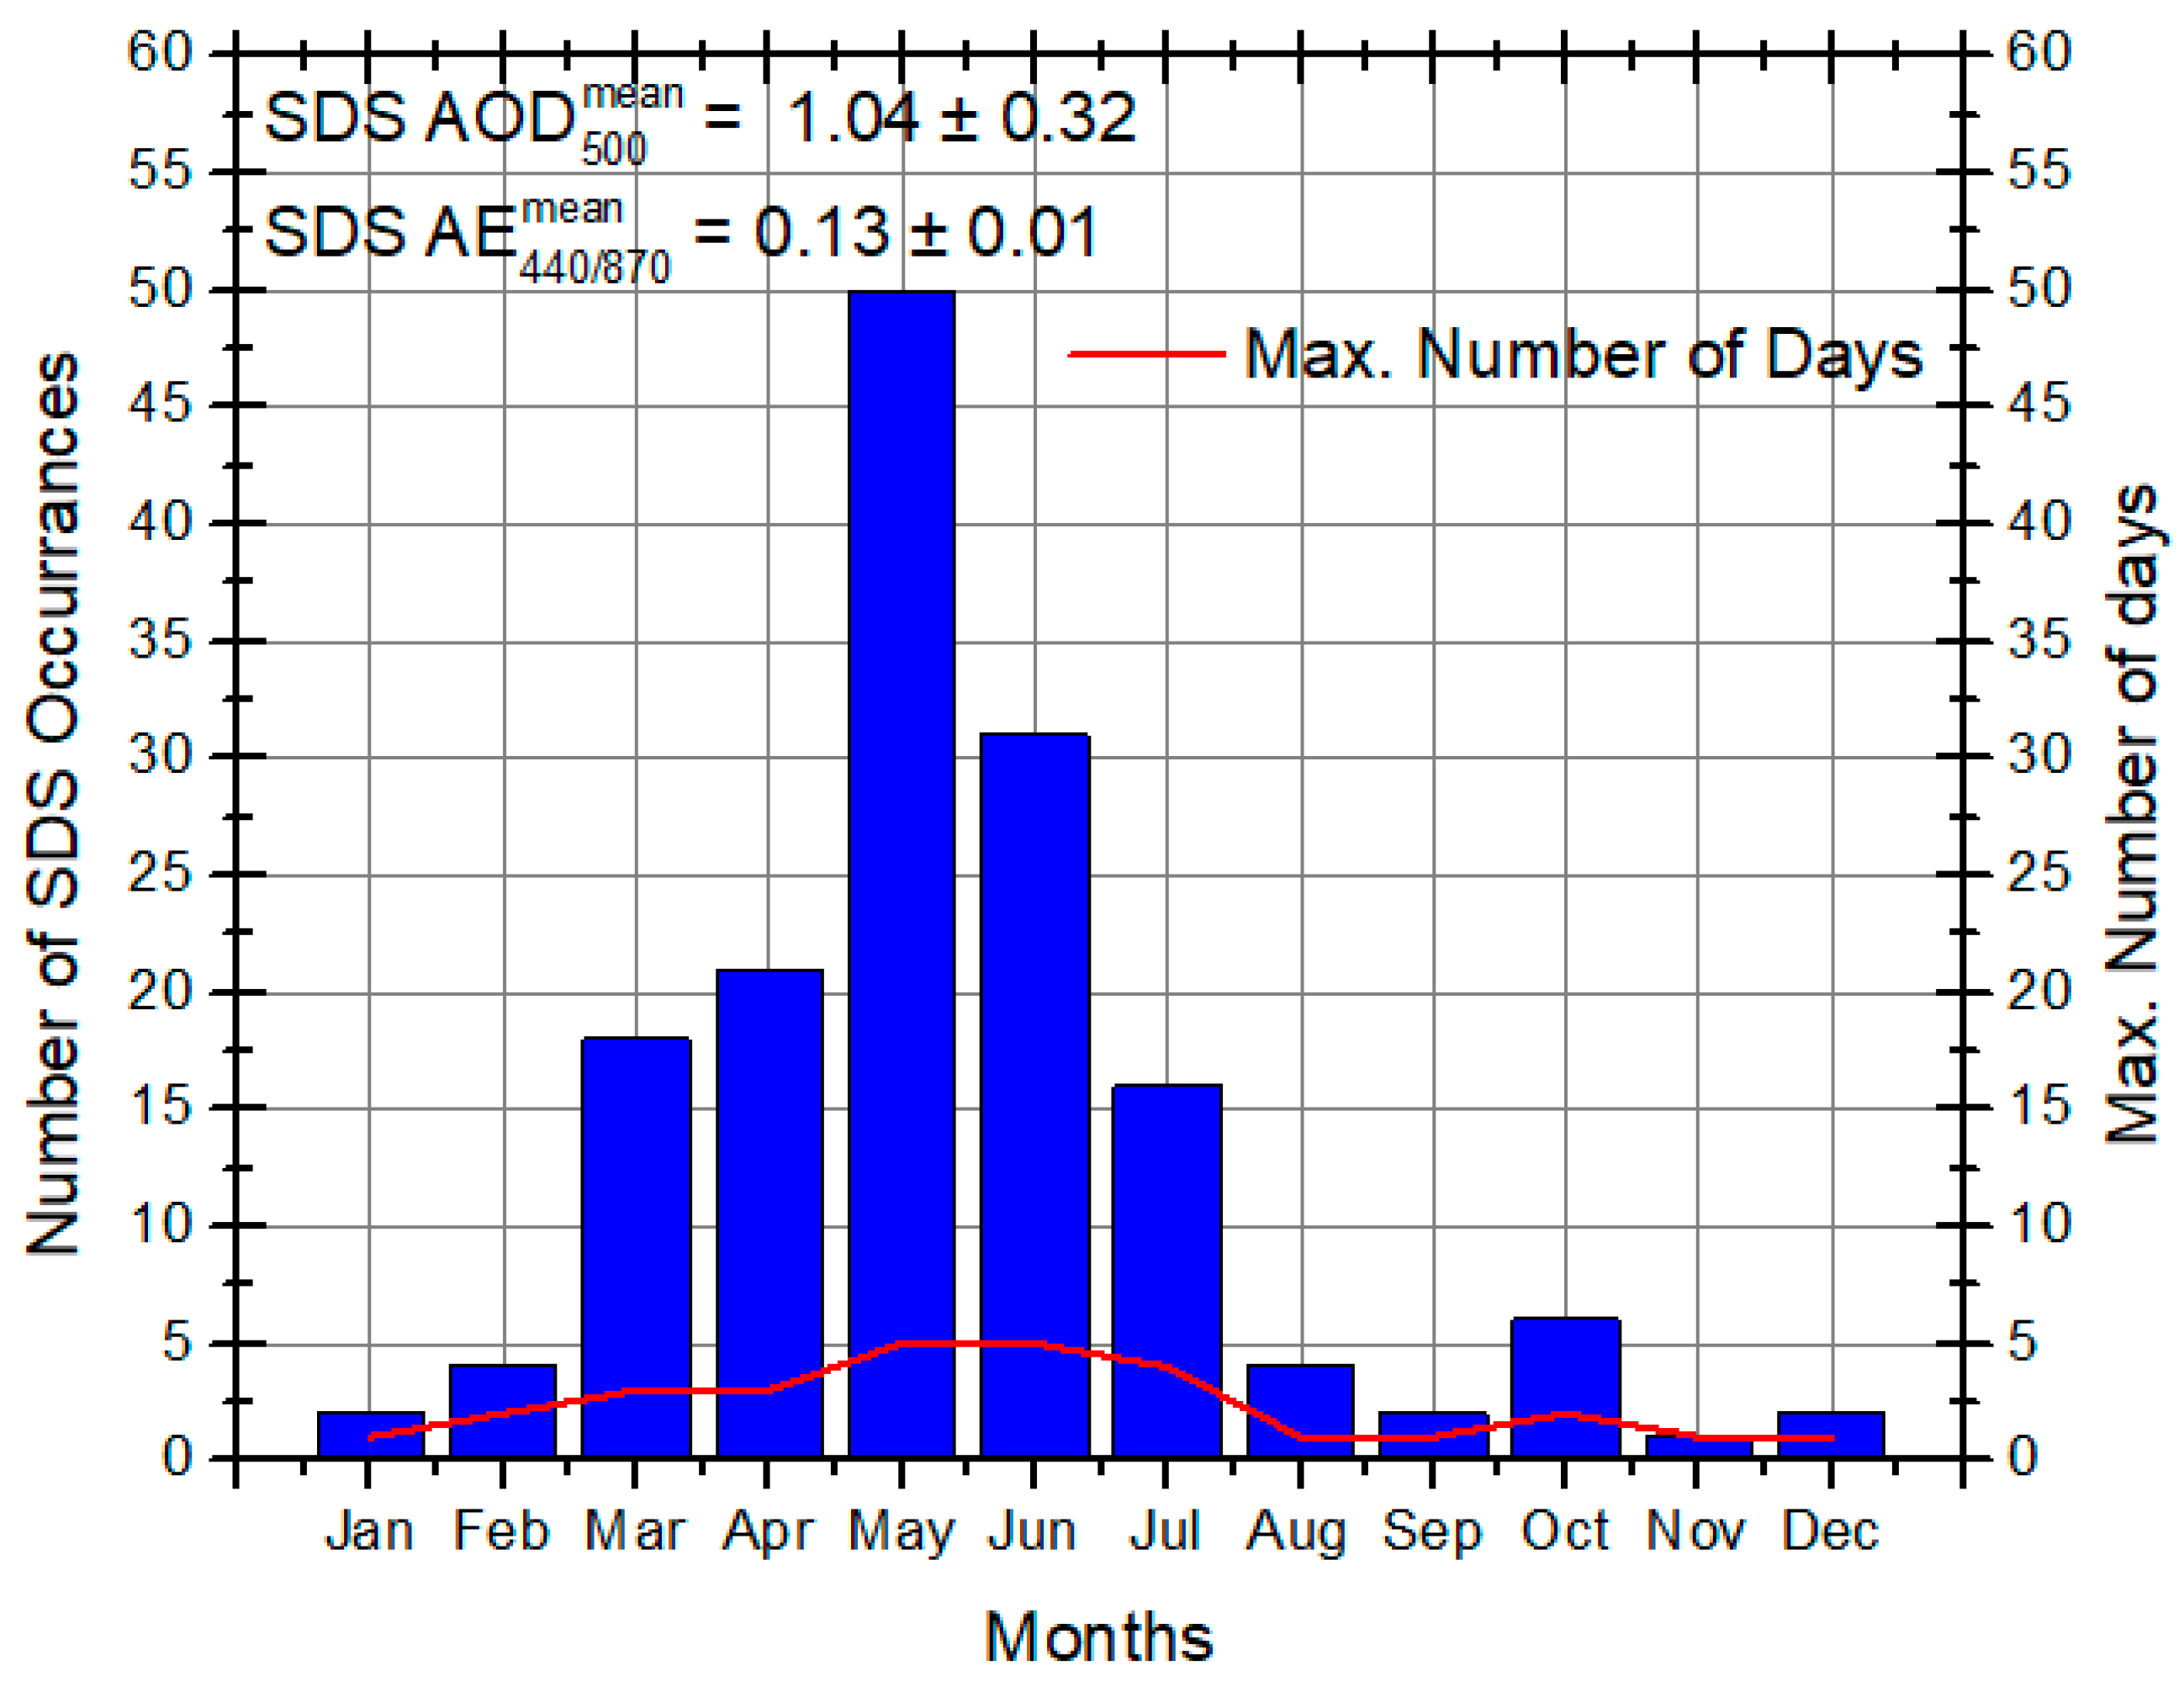
  • Recorded high AOD500 values (0.74–2.91), are due to regional sand and dust storm events, which are affecting Kuwait with a mean annual frequency of almost 20 days/year.
  • The position of Kuwait in the Middle East defines the annual cycle of AOD500 and AE. The patterns observed in Kuwait exhibits a pronounced spring mode, with maximum values observed during May. High aerosol loads are affecting the state also during the summer months (0.50–0.55), while minimum values are observed during fall (0.33–0.47) and winter months (0.26–0.29).
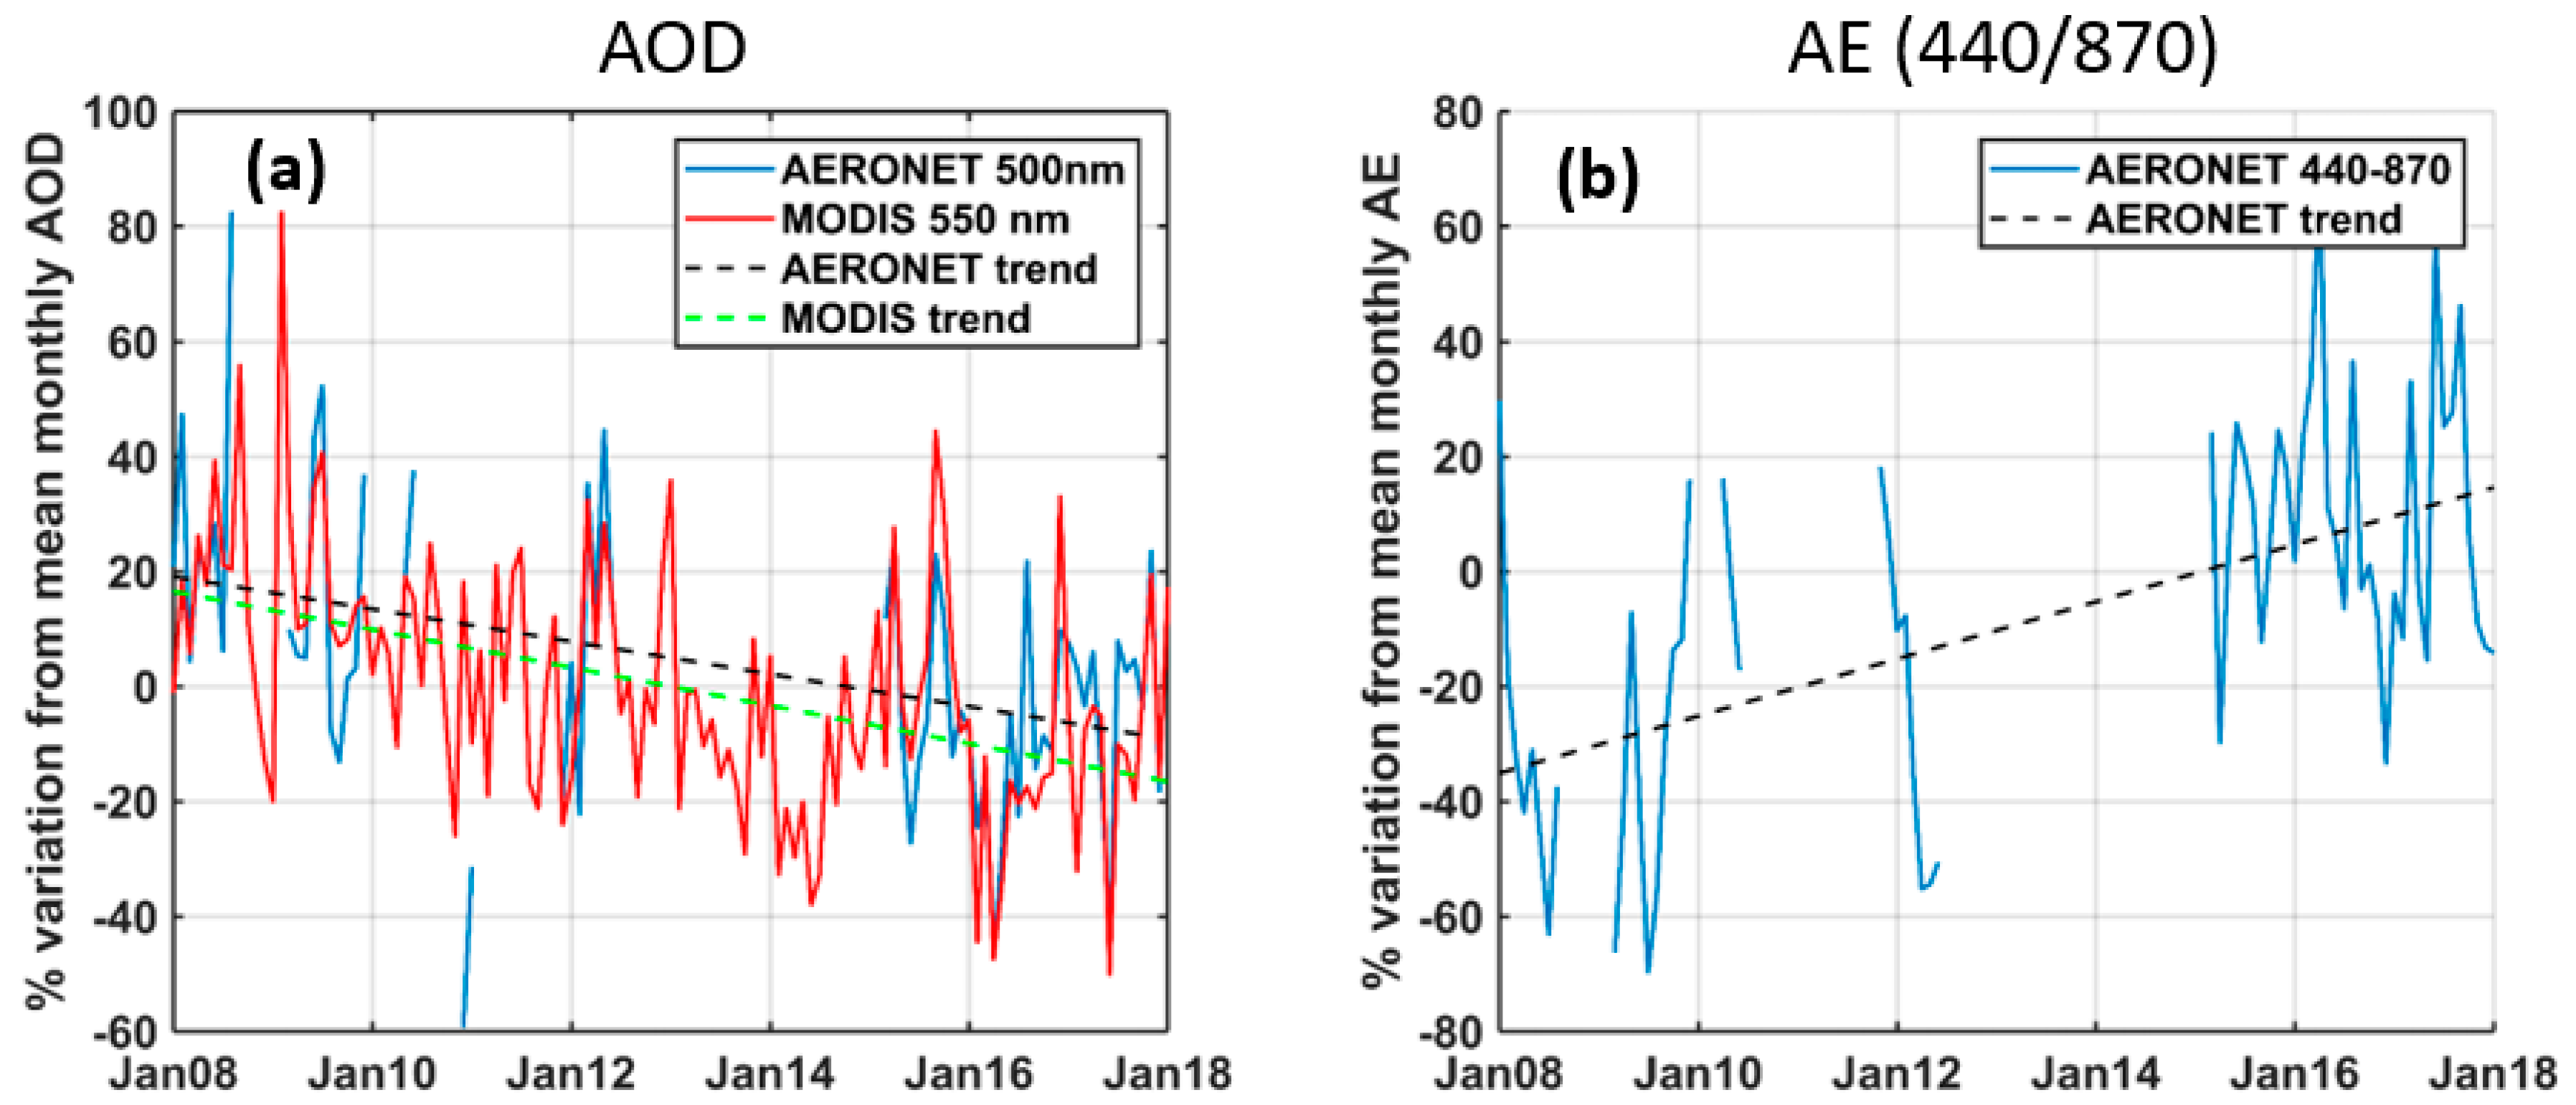
  • Ground-based retrieved AOD is compared against MODIS retrievals obtained over the area for the same time period. On an annual basis, MODIS found to have a mean overestimation of AOD up to 15%.
  • The long-term analysis of AOD500 illustrated a negative trend percentage, of 3.3 ± 0.7% per year. The corresponding trend analysis of AE observations shows a positive change of 4.8 ± 0.1%.
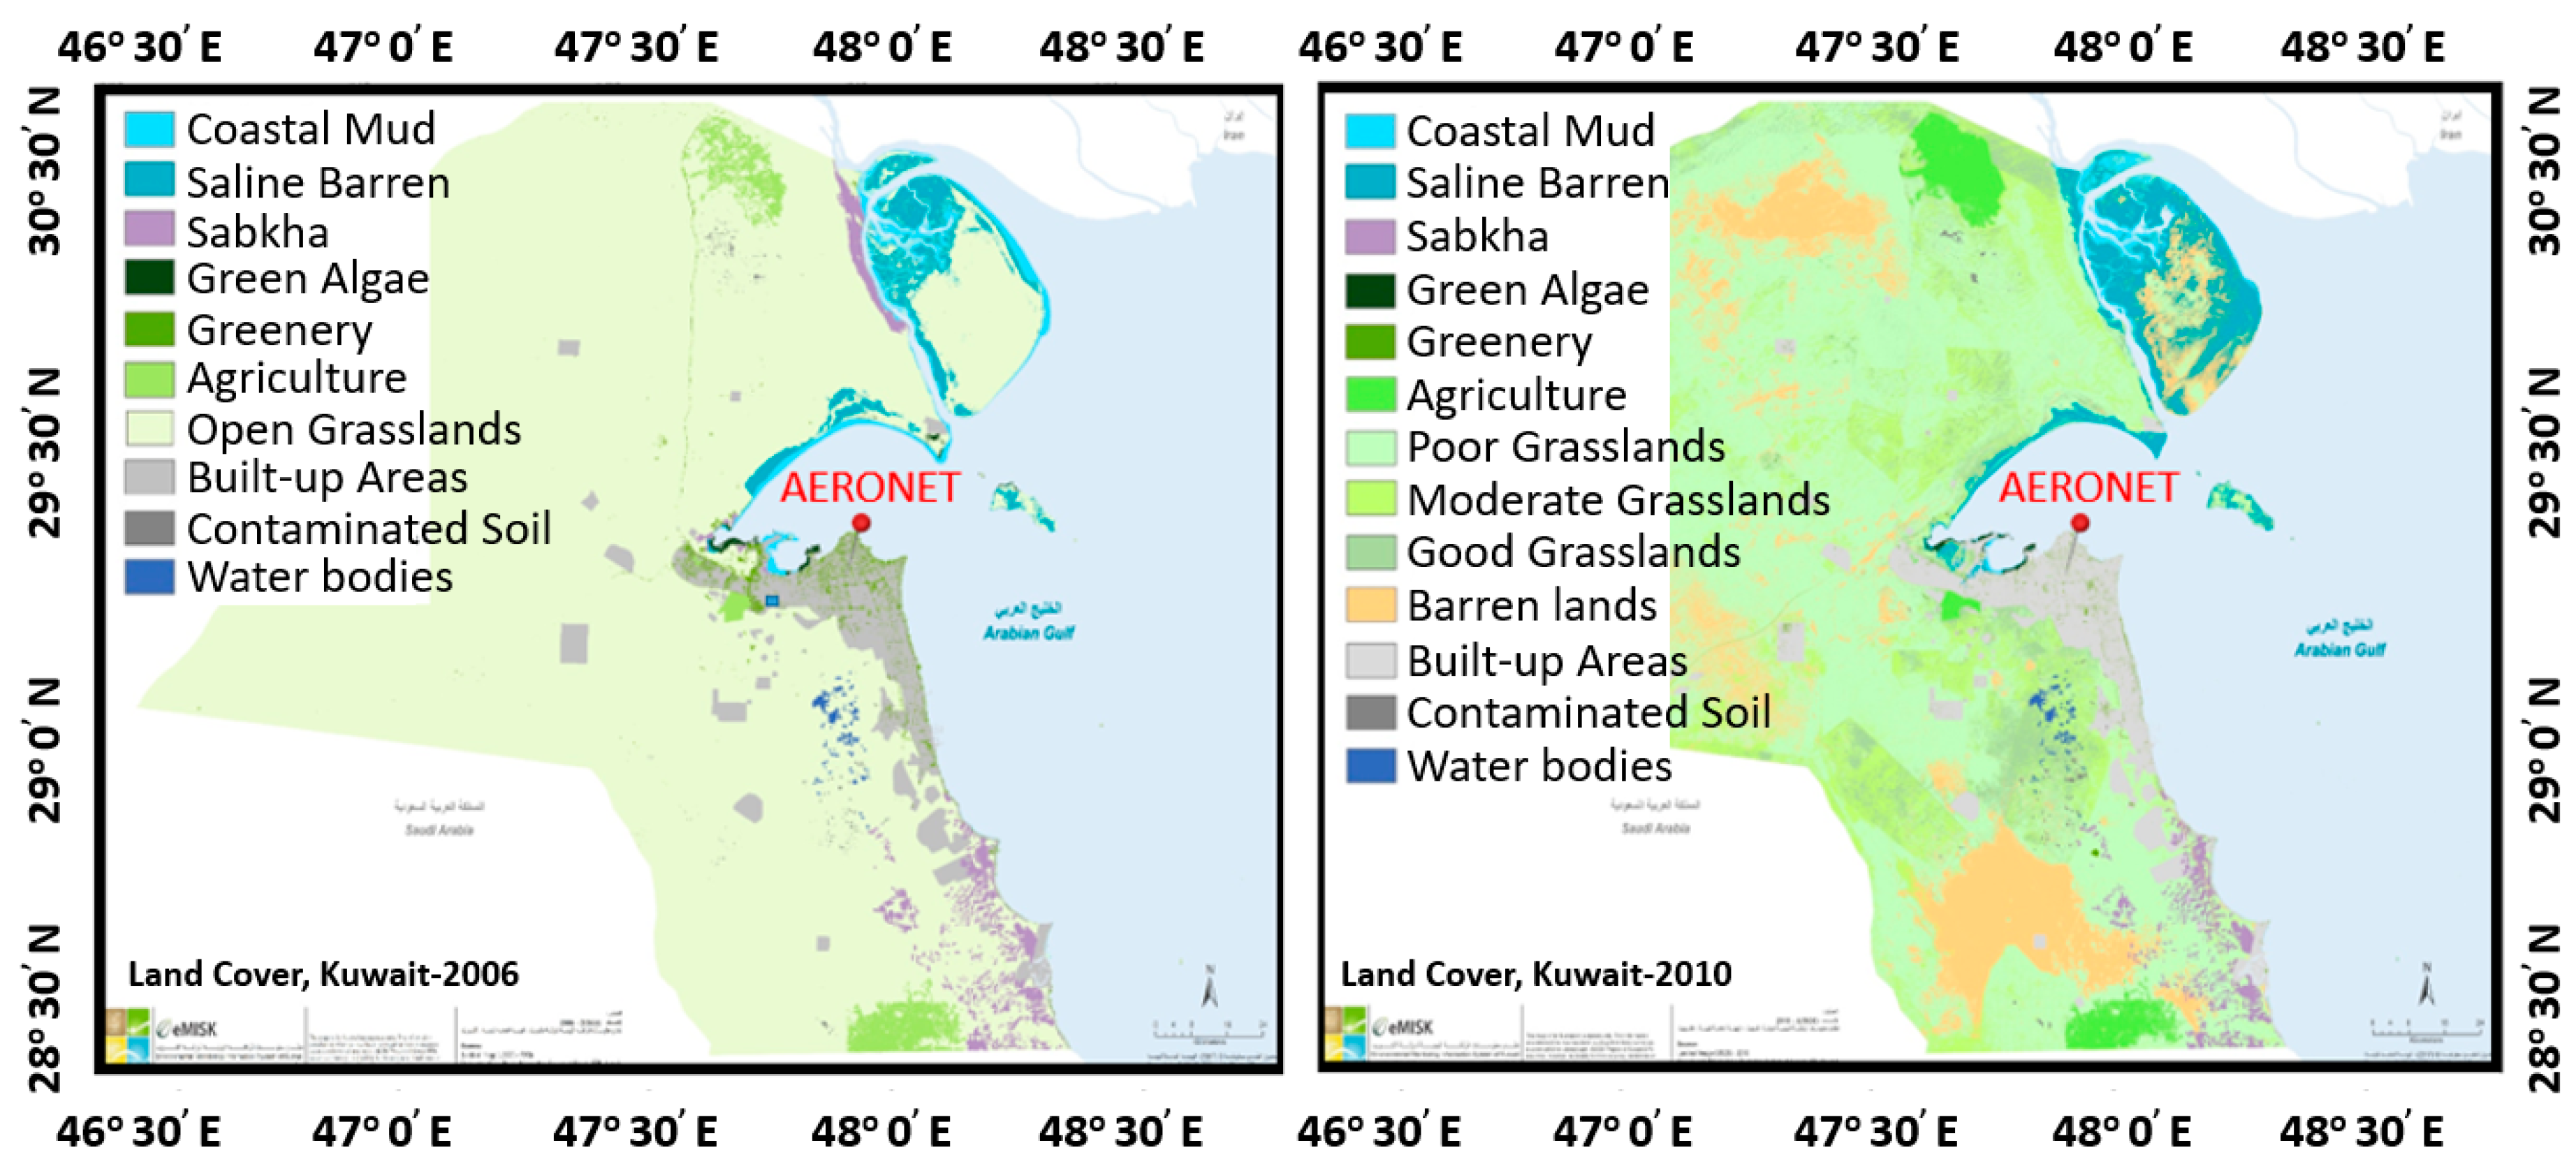
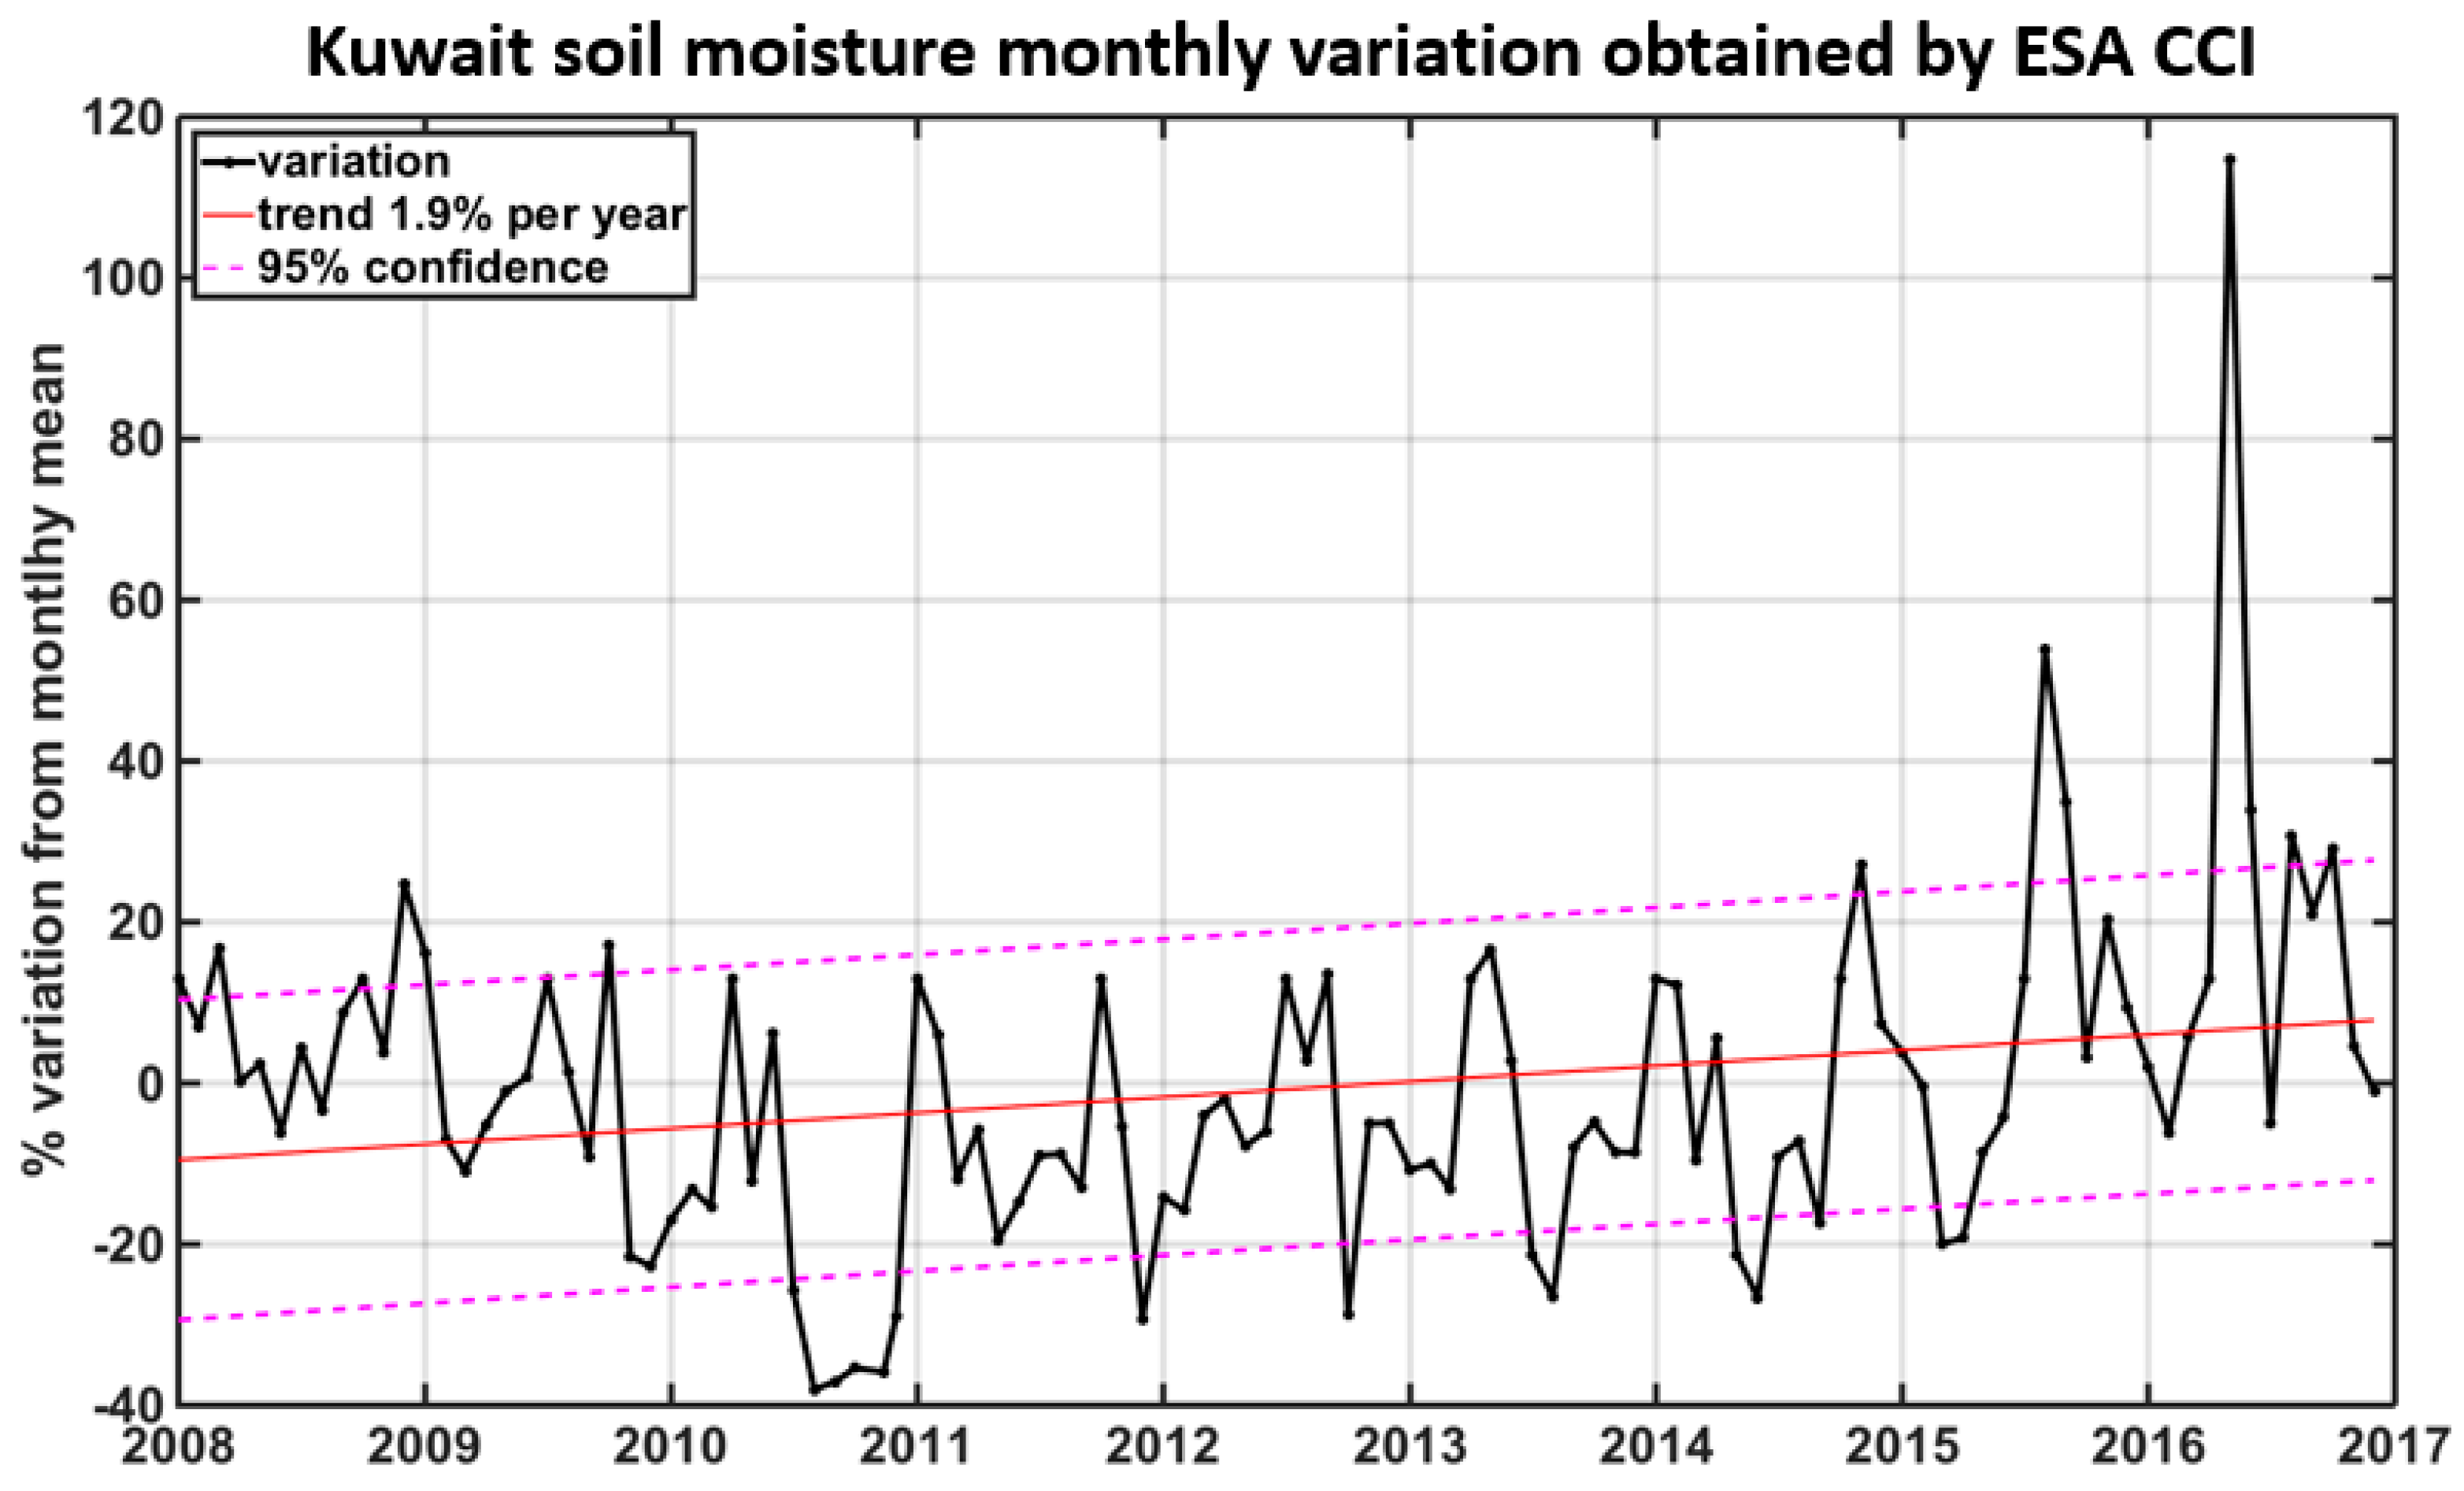
  • The aforementioned trends and annual cycles of AOD500 and AE, are strongly related to the soil moisture conditions over the desert area of Kuwait and land cover change and increased anthropogenic activity of the city during the last decade.
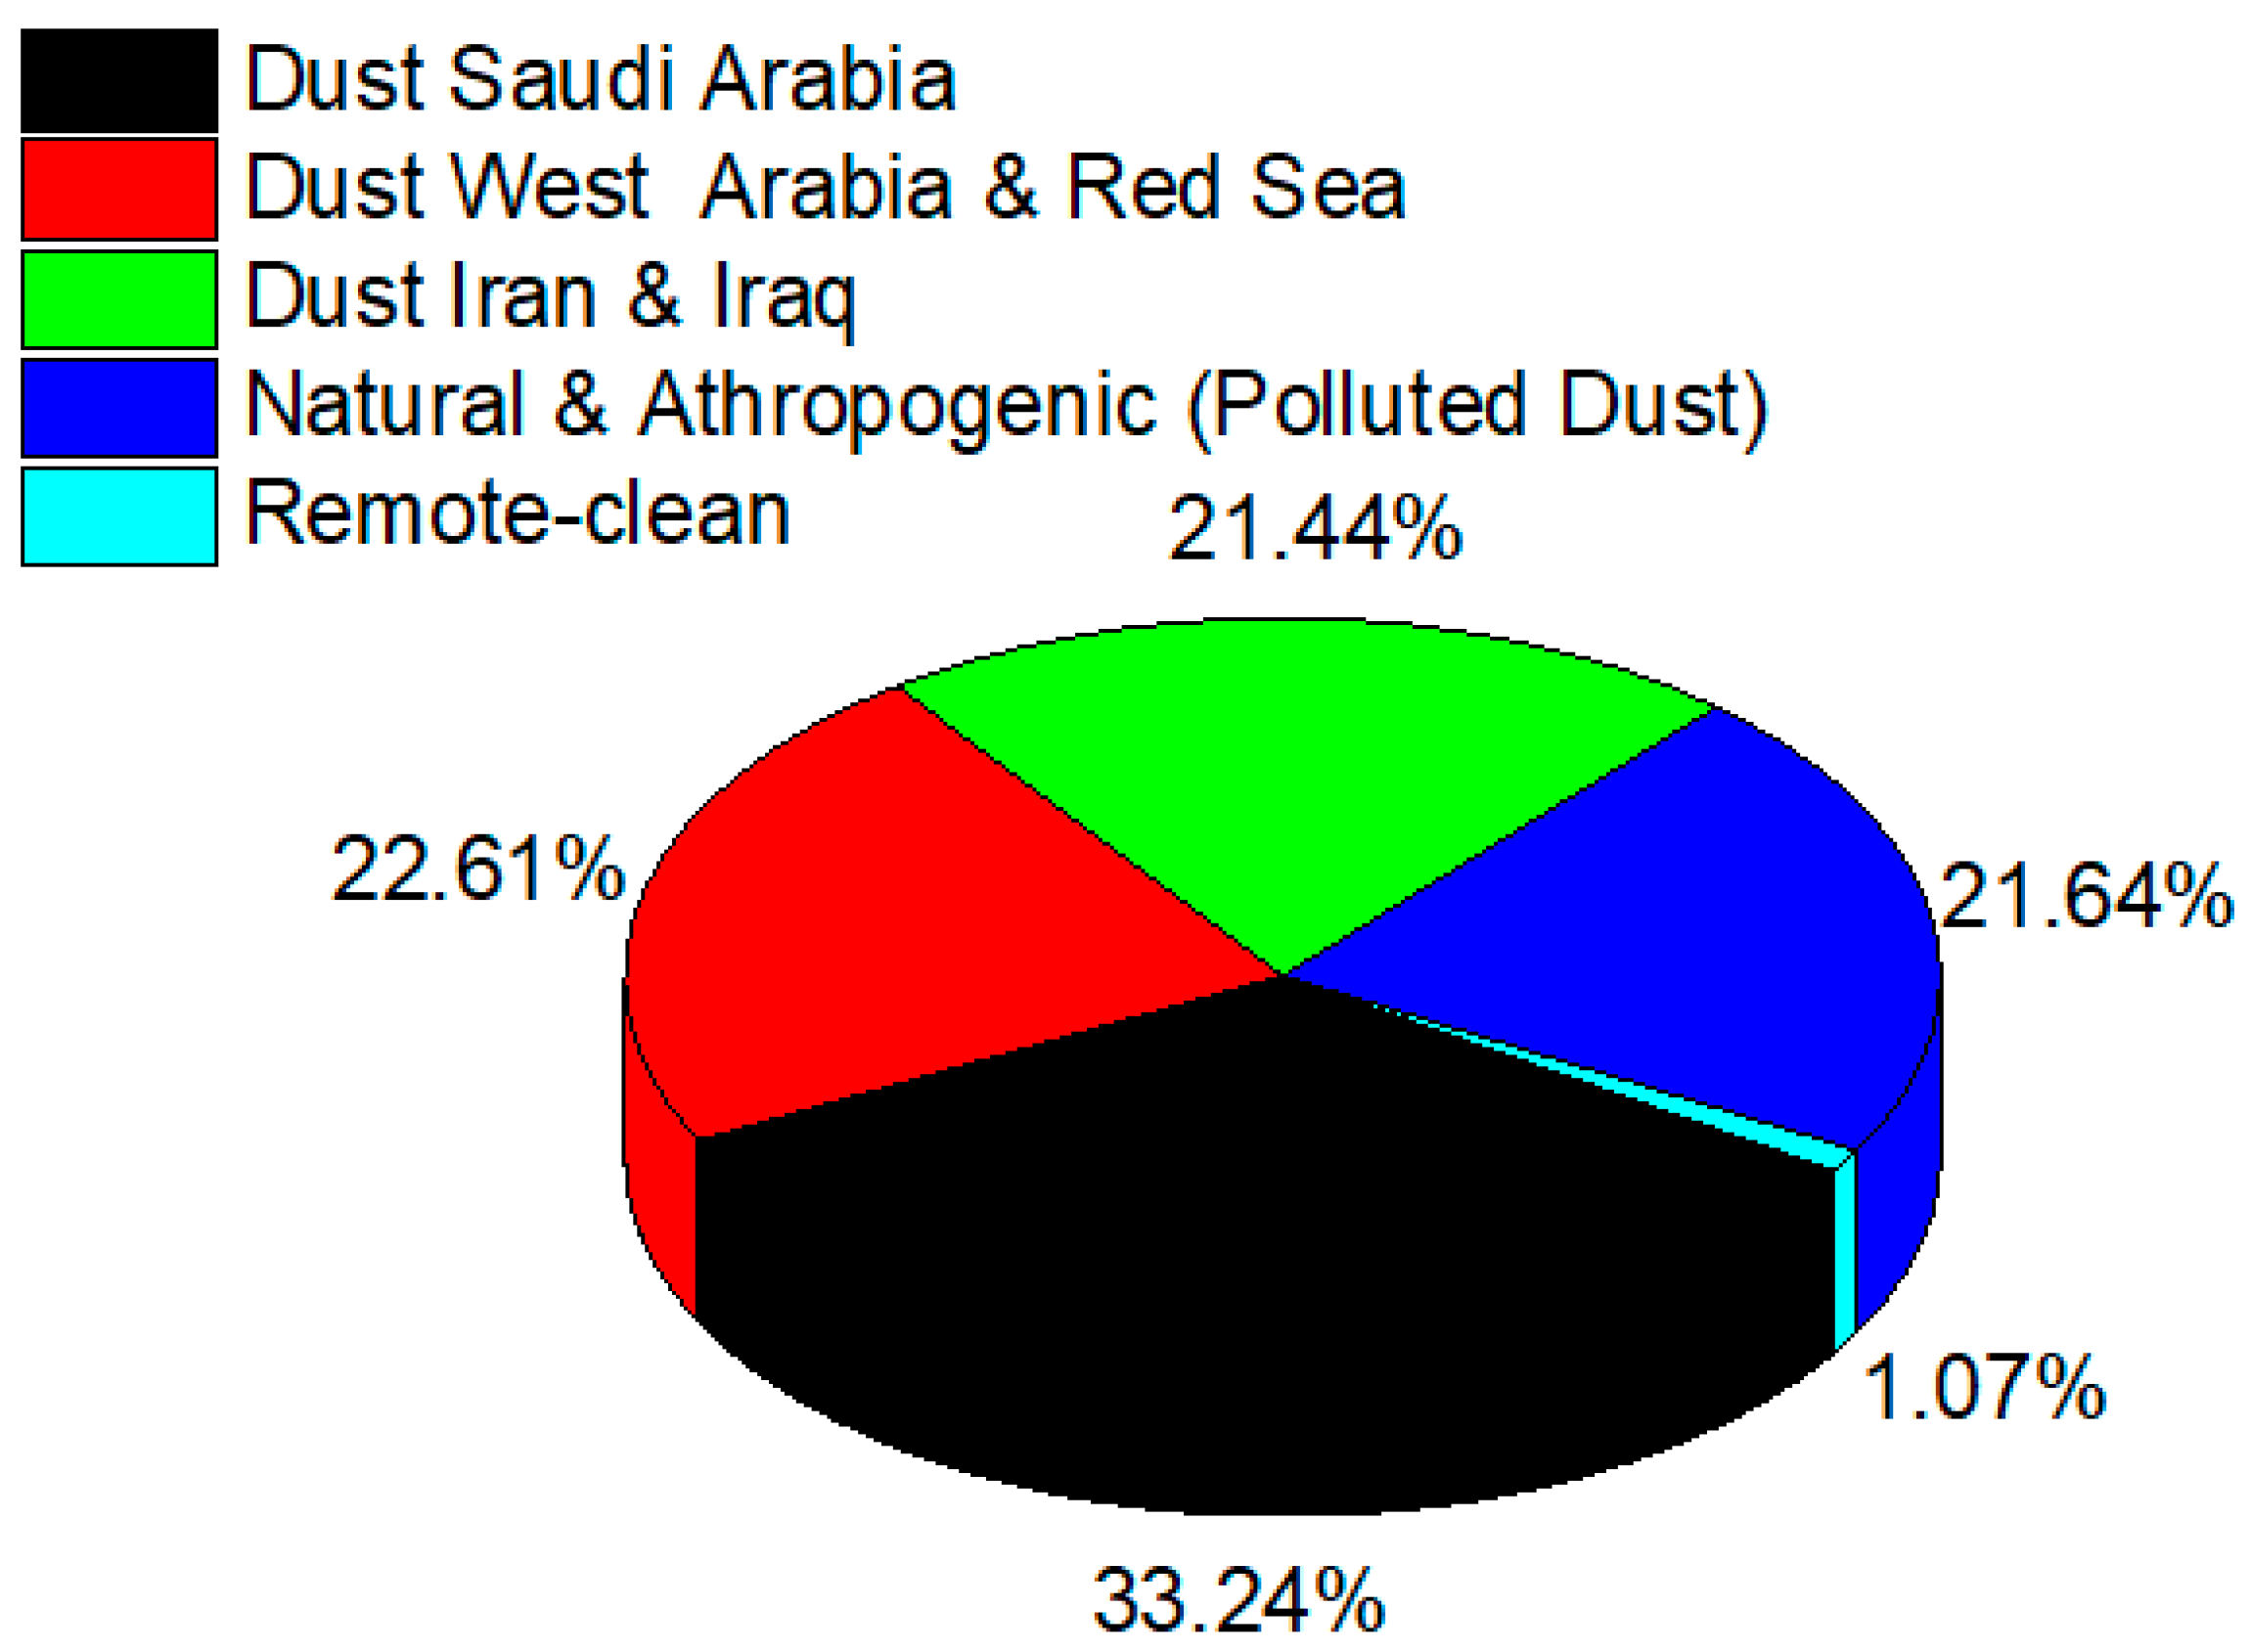
  • The following general points are concluded from the trajectory cluster analysis: (i) The greatest contribution (almost 80%) to the annually averaged AOD, comes from regional and local dust sources (56% from Saudi Arabia and 21% from Iran-Iraq). (ii) Natural and anthropogenic particles are transported from the northeastern Mediterranean and African coast mixed with dust from local regions, accounting for 22% of the mean annual aerosol load.
This analysis intended to provide data on the climatological aspects of columnar aerosol loadings over an arid environment in the northern part of Middle East, based on ground measurements. Such data sets are essential for the validation of satellite products obtained from passive sensors, which can then be used for long term climatic studies. However, for the detailed identification and aerosol characterization, range resolved multi-wavelength and multi-depolarization lidar measurements are needed in the area. With such information, it will then be feasible to estimate the aerosol optical and microphysical properties of each discrete atmospheric layer, assessing and discriminating the natural from the anthropogenic contribution on the total atmospheric load.

Author Contributions

P.K. developed the research methodology and prepared the text of the manuscript; H.K.A.J. provided the volume soil moisture dataset; S.S. and H.A.S. provided the HYSPLIT cluster analysis of the air mass back trajectories and helped on the interpretation of the results; P.-I.R. analyzed the satellite dataset; H.A.H. prepared and carried out the statistical analysis of the sun-photometric dataset; M.A.D. analyzed and provided the land cover maps; V.A. and A.P. performed the final review & editing of the manuscript.

Funding

This research was partly funded by the Research Project Epivravevsi: “Study of the aerosol particles by synergy of active laser remote sensing (lidar) and passive remote sensing techniques” (Grant No. 95000300) NTUA Research Committee.

Conflicts of Interest

The authors declare no conflict of interest.

References

  1. IPCC Climate Change. The Physical Science Basis. In Contribution of Working Group I to the Fifth Assessment Report of the Intergovernmental Panel on Climate Change; Cambridge University Press: Cambridge, UK; New York, NY, USA, 2013; ISBN 978-1-107-66182-0. [Google Scholar]
  2. Tegen, I.; Lacis, A.A. Modeling of particle size distribution and its influence on the radiative properties of mineral dust aerosol. J. Geophys. Res. Atmos. 1996, 101, 19237–19244. [Google Scholar] [CrossRef] [Green Version]
  3. Berthier, S.; Chazette, P.; Couvert, P.; Pelon, J.; Dulac, F.; Thieuleux, F.; Moulin, C.; Pain, T. Desert dust aerosol columnar properties over ocean and continental Africa from Lidar in-Space Technology Experiment (LITE) and Meteosat synergy. J. Geophys. Res. 2006, 111. [Google Scholar] [CrossRef] [Green Version]
  4. Kazadzis, S.; Raptis, P.; Kouremeti, N.; Amiridis, V.; Arola, A.; Gerasopoulos, E.; Schuster, G.L. Aerosol absorption retrieval at ultraviolet wavelengths in a complex environment. Atmos. Meas. Tech. 2016, 9, 5997–6011. [Google Scholar] [CrossRef] [Green Version]
  5. Kosmopoulos, P.G.; Kazadzis, S.; Taylor, M.; Athanasopoulou, E.; Speyer, O.; Raptis, P.I.; Marinou, E.; Proestakis, E.; Solomos, S.; Gerasopoulos, E.; et al. Dust impact on surface solar irradiance assessed with model simulations, satellite observations and ground-based measurements. Atmos. Meas. Tech. 2017, 10, 2435–2453. [Google Scholar] [CrossRef] [Green Version]
  6. Pappalardo, G.; Amodeo, A.; Apituley, A.; Comeron, A.; Freudenthaler, V.; Linné, H.; Ansmann, A.; Bösenberg, J.; D’Amico, G.; Mattis, I.; et al. EARLINET: Towards an advanced sustainable European aerosol lidar network. Atmos. Meas. Tech. 2014, 7, 2389–2409. [Google Scholar] [CrossRef] [Green Version]
  7. Welton, E.J.; Campbell, J.R. Micropulse lidar signals: Uncertainty analysis. J. Atmos. Ocean. Technol. 2002, 19, 2089–2094. [Google Scholar] [CrossRef]
  8. Holben, B.N.; Eck, T.F.; Slutsker, I.; Tanre, D.; Buis, J.P.; Setzer, A.; Vermote, E.; Reagan, J.A.; Kaufman, Y.J.; Nakajima, T. AERONET—A federated instrument network and data archive for aerosol characterization. Remote Sens. Environ. 1998, 66, 1–16. [Google Scholar] [CrossRef]
  9. Sioris, C.E.; Abboud, I.; Fioletov, V.E.; McLinden, C.A. AEROCAN, the Canadian sub-network of AERONET: Aerosol monitoring and air quality applications. Atmos. Environ. 2017, 167, 444–457. [Google Scholar] [CrossRef]
  10. Takamura, T.; Nakajima, T. Overview of SKYNET and its Activities. Opt. Pura. Apl. 2004, 37, 3303–3308. [Google Scholar]
  11. Nakajima, T.; Yoon, S.-C.; Ramanathan, V.; Shi, G.-Y.; Takemura, T.; Higurashi, A.; Takamura, T.; Aoki, K.; Sohn, B.-J.; Kim, S.-W.; et al. Overview of the Atmospheric Brown Cloud East Asian Regional Experiment 2005 and a study of the aerosol direct radiative forcing in east Asia. J. Geophys. Res. Atmos. 2007, 112. [Google Scholar] [CrossRef] [Green Version]
  12. Nyeki, S.; Wehrli, C.; Gröbner, J.; Kouremeti, N.; Wacker, S.; Labuschagne, C.; Mbatha, N.; Brunke, E.-G. The GAW-PFR aerosol optical depth network: The 2008–2013 time series at Cape Point Station, South Africa: AOD (2008–2013) AT CAPE POINT, S. AFRICA. J. Geophys. Res. Atmos. 2015, 120, 5070–5084. [Google Scholar] [CrossRef]
  13. Amiridis, V.; Marinou, E.; Tsekeri, A.; Wandinger, U.; Schwarz, A.; Giannakaki, E.; Mamouri, R.; Kokkalis, P.; Binietoglou, I.; Solomos, S.; et al. LIVAS: A 3-D multi-wavelength aerosol/cloud database based on CALIPSO and EARLINET. Atmos. Chem. Phys. 2015, 15, 7127–7153. [Google Scholar] [CrossRef]
  14. Marinou, E.; Amiridis, V.; Binietoglou, I.; Tsikerdekis, A.; Solomos, S.; Proestakis, E.; Konsta, D.; Papagiannopoulos, N.; Tsekeri, A.; Vlastou, G.; et al. Three-dimensional evolution of Saharan dust transport towards Europe based on a 9-year EARLINET-optimized CALIPSO dataset. Atmos. Chem. Phys. 2017, 17, 5893–5919. [Google Scholar] [CrossRef] [Green Version]
  15. Proestakis, E.; Amiridis, V.; Marinou, E.; Georgoulias, A.K.; Solomos, S.; Kazadzis, S.; Chimot, J.; Che, H.; Alexandri, G.; Binietoglou, I.; et al. Nine-year spatial and temporal evolution of desert dust aerosols over South and East Asia as revealed by CALIOP. Atmos. Chem. Phys. 2018, 18, 1337–1362. [Google Scholar] [CrossRef] [Green Version]
  16. Papayannis, A.; Amiridis, V.; Mona, L.; Tsaknakis, G.; Balis, D.; Bösenberg, J.; Chaikovski, A.; De Tomasi, F.; Grigorov, I.; Mattis, I.; et al. Systematic lidar observations of Saharan dust over Europe in the frame of EARLINET (2000–2002). J. Geophys. Res. Atmos. 2008, 113, D10204. [Google Scholar] [CrossRef]
  17. Mona, L.; Pappalardo, G.; Amodeo, A.; D’Amico, G.; Madonna, F.; Boselli, A.; Giunta, A.; Russo, F.; Cuomo, V. One year of CNR-IMAA multi-wavelength Raman lidar measurements in coincidence with CALIPSO overpasses: Level 1 products comparison. Atmos. Chem. Phys. 2009, 9, 7213–7228. [Google Scholar] [CrossRef] [Green Version]
  18. Mamouri, R.E.; Amiridis, V.; Papayannis, A.; Giannakaki, E.; Tsaknakis, G.; Balis, D.S. Validation of CALIPSO space-borne-derived attenuated backscatter coefficient profiles using a ground-based lidar in Athens, Greece. Atmos. Meas. Tech. 2009, 2, 513–522. [Google Scholar] [CrossRef] [Green Version]
  19. Amiridis, V.; Wandinger, U.; Marinou, E.; Giannakaki, E.; Tsekeri, A.; Basart, S.; Kazadzis, S.; Gkikas, A.; Taylor, M.; Baldasano, J.; et al. Optimizing CALIPSO Saharan dust retrievals. Atmos. Chem. Phys. 2013, 13, 12089–12106. [Google Scholar] [CrossRef] [Green Version]
  20. Papagiannopoulos, N.; Mona, L.; Alados-Arboledas, L.; Amiridis, V.; Baars, H.; Binietoglou, I.; Bortoli, D.; D’Amico, G.; Giunta, A.; Guerrero-Rascado, J.L.; et al. CALIPSO climatological products: Evaluation and suggestions from EARLINET. Atmos. Chem. Phys. 2016, 16, 2341–2357. [Google Scholar] [CrossRef]
  21. Kim, S.-W.; Chazette, P.; Dulac, F.; Sanak, J.; Johnson, B.; Yoon, S.-C. Vertical structure of aerosols and water vapor over West Africa during the African monsoon dry season. Atmos. Chem. Phys. 2009, 9, 8017–8038. [Google Scholar] [CrossRef] [Green Version]
  22. Marticorena, B.; Chatenet, B.; Rajot, J.L.; Traoré, S.; Coulibaly, M.; Diallo, A.; Koné, I.; Maman, A.; NDiaye, T.; Zakou, A. Temporal variability of mineral dust concentrations over West Africa: Analyses of a pluriannual monitoring from the AMMA Sahelian Dust Transect. Atmos. Chem. Phys. 2010, 10, 8899–8915. [Google Scholar] [CrossRef]
  23. Ansmann, A.; Petzold, A.; Kandler, K.; Tegen, I.; Wendisch, M.; Müller, D.; Weinzierl, B.; Müller, T.; Heintzenberg, J. Saharan Mineral Dust Experiments SAMUM-1 and SAMUM-2: What have we learned? Tellus B 2011, 63, 403–429. [Google Scholar] [CrossRef] [Green Version]
  24. Veselovskii, I.; Goloub, P.; Podvin, T.; Bovchaliuk, V.; Derimian, Y.; Augustin, P.; Fourmentin, M.; Tanre, D.; Korenskiy, M.; Whiteman, D.N.; et al. Retrieval of optical and physical properties of African dust from multiwavelength Raman lidar measurements during the SHADOW campaign in Senegal. Atmos. Chem. Phys. 2016, 16, 7013–7028. [Google Scholar] [CrossRef] [Green Version]
  25. Tang, K.; Huang, Z.; Huang, J.; Maki, T.; Zhang, S.; Shimizu, A.; Ma, X.; Shi, J.; Bi, J.; Zhou, T.; et al. Characterization of atmospheric bioaerosols along the transport pathway of Asian dust during the Dust-Bioaerosol 2016 Campaign. Atmos. Chem. Phys. 2018, 18, 7131–7148. [Google Scholar] [CrossRef]
  26. Zhou, T.; Xie, H.; Bi, J.; Huang, Z.; Huang, J.; Shi, J.; Zhang, B.; Zhang, W. Lidar Measurements of Dust Aerosols during Three Field Campaigns in 2010, 2011 and 2012 over Northwestern China. Atmosphere 2018, 9, 173. [Google Scholar] [CrossRef]
  27. Mamouri, R.E.; Ansmann, A.; Nisantzi, A.; Kokkalis, P.; Schwarz, A.; Hadjimitsis, D. Low Arabian dust extinction-to-backscatter ratio: Arabian dust lidar ratio. Geophys. Res. Lett. 2013, 40, 4762–4766. [Google Scholar] [CrossRef]
  28. Nisantzi, A.; Mamouri, R.E.; Ansmann, A.; Schuster, G.L.; Hadjimitsis, D.G. Middle East versus Saharan dust extinction-to-backscatter ratios. Atmos. Chem. Phys. 2015, 15, 7071–7084. [Google Scholar] [CrossRef] [Green Version]
  29. Sabbah, I.; Al-Mudhaf, H.F.; Al-Kandari, A.; Al-Sharifi, F. Remote sensing of desert dust over Kuwait: Long-term variation. Atmos. Pollut. Res. 2012, 3, 95–104. [Google Scholar] [CrossRef]
  30. Al-Dousari, A.M.; Al-Awadhi, J.; Ahmed, M. Dust fallout characteristics within global dust storm major trajectories. Arab. J. Geosci. 2013, 6, 3877–3884. [Google Scholar] [CrossRef]
  31. Al Jassar, H.K.; Rao, K.S. Assessment of soil moisture through field measurements and AMSR-E remote sensing data analysis over Kuwait desert. Kuwait J. Sci. 2015, 42, 250–260. [Google Scholar]
  32. Sabbah, I.; Léon, J.-F.; Sorribas, M.; Guinot, B.; Córdoba-Jabonero, C.; de Souza, A.; Al Sharifi, F. Dust and dust storms over Kuwait: Ground-based and satellite observations. J. Atmos. Sol.-Terr. Phys. 2018, 179, 105–113. [Google Scholar] [CrossRef]
  33. Dubovik, O.; King, M.D. A flexible inversion algorithm for retrieval of aerosol optical properties from Sun and sky radiance measurements. J. Geophys. Res. Atmos. 2000, 105, 20673–20696. [Google Scholar] [CrossRef] [Green Version]
  34. Dubovik, O.; Sinyuk, A.; Lapyonok, T.; Holben, B.N.; Mishchenko, M.; Yang, P.; Eck, T.F.; Volten, H.; Muñoz, O.; Veihelmann, B.; et al. Application of spheroid models to account for aerosol particle nonsphericity in remote sensing of desert dust. J. Geophys. Res. Atmos. 2006, 111, D11208. [Google Scholar] [CrossRef]
  35. Giles, D.; Holben, B.N.; Smirnov, A.; Eck, T.F.; Slutsker, I.; Sorokin, M.; Schafer, J.; Sinyuk, A. Evaluation of AERONET AOD Measurements in the Version 3 Database. Lidar Data Its Use Model Verification Data Assim. 2016. Available online: https://aeronet.gsfc.nasa.gov/new_web/Documents/AERONET_V3_AOD.pdf (accessed on 15 October 2018).
  36. Fragkos, K.; Antonescu, B.; Ene, D.; Efstathiou, G.A.; Belegante, L. Assessment of the total precipitable water from a sun-photometer, microwave radiometer and radiosondes at a continental site in southeastern Europe. Atmos. Meas. Tech. Discuss. 2018, 1–30. [Google Scholar] [CrossRef]
  37. Stein, A.F.; Draxler, R.R.; Rolph, G.D.; Stunder, B.J.B.; Cohen, M.D.; Ngan, F. NOAA’s HYSPLIT Atmospheric Transport and Dispersion Modeling System. Bull. Am. Meteorol. Soc. 2015, 96, 2059–2077. [Google Scholar] [CrossRef]
  38. Ichoku, C. A spatio-temporal approach for global validation and analysis of MODIS aerosol products. Geophys. Res. Lett. 2002, 29. [Google Scholar] [CrossRef] [Green Version]
  39. Liu, Y.Y.; Dorigo, W.A.; Parinussa, R.M.; de Jeu, R.A.M.; Wagner, W.; McCabe, M.F.; Evans, J.P.; van Dijk, A.I.J.M. Trend-preserving blending of passive and active microwave soil moisture retrievals. Remote Sens. Environ. 2012, 123, 280–297. [Google Scholar] [CrossRef]
  40. Dorigo, W.; Wagner, W.; Albergel, C.; Albrecht, F.; Balsamo, G.; Brocca, L.; Chung, D.; Ertl, M.; Forkel, M.; Gruber, A.; et al. ESA CCI Soil Moisture for improved Earth system understanding: State-of-the art and future directions. Remote Sens. Environ. 2017, 203, 185–215. [Google Scholar] [CrossRef]
  41. Gruber, A.; Dorigo, W.A.; Crow, W.; Wagner, W. Triple Collocation-Based Merging of Satellite Soil Moisture Retrievals. IEEE Trans. Geosci. Remote Sens. 2017, 55, 6780–6792. [Google Scholar] [CrossRef]
  42. Saeed, T.M.; Al-Dashti, H.; Spyrou, C. Aerosol’s optical and physical characteristics and direct radiative forcing during a shamal dust storm, a case study. Atmos. Chem. Phys. 2014, 14, 3751–3769. [Google Scholar] [CrossRef]
  43. Solomos, S.; Ansmann, A.; Mamouri, R.-E.; Binietoglou, I.; Patlakas, P.; Marinou, E.; Amiridis, V. Remote sensing and modelling analysis of the extreme dust storm hitting the Middle East and eastern Mediterranean in September 2015. Atmos. Chem. Phys. 2017, 17, 4063–4079. [Google Scholar] [CrossRef]
  44. Al-Dousari, A.; Doronzo, D.; Ahmed, M. Types, Indications and Impact Evaluation of Sand and Dust Storms Trajectories in the Arabian Gulf. Sustainability 2017, 9, 1526. [Google Scholar] [CrossRef]
  45. Moosmüller, H.; Engelbrecht, J.P.; Skiba, M.; Frey, G.; Chakrabarty, R.K.; Arnott, W.P. Single scattering albedo of fine mineral dust aerosols controlled by iron concentration: MINERAL DUST SINGLE SCATTERING ALBEDO. J. Geophys. Res. Atmos. 2012, 117. [Google Scholar] [CrossRef]
  46. Eck, T.F.; Holben, B.N.; Reid, J.S.; Dubovik, O.; Smirnov, A.; O’Neill, N.T.; Slutsker, I.; Kinne, S. Wavelength dependence of the optical depth of biomass burning, urban and desert dust aerosols. J. Geophys. Res. Atmos. 1999, 104, 31333–31349. [Google Scholar] [CrossRef]
  47. Chomette, O.; Legrand, M. Determination of the wind speed threshold for the emission of desert dust using satellite remote sensing in the thermal infrared. J. Geophys. Res. Atmos. 1999, 104, 31207–31215. [Google Scholar] [CrossRef] [Green Version]
  48. Ishizuka, M. An observational study of soil moisture effects on wind erosion at a gobi site in the Taklimakan Desert. J. Geophys. Res. 2005, 110. [Google Scholar] [CrossRef] [Green Version]
  49. Cowie, S.M.; Knippertz, P.; Marsham, J.H. Are vegetation-related roughness changes the cause of the recent decrease in dust emission from the Sahel? Geophys. Res. Lett. 2013, 40, 1868–1872. [Google Scholar] [CrossRef] [PubMed] [Green Version]
  50. Kim, H.; Choi, M. Impact of soil moisture on dust outbreaks in East Asia: Using satellite and assimilation data. Geophys. Res. Lett. 2015, 42, 2789–2796. [Google Scholar] [CrossRef] [Green Version]
  51. Klingmüller, K.; Pozzer, A.; Metzger, S.; Stenchikov, G.L.; Lelieveld, J. Aerosol optical depth trend over the Middle East. Atmos. Chem. Phys. 2016, 16, 5063–5073. [Google Scholar] [CrossRef]
  52. Ju, J.; Slingo, J. The Asian summer monsoon and ENSO. Q. J. R. Meteorol. Soc. 1995, 121, 1133–1168. [Google Scholar] [CrossRef]
  53. Gerasopoulos, E.; Amiridis, V.; Kazadzis, S.; Kokkalis, P.; Eleftheratos, K.; Andreae, M.O.; Andreae, T.W.; El-Askary, H.; Zerefos, C.S. Three-year ground based measurements of aerosol optical depth over the Eastern Mediterranean: The urban environment of Athens. Atmos. Chem. Phys. 2011, 11, 2145–2159. [Google Scholar] [CrossRef]
  54. Boselli, A.; Caggiano, R.; Cornacchia, C.; Madonna, F.; Mona, L.; Macchiato, M.; Pappalardo, G.; Trippetta, S. Multi year sun-photometer measurements for aerosol characterization in a Central Mediterranean site. Atmos. Res. 2012, 104–105, 98–110. [Google Scholar] [CrossRef]
Figure 1. Time series of mean daily (grey circles) (a) AOD values at 500 nm (AOD500) and (b) Ångström exponent (AE), measured over Kuwait for the time period 2008–2017. Blue triangles correspond to their monthly averages and the error bars represent their standard deviation.
Remotesensing 10 01807 g001
Figure 2. Frequency distributions of mean daily: (a) AOD500 and (b) AE exponent, measured over Kuwait for the time period 2008–2017. Red cross mark and the red vertical line refers to the statistical mean and to the median value of the distribution, respectively. Blue box corresponds to the 1st and 3rd quartiles and black whiskers are bounds for the 9% and 91%.
Remotesensing 10 01807 g002
Figure 3. Number of SDS events (blue bars), along with their lasting time period (in days) (red line), as observed by AERONET over Kuwait, during the time period 2008–2017.
Remotesensing 10 01807 g003
Figure 4. Monthly variability of AOD500 and AE coefficient (blue and black solid lines, respectively), obtained by AERONET for the time period 2008–2017. Monthly variability of AOD550, obtained by MODIS (green solid line) for the same time period, over Kuwait area. The error bars represent the corresponding standard deviation of the monthly mean values.
Remotesensing 10 01807 g004
Figure 5. Monthly variability of (a) SSA, (b) Volume size distribution, (c) real part and (d) imaginary part of refractive index, obtained by AERONET inversion algorithm for the time period 2008–2017.
Remotesensing 10 01807 g005
Figure 6. De-seasonalized trends, derived from monthly averaged (a) AOD500 and (b) AE coefficient, for the time period 2008–2017. The corresponding AOD values and trend derived by MODIS are also shown in (a).
Remotesensing 10 01807 g006
Figure 7. Land cover usage in Kuwait for the years of 2006 and 2010.
Remotesensing 10 01807 g007
Figure 8. De-seasonalized trend of soil moisture condition, obtained by ESA CCI dataset (http://www.esa-soilmoisture-cci.org), for the time period 2006 2016.
Remotesensing 10 01807 g008
Figure 9. The main six air mass transport paths (centroids) are represented with the colored lines, indicating the central path of air masses with similar characteristics and directions, as determined from the HYSPLIT cluster analysis.
Remotesensing 10 01807 g009
Figure 10. (a) Monthly mean values of AOD500 and (b) frequency of occurrence, per trajectory cluster.
Remotesensing 10 01807 g010
Figure 11. Contribution of the discrete source areas to the statistically mean value of AOD500.
Remotesensing 10 01807 g011
Table 1. Basic statistics on the daily AOD values (at various wavelengths) and Ångström coefficient (AE) over Kuwait, for the period 2008–2017.
Optical PropertyAverage ± Std.Min.–Max.1st Quartile–Median–3rd Quartile
AOD3400.57 ± 0.310.05–2.920.21–0.52–0.75
AOD3800.54 ± 0.300.06–2.940.20–0.50–0.71
AOD4400.49 ± 0.290.05–2.920.17–0.45–0.64
AOD5000.45 ± 0.290.04–2.910.15–0.40–0.58
AOD6750.39 ± 0.280.03–2.900.12–0.33–0.48
AOD8700.36 ± 0.280.03–2.880.10–0.29–0.45
AOD10200.34 ± 0.270.02–2.850.09–0.27–0.42
AOD16400.27 ± 0.240.01–2.440.06–0.20–0.35
AE440/8700.61 ± 0.39−0.03–1.740.14–0.57–0.91
Table 2. Mean AOD500 and AE values per trajectory cluster, along with their standard deviations.
ClusterProvenance Fraction %Source InfluenceMain DirectionMean AOD500 (Standard Error)Mean AE
(Standard Error)
CL128Arabian Desert DustS0.55 (0.02)0.63 (0.03)
CL219Arabian Desert and Red Sea SW0.55 (0.03)0.52 (0.03)
CL39Mediterranean and Middle EastWNW0.47 (0.03)0.38 (0.03)
CL418Turkey Anthropogenic and Iraq-Syria dustNW0.32 (0.02)0.52 (0.03)
CL52Atlantic and Europe (anthropogenic-negligible)NNW0.25 (0.02)0.72 (0.03)
CL625Desert Dust from Iran and Iraq N0.40 (0.02)0.68 (0.03)

