3.1. Spectral Matching between PMS and OLI
The reflectance of snow cover in the SWIR band is low [
5,
17,
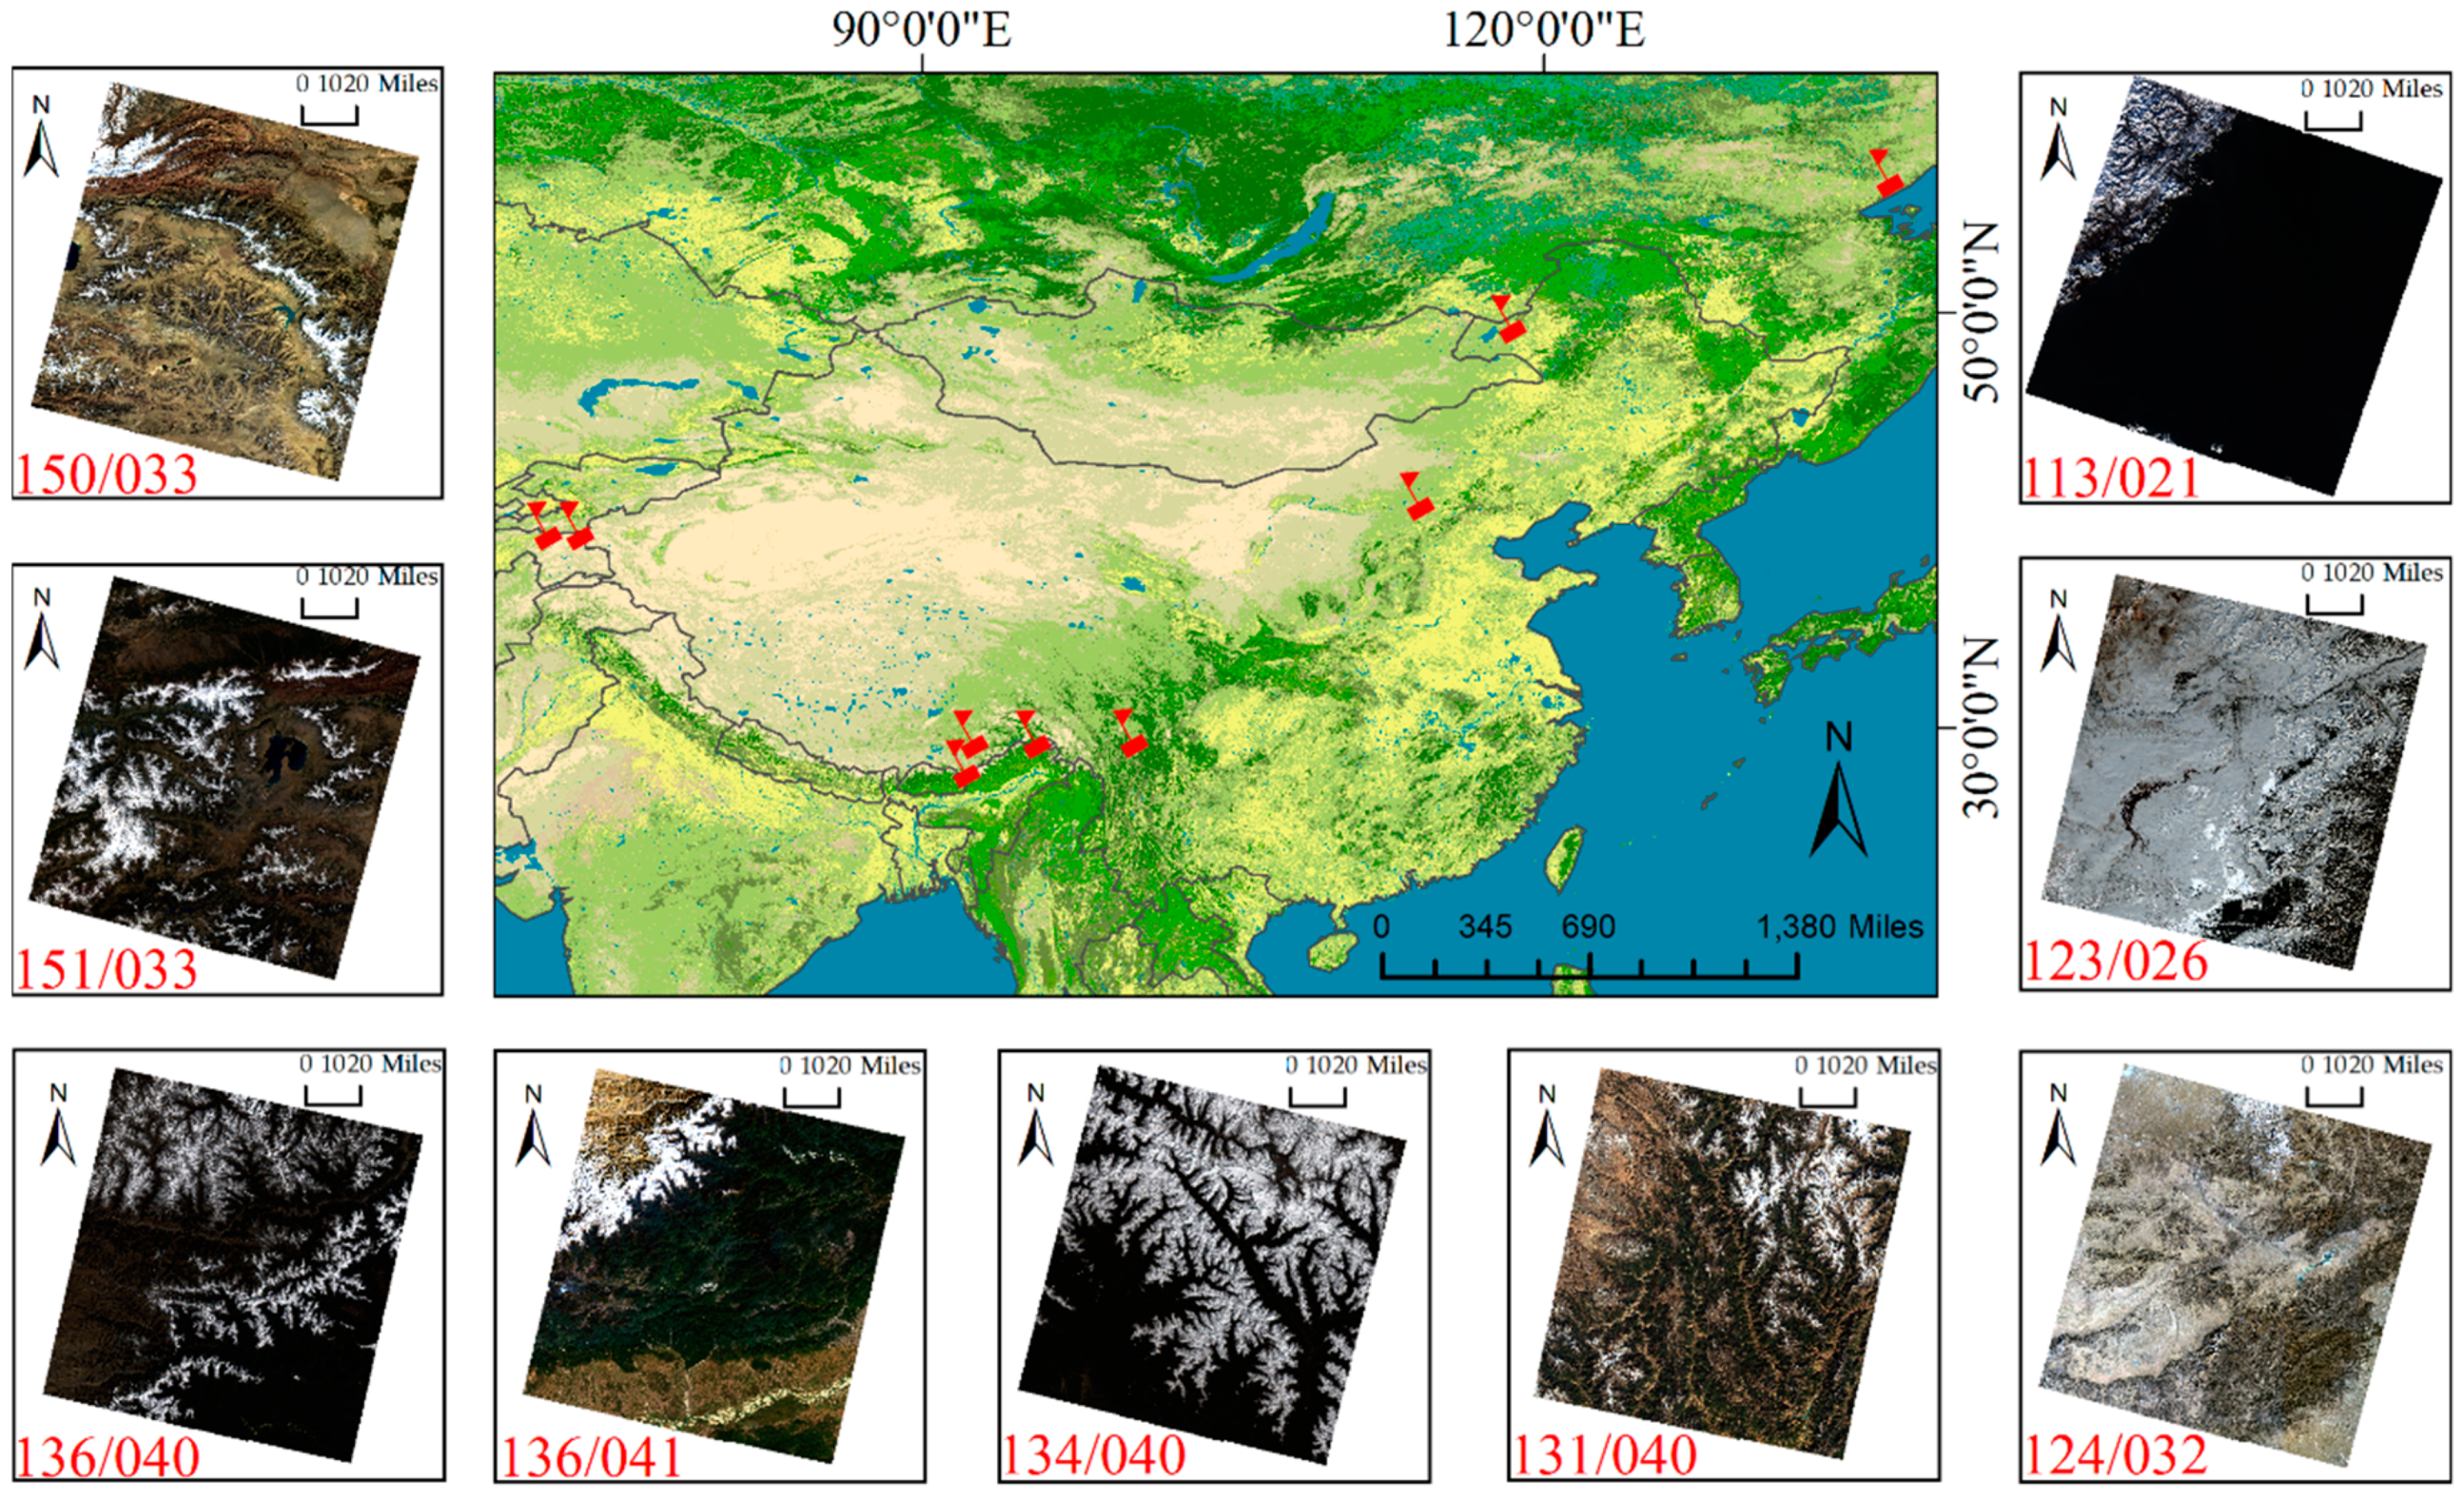
18], which is one of the most important features used to construct snow index methods. Therefore, the RSI was designed to take advantage of this feature. Considering the absence of the SWIR band on the GF-4 PMS, a SWIR band restoration method for GF-4 PMS needed to be constructed by indirectly using other appropriate remote sensing data. As mentioned previously, the Landsat-8 OLI images were selected as a substitution for the GF-4 PMS images to build the restoration method.
It was necessary to conduct spectral matching because of the differences between sensor parameters, such as the spectral responses of GF-4 PMS and Landsat-8 OLI in the corresponding bands.
Table 1 and
Figure 2 show the sensor parameters and spectral response functions of GF-4 PMS and Landsat-8 OLI [
30,
35,
36]. The wavelength ranges of PMS are slightly wider than those of OLI in the visible bands. As for the NIR band, the wavelength range of PMS is much wider than that of OLI. The central wavelengths of PMS are close to those of OLI in the visible bands. As for the NIR band, the central wavelength of PMS is shorter than that of OLI. Furthermore, the spatial resolution of PMS is 1.6 times that of OLI.
Considering the abovementioned differences, the differences in reflectance of the same objects between the two sensors in the corresponding bands need to be evaluated to ensure that the restoration method built with the OLI image also applies to the PMS image. The Johns Hopkins University Spectral Library [
37] and the spectral response function of PMS and OLI were used to simulate the reflectance of typical objects in specific bands by using Equation (1):
where
is the reflectance in the band;
is the reflectance at the wavelength;
is the normalized spectral response at the wavelength; and
and
are the initial and end wavelengths of the band, respectively. The reflectance of 214 typical objects such as igneous rocks, manmade materials, metamorphic rocks, sedimentary rocks, snow, soil, and vegetation were calculated.
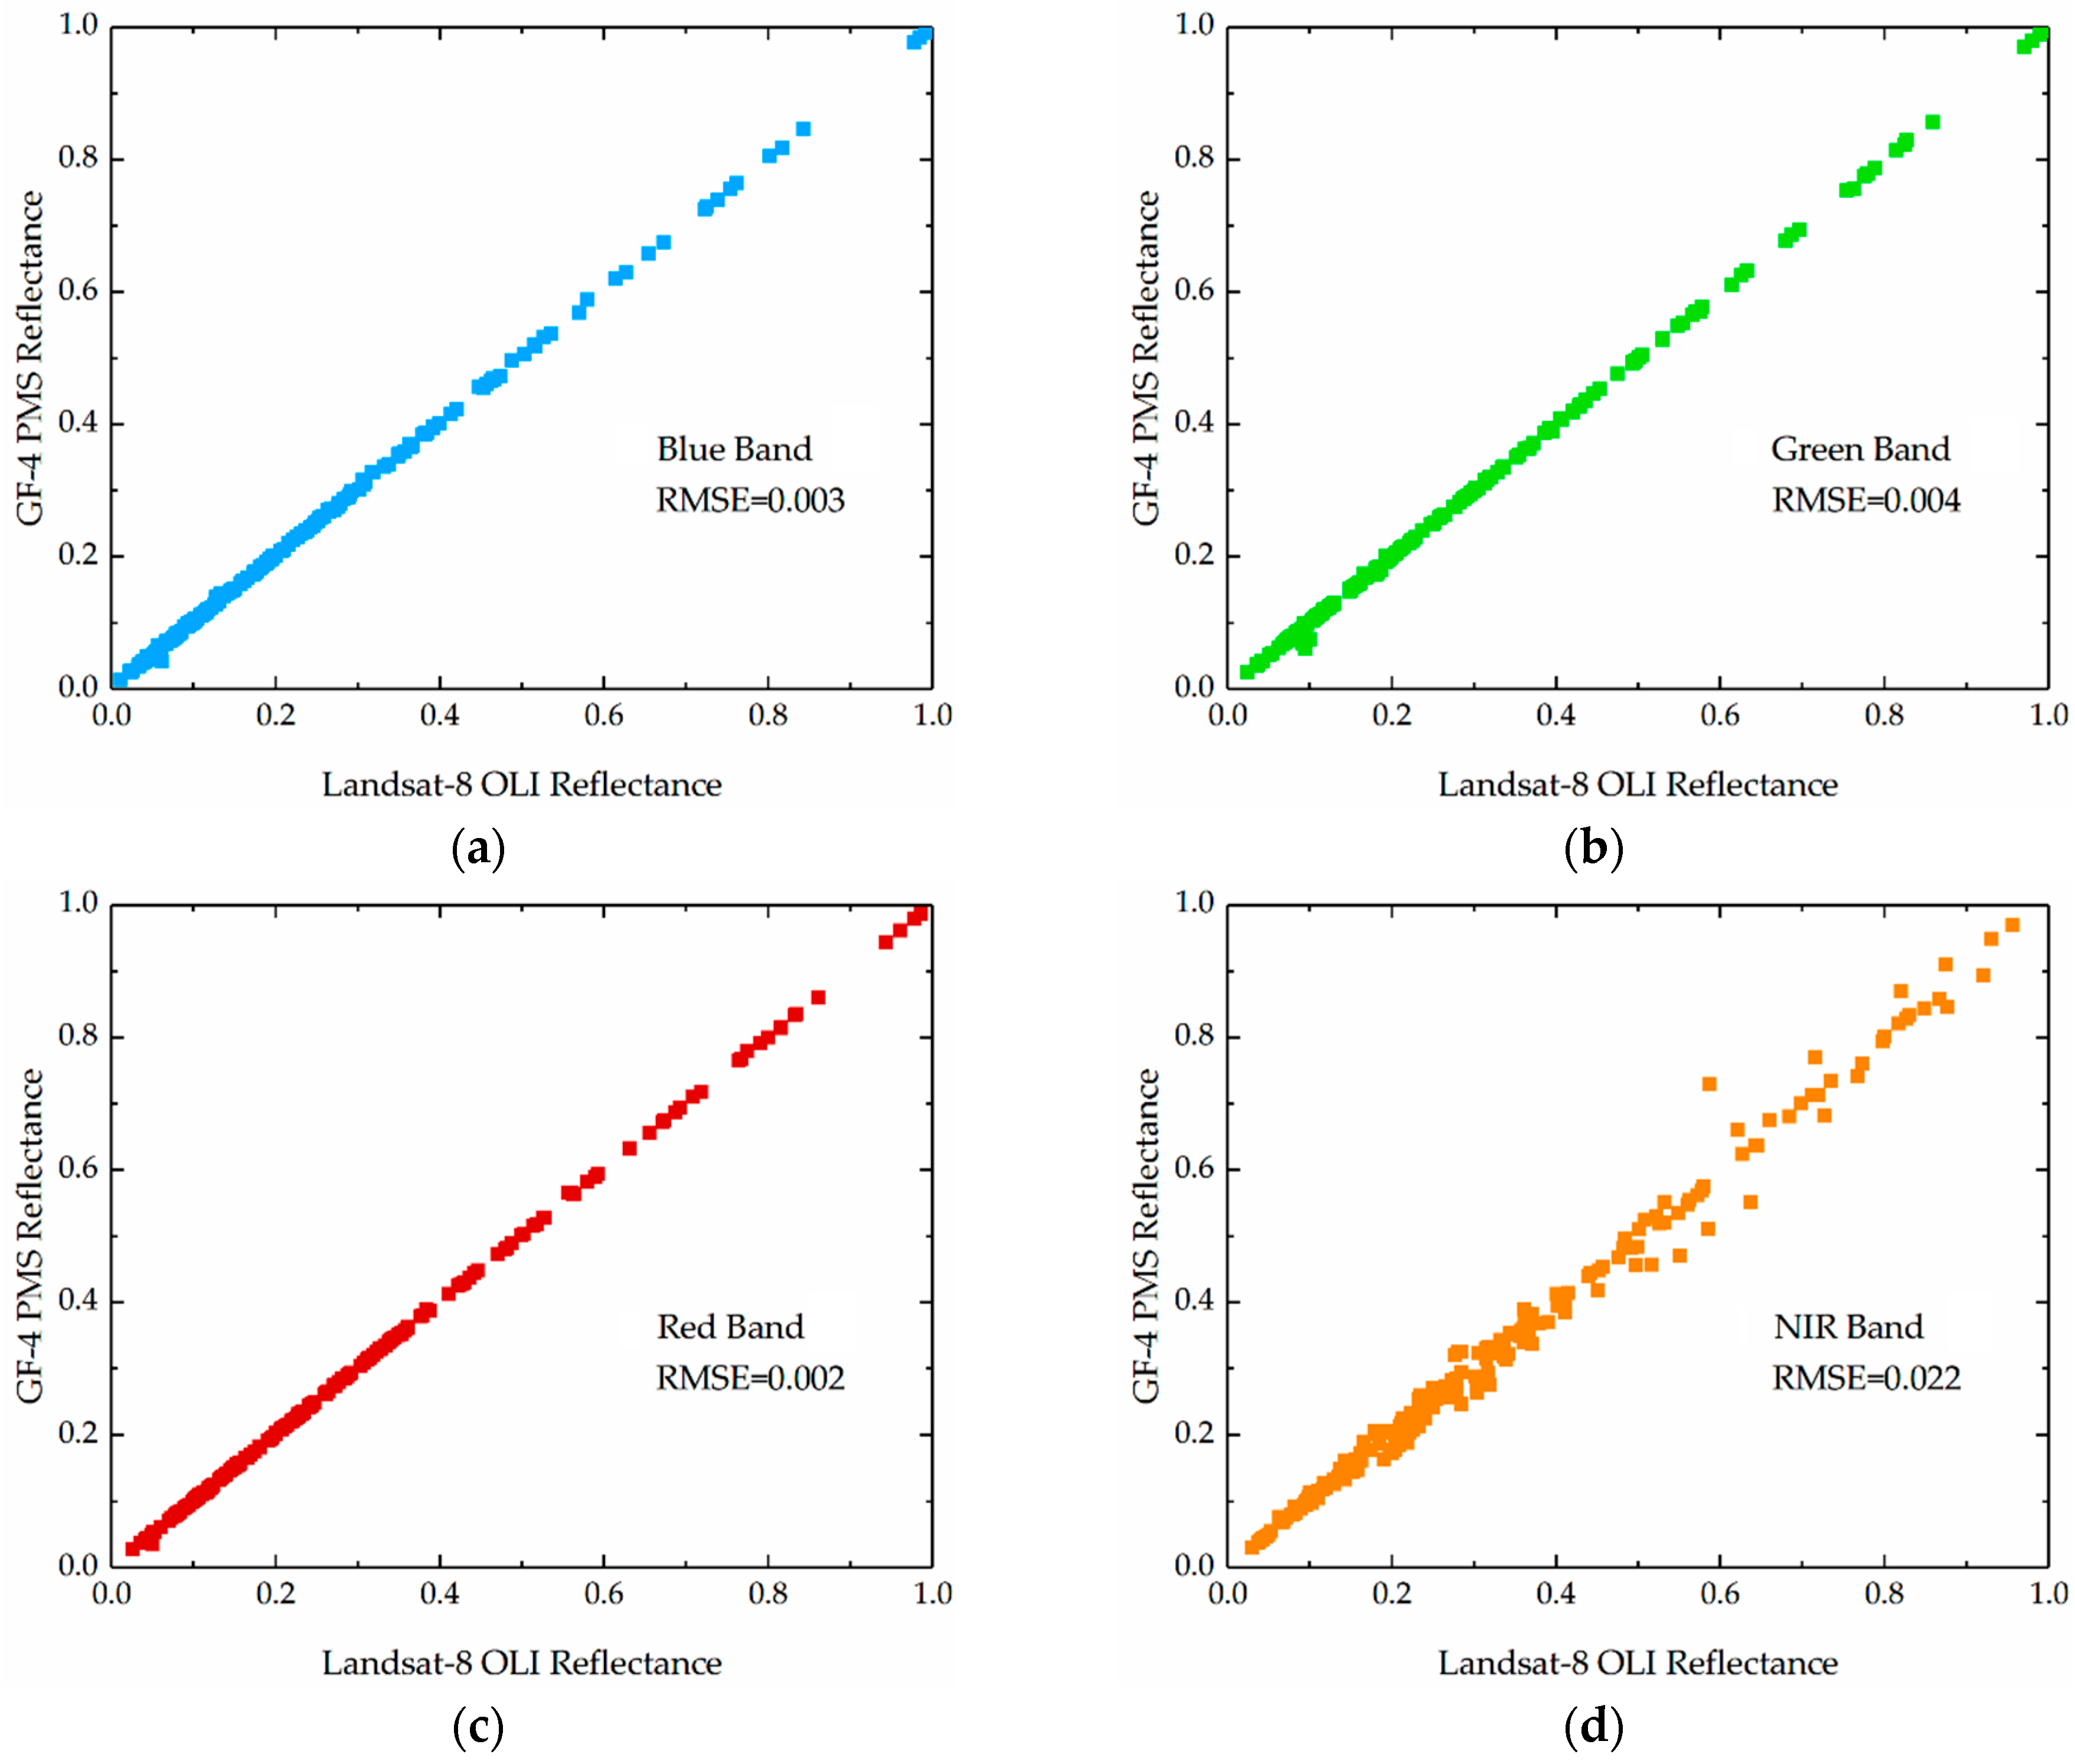
Figure 3 shows the scatterplots of the GF-4 PMS reflectance versus the Landsat-8 OLI reflectance. The consistency of reflectance of the same objects between the two sensors is very satisfactory in the visible bands. For the NIR band, the scatterplot exhibits greater variability from the trend line than those of the visible bands, and the root mean square error (RMSE) is an order of magnitude larger than those of the visible bands. This is mainly caused by the larger difference between the spectral response function of PMS and that of OLI in the NIR band. The NIR band of PMS is much wider and the central wavelength is shorter than that of OLI. If the reflectance of an object changes sharply in the wavelength range of 700 to 900 nm, such as for vegetation, the NIR reflectance of this object in PMS and OLI images will be different. However, the Landsat-8 OLI data are still a good substitution, considering the excellent consistency of the linear trend of PMS and OLI in the visible bands and the acceptable consistency of the linear trend in the NIR band.
3.3. Restored Snow Index
The NDSI is defined as the normalized difference between the reflectance in the green and SWIR bands. For snow cover, the reflectance in the green band is higher than that in the SWIR band. The NDSI value of snow cover is positive, whereas those of other land cover types are negative or close to zero. Therefore, the NDSI can separate snow cover and background by enhancing the spectral signature of snow cover. For GF-4 PMS images, we have already built the restoration method to restore the reflectance of snow cover in the SWIR band. After the restoration, the NDSI can be calculated as follows:
where
is the reflectance in the green band,
is the restored reflectance in the SWIR band, and
is the NDSI calculated with the restored SWIR reflectance.
However, the restoration method is built with snow cover samples and is unsuitable for other land cover types. The restored SWIR reflectance of snow cover is accurate, but those of other land cover types may be not. Therefore, the effectiveness of the
for snow cover detection may be weakened. To evaluate the effectiveness of the
, the abovementioned snow cover and background samples from nine OLI images were used to restore the SWIR reflectance and calculate the
.
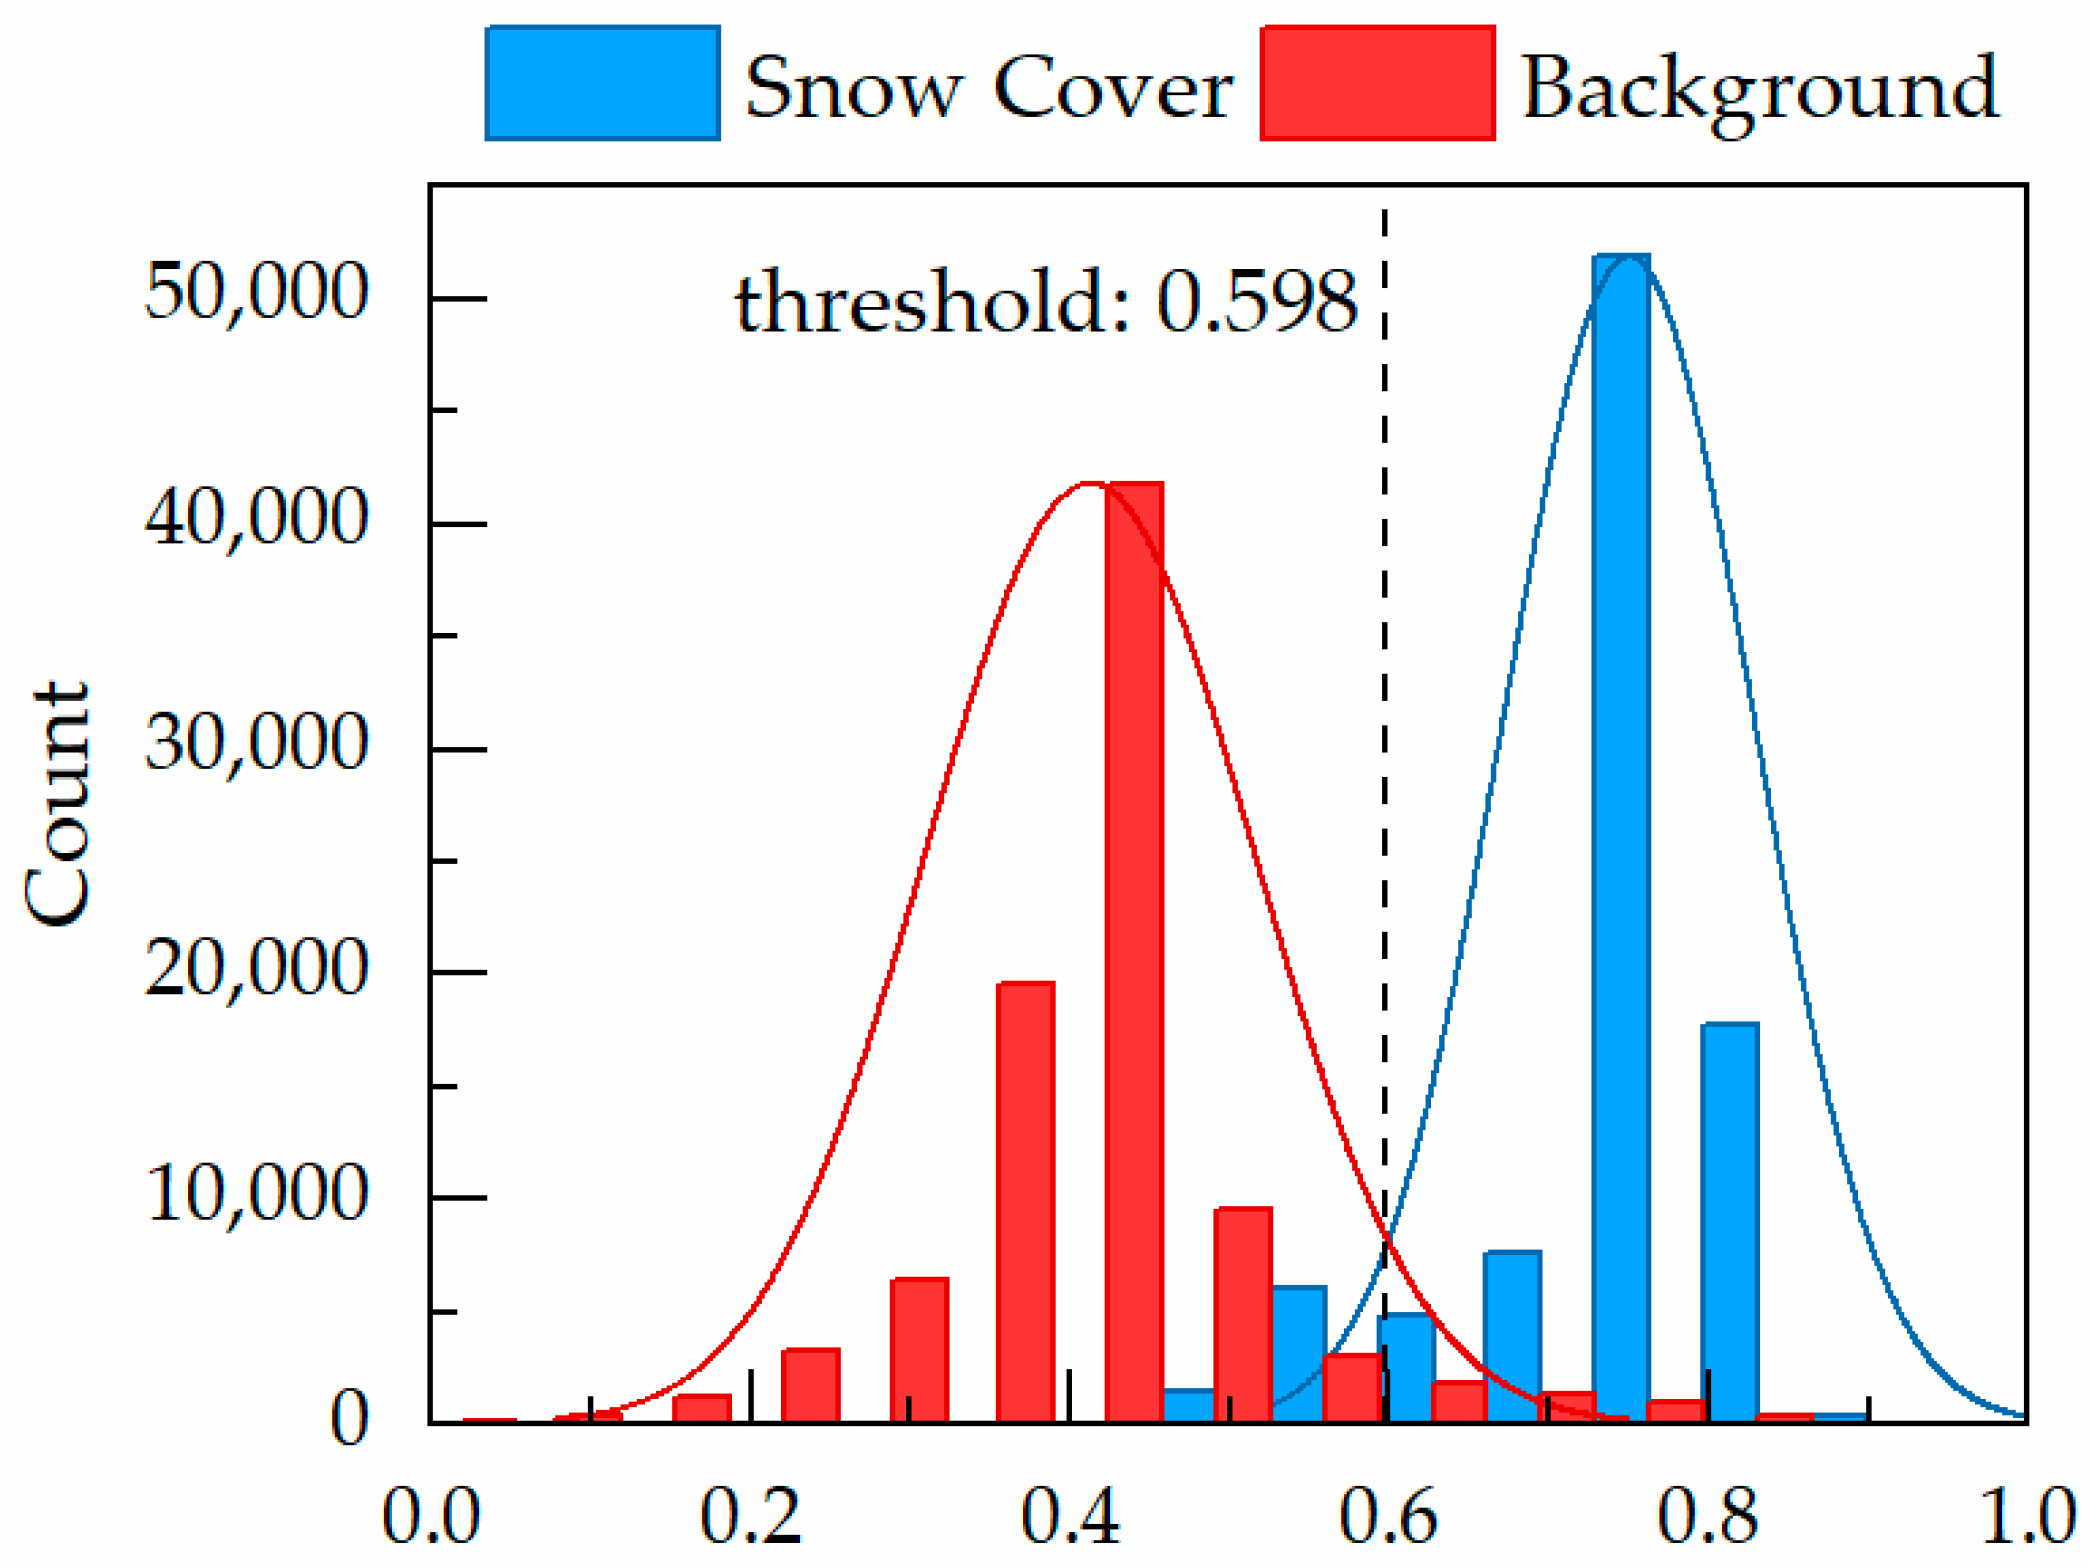
Figure 9 illustrates the histograms of the
value of the 90,000 snow cover and 90,000 background pixels.
As shown in
Figure 9, the separability between the
value of snow cover and that of background is weakened. The
value of snow cover is still positive, but that of the background is positive too. Most of the snow cover and background samples can be distinguished by differences in the
value. The overall accuracy of classification can reach 93.28% when the segmentation threshold is set to 0.598, but there are still 4.78% of the snow cover samples and 8.67% of the background samples misclassified with the optimal segmentation threshold, which is unsatisfactory.
To enhance the separability of the snow cover and background and take advantage of the restored SWIR reflectance of snow cover, the RSI was built with the LDA method, which has been widely used to construct classification-oriented multispectral indices [
42,
43]. The LDA is a method that can find a linear combination of multiple variables and aims to enhance the separability between different categories. The resulting combination can be used as a form of classification-oriented multispectral index [
44].
Considering the spectral characteristics in VNIR bands and interaction between bands, the reflectance in the VNIR bands, the restored SWIR reflectance, and the
value of each pixel are seen as a six-dimensional vector for the GF-4 PMS image. The LDA method can obtain a transformation of the six-dimensional vectors by projecting the vectors onto a one-dimensional line. The separability between the snow cover and background was maximized after the projection. The abovementioned snow cover and background samples from nine OLI images were used as the training data for the LDA. The form of the RSI built with LDA is as follows:
where
,
,
, and
are the reflectance in the VNIR bands, respectively;
is the restored reflectance in the SWIR band; and
is the NDSI calculated with the restored SWIR reflectance. The abovementioned snow cover and background samples from nine OLI images were used to calculated the RSI.
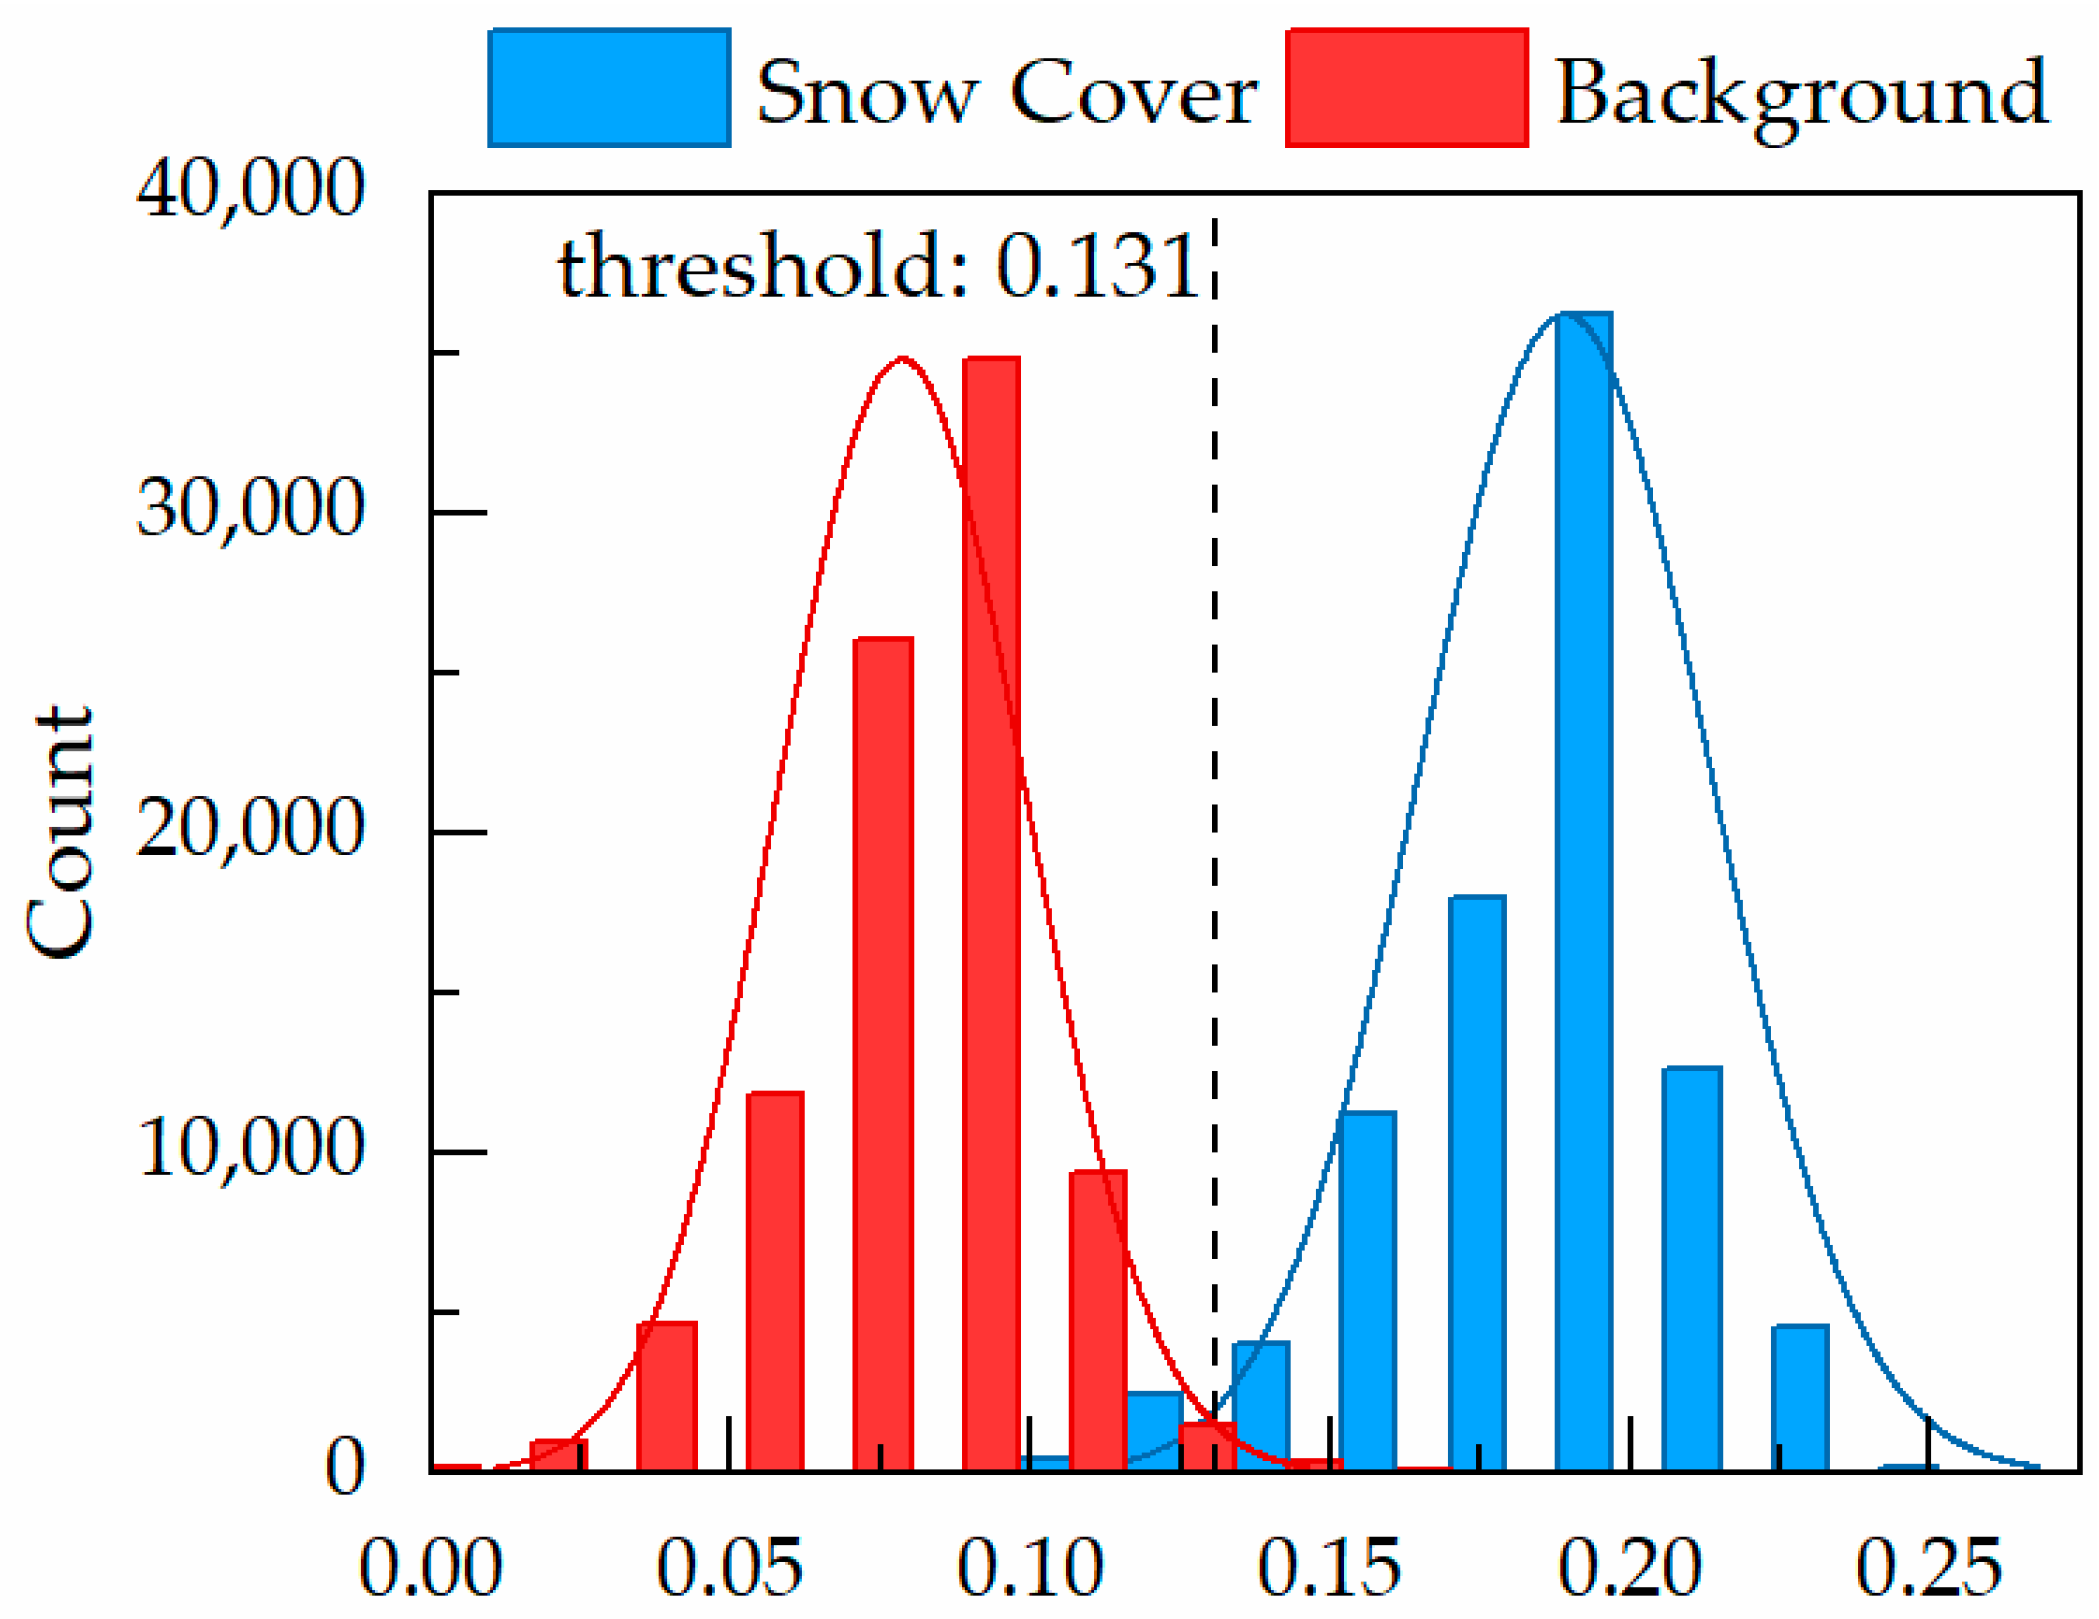
Figure 10 illustrates the histograms of the RSI values of the 90,000 snow cover and 90,000 background pixels.
The separability between the snow cover and background is enhanced. The overall accuracy of classification can reach 98.34% when the segmentation threshold is set to 0.131. Overall, 2.67% of the snow cover samples and 0.64% of the background samples are misclassified with the optimal segmentation threshold, which is more satisfactory than the performance of the .
As mentioned previously, the restored SWIR reflectance, as well as the , is not a simple linear combination of the reflectance in VNIR bands. By introducing these nonlinear combinations into the RSI, the performance of the classification could be improved. As a comparison, the best overall accuracy of classification is 97.75%, using a simple VNIR-band linear classifier trained with the LDA method, which is lower than that of the RSI.
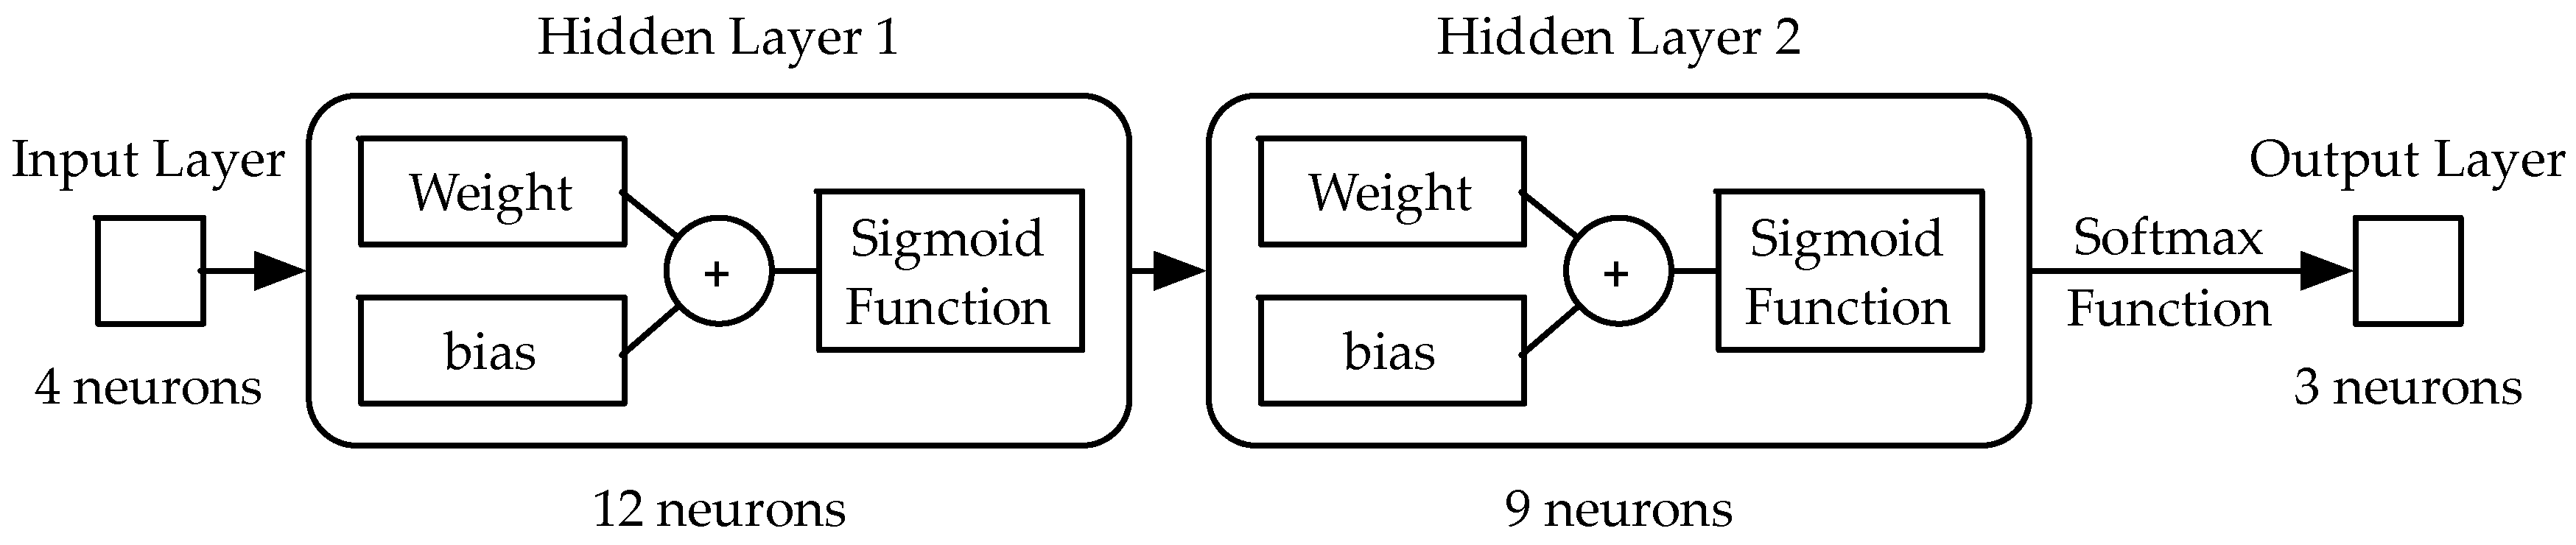
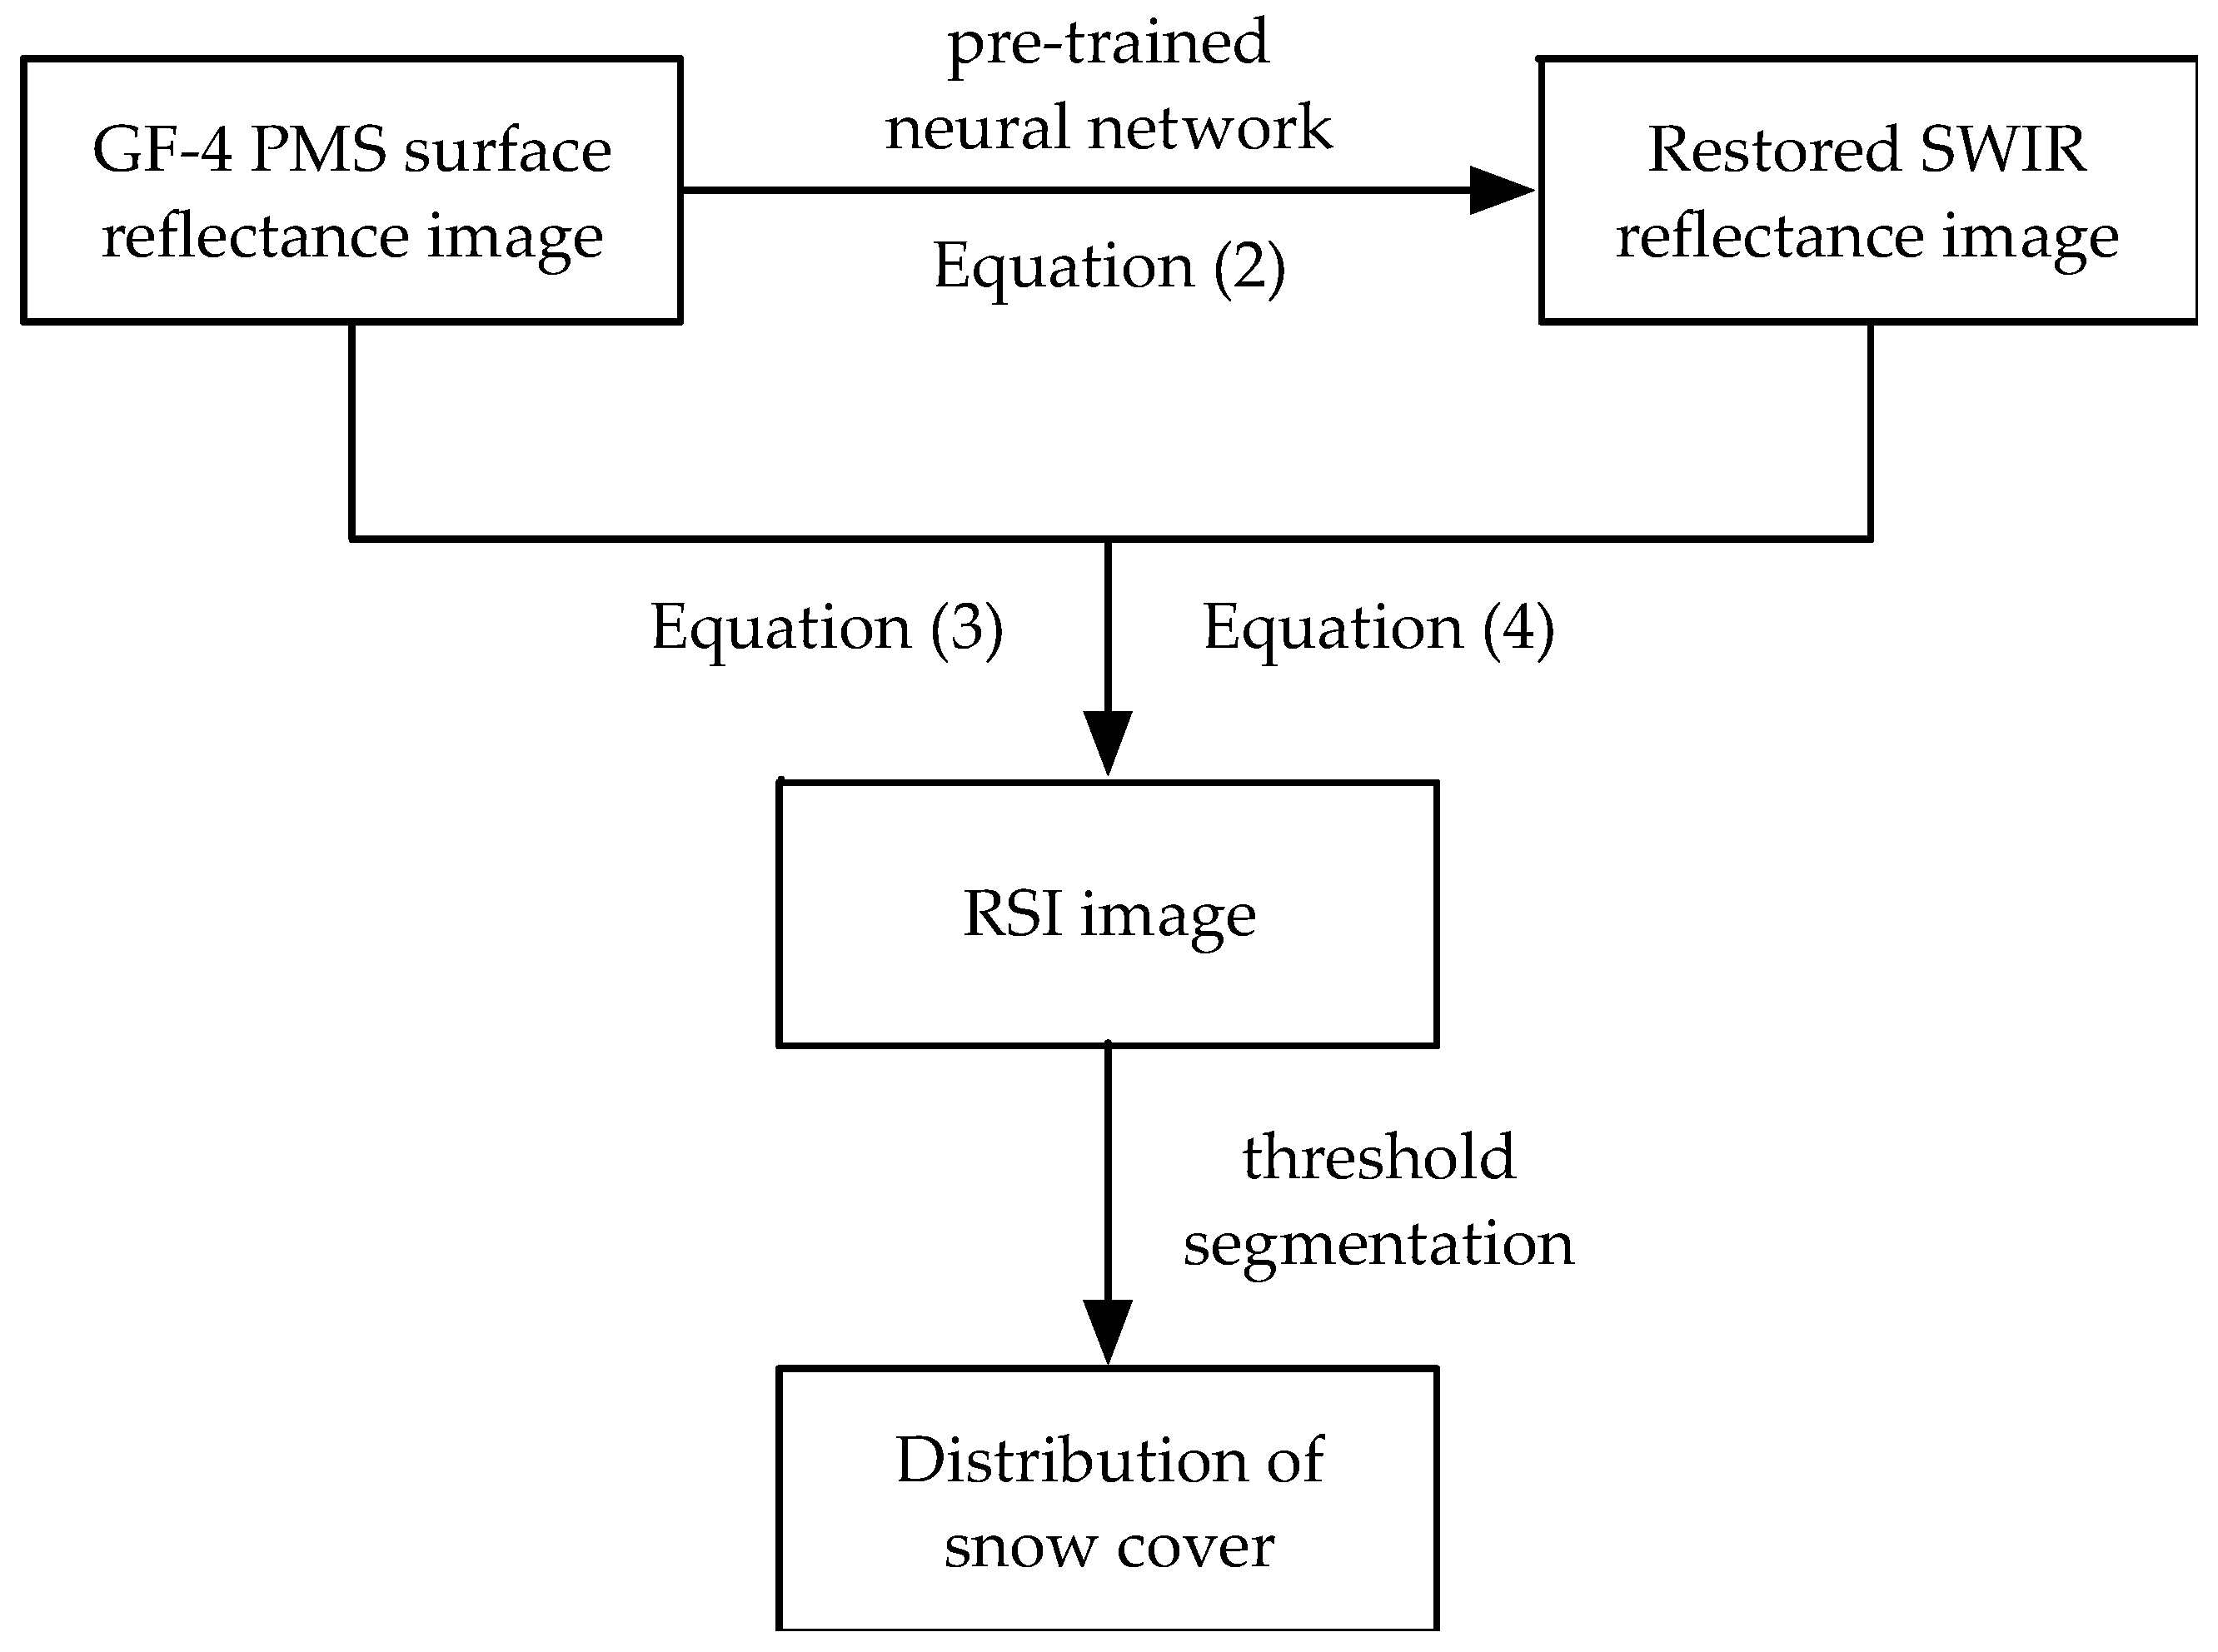
In summary, the RSI method for snow cover monitoring from GF-4 PMS imagery can be summarized as three steps. First, the SWIR reflectance of pixels in GF-4 PMS surface reflectance images are restored with the pretrained multilayer feedforward neural network and Equation (2). Then, the RSI values are calculated with the Equations (3) and (4), which provide more information of snow cover than binary classification results. Finally, the distribution of snow cover can be mapped with a proper segmentation threshold applied to the RSI image.
Figure 11 presents the flowchart of the proposed RSI method.


