Article

Assessment of Satellite-Derived Precipitation Products for the Beijing Region

1
College of Water Sciences, Beijing Normal University, Beijing 100875, China
2
Beijing Key Laboratory of Urban Hydrological Cycle and Sponge City Technology, Beijing 100875, China
3
Swiss Federal Institute of Aquatic Science and Technology, Ueberlandstrasse 133, CH-8600 Duebendorf, Switzerland
4
Laboratoire des Sciences du Climat et de l’Environnement, LSCE/IPSL, CEA-CNRS-UVSQ, Université Paris-Saclay, F-91191 Gif-sur-Yvette, France
5
Beijing Hydrology Bureau, Beijing 100038, China
6
National Climate Centre, Beijing 100081, China
*
Author to whom correspondence should be addressed.
Remote Sens. 2018, 10(12), 1914; https://doi.org/10.3390/rs10121914
Submission received: 27 September 2018 / Revised: 21 November 2018 / Accepted: 29 November 2018 / Published: 29 November 2018
(This article belongs to the Section Remote Sensing in Geology, Geomorphology and Hydrology)

Abstract

:
Performance of four satellite precipitation products, namely, the China Meteorological Forcing Dataset (CMFD), Climate Prediction Center morphing technique (CMORPH), as well as 3B42 calibrated and 3B42-RT dataset, which are derived from the Tropical Rainfall Measuring Mission (TRMM) and Multi-satellite Precipitation Analysis (TMPA), were evaluated from daily to annual temporal scales over Beijing, using observations from 36 ground meteorological stations. Five statistical properties and three categorical metrics were used to test the results. The assessment showed that all four satellite precipitation products captured the temporal variability of precipitation. Although four satellite precipitation products captured the trend of more precipitation in the northeastern regions, all four products showed different distribution from the observations for 2001–2015 over Beijing. All precipitation products tended to overestimate moderate precipitation events and underestimate heavy precipitation events over Beijing, except for 3B42RT, which tended to overestimate most precipitation events. By comparison, the CMFD performed better than the CMORPH, 3B42 calibrated, and 3B42-RT datasets, having the higher correlation coefficient and low root mean squared difference, and mean absolute difference at all temporal scales. The average correlation coefficient of the CMFD, CMORPH, 3B42 calibrated, and 3B42-RT products for all 36 stations were 0.70, 0.60, 0.59, and 0.54 for daily precipitation and 0.78, 0.32, 0.74, and 0.44 for monthly precipitation. Overall, the CMFD was the most reliable for the Beijing region.

Graphical Abstract

1. Introduction

Precipitation plays an important role in global water cycles, linking the atmosphere and the land surface, and affecting meteorology, climatology, and hydrology [1,2,3]. The Fifth Assessment Report of the Intergovernmental Panel on Climate Change (IPCC AR5) concluded that climate change has affected extreme events such as extreme temperatures, extreme precipitation, and droughts, etc., and some of the changes in weather and climate extremes observed in the late 20th century are projected to continue into the future. It has been demonstrated that the current global surface temperature warmed by 0.85 °C from 1880 to 2010 [4,5], lakes have been warming with the lake surface water temperature in some regions exceeding nearby surface air temperature changes during the 20th century [6,7], the oceans’ surface and inner seas’ surface temperature are strongly influenced by climate change, and the warming in the sea will rise about 5.8 °C on average by 2100 [8]. Precipitation is also influenced by global warming. Previous studies have showed that global land precipitation has increased by about 2% since the beginning of the 20th century. It is very likely that there have been even more pronounced increases in heavy and extreme precipitation events in some regions where total precipitation has increased or remained constant [9,10,11]. The distribution of regional precipitation and its variability can significantly affect flash flood hazards and regional water resources management. Beijing, as one of the largest cities in the world, has experienced severe urban flooding from heavy precipitation [12,13]. In recent years, urban flooding has caused several major disasters throughout China, posing a threat to the growing populations in cities. Therefore, detecting spatial and temporal changes in long-term urban precipitation is one of the highest priorities in urban water resources management.
There are three ways to obtain precipitation information for urban areas: ground observations, weather radar observations, and satellite monitoring techniques. Ground observations are the most important and direct way of acquiring these data, but it is difficult to obtain long-term precipitation data because of the geographical restrictions of station locations, the shortage of meteorological observation equipment, and the high costs of operating and maintaining these stations [2,14,15]. Radar observations of precipitation have large uncertainties associated with them in complex terrains, related to errors in electronic signals under challenging operating environments [16]. In contrast, satellite remote sensing data can provide observations of global precipitation and clouds. Although infrared/visible light can only provide information on thickness and heights of clouds, microwaves can provide more direct observations of precipitation by penetrating clouds and interacting with precipitation particles [2]. At present, a series of different satellite-based global precipitation products are available, including products derived from the Tropical Rainfall Measuring Mission (TRMM) Multi-satellite Precipitation Analysis (TMPA) [17,18,19], Climate Prediction Center morphing technique (CMORPH) [20,21,22], Precipitation Estimation from Remotely Sensed Information using Artificial Neural Networks (PERSIANN)-Climate Data Record (CDR) [23,24,25], the Global Satellite Mapping of Precipitation (GSMaP) project [26,27,28], and the Integrated Multi-satellite Retrievals for the Global Precipitation Measurement (IMERG) [29,30], etc.
Satellite-derived precipitation data are a good alternative to ground-based observations of precipitation data, with advantages of a larger coverage area and high spatio-temporal resolution. Nevertheless, all satellite precipitation products provide indirect estimates of precipitation [31], making it necessary to assess satellite-derived precipitation products by comparing their data with ground observations [32]. Previous studies have evaluated the performance of various satellite precipitation products at different scales. Liu et al. [33] found that variations between 3B42 calibrated and 3B42-RT (version 7) precipitation data derived from Tropical Rainfall Measuring Mission (TRMM) and Multi-satellite Precipitation Analysis (TMPA) are small over regions of heavy rain, but large over regions experiencing light rain, when compared at a global scale. Tan et al. [34] pointed out that 3B42 calibrated (version 7) and a ground-based precipitation product (APHRODITE) performed best, while Global Precipitation Climatology Project (GPCP)-One-Degree Daily (1DD) data performed worst, in their evaluation of 3B42 calibrated, 3B42-RT, GPCP-1DD, PERSIANN-CDR, CMORPH, and APHRODITE products over Malaysia from 2003 to 2007. There have also been several studies that assessed satellite precipitation in different areas over China, such as Shen et al. [35], who compared six high-resolution satellite precipitation products over China and concluded that CMORPH data had the highest correlation coefficient. A study by Qin et al. [32] suggested that GSMaP and CMORPH underestimated precipitation, while 3B42-RT overestimated precipitation, and 3B42 calibrated had the best performance over the Chinese mainland during 2003–2006. Deng et al. [36] compared the National Centers for Environmental Prediction (version 2) reanalysis data, the CMORPH data, the merged satellite-gauge Global Precipitation Climatology Project data, and the merged satellite-gauge-model data over China, and suggested that four precipitation datasets present an increasing trend from northwest to southeast in monthly precipitation, the CMORPH data underestimates monthly precipitation over China, and the other three datasets underestimated it. Zhang et al. [37], who evaluated three satellite precipitation datasets in the Tianshan mountain area in China, concluded that global precipitation measurement performed better than 3B42 calibrated and CMORPH in daily precipitation. Although some of the satellite precipitation products show good correlation with ground observations in particular regions, no evidence supports the use of one dataset for all applications. To date, previous studies evaluating satellite precipitation data were focused on the global, national, and basin scales. This reveals that a comprehensive evaluation of satellite precipitation products at the scale of a megacity is lacking.
In this study, the performance of four satellite-based precipitation products, namely, the China Meteorological Forcing Dataset (CMFD), CMORPH, as well as 3B42 calibrated and 3B42-RT (version 7) was comprehensively evaluated using ground observations of precipitation from 36 meteorological stations at multiple temporal scales over Beijing. Our objective was to evaluate these satellite precipitation products for Beijing to provide more reliable data for water resource management.

2. Study Area and Data Description

2.1. Study Area

Beijing, the capital of China, is located in northern China, with a latitudinal range of 39°28′ N–41°05′ N and a longitudinal range of 115°25′ E–117°30′ E, as shown in Figure 1. Its total area is 16.8 × 10³ km2, with mountain and plain areas of 10.4 × 10³ km2 and 6.4 × 10³ km2, respectively. The topography of Beijing changes from mountains to plains, from west to east and from north to south. The climate of Beijing is typical of a semi-humid continental monsoon climate of the warm temperate zone. The average annual temperature is between 11–13 °C, although the highest temperatures in summer can reach 42 °C and the lowest temperatures in winter can be as low as −27 °C [38,39,40]. The average annual precipitation for Beijing is 508.8 mm/year, according to observed precipitation data from 2001 to 2015. Regional differences in annual precipitation are considerable. The maximum average annual precipitation can reach 682.9 mm/year at the Zaoshulin station, which is located in the northeast areas of Beijing, while the minimum average annual precipitation is only 372.1 mm/year at the Yanhecheng station, which is located in the southwest mountain areas. The seasonal distribution of precipitation is uneven. The amount of summer (June–August) precipitation is large, accounting for above 70% of the total annual precipitation, while precipitation in winter is only around 2% of the total annual precipitation [41].

2.2. Datasets

The period from 1 January 2001 to 31 December 2015 was chosen as the study period since this period is the overlapping period for four satellite precipitation products. The CMFD, CMORPH, 3B42 calibrated, and 3B42-RT (version 7) precipitation data derived from Tropical Rainfall Measuring Mission (TRMM) and Multi-satellite Precipitation Analysis (TMPA) were selected for study because: (1) previous research has indicated that the TMPA (version 7) products and CMORPH data are suitable for mainland China, and TMPA (version 7) shows an improved performance compared with TMPA (version 6) products [36]; and (2) the CMFD is a set of reanalysis data that incorporates meteorological data from the China Meteorological Administration. All four satellite precipitation datasets were interpolated to each station using bilinear interpolation to match the scale of ground observations.

2.2.1. Ground Observations

Daily precipitation data measured at 36 meteorological stations over Beijing, as shown in Figure 1, were used in this study. The average annual precipitation for each station was calculated by daily precipitation data from 2001 to 2015. The dataset was provided by the Beijing Hydrology Bureau and the National Climate Centre of China. Detailed information about 36 ground stations are provided in Table 1. The observed daily precipitation data required some preprocessing for the missing data, which were replaced by multi-year daily means for the given time point.

2.2.2. Satellite-Derived Precipitation Datasets

The CMFD was developed by the Institute of Tibetan Plateau Research of the Chinese Academy of Sciences (http://westdc.westgis.ac.cn/data/7a35329c-c53f-4267-aa07-e0037d913a21) [42]. It includes near surface meteorological and environmental factors. Using the Princeton reanalysis data, Global Land Data Assimilation System (GLDAS), Global Energy and Water Cycle Experiment-Surface Radiation Budget (GEWEX-SRB) radiation data, and the TMPA 3B42 calibrated products as the background field, the CMFD was integrated with conventional meteorological observations from the China Meteorological Administration, which are used to correct systematic departures in the background data. The CMFD includes seven variables, namely, near surface temperature, near surface pressure, near surface air specific humidity, near surface wind speed, downward short-wave radiation data, downward long-wave radiation data, and precipitation rate [42,43]. The spatial and temporal resolutions of the CMFD are 0.1° × 0.1° and 3 h. Daily data were obtained by adding eight sets of consecutive 3-h data.
The CMORPH dataset was developed by the Climate Prediction Center of the National Oceanic and Atmospheric Administration. It is observed and produced using multiple platforms and interpolated in both temporal and spatial scales [44]. The infrared (IR) observations of the geostationary satellite platform and the passive microwave (PMW) information of the low-orbit satellite are combined within the CMORPH dataset. In this case, the IR observations have the advantage of high temporal resolution and the microwave data have good inversion properties. Two steps were included in the fusion of the CMORPH dataset. In the first step, the moving vector of the IR cloud system was calculated every 30 min, while the instantaneous precipitation distribution was obtained from the inversed PMW information. Both were extrapolated to the target analysis time along a moving vector to produce a continuous spatial distribution of precipitation. The IR information was used to acquire the moving vector for extrapolating the precipitation distribution from the PMW inversion, rather than by evaluating the precipitation data [15,45,46,47]. The spatial and temporal resolutions of the CMORPH data used in this study are 0.25° × 0.25° and 24 h.
The TRMM was launched by the National Aeronautics and Space Administration and the Japan Aerospace Exploration Agency in 1997. It is a joint remote sensing precipitation observation mission. The TMPA (version 7) consists of 3B42 calibrated and 3B42-RT precipitation datasets, which are intended to supply the “best” global quasi-precipitation data [14,48,49,50]. The TMPA products are constructed using four steps: (1) the Goddard profiling algorithm (version 2010) is used to estimate the optimal value of the PMW measurements; (2) this optimal value is used to create IR precipitation estimates; (3) combining the value of the PMW data and the IR estimates, the IR data are used to fill any gaps in the PMW data; and (4) the combined value is re-scaled and calibrated using the ground radar, disdrometer data, and ground rain observation data [20,34]. The post-real-time product (3B42 calibrated) provides data that is corrected using the monthly ground precipitation data of the Global Precipitation Climatology Centre. These 3B42 calibrated data can be obtained 10 to 15 days after the end of each month, with spatial and temporal resolutions between 50° N and 50° S of 0.25° × 0.25° and 3 h. The 3B42-RT are real time precipitation data, calibrated using the TRMM microwave imager. The spatial and temporal resolutions of the 3B42-RT data is 0.25° × 0.25° between 60° S and 60° N and 3 h. Daily data were obtained by adding eight sets of consecutive 3-h data over a given day from 00:00 UTC. The main difference between 3B42 calibrated datasets is that 3B42-RT precipitation data are not adjusted using ground observations [32]. The spatial and temporal resolutions of the TMPA data used in this study are 0.25° × 0.25° and 24 h. Four satellite precipitation products are demonstrated in Table 2.

3. Methods

3.1. Statistical Metrics

Five statistical properties were calculated to evaluate the performance of the satellite-based precipitation products’ estimation of ground observed precipitation, including the correlation coefficient (CC), root mean squared difference (RMSD), mean absolute difference (MAD), relative bias (RBS), and the standard deviation (SD). Compared to the observed reference data, CC represents the similarity of investigated data, RMSD and MAD draws the mean difference between the investigated data and reference data, RBS measures the underestimation or overestimation of the investigated data, and SD reflects the dispersion of the statistical metrics among the stations. These statistical properties are defined, as follows [51,52]:
C C = i = 1 n [ ( Y i , o b s Y o b s ¯ ) ( Y i , s a t Y s a t ¯ ) ] [ i = 1 n ( Y i , o b s Y o b s ¯ ) 2 ] [ i = 1 n ( Y i , s a t Y s a t ¯ ) 2 ]
R M S D = i = 1 n ( Y i , o b s Y i , s a t ) 2 n
M A D = i = 1 n | Y i , o b s Y i , s a t | n
R B S = i = 1 n ( Y i , o b s Y i , s a t ) i = 1 n Y i , o b s
S D = i = 1 n ( X i X ¯ ) N 1
where Yi,obs represents observed precipitation at station i; Yi,sat is the satellite precipitation data at station i; Y o b s ¯ represents the mean value of observed precipitation at all stations; and Y s a t ¯ represents the mean value of the satellite-derived precipitation data of all stations; Xi represents the value of the statistical metrics at station i, X ¯ is the mean value of the statistical metrics, N is the total number of stations.

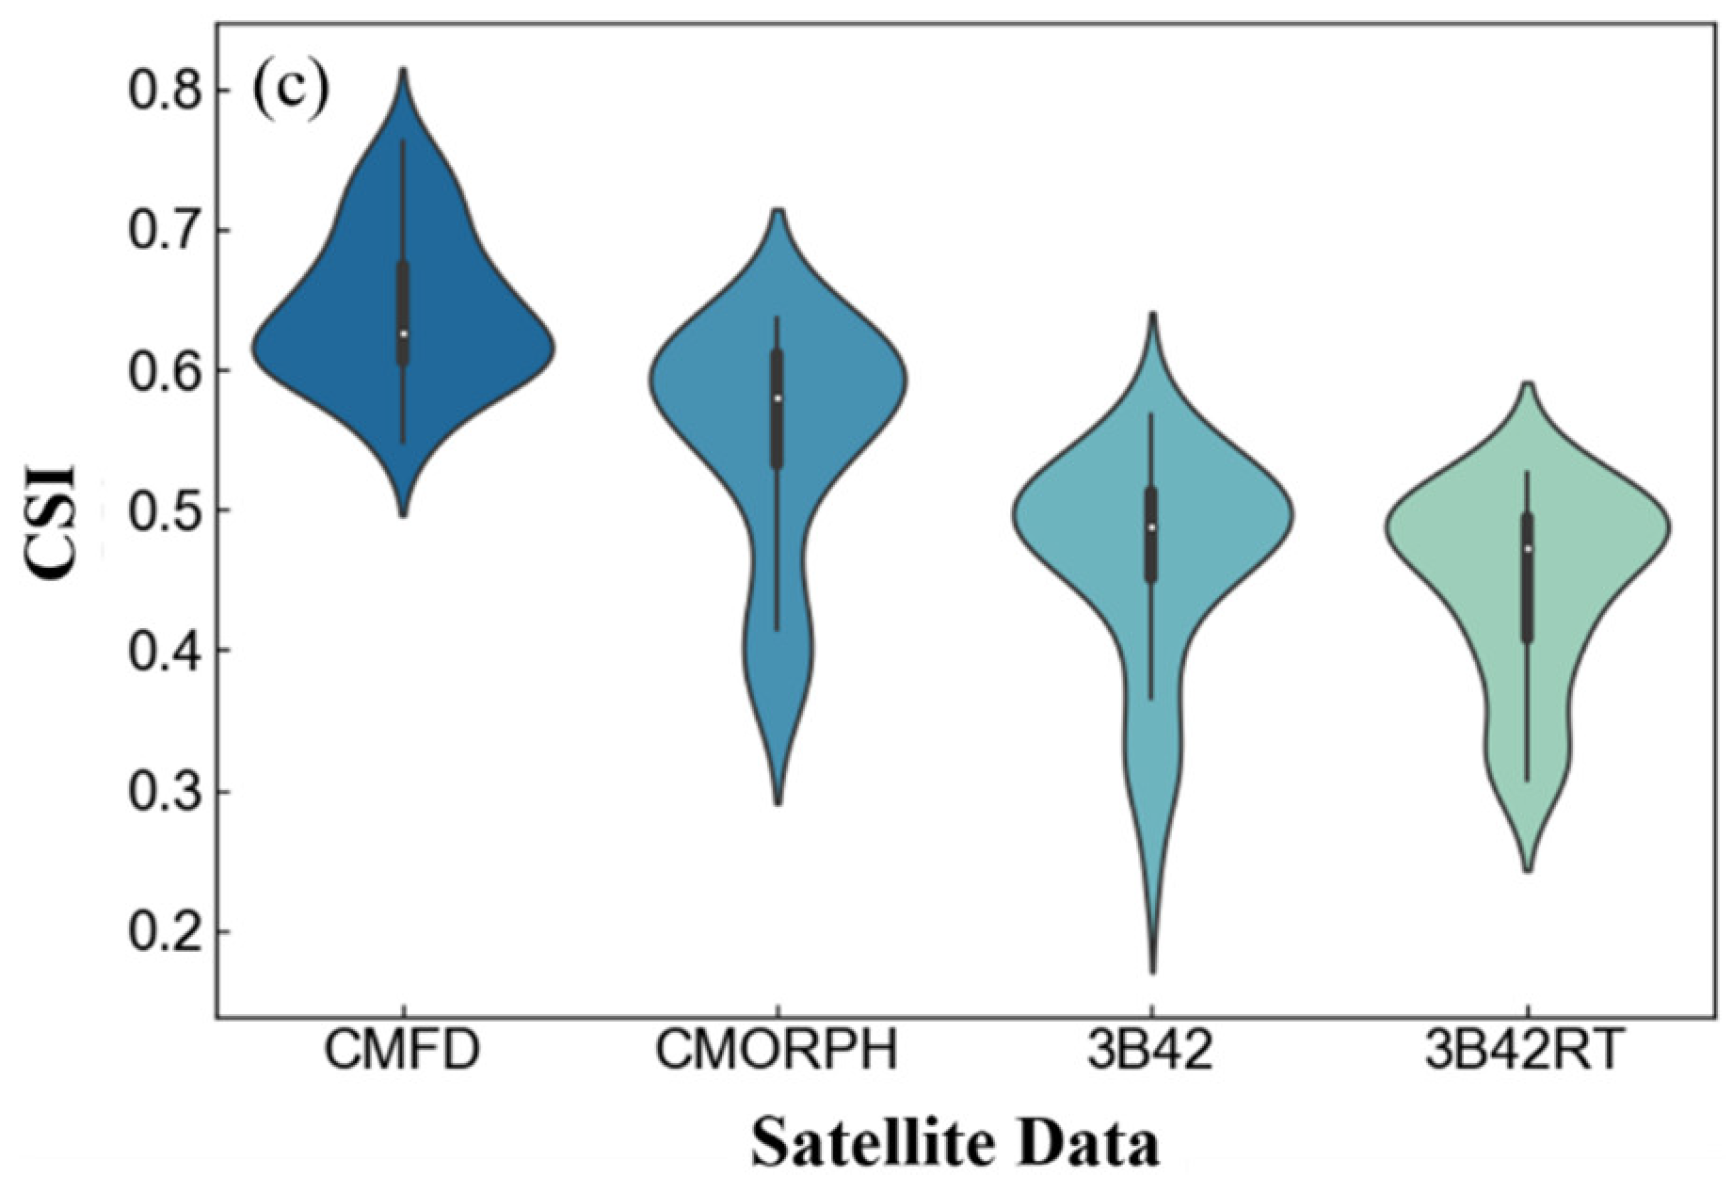
3.2. Categorical Metrics

Three categorical metrics were used to quantify the capacity of the four satellite precipitation products to detect precipitation, i.e., the probability of detection (POD), a false alarm ratio (FAR), and the Critical Success Index (CSI). In this study, 1.0 mm/day was used as the threshold for precipitation events [2,15,32,50]. The POD calculates the proportion of the precipitation events correctly detected by the satellite-based products. The FAR represents the ratio of the precipitation events falsely detected by the satellite-based products when the observed data have no precipitation. The CSI is a function of both the POD and FAR. The closer that POD and CSI are to 1, and the closer the FAR is to 0, the more accurate the satellite precipitation products are at detecting precipitation [53,54]. These categorical metrics were computed, as follows:
P O D = H H + M
F A R = F H + F
C S I = H H + M + F
where H is the number of observed precipitation events correctly detected by the satellite precipitation data, F is the number of the precipitation events detected by satellite precipitation data, but not observed at stations, and M is the number of the precipitation events detected at stations but not by satellite-derived precipitation data.

4. Results

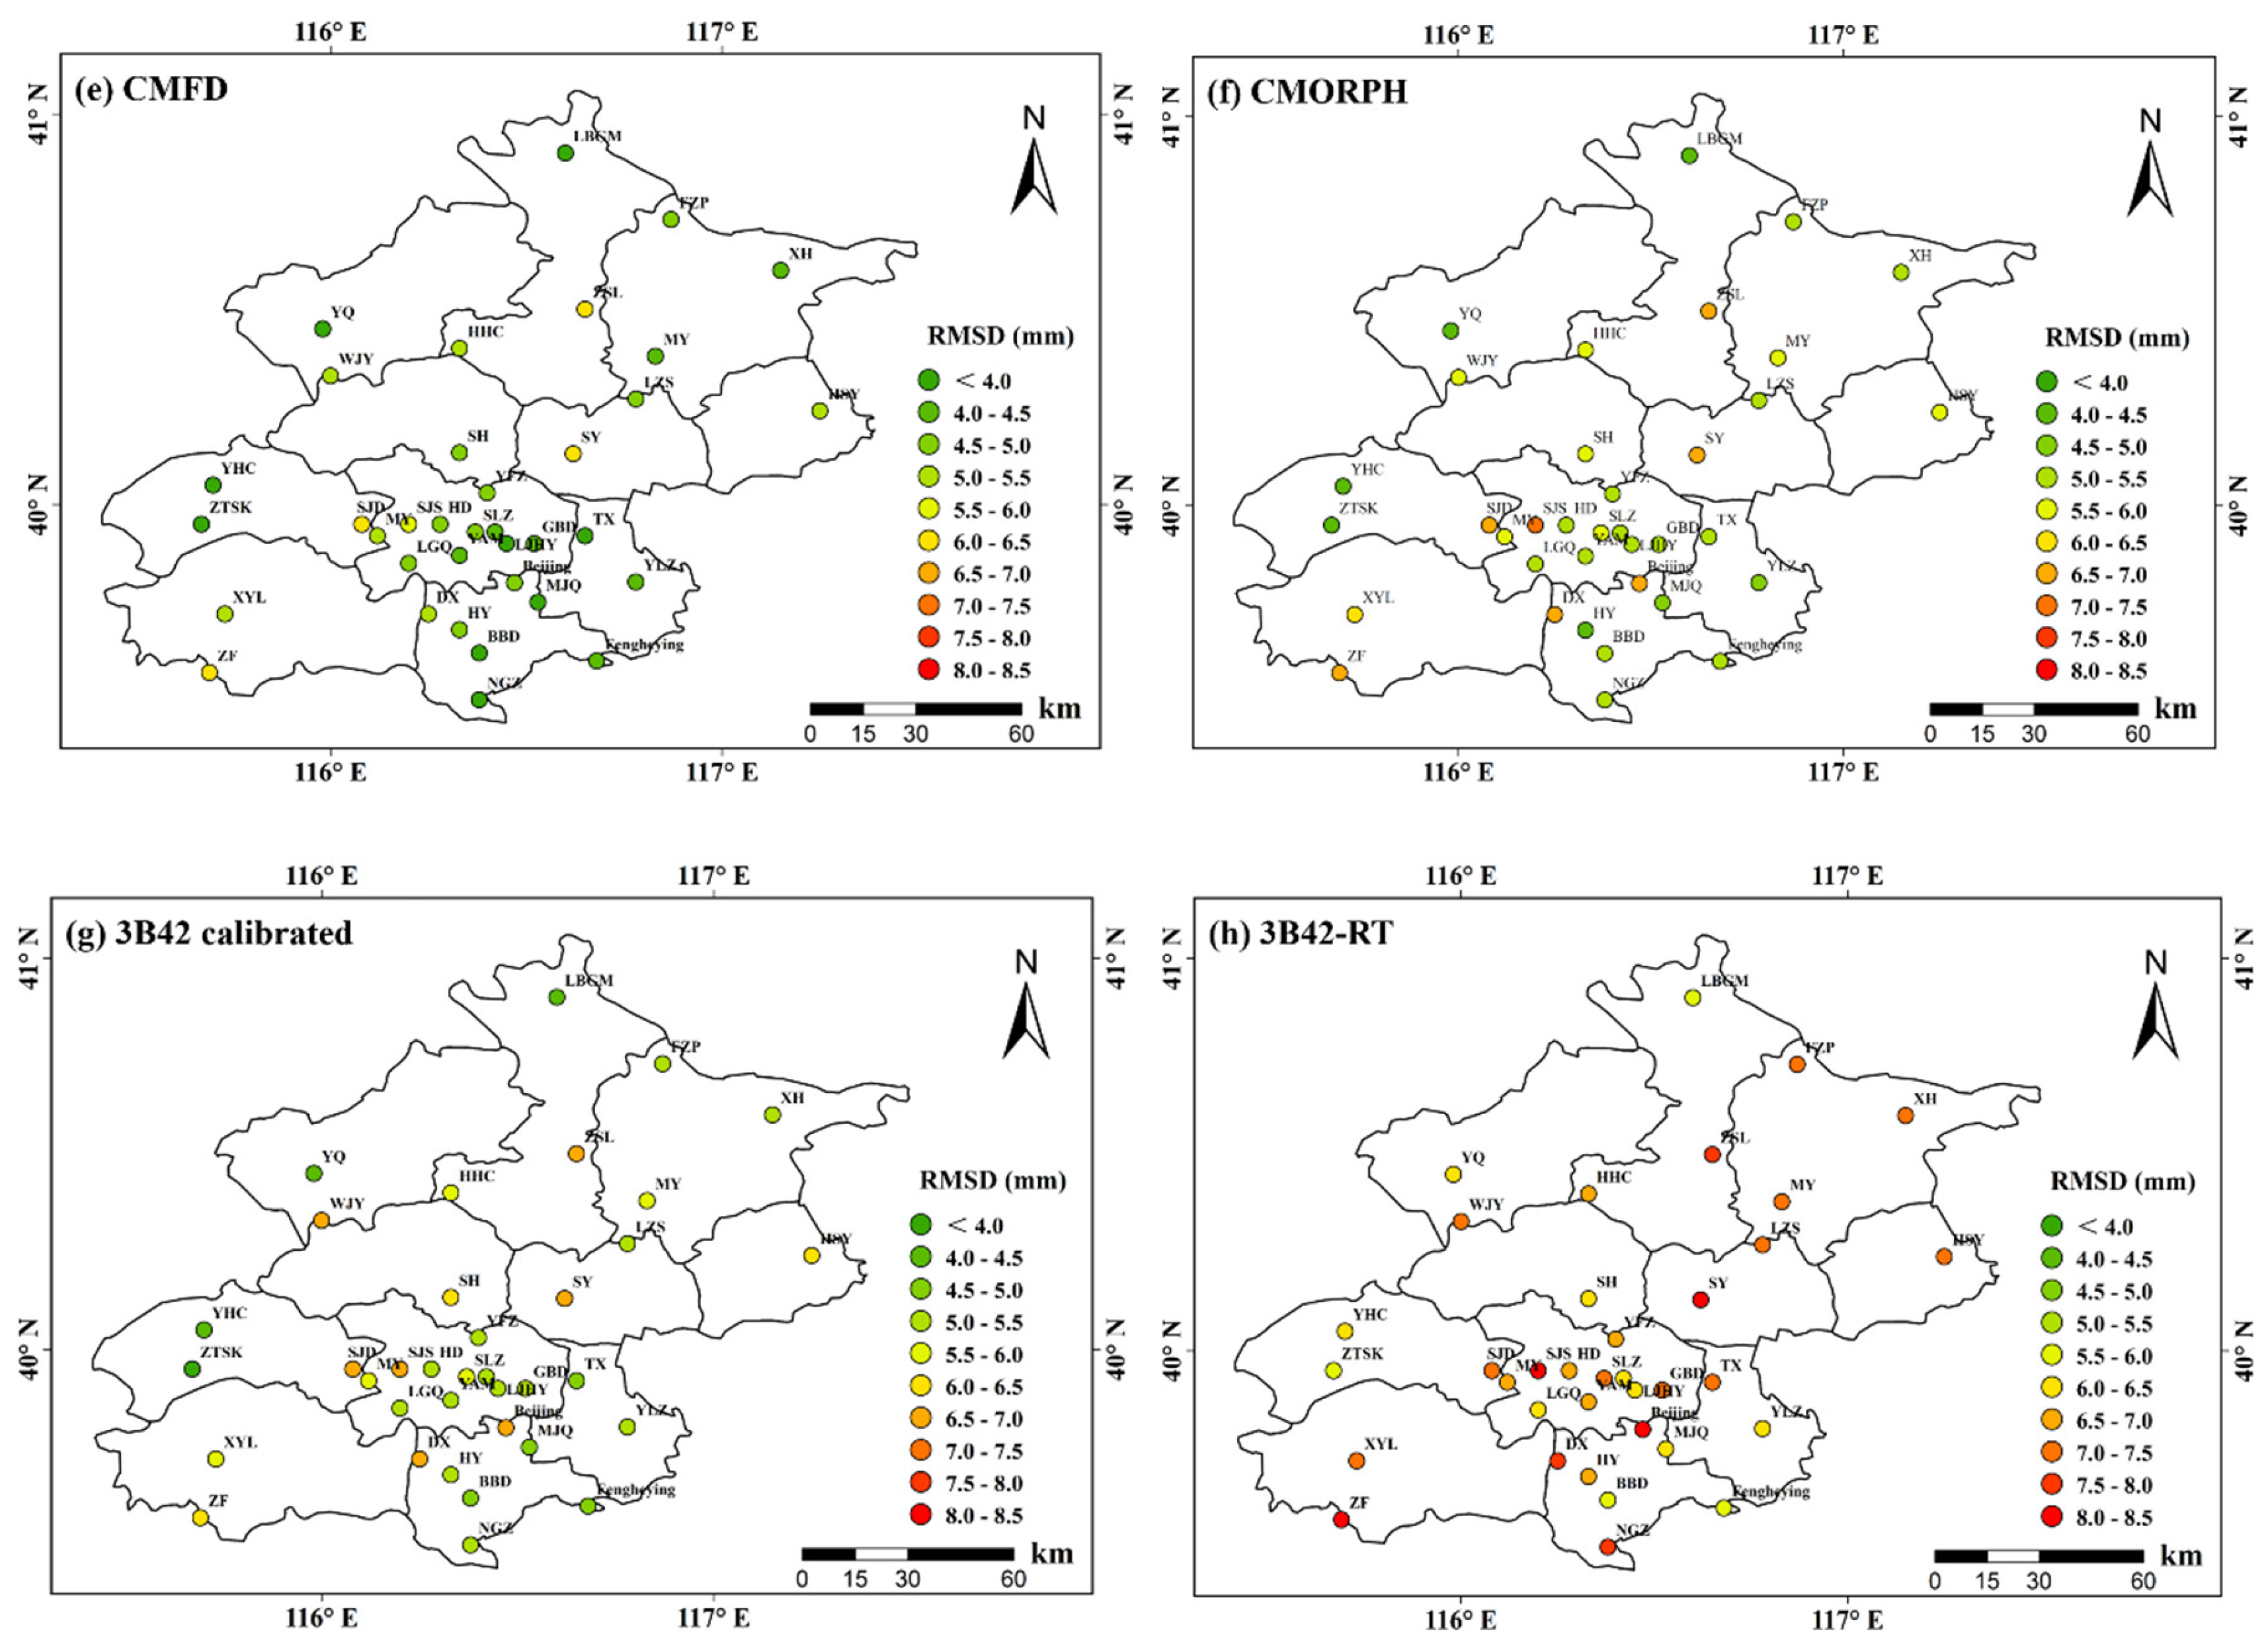
4.1. Daily Variation

The performance of the four satellite precipitation products was compared at daily intervals. The average, minimum, and maximum values of the statistical metrics for all four satellite precipitation products indicate how they compared with ground observations on a daily scale, as shown in Table 3. The CMFD had the highest value of CC and the lowest values of RMSD and MAD, with average CC, RMSD, and MAD values for all 36 stations of 0.70, 4.64 mm, and 1.19 mm, respectively, followed by the CMORPH and 3B42 calibrated datasets. Meanwhile, the 3B42-RT dataset presented the lowest value of CC and the highest values of RMSD, MAD, and RBS. Moreover, the CMFD had the smallest SD values of the CC, MAD, and RBS compared with the other three satellite precipitation products. The variation in statistical metrics for each product are shown in Figure 2. The spatial distributions of CC and RMSD (as examples) of all four satellite-derived precipitation datasets are shown in Figure 3. Clearly, the performance of the CMFD was better than the other three datasets, meanwhile, the CMFD was more stable than the other three satellite precipitation products.
The detection ability of all four satellite precipitation products, evaluated using average, minimum, and maximum values of the categorical metrics at 36 stations, is shown in Table 4. The CMFD had the largest average values of POD and CSI, and the lowest average value of FAR, with average POD, CSI, and FAR values of 0.97, 0.64, and 0.34, followed by the CMORPH data with average values of 0.87, 0.55, and 0.40. TMPA datasets (both 3B42 calibrated and 3B42-RT) had the lowest detection success. The distribution of POD, FAR, and CSI for all four satellite precipitation products are shown in Figure 4. The detection success of the CMFD was also more stable than all other datasets.

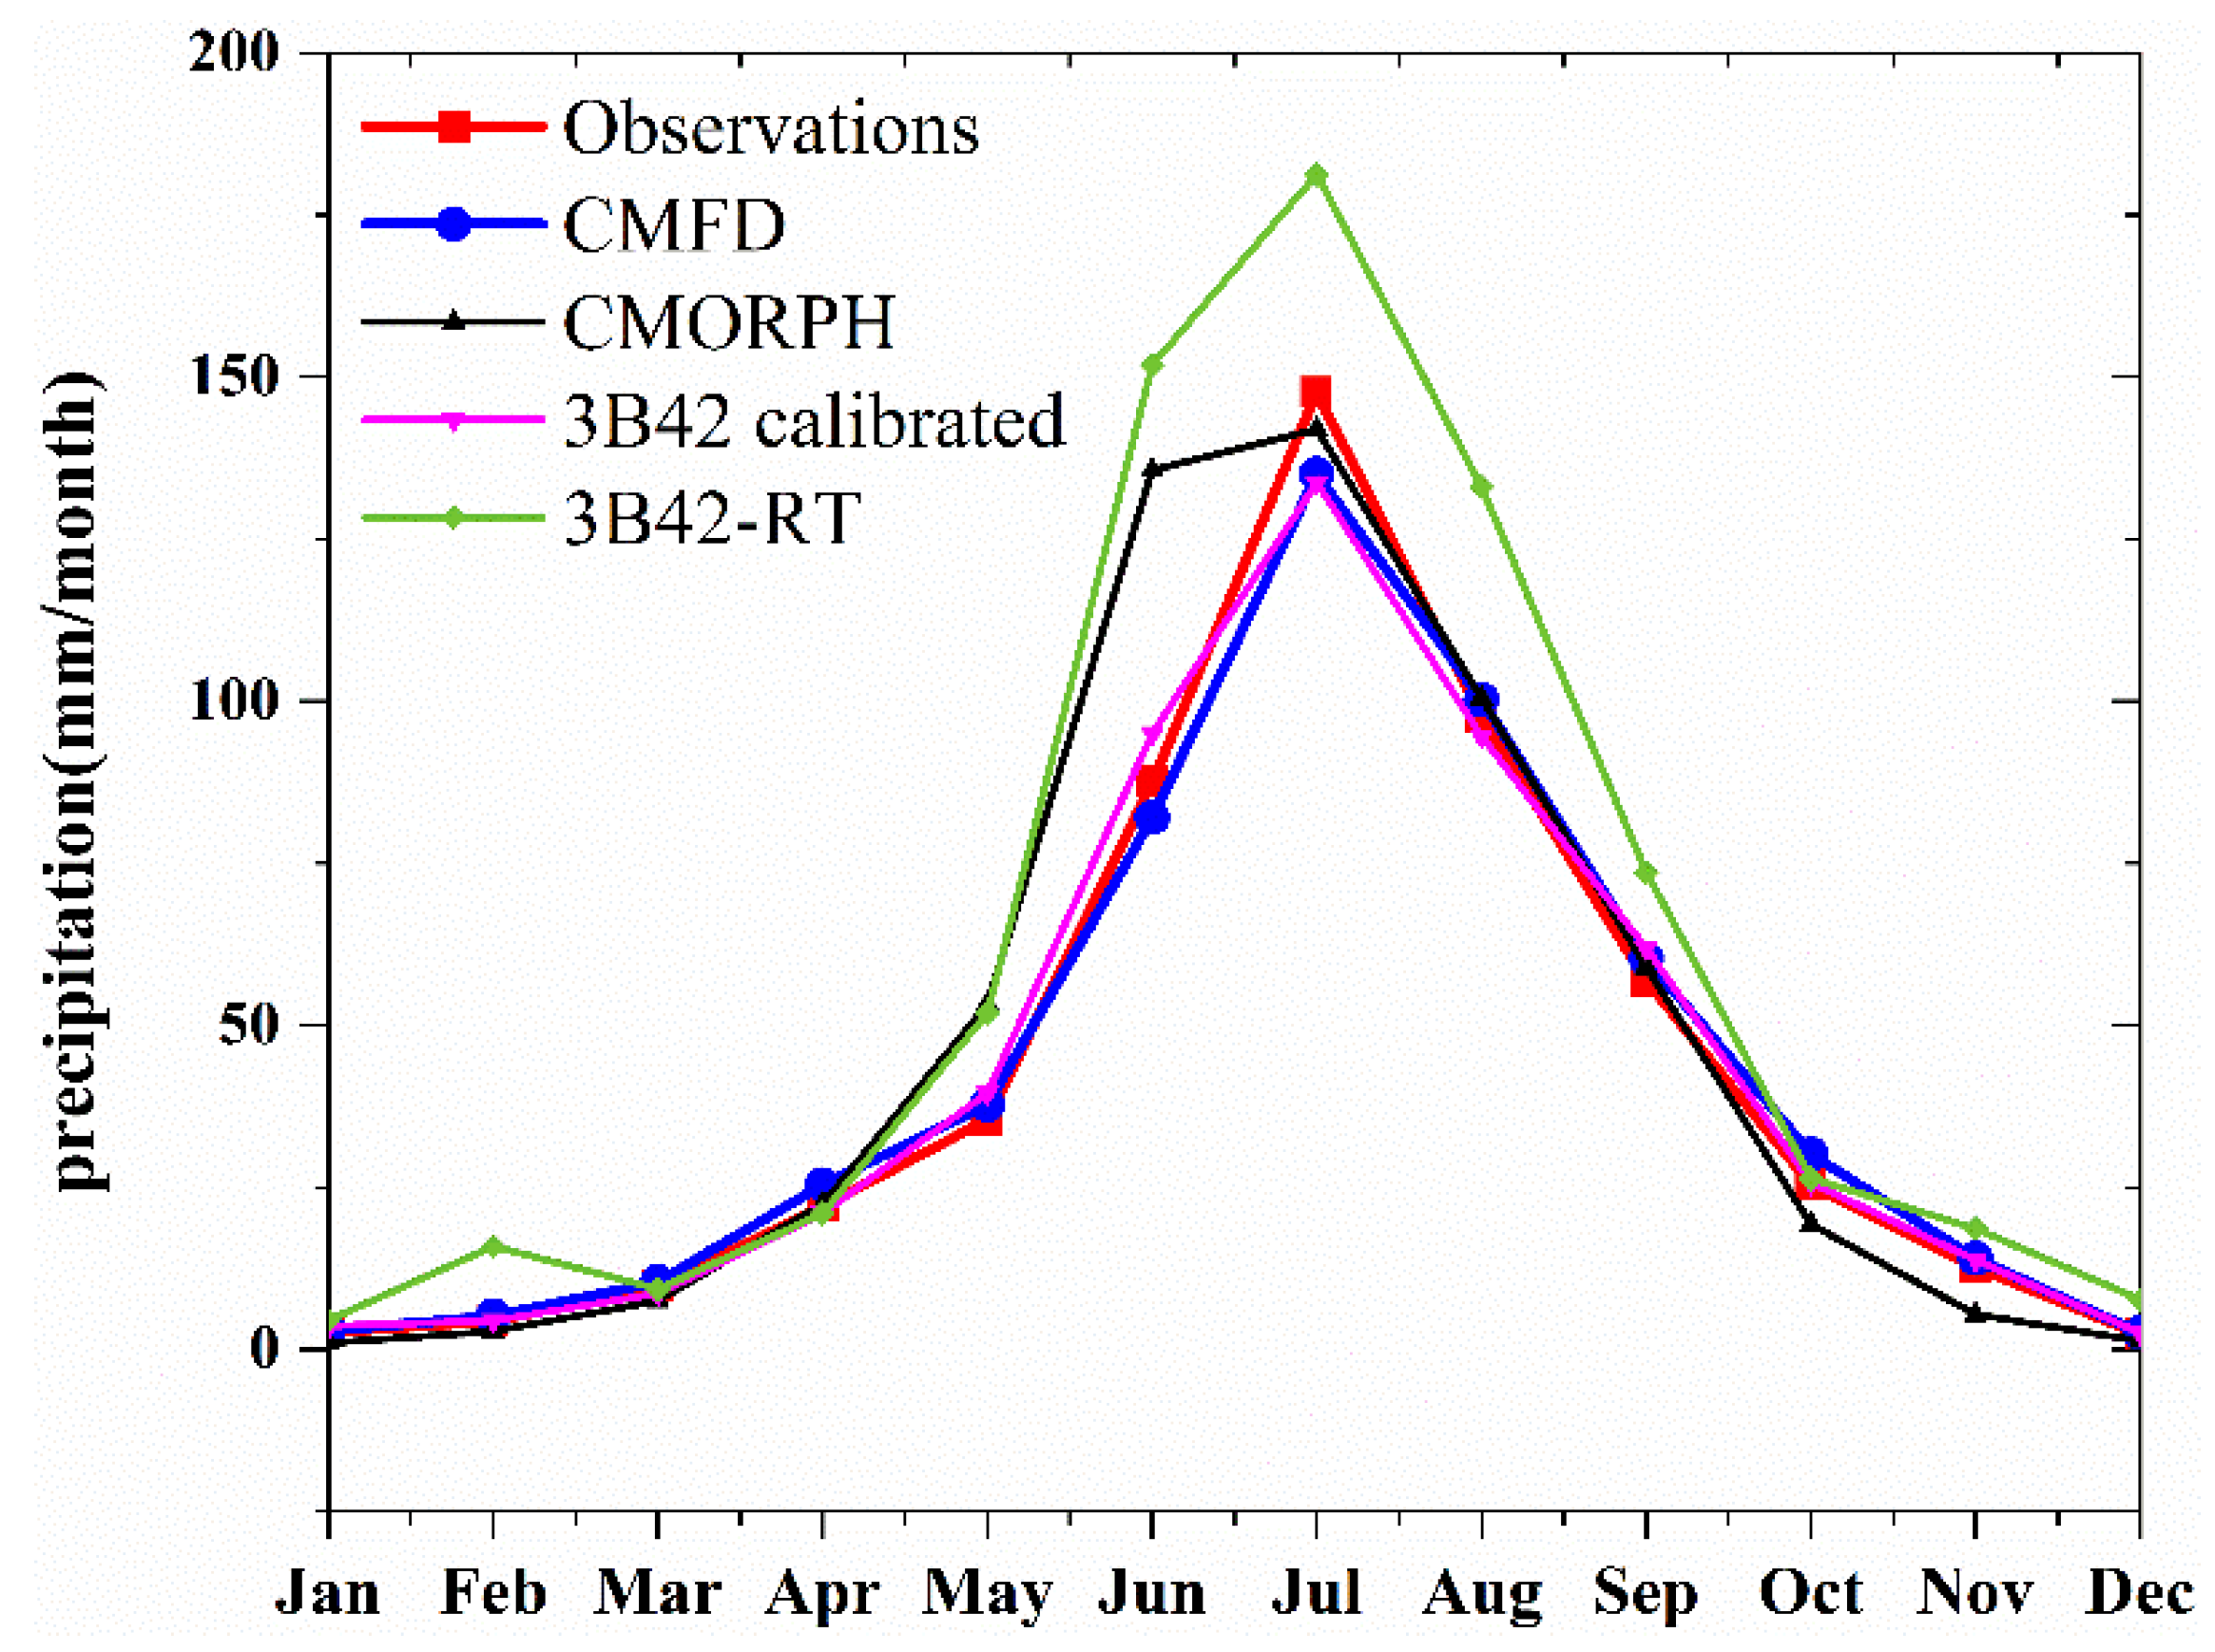
4.2. Monthly Variation

Evaluation of satellite detection of precipitation on a monthly scale was examined for individual months, and two hydrological periods, defined as the flood season (June–September) and non-flood season (October–May) of the monsoon climate. The average statistical metrics for monthly precipitation for individual months and for both hydrological periods during the study period (2001–2015) are shown in Table 5. The variation in average monthly precipitation values between ground observations and the four satellite precipitation products is shown in Figure 5.
The performance of the CMFD was better than the other three datasets, with average CC, RMSD, MAD, and RBS values at monthly intervals of 0.78, 17.99 mm, 13.57 mm, and −10.38%, followed by the 3B42 calibrated dataset, with average CC, RMSD, MAD, and RBS values of 0.74, 17.98 mm, 13.65 mm, and −8.60%. For the flood season, both CMFD and the 3B42 calibrated dataset had relatively high accuracy, with average CC, RMSD, MAD, and RBS values of 0.67, 38.46 mm, 29.80 mm, and 0.12%, and 0.69, 37.78 mm, 29.28 mm, and −2.79%, respectively. For the non-flood season, the CMFD was more accurate than the other precipitation datasets, with the CC, RMSD, MAD, and RBS values of 0.84, 7.76 mm, 5.47 mm, and −15.62%. Moreover, the CMORPH dataset presented the lowest value of CC at monthly scales, despite its reasonable performance at daily scales. As shown in Figure 5, the CMFD and the 3B42 calibrated dataset showed slight overestimation during the non-flood season but underestimation during the flood season, while the CMORPH data produced large overestimation in June and underestimation from September to December, and the 3B42-RT dataset produced overestimation in all months.
Generally, the four satellite products captured the temporal trend in monthly precipitation reasonably well. The CMFD had the best performance, especially in non-flood seasons. The 3B42 calibrated dataset also exhibited reasonable accuracy, compared with the CMORPH and 3B42-RT datasets.

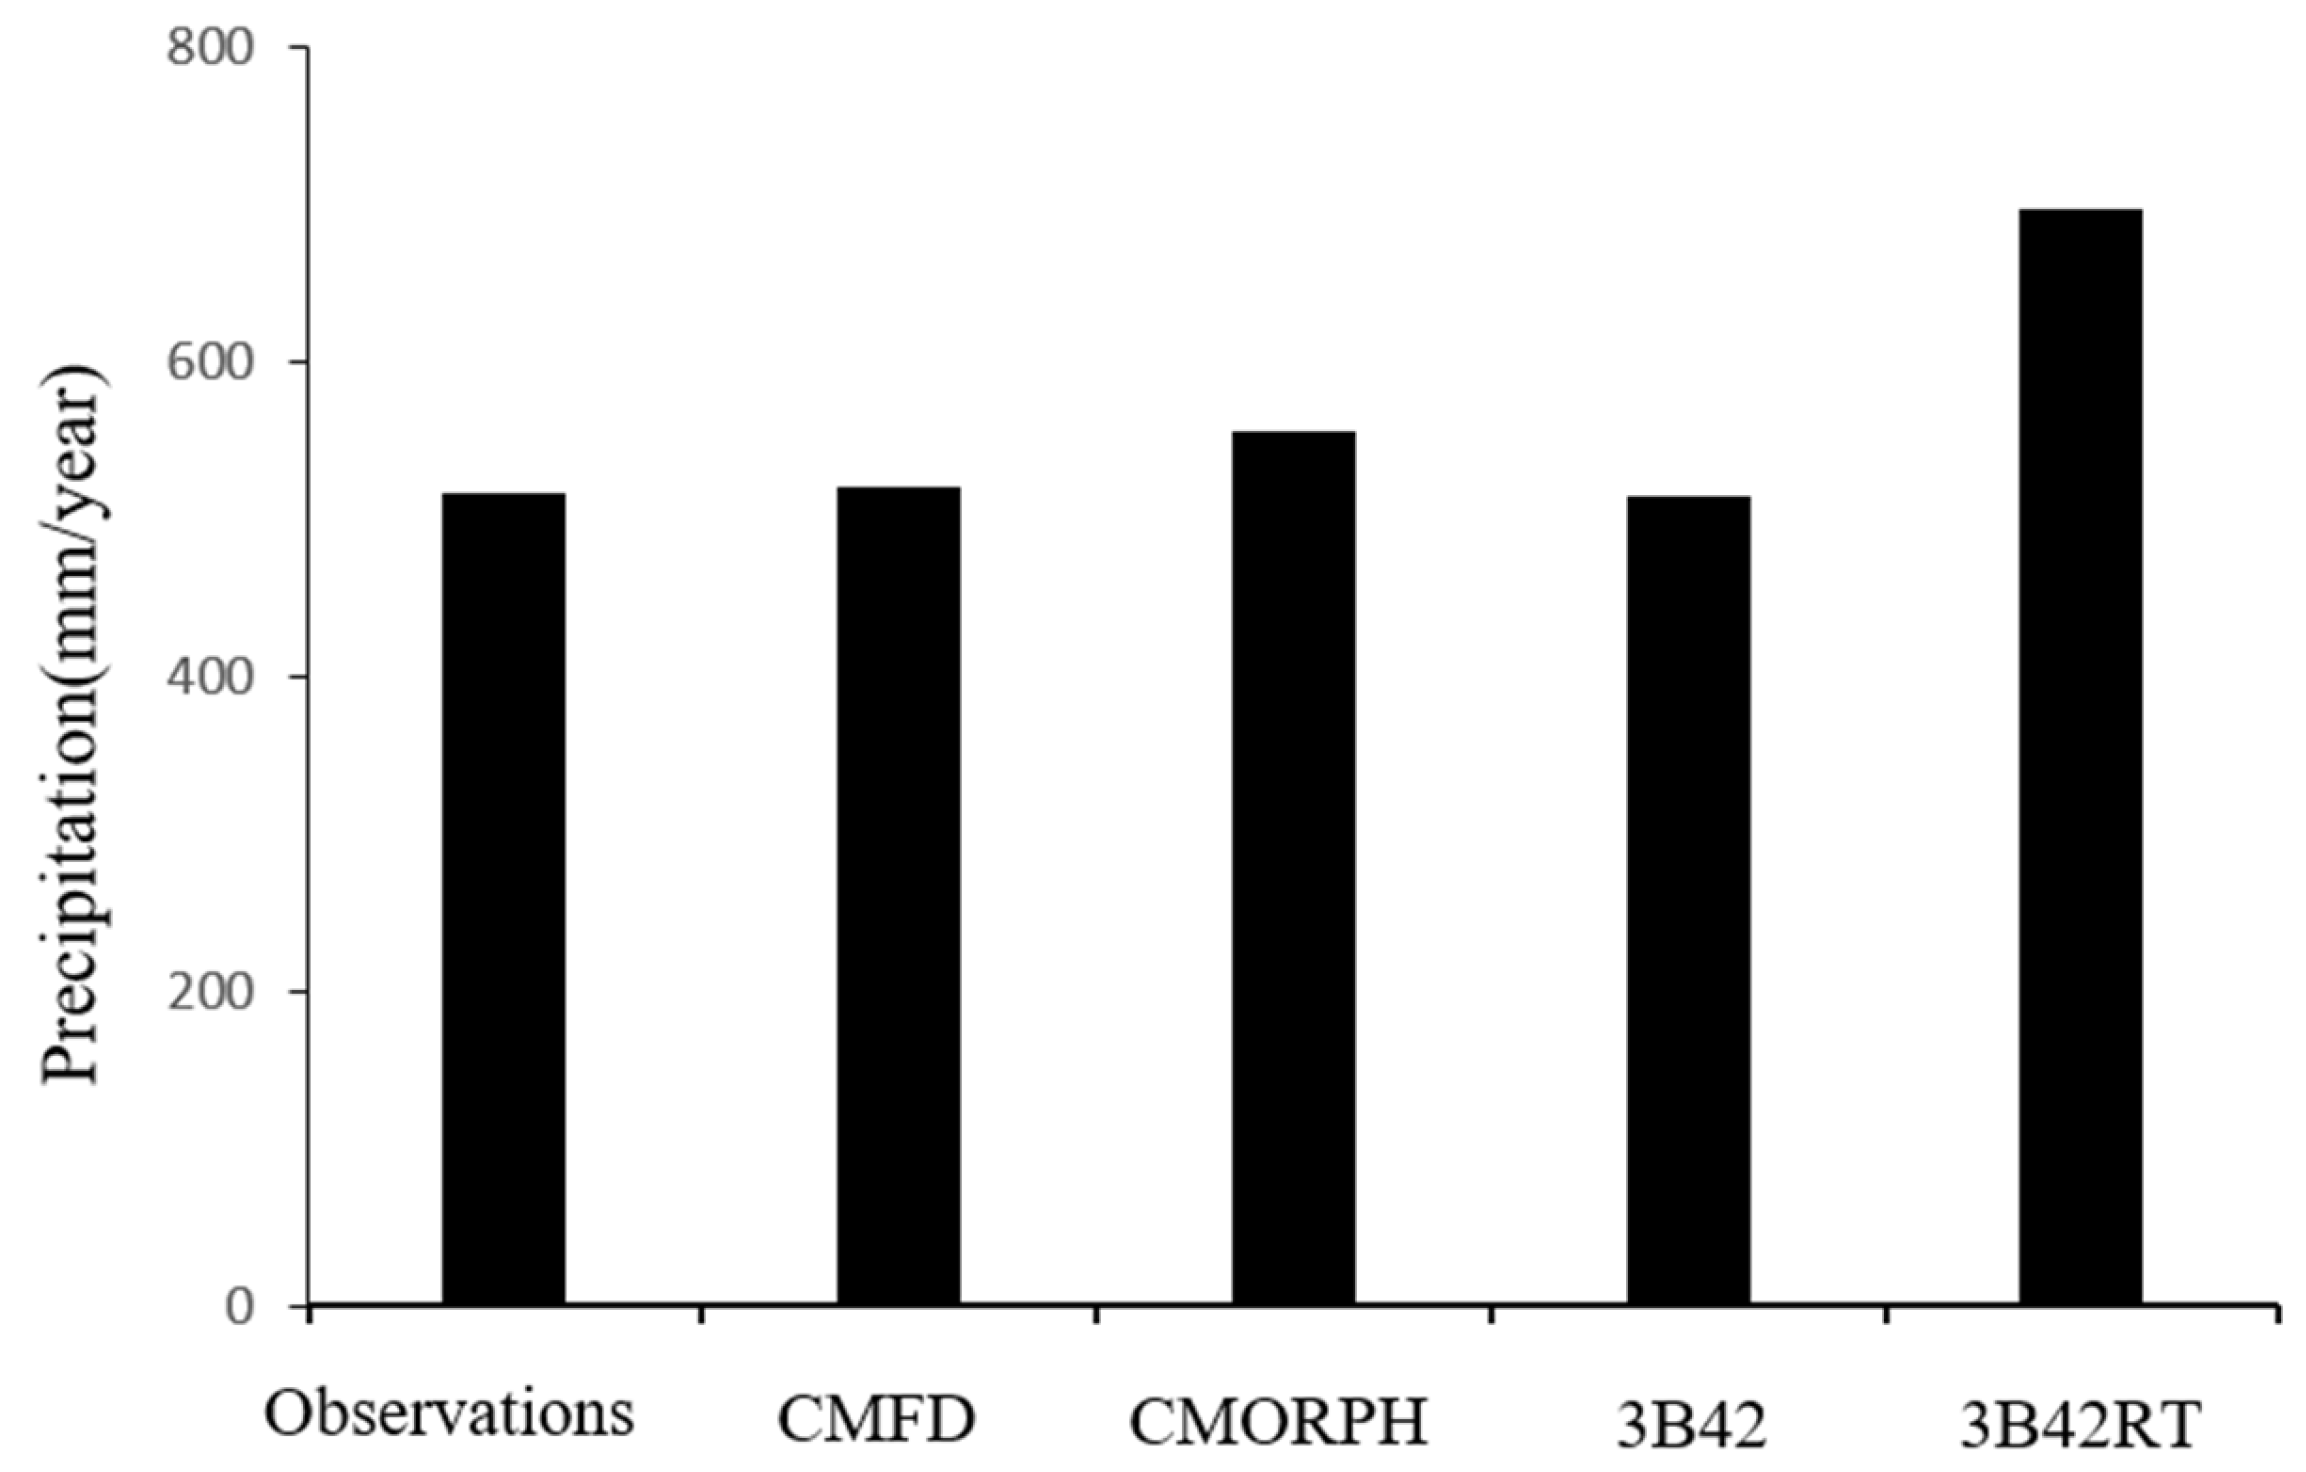
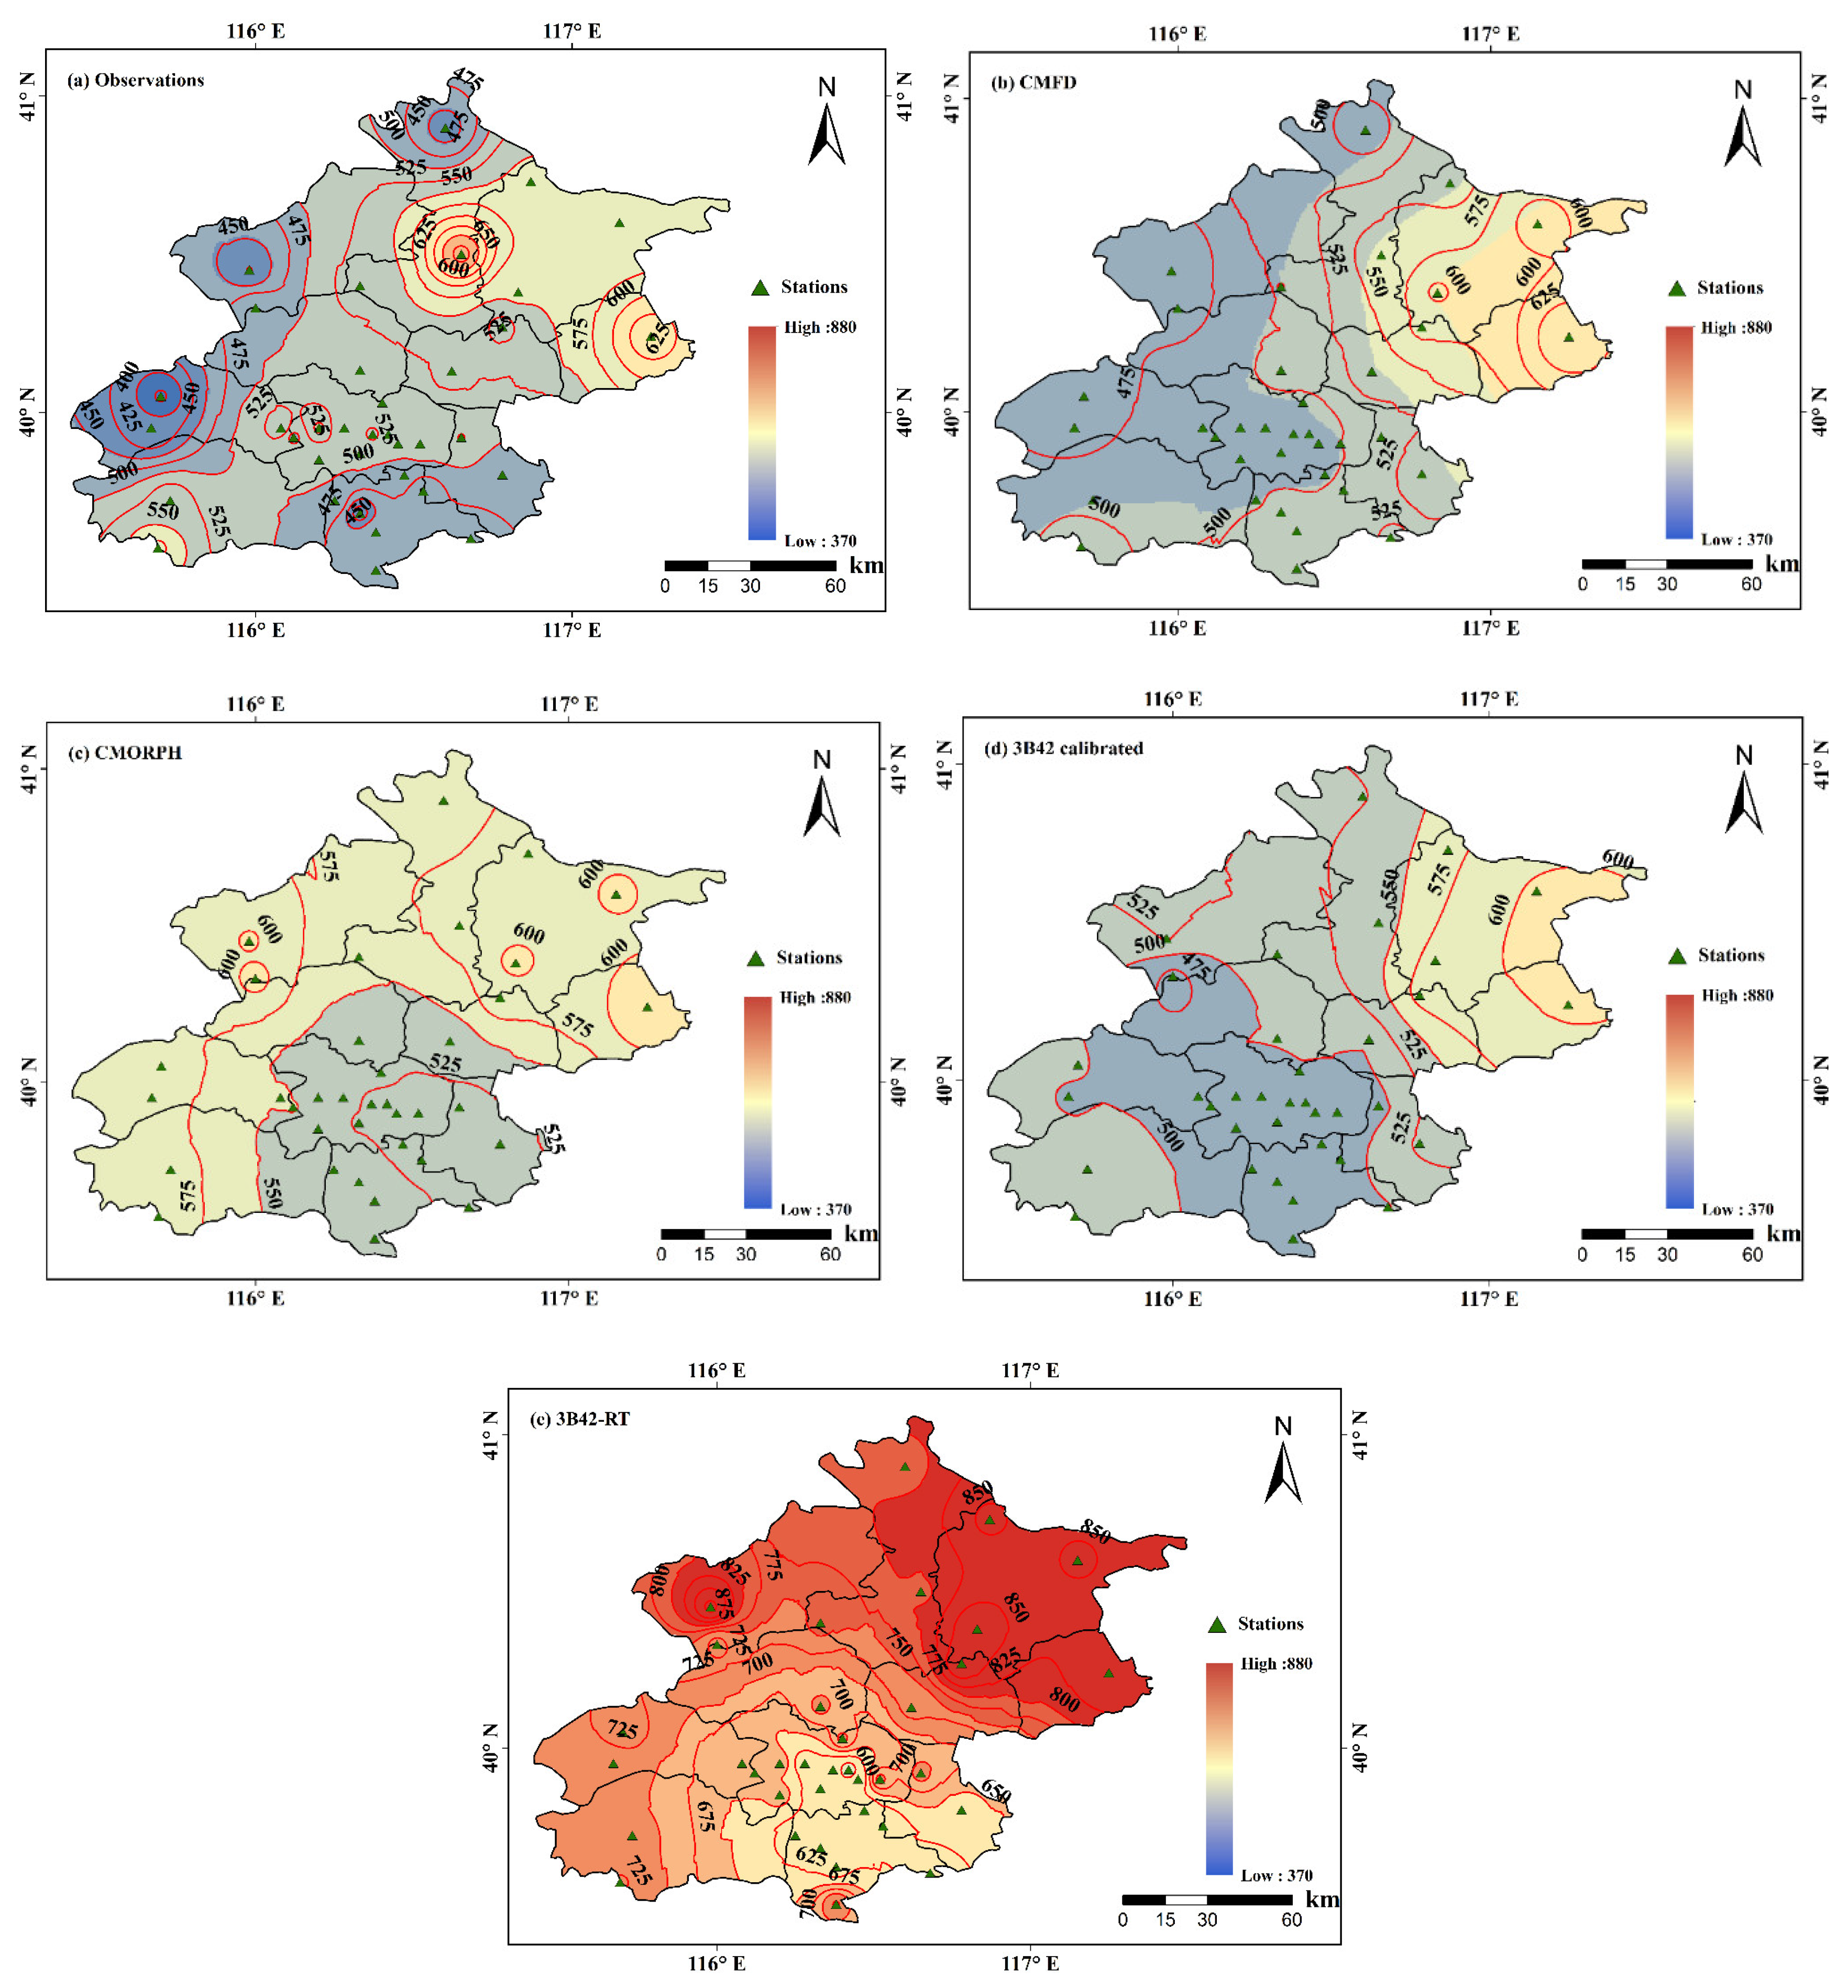
4.3. Annual Variation

The values of average annual precipitation calculated from ground observations varied from 372.1 to 682.9 mm/year at different stations, with an average annual precipitation at these 36 stations of 508.8 mm/year. The average annual precipitation at these 36 stations for the period 2001–2015, based on (a) ground observations, (b) CMFD, (c) CMORPH, (d) 3B42 calibrated, and (e) 3B42-RT are given in Figure 6. The annual differences between ground observations and each satellite precipitation dataset from 2001 to 2015 are shown in Figure 7.
All satellite precipitation data showed an upward trend from 2001 to 2015, which is consistent with the trend in ground observations. Both CMFD and the 3B42 calibrated dataset had almost the same values as ground observations. In contrast, CMORPH data overestimated values by up to 7.8% of the total precipitation amount. The 3B42-RT dataset also showed significant overestimation by values up to 35.2% of the total precipitation amount, causing this dataset to have the worst performance over the study period.
The spatial distributions of the average annual precipitation over Beijing for ground observations and the four satellite precipitation products, obtained using the ordinary Kriging interpolation method, are shown in Figure 8. The spatial distribution of annual precipitation based on ground observations showed that more precipitation occurred in the northeastern areas, with lower annual precipitation in western areas and southern suburban regions. It reveals that precipitation in the plain areas is greater than in the mountain areas over Beijing, which was concluded by Song et al. and Zhai et al. [55]. This is partially because the topography of Beijing is surrounded by mountains from the southwest to the northeast, and the land-ocean boundary is located to its east [56]. All satellite precipitation products captured higher annual precipitation in the northeast regions, the CMFD, CMORPH, and 3B42 calibrated products showed lower precipitation in southern regions, and the CMFD and TMPA datasets (both 3B42 calibrated and 3B42-RT) presented lower precipitation in the western mountain areas. In contrast, the CMORPH product showed more precipitation in western regions, which were quite different from the observations.
Generally, the CMFD and the 3B42 calibrated dataset showed almost the same value as the observations, while the CMORPH and 3B42-RT dataset showed an overestimation of the annual precipitation from 2001–2015. For the spatial distribution of the four satellite precipitation datasets, although four satellite precipitation products captured the trend of more precipitation in the northeastern regions, all satellite precipitation products showed a different distribution from the observations.

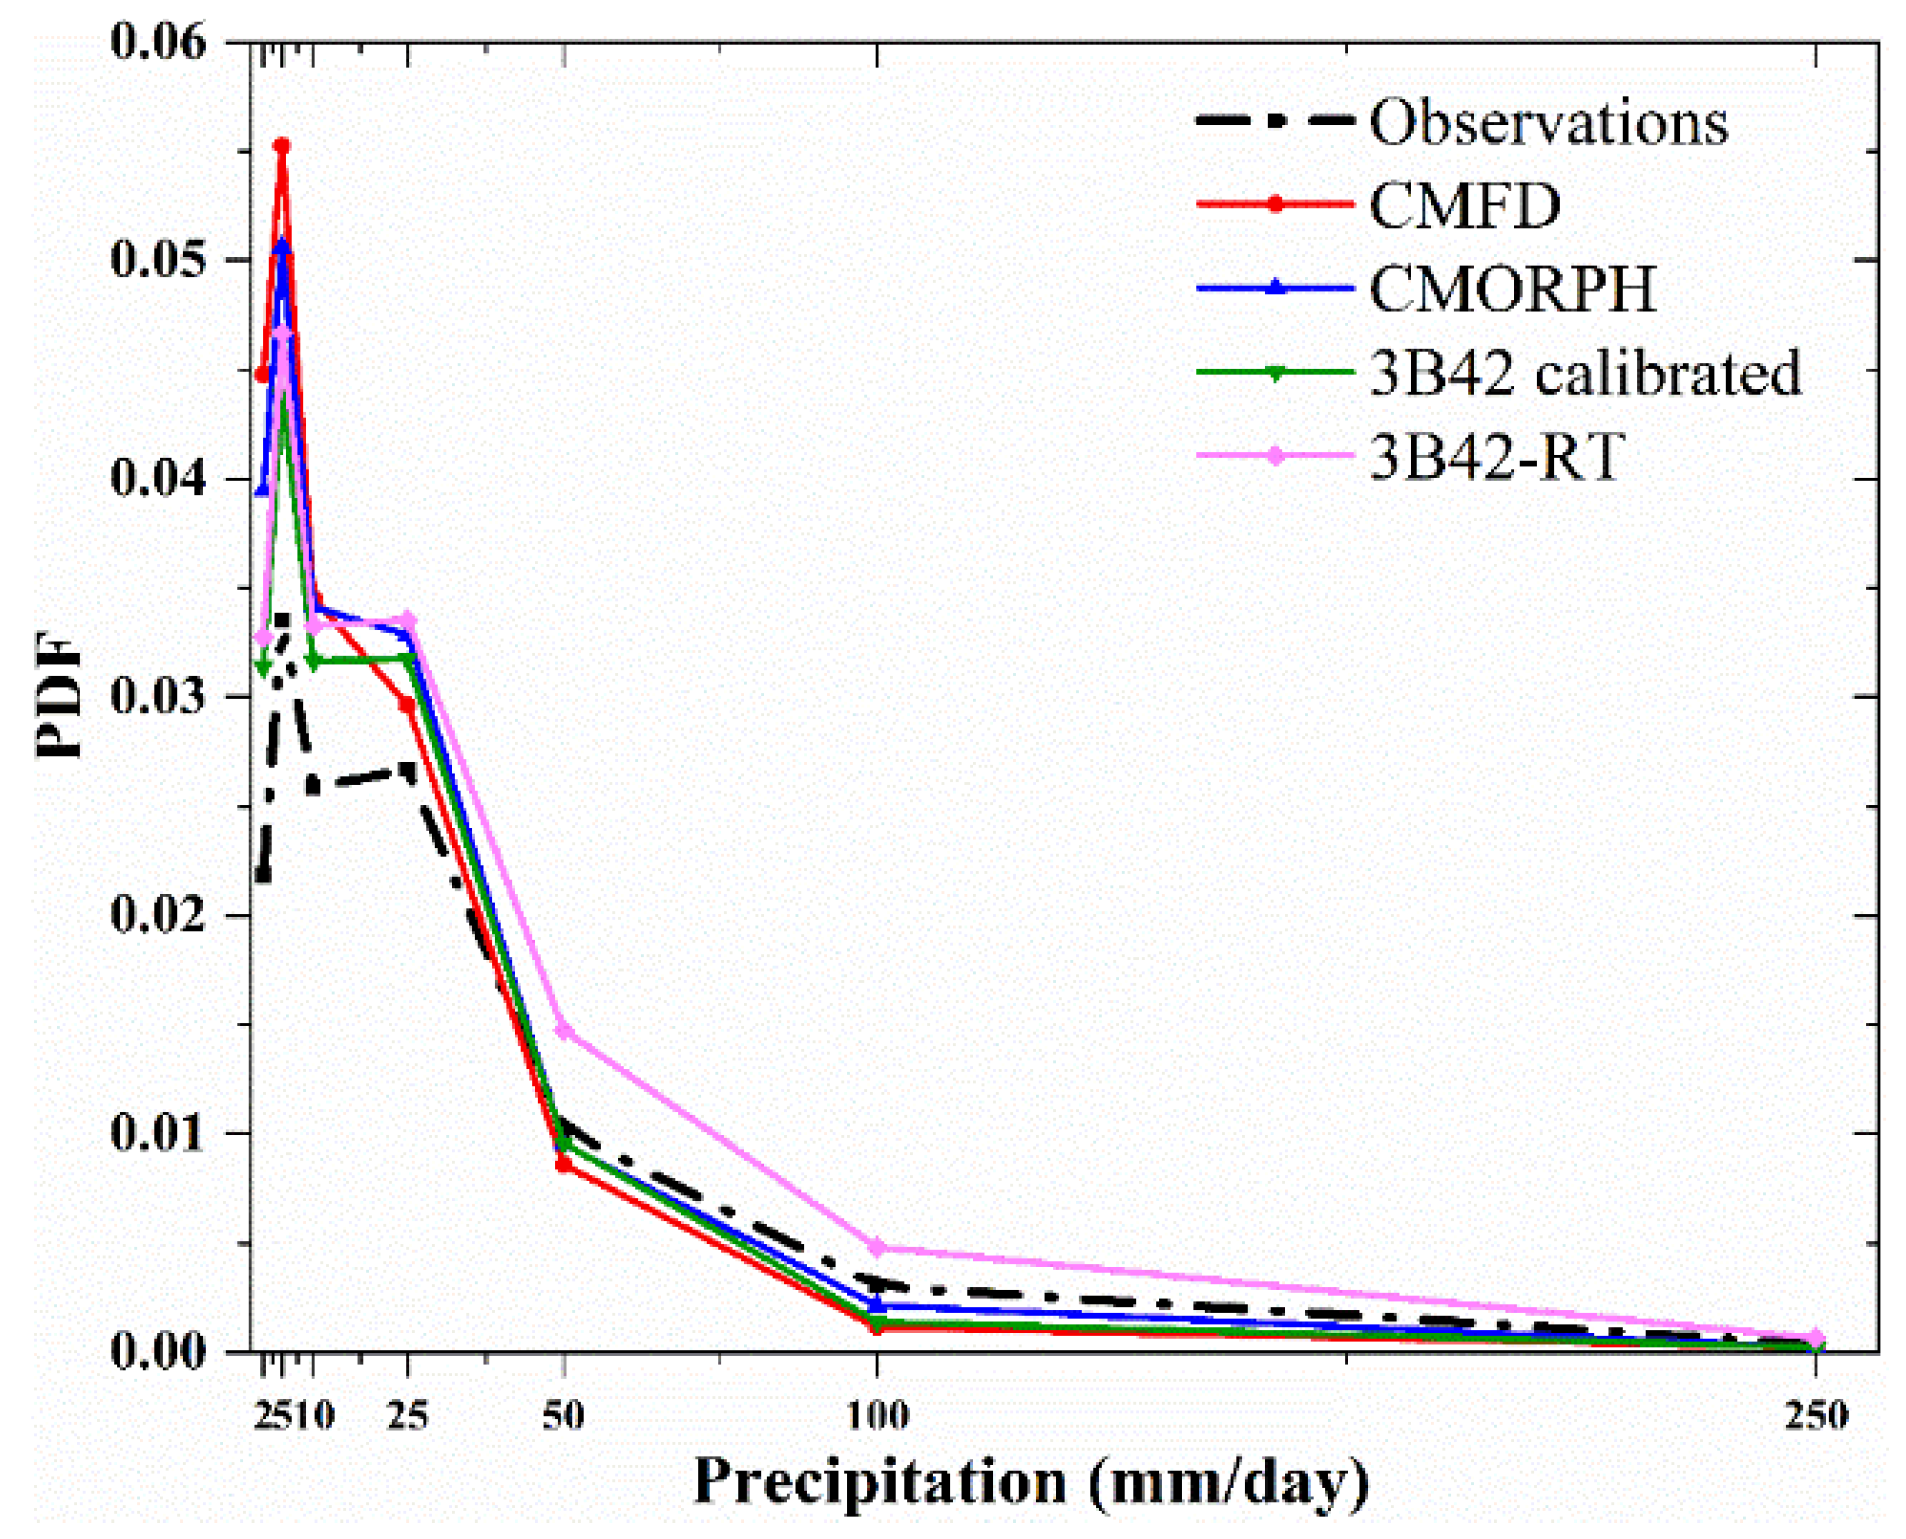
4.4. Precipitation Intensity

Percentages of days with slight precipitation (P < 10 mm/day), moderate precipitation (10 mm/day < P ≤ 25 mm/day), heavy precipitation (25 mm/day < P ≤ 50 mm/day), and extreme heavy precipitation (P > 50 mm/day) accounted for 13%, 2.7%, 1.0%, and 0.3% of the study period, based on the ground observations, as shown in Figure 9. All satellite products capture more precipitating events than the reference dataset for slight and moderate precipitation. However, with the exception of 3B42-RT, all the satellite precipitation products detected less heavy and extreme precipitation events than the ground measurements in the range of P ≥ 50 mm. The CMFD dataset gave the highest number of days with slight precipitation. The number of days with moderate precipitation derived from CMFD, CMORPH, and 3B42 calibrated data were 11.13%, 23.17%, and 18.94% higher than the observed data. Likewise, the number of days with heavy precipitation derived from CMFD, CMORPH, and 3B42 calibrated data were 15.59%, 6.52%, and 5.97% less than the observed data, while days with extreme heavy precipitation derived from CMFD, CMORPH, and 3B42 calibrated data were 62.13%, 29.08%, and 53.9% less than observations. In contrast, the 3B42-RT dataset showed overestimation of all precipitation events.

5. Discussion

Our assessment suggests that the CMFD dataset performed better than the CMORPH, 3B42 calibrated, and 3B42-RT datasets at all temporal scales. The performance of the CMFD and 3B42 calibrated datasets were better than the CMORPH and 3B42-RT datasets at monthly and yearly scales. The 3B42 calibrated dataset was integrated into the CMFD dataset as the background field for the precipitation analysis, which means the occurrence of a precipitation event in the CMFD product was determined by the 3B42 calibrated dataset, however, the 3B42 calibrated dataset provides relative few data north of 40° N. The GLDAS precipitation dataset was used as the background field in this region [57,58]. The performance of CMFD was better than the 3B42 calibrated data, which may be attributed to the performance of the GLDAS dataset and the integration of the conventional meteorological observations from the China Meteorological Administration into the CMFD dataset. For the TMPA products, including 3B42 calibrated and 3B42-RT data, the performance of the 3B42 calibrated data was better than the 3B42-RT product, which may be attributed to the 3B42-RT product not having been adjusted using ground observations.
The climate conditions, topography, and urbanization may have a great influence on the spatial distribution of precipitation in Beijing [39]. Previous studies reveal that the topographic elevation influences precipitation, although there is a unique relationship between elevation and precipitation in each place [59,60]. The relationship between the station elevation and annual precipitation in Beijing is shown in Figure 10, with the regression line shown for observations and four satellite precipitation datasets. The observations showed that station elevation is slightly negatively correlated with annual precipitation. The same slightly negative correlation was present between the station elevation and the CMFD dataset, while the CMORPH and TMPA datasets (both 3B42 calibrated and 3B42-RT) presented a slightly positive correlation with the station elevation.
Four satellite precipitation datasets showed overestimation of daily precipitation, with average RBS values of −2.06%, −10.55%, −1.41%, and −38.69%. These results may be explained by the precipitation intensity assessment, although CMFD, CMORPH, and 3B42 calibrated data underestimate the heavy and extreme heavy precipitation events, the slight overestimation of CMFD, CMORPH, and 3B42 calibrated data are related to overestimation in light to moderate precipitation events, while the 3B42-RT dataset showed overestimation of all precipitation events, which is also concluded by Qin et al. and Shen et al. [32,35]. The CMFD and the 3B42 calibrated datasets underestimated precipitation during flood seasons and overestimated it during non-flood seasons. This indicates that heavy precipitation volumes are too low in flood seasons, but moderate precipitation volumes are too high in non-flood season, when estimated using CMFD and 3B42 calibrated data, which can cause great differences for the various applications, such as runoff simulation, flood forecasting, etc. Generally, the satellite precipitation data were not sensitive to extreme precipitation events, which is consistent with the findings of Ebrahimi et al. [61]. Urban floods, landslides, and extreme drought disasters caused by the extreme precipitation are posing a threat to the safety of regional society and economy [62,63]. Accurate prediction of extreme precipitation has great significance to human society and ecological environment. Assessment of the satellite precipitation products reveals that there is a large space for improvement in prediction of extreme precipitation for all four satellite precipitation products evaluated in this study.
There are some uncertainties and shortcomings in this study due to the different scales between the satellite precipitation products and reference observations. The satellite precipitation products are the gridded precipitation data, and the observations are the station precipitation data. The satellite precipitation datasets were interpolated to each station using bilinear interpolation in order to match the scale of the ground observations in this study. Although fine resolution satellite precipitation products can be produced through spatial interpolation techniques which are widely used to produce continuous precipitation surfaces, for complex regions the precipitation pattern is greatly affected by altitude. Therefore, using downscaling techniques with emphasis on topography will increase the accuracy of satellite precipitation in small scales. Moreover, it is needed to evaluate the performance of CMFD with other latest satellite precipitation products, such as IMERG.

6. Conclusions

In this study, we comprehensively assessed four satellite precipitation products, i.e., the CMFD, CMORPH, as well as 3B42 calibrated and 3B42-RT, evaluating their estimates against ground observations from 36 meteorological stations measuring precipitation in Beijing. We compared daily, monthly, and annual precipitation data for the Beijing region.
We found that all four satellite precipitation products captured temporal patterns of precipitation for the period 2001–2015 over Beijing. For the spatial distribution of the four satellite precipitation datasets, although four satellite precipitation products captured the trend of more precipitation in the northeastern regions, all four satellite precipitation products presented different distributions from the observations. Although all satellite precipitation products captured the distribution of precipitation events during the study period, all four products overestimated moderate precipitation events but underestimated extreme precipitation events, except for the 3B42-RT dataset, which overestimated all precipitation events. Specifically, the CMFD performed better than the CMORPH, 3B42 calibrated, and 3B42-RT datasets, having the higher correlation coefficient and lower values of RMSD and MAD at all temporal scales. The average CC of the CMFD, CMORPH, 3B42 calibrated, and 3B42-RT products for all 36 stations were 0.70, 0.60, 0.59, and 0.54 for daily precipitation, and 0.78, 0.32, 0.74, and 0.44 for monthly precipitation. By contrast, the 3B42-RT product showed consistent overestimation of precipitation. Overall, the CMFD data proved to be most suitable for Beijing city.

Author Contributions

M.R. and J.L. designed the technical routes of the study; M.R. analyzed the data and wrote the manuscript; Z.X., B.P. and W.L. proposed suggestions to improve the quality of the paper; L.D. and R.W. provided the observation data.

Funding

This work was financially supported by the National Key R&D Program of China (2017YFC1502701) and the Key Research Projects “Sponge city construction and urban flooding/waterlogging disaster in the sub-center of Beijing City” (Z171100002217080).

Acknowledgments

The authors thank the Beijing Hydrology Bureau and the National Climate Centre of China for providing the ground observation data. We also thank Trudi Semeniuk from Liwen Bianji, Edanz Editing China (www.liwenbianji.cn/ac), for editing the English text of a draft of this manuscript.

Conflicts of Interest

The authors declare no conflict of interest.

References

  1. Hou, A.Y.; Kakar, R.K.; Neeck, S.; Azarbarzin, A.A.; Kummerow, C.D.; Kojima, M.; Oki, R.; Nakamura, K.; Iguchi, T. The global precipitation measurement mission. Bull. Am. Meteorol. Soc. 2013, 95, 701–722. [Google Scholar] [CrossRef]
  2. Liao, R.W.; Zhang, D.B.; Shen, Y. Validation of six satellite-derived rainfall estimates over China. Meteorol. Mon. 2015, 41, 970–979. (In Chinese) [Google Scholar]
  3. Liu, Y.B.; Fu, Q.N.; Song, P.; Dou, C.C. Satellite retrieval of precipitation: An overview. Adv. Earth Sci. 2011, 26, 1162–1172. (In Chinese) [Google Scholar]
  4. IPCC. Climate Change 2013: The Physical Science Basic Contribution of Working Group 7 to the Fifth Assessment Report of the Intergovernmental Panel on Climate Change; Cambridge University Press: Cambridge, UK; New York, NY, USA, 2013. [Google Scholar]
  5. Zhang, Y.Q.; You, Q.L.; Chen, C.C.; Ge, J. Impacts of climate change on streamflows under RCP scenarios: A case study in Xin River Basin, China. Atmos. Res. 2016, 178–179, 521–534. [Google Scholar] [CrossRef]
  6. O’Reilly, C.M.; Sharma, S.; Gray, D.K.; Hampton, S.E.; Read, J.S.; Rowley, R.J.; Schneider, P.; Lenters, J.D.; McIntyre, P.B.; Kraemer, B.M.; et al. Rapid and highly variable warming of lake surface waters around the globe. Geophys. Res. Lett. 2015, 42, 10773–10781. [Google Scholar] [CrossRef]
  7. Wololway, R.I.; Merchant, C.J. Amplified surface temperature response of cold, deep lakes to inter-annual air temperature variability. Sci. Rep. 2017, 7, 4130. [Google Scholar] [CrossRef]
  8. Sakalli, A. Sea surface temperature change in the Mediterranean Sea under climate change: A linear model for simulation of the sea surface temperature up to 2100. Appl. Ecol. Environ. Res. 2017, 15, 707–716. [Google Scholar] [CrossRef]
  9. Dore, M.H.I. Climate change and changes in global precipitation patterns: What do we know? Environ. Int. 2005, 31, 1167–1181. [Google Scholar] [CrossRef] [PubMed]
  10. Jones, P.D.; Hulme, M. Calculation regional climatic time series for temperature and precipitation: Methods and illustrations. Int. J. Climatol. 1996, 16, 361–377. [Google Scholar] [CrossRef]
  11. Hulme, M.; Osborn, T.J.; Johns, T.C. Precipitation sensitivity to global warming: Comparison of observation with HadCM2 simulations. Geophys. Res. Lett. 1998, 25, 3379–3382. [Google Scholar] [CrossRef]
  12. Zhang, J.Y.; Wang, Y.T.; He, R.M.; Hu, Q.F.; Song, X.M. Discussion on the urban flood and waterlogging and causes analysis in China. Adv. Water Sci. 2016, 27, 485–491. (In Chinese) [Google Scholar]
  13. Yuan, Y.; Shi, P.J.; Liu, Y.H.; Zou, M. Impact of land use change on urban flood disaster. J. Nat. Disasters 2003, 12, 6–13. (In Chinese) [Google Scholar]
  14. Cai, Y.C.; Jin, C.J.; Wang, A.Z.; Guan, D.X.; Wu, J.B.; Yuan, F.H.; Xu, L.L. Comprehensive precipitation evaluation of TRMM 3B42 with dense rain gauge networks in a mid-latitude basin, northeast China. Theor. Appl. Climatol. 2015, 126, 659–671. [Google Scholar] [CrossRef]
  15. Liu, S.H.; Yan, D.H.; Wang, H.; Li, C.Z.; Qin, T.L.; Weng, B.S.; Xing, Z.Q. Evaluation of TRMM 3B42V7 at the basin scale over mainland China. Adv. Water Sci. 2014, 33, 522–529. (In Chinese) [Google Scholar]
  16. Tang, G.Q.; Li, Z.; Xue, X.W.; Hu, Q.F.; Yong, B.; Hong, Y. A Study of substitutability of TRMM remote sensing precipitation for gauge-based observation in Ganjiang River Basin. Adv. Water Sci. 2015, 26, 340–346. (In Chinese) [Google Scholar]
  17. Chen, Y.; Ebert, E.E.; Walsh, K.J.E.; Davidson, N.E. Evaluation of TRMM 3B42 precipitation estimates of tropical cyclone rainfall using PACRAIN data. J. Geophys. Res. Atmos. 2013, 118, 2184–2196. [Google Scholar] [CrossRef] [Green Version]
  18. Salio, P.; Hobouchian, M.P.; Garacia, S.Y.; Vila, D. Evaluation of high-resolution satellite precipitation estimates over southern South America using a dense rain gauge network. Atmos. Res. 2015, 163, 146–161. [Google Scholar] [CrossRef]
  19. Seyyedi, H.; Anagnostou, E.N.; Beighley, E.; Mccollum, J. Hydrologic evaluation of satellite and reanalysis precipitation datasets over a mid-latitude basin. Atmos. Res. 2015, 164–165, 37–48. [Google Scholar] [CrossRef]
  20. Koutsouris, A.J.; Chen, D.; Lyson, S.W. Comparing global precipitation data sets in eastern Africa: A case study of Kilombero Valley, Tanzania. Int. J. Climatol. 2016, 36, 2000–2014. [Google Scholar] [CrossRef]
  21. Wu, Z.Y.; Xu, Z.G.; Wang, F.; He, H.; Zhou, J.H.; Wu, X.T.; Liu, Z.C. Hydrologic evaluation of multi-source satellite precipitation products for the upper Huaihe River Basin, China. Remote Sens. 2018, 10, 840. [Google Scholar] [CrossRef]
  22. Dezfooli, D.; Abdollahi, B.; Hosseini-Moghari, S.M.; Ebrahimi, K. A comparison between high-resolution satellite precipitation estimates and gauge measured data: Case study of Gorganrood basin, Iran. J. Water Supply 2018, 67, 236–251. [Google Scholar] [CrossRef]
  23. Sultana, R.; Nasrollahi, N. Evaluation of remote sensing precipitation estimates over Saudi Arabia. J. Arid Environ. 2018, 151, 90–103. [Google Scholar] [CrossRef]
  24. Zeng, Q.L.; Wang, Y.Q.; Chen, L.F.; Wang, Z.F.; Zhu, H.; Li, B. Inter-comparison and evaluation of remote sensing precipitation products over China from 2005 to 2013. Remote Sens. 2018, 10, 168. [Google Scholar] [CrossRef]
  25. Jiang, S.H.; Liu, S.Y.; Ren, L.L.; Yong, B.; Zhang, L.Q.; Wang, M.H.; Lu, Y.J.; He, Y.Q. Hydrologic evaluation of six high resolution satellite precipitation products in capturing extreme precipitation and streamflow over a Medium-sized basin in China. Water 2018, 10, 25. [Google Scholar] [CrossRef]
  26. Hur, J.; Ranghavan, S.V.; Nguyen, N.S.; Liong, S.Y. Are satellite products good proxies for gauge precipitation over Singapore? Theor. Appl. Climatol. 2018, 132, 921–932. [Google Scholar] [CrossRef]
  27. Guo, H.; Bao, A.M.; Ndayisaba, F.; Liu, T.; Kurban, A.; De, M.P. Systematical evaluation of satellite precipitation estimates over central Asia using an improved Error-component procedure. J. Geophys. Res. Atmos. 2017, 122, 10906–10927. [Google Scholar] [CrossRef]
  28. Ning, S.W.; Song, F.; Udmale, P.; Jin, J.L.; Thapa, B.R.; Ishidaira, H. Error analysis and evaluation of the latest GSMap and IMERG precipitation products over Eastern China. Adv. Meteorol. 2017, 2017, 1803492. [Google Scholar] [CrossRef]
  29. Anjum, M.N.; Ding, Y.J.; Shangguan, D.H.; Ahmad, I.; Ijaz, M.W.; Farid, H.U.; Yagoub, Y.E.; Zaman, M.; Adnan, M. Performance evaluation of latest integrated multi-satellite retrievals for Global precipitation measurement (IMERG) over the northern highlands of Pakistan. Atmos. Res. 2018, 205, 134–146. [Google Scholar] [CrossRef]
  30. Chen, C.; Chen, Q.W.; Duan, Z.; Zhang, J.Y.; Mo, K.L.; Li, Z.; Tang, G.Q. Multiscale comparative evaluation of the GPM IMERG v5 and TRMM 3B42V7 precipitation products from 2015 to 2017 over a climate transition area of China. Remote Sens. 2018, 10, 944. [Google Scholar] [CrossRef]
  31. Wang, H.; Luo, J.; Ye, J.Y.; Li, Z.J. Comparative analysis of area rainfall in Huaihe river basin estimated by CMORPH-gauge merged data and observed rain gauge data. J. Hohai Univ. 2014, 42, 189–194. (In Chinese) [Google Scholar]
  32. Qin, Y.X.; Chen, Z.Q.; Shen, Y.; Zhang, S.P.; Shi, R.H. Evaluation of satellite rainfall estimates over the Chinese Mainland. Remote Sens. 2014, 6, 11649–11672. [Google Scholar] [CrossRef]
  33. Liu, Z. Comparison of precipitation estimates between version 7 3-hourly Trmm multi-satellite precipitation analysis (TMPA) near-real-time and research products. Atmos. Res. 2015, 153, 119–133. [Google Scholar] [CrossRef]
  34. Tan, M.L.; Ibrahim, A.L.; Duan, Z.; Cracknell, A.P.; Chaplot, V. Evaluation of six high-resolution satellite and ground-based precipitation products over Malaysia. Remote Sens. 2015, 7, 1504–1528. [Google Scholar] [CrossRef]
  35. Shen, Y.; Xiong, A.; Wang, Y.; Xie, P. Performance of high-resolution satellite precipitation products over China. J. Geophys. Res. Atmos. 2010, 115, D02114. [Google Scholar] [CrossRef]
  36. Deng, X.L.; Nie, S.P.; Deng, W.T.; Cao, W.H. Satellite evaluation of the performance of gridded monthly precipitation products from reanalysis data, satellite estimates, and merged analyses over China. Theor. Appl. Climatol. 2018, 132, 621–637. [Google Scholar] [CrossRef]
  37. Zhang, C.; Chen, X.; Shao, H.; Chen, S.Y.; Liu, T.; Chen, C.B.; Ding, Q.; Du, H.Y. Evaluation and intercomparison of high-resolution satellite precipitation estimates-GPM, TRMM, and CMORPH in the Tianshan Mountain Area. Remote Sens. 2018, 10, 1543. [Google Scholar] [CrossRef]
  38. Zheng, Z.F.; Wang, Z.W.; Gao, H. Characteristics of extreme precipitation events in summer and its effect on urbanization in Beijing area. Meteorol. Mon. 2013, 39, 1635–1641. (In Chinese) [Google Scholar]
  39. Song, X.M.; Zhang, J.Y.; Kong, F.Z.; Wang, G.Q.; He, R.M.; Zhu, K. Spatical-temporal variation characteristics of precipitation extremes in Beijing. Adv. Water Sci. 2017, 28, 161–173. (In Chinese) [Google Scholar]
  40. Bai, L. Study on Near Surface Urban Heat Island Effect of Beijing City Based on Remote Sensing; Nanjing University of Information Science & Technology: Nanjing, China, 2017. (In Chinese) [Google Scholar]
  41. Song, X.M.; Zhang, J.Y.; Achakouchak, A. Rapid urbanization and changes in trends and spatial-temporal characteristics of precipitation in the Beijing metropolitan area. J. Geophys. Res. Atmos. 2014, 119, 11250–11271. [Google Scholar] [CrossRef]
  42. Chang, X.D.; Xu, Z.X.; Zhao, G.; Cheng, T.; Song, S.L. Spatial and temporal variations of precipitation during 1979–2015 in Jinan City, China. J. Water Clim. Chang. 2017, 9, 540–554. [Google Scholar] [CrossRef]
  43. Zhao, J.; Xu, Z.X.; Zuo, D.P. Spatiotemporal variation of potential evapotranspiration in the HeiHe river basin. J. Beijing Norm. Univ. 2013, 4, 164–169. (In Chinese) [Google Scholar]
  44. Xu, S.G.; Niu, Z.; Shen, Y.; Guang, D. Evaluation and modification of CMORPH multi-satellite precipitation estimates in summer over Tibetan Plateau. Remot Sens. Inf. 2015, 30, 71–76. (In Chinese) [Google Scholar]
  45. Justine, R.; Melanie, B.; Frederique, S.; Laurent, L. Temporal and spatial assessment of four satellite rainfall estimates over French Guiana and north Brazil. Remote Sens. 2015, 7, 16441–16459. [Google Scholar]
  46. Su, J.B.; Lv, H.S.; Wang, J.Q.; Ali, M.S.; Zhu, Y.H. Evaluating the applicability of four latest satellite-gauge combined precipitation estimates for extreme precipitation and streamflow predictions over the upper Yellow river basins in China. Remote Sens. 2017, 9, 1176. [Google Scholar] [CrossRef]
  47. Wei, G.H.; Lv, H.S.; Wade, T.C.; Zhu, Y.H.; Wang, J.Q.; Su, J.B. Evaluation of satellite-based precipitation products from IMERG V04A and V03D, CMORPH and TMPA with gauged rainfall in three climatologic zones. Remote Sens. 2018, 10, 30. [Google Scholar] [CrossRef]
  48. Huffman, G.J.; Adler, R.F.; Bolvin, D.T.; Gu, G.J.; Nelkin, E.J.; Bowman, K.P.; Hong, Y.; Stocker, E.F.; Wolff, D.B. The TRMM multi-satellite precipitation analysis (TMPA): Quasi-global, multiyear, combined-sensor precipitation estimates at fine scales. J. Hydrometeorol. 2007, 8, 38–55. [Google Scholar] [CrossRef]
  49. Huffman, G.J. Highlights of version 7 TRMM multi-satellite precipitation analysis (TMPA). In Proceedings of the 5th International Precipitation Working Group Workshop, Hamburg, Germany, 11–15 October 2010; pp. 109–110. [Google Scholar]
  50. Mantas, V.M.; Liu, Z.; Caro, C.; Pereira, A.J.S.C. Validation of TRMM multi-satellite precipitation analysis (TMPA) products in the Peruvian Andes. Atmos. Res. 2015, 163, 132–145. [Google Scholar] [CrossRef]
  51. Ren, M.F.; Bo, P.; Xu, Z.X.; Yue, J.J.; Zhang, R. Downscaling of daily extreme temperature in the Yarlung Zangbo River Basin using machine learning techniques. Theor. Appl. Climatol. 2018. [Google Scholar] [CrossRef]
  52. Chen, A.F.; Chen, D.L.; Molina, C.A. Assessing reliability of precipitation data over the Mekong river basin: A comparison of ground-based, satellite, and reanalysis datasets. Int. J. Climatol. 2018, 38, 4314–4334. [Google Scholar] [CrossRef]
  53. Prakash, S.; Mitra, A.K.; AghhaKouchhak, A.; Liu, Z.; Norouzi, H.; Pai, D.S. A preliminary assessment of GPM-based multi-satellite precipitation estimates over a monsoon dominated region. J. Hydrol. 2016, 556, 865–876. [Google Scholar] [CrossRef]
  54. Tang, G.Q.; Ma, Y.Z.; Long, D.; Zhong, L.Z.; Hong, Y. Evaluation of GPM day-1 IMERG and TMPA version-7 legacy products over mainland China at multiple spatiotemporal scales. J. Hydrol. 2016, 533, 152–167. [Google Scholar] [CrossRef]
  55. Zhai, Y.; Guo, Y.; Zhou, J.; Guo, N.; Wang, J.; Teng, Y. The spatial-temporal variability of annual precipitation and its local impact factors during 1724–2010 in Beijing, China. Hydrol. Process. 2014, 28, 2192–2201. [Google Scholar] [CrossRef]
  56. Zhang, Y.; Smith, J.A.; Luo, L.F.; Wang, Z.F.; Baeck, M.L. Urbanization and rainfall variability in the Beijing metropolitan region. J. Hydrometeorol. 2013, 15, 2219–2235. [Google Scholar] [CrossRef]
  57. Yang, F.; Lu, H.; Yang, K.; He, J.; Wang, W.; Wright, J.S.; Li, C.W.; Han, M.L.; Li, Y.S. Evaluation of multiple forcing data sets for precipitation and shortwave radiation over major land areas of China. Hydrol. Earth Syst. Sci. 2017, 21, 5805–5821. [Google Scholar] [CrossRef] [Green Version]
  58. He, S.W.; Nan, Z.T.; Hou, Y.T. Accuracy evaluation of two precipitation datasets over upper reach of Heihe river basin, northwestern China. Sci. Cold Arid Reg. 2015, 7, 0157–0169. [Google Scholar]
  59. Kumari, M.; Singh, C.K.; Bakimchandra, O.; Basistha, A. Geographically weighted regression based quantification of rainfall-topography relationship and rainfall gradient in Central Himalayas. Int. J. Climatol. 2017, 37, 1299–1309. [Google Scholar] [CrossRef]
  60. Hughes, M.; Hall, A.; Fovell, R.G. Blocking in areas of complex topography, and its influence on rainfall distribution. J. Atmos. Sci. 2013, 66, 508–518. [Google Scholar] [CrossRef]
  61. Ebrahimi, S.; Chen, C.; Chen, Q.W.; Zhang, Y.S.; Ma, N.; Zaman, Q. Effects of temporal scales and space mismatches on the TRMM 3B42 V7 precipitation products in a remote mountainous area. Hydrol. Process. 2017, 31, 4315–4327. [Google Scholar] [CrossRef]
  62. Easterling, D.R.; Meehl, G.A.; Parmesan, S.A.; Changnon, T.R.K.; Mearns, L.O. Climate extremes: Observations modeling, and impacts. Science 2000, 289, 2068–2074. [Google Scholar] [CrossRef]
  63. Marosz, M.; Wojcik, R.; Pilarski, M.; Mietus, M. Extreme daily precipitation totals in Poland during summer: The role of regional atmospheric circulation. Clim. Res. 2013, 56, 245–259. [Google Scholar] [CrossRef]
Figure 1. Locations of the meteorological stations providing ground observations and the various grids for satellite-derived precipitation products superimposed over a topographic map of the Beijing region. CMFD: China Meteorological Forcing Dataset; CMORPH: Climate Prediction Center morphing technique; TRMM: Tropical Rainfall Measuring Mission.
Remotesensing 10 01914 g001
Figure 2. Variation in the statistical metrics of four satellite precipitation products against observed precipitation data over Beijing for (a) CC, (b) RMSD, (c)MAD, and (d) RBS.
Remotesensing 10 01914 g002
Figure 3. The spatial distributions of CC from (a) CMFD, (b) CMORPH, (c) 3B42 calibrated, (d) 3B42-RT, and RMSD (mm) from (e) CMFD, (f) CMORPH, (g) 3B42 calibrated, (h) 3B42-RT at each station for the four precipitation products evaluated in this study.
Remotesensing 10 01914 g003aRemotesensing 10 01914 g003b
Figure 4. Variation in the categorical metrics for four satellite precipitation products against observed precipitation data over Beijing (a) POD, (b) FAR, and (c) CSI.
Remotesensing 10 01914 g004aRemotesensing 10 01914 g004b
Figure 5. Average monthly precipitation from ground observations and four satellite-derived precipitation products.
Remotesensing 10 01914 g005
Figure 6. Average annual precipitation over the study period 2001–2005 determined from ground observations, and satellite derived products.
Remotesensing 10 01914 g006
Figure 7. Time series for ground observations and satellite-derived precipitation products showing average annual precipitation for 36 stations in Beijing from 2001 to 2015.
Remotesensing 10 01914 g007
Figure 8. Spatial variability in the annual precipitation interpolated from (a) ground observations; (b) CMFD data; (c) CMORPH data; (d) 3B42 calibrated (version 7) data, and (e) 3B42-RT data.
Remotesensing 10 01914 g008
Figure 9. Probability density function (PDF) of daily precipitation during the study period derived from ground observations, and satellite precipitation products.
Remotesensing 10 01914 g009
Figure 10. Scatter points showing annual precipitation values from ground observations at 36 stations against elevation, compared with four satellite-derived products.
Remotesensing 10 01914 g010
Table 1. Information on the 36 ground observation stations in Beijing used in this study.
Station No.Station NameAverage Annual Precipitation (mm year−1)Station No.Station NameAverage Annual Precipitation (mm year−1)
1Sanjiadian (SJD)540.5419Songlinzha (SLZ)532.19
2Xiahui (XH)551.8320Zaoshulin (ZSL)682.92
3Dongzhimen (DZM)510.1321Yulinzhuang (YLZ)482.00
4Lejiahuayuan (LJHY)508.2022Shahe (SH)510.07
5Fengheying (FHY)456.6323Yanhecheng (YHC)372.06
6Beijing (BJ)482.5224Haidian (HD)499.54
7Qianjiadian (QJD)409.7525Wangjiayuan (WJY)492.69
8Banbidian (BBD)472.2126Fanzipai (FZP)553.21
9Lugouqiao (LGQ)512.2327Shijingshan (SJS)556.73
10Youanmen (YAM)502.1028Yangfangzha (YFZ)507.23
11Tangzhishan (TZS)518.3329Tongxian (TX)525.64
12Labagoumen (LBGM)440.4430Xiayunling (XYL)538.84
13Daxing (DX)498.7831Shunyi (SY)534.76
14Miyun (MY)552.4632Majuqiao (MJQ)451.16
15Yanqing (YQ)424.3933Gaobeidian (GBD)521.06
16Zhangfang (ZF)424.3934Mayu (MY)492.96
17Zhaitangshuiku (ZTSK)401.0135Huangsongyu (HSY)639.42
18Nangezhuang (NGZ)472.2136Huanghuacheng (HHC)531.79
Table 2. Summary information for the four satellite precipitation products used in this study.
NameTemporal ResolutionSpace ResolutionType
CMFD3 h0.1° × 0.1°Reanalysis
CMORPHdaily0.25° × 0.25°Satellite
3B42daily 0.25° × 0.25°Satellite
3B42-RTdaily 0.25° × 0.25°Satellite
Table 3. Statistical metrics for detection of daily precipitation at 36 stations in Beijing using four satellite-derived precipitation products.
CMFDCMORPH3B423B42RT
CCAverage0.700.600.590.54
Max0.820.680.690.66
Min0.540.340.320.29
SD0.080.090.110.09
RMSD (mm)Average4.645.535.476.90
Max6.217.456.928.38
Min3.314.183.925.84
SD0.840.820.820.70
MAD (mm)Average1.191.511.511.91
Max1.612.092.122.40
Min0.901.251.211.55
SD0.190.200.210.24
RBS (%)Average−2.06−10.55−1.41−38.69
Max18.3214.4721.70−10.72
Min−24.92−57.38−35.14−108.72
SD9.7714.5011.8923.38
Note: minimum (min); maximum (max); correlation coefficient (CC); root mean squared difference (RMSD); mean absolute difference (MAD); relative bias (RBS).
Table 4. Categorical metrics for detection of daily precipitation at 36 stations in Beijing using four satellite-derived precipitation products.
PODFARCSI
AverageMaxMinSDAverageMaxMinSDAverageMaxMinSD
CMFD0.970.990.920.020.350.440.230.050.640.760.550.05
CMORPH0.870.940.690.070.400.560.310.080.550.640.370.08
3B420.700.810.490.090.420.680.310.080.460.570.240.08
3B42-RT0.710.850.490.100.450.640.360.070.450.530.310.07
Note: minimum (min); maximum (max); probability of detection (POD); false alarm ratio (FAR); Critical Success Index (CSI).
Table 5. Average monthly or seasonal statistical metrics for detection of precipitation at 36 stations in Beijing using four satellite-derived precipitation products.
Precipitation ProductsPeriodCCRMSD (mm)MAD (mm)RBS (%)
CMFDWhole0.7817.9913.57−10.38
Flood0.6738.4629.800.12
Non-flood0.847.765.47−15.62
CMORPHWhole0.3227.7820.689.21
Flood0.4955.3641.61−16.30
Non-flood0.2313.9910.2221.98
3B42Whole0.7417.9813.65−8.60
Flood0.6937.7829.28−2.79
Non-flood0.768.085.84−11.51
3B42-RTWhole0.4435.5026.70−73.86
Flood0.4470.3754.99−40.23
Non-flood0.4418.0712.56−90.68

