1. Introduction
Fluorescence, the radiant flux emitted by chlorophyll molecules after excitation by photons, is the most directly-measurable reporter of photosynthetic efficiency and hence a key indicator of the health and carbon fixation of photosynthesizing organisms [
1,
2]. Measurements of fluorescence, at both the leaf and canopy level, can therefore greatly advance the understanding of the photosynthesis dynamics, gross primary productivity and ecosystem change over time [
3,
4]. A synoptic view of Earth vegetation health will become available when the ESA Fluorescence Explorer (FLEX) mission, scheduled for launch in 2022, becomes operational. This mission will fly in tandem with Sentinel 2 and 3 and enable both the Sun-induced fluorescence (SIF) and Earth surface radiance to be measured simultaneously [
5,
6,
7]. Reliable short-term and long-term system characterization, calibration and validation of the spectrometer system used for ground and near ground calibration and validation science activities [
8,
9,
10,
11] need to be considered to ensure accurate and replicable results.
SIF investigations are challenging due to the extremely low levels of light produced by chlorophyll emissions, as these are overlapped by vegetation solar flux reflectance signals. One of the main strategies used to separate the effects of vegetation reflected and emitted fluxes is by exploiting the changes across the oxygen telluric absorption lines: oxygen-A (O2-A), having the centre wavelength at 687 nm and oxygen-B (O2-B) having the centre wavelength at 760.6 nm [
12,
13]. These methods require the use of high spectral resolutions spectrometers (full-width half-maximum (FWHM) of less than 0.3 nm) [
13,
14]. The need for high-resolution spectrometers for measuring fluorescence within these telluric bands and the effects of inaccuracies and uncertainties has been highlighted by [
15,
16,
17], and the need for well-calibrated and characterised systems is emphasised in the ESA FLEX report for mission selection [
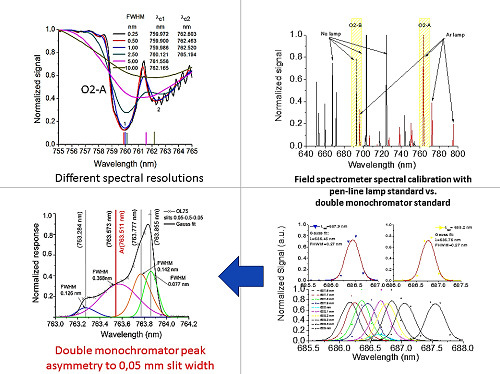
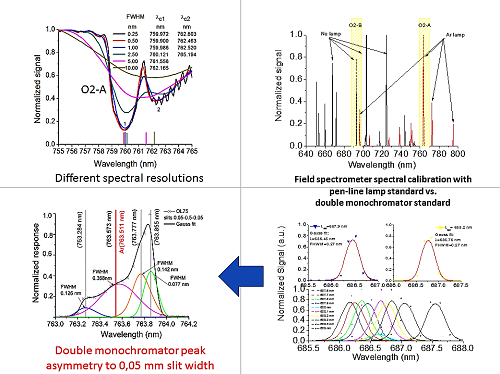
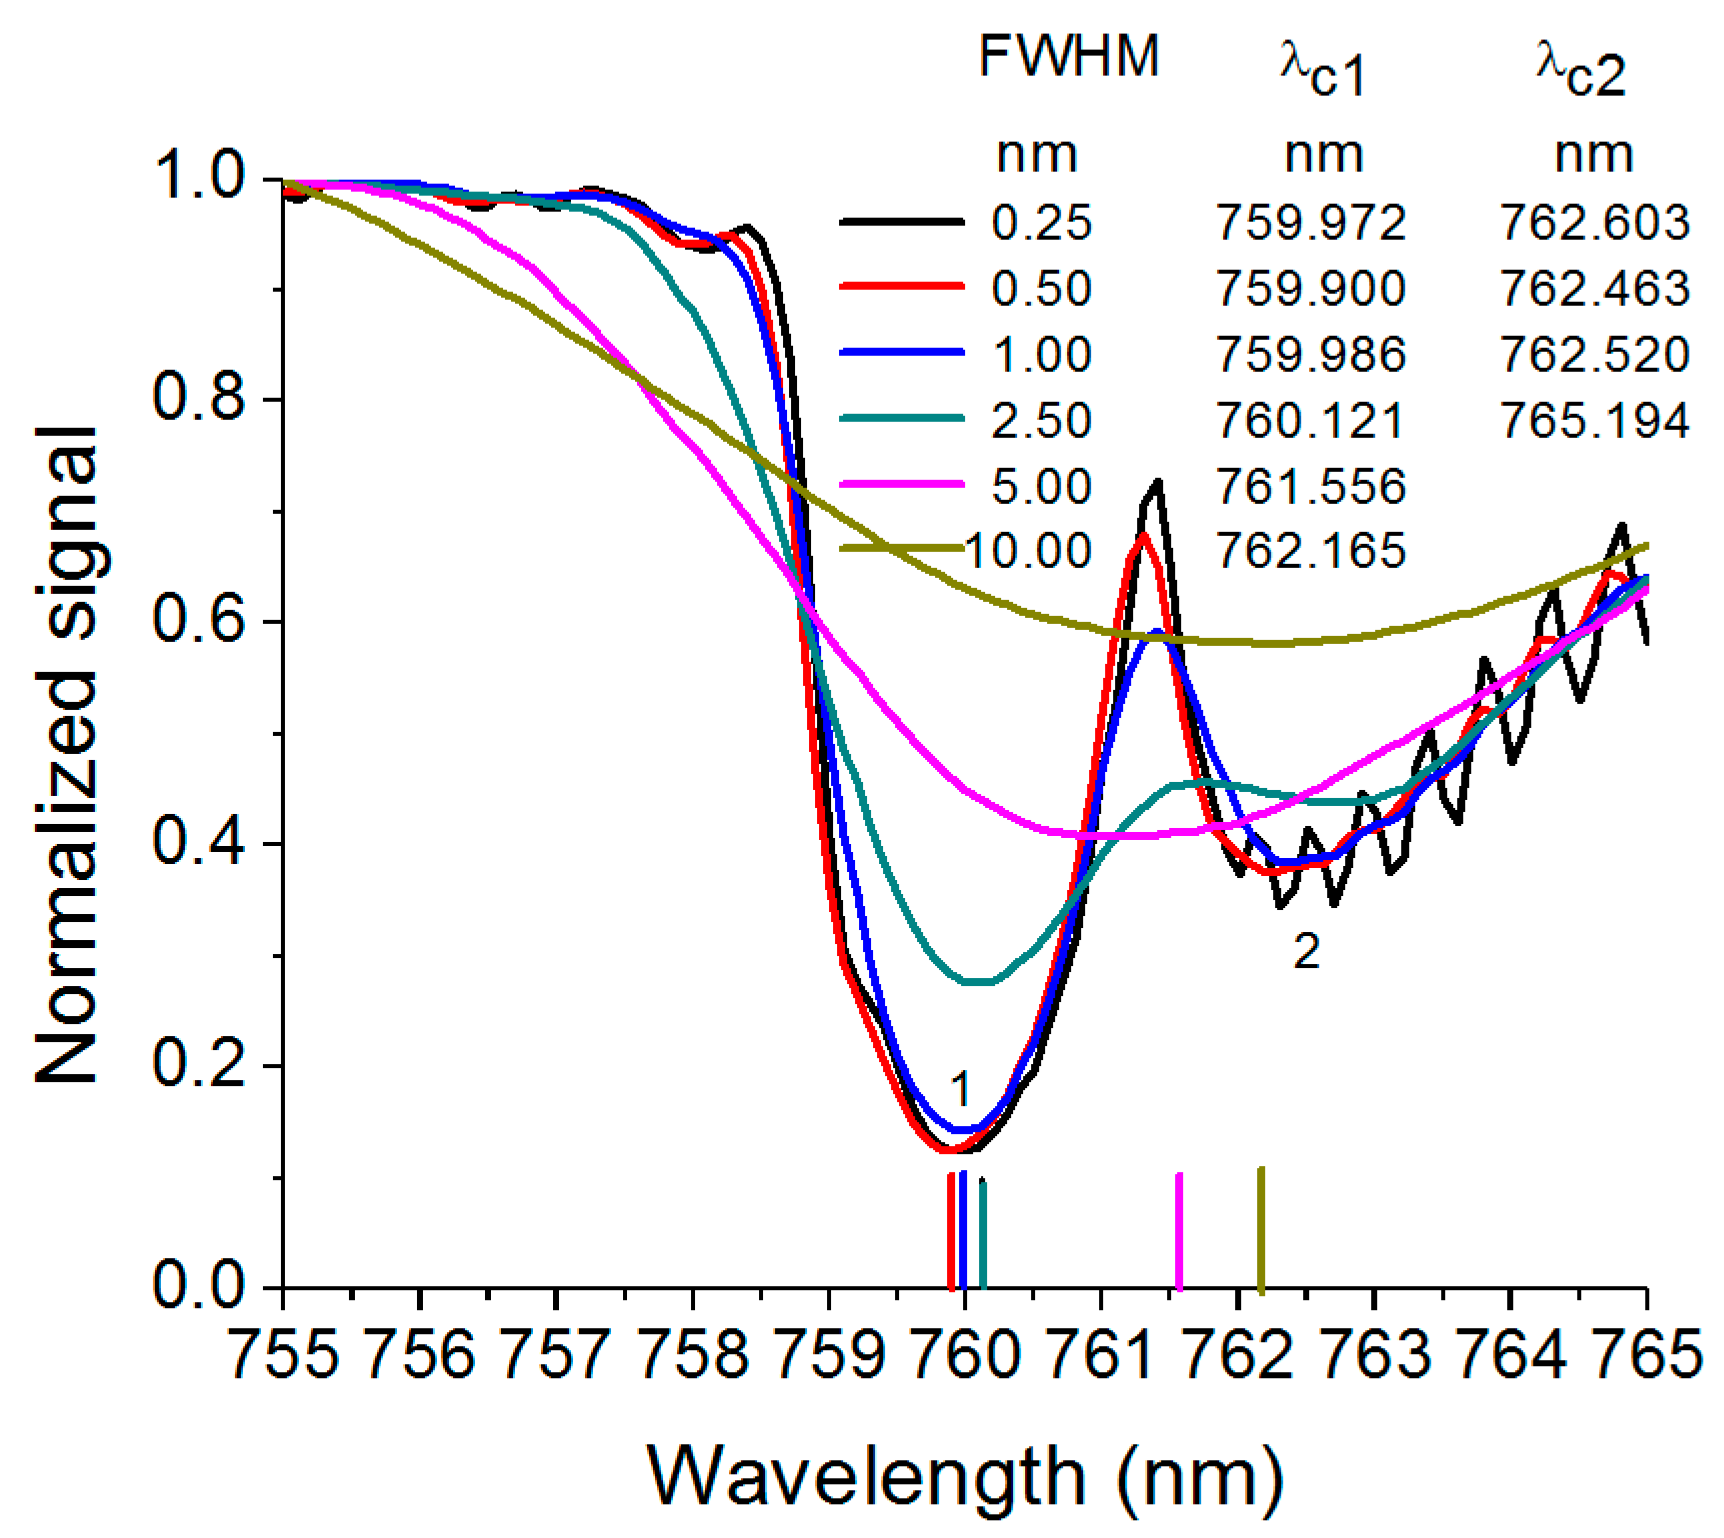
3]. The impact of different spectrometer FWHMs on the shape of the O2-A absorption feature and shift in the apparent minima are shown in
Figure 1, as an example. Consequently, field spectrometers require very careful spectral calibration (wavelength position and, hence, sampling interval) and characterization (FWHM) to demonstrate that these requirements are met. In addition, attention needs to be paid to the temperature of the spectrometer. Differences between temperatures during spectrometer calibration and field use may also introduce additional uncertainties in spectral calibration [
18]. The work reported here was carried out at in a laboratory at 20 °C and with each QEPro spectrometer detector cooled to −10 °C. In general, field fixed-point spectrometers, covering the 400 nm–1100 nm or 400 nm–2500 nm spectral ranges, are used for ground-based calibration and validation of space-based observations [
19,
20,
21,
22,
23]. However, although a few independent studies have been published on high-resolution field spectrometers’ performance characterization and calibration [
24,
25], these studies are not directly comparable as the methodologies and instruments varied.
As of yet, no detailed and universally-accepted protocols have been developed for the calibration of field spectrometers. Spectrometer manufacturers do not normally release details of their calibration procedures, claiming commercial confidentiality, or require non-disclosure agreements (NDA) to be signed, if they do provide any information. Their work cannot therefore be more generally replicated. Consequently, each research group has to develop its own calibration procedures. Calibration protocols have also not yet been developed for the even higher spectral resolution field spectrometers, which will be required for calibration, validation and science activities to support the FLEX fluorescence imager at sufficient spectral sampling intervals and band widths to measure solar flux in the telluric O2-A and O2-B bands. Therefore, primary calibration sources traceable to agreed common standards and laboratory calibration protocols are required for reliable and replicable measurements and to enable measurements from one near-ground system to be compared directly with measurements from other systems. Detailed protocols for radiometric, geometric and spectral calibration are required to ensure that this is the case. The spectral calibration refers to spectrometer detector spectral response with reference to a known wavelength emission standard [
25]. Ocean Optics (Dunedin, FL, USA), a company providing high-resolution optical benches, which can be incorporated into spectrometer systems for field use, recommend calibration against a mercury argon (Hg-Ar) emission source and a third order polynomial fit to generate the wavelength calibration scale [
26]. Nevertheless, a consistent and replicable approach needs to be agreed upon, given the errors that can be introduced in fluorescence estimation [
27].
Different spectral standards (emission/absorption sources, monochromator-based systems or tuneable laser sources) can be used as wavelength standards, depending on the spectral measurement resolution (FWHM and the sampling interval) required [
16,
17,
18,
19,
20,
21,
22,
23,
24,
25,
26,
27,
28,
29]. The most frequently-used spectral source for this purpose is the pencil style calibration lamps (L.O.T–Oriel, U.K., for example), having very narrow emission lines, with a line width <0.001 nm [
30,
31,
32]. The disadvantages when using these types of emission lamps is the limited emission line distribution across the spectral range that corresponds to the gas chemistry and physics fundamentals. These lines are not necessarily evenly distributed across the full range of the spectrometers being calibrated, and their intensity at some wavelengths may be too low to be of practical use [
29]. In addition, the emission lines do not normally match the wavelengths corresponding to O2-A and O2-B absorption lines. Another option is to use a tuneable monochromator system. These systems, which can be programmed to emit light at specific wavelengths in minimum steps of 0.05 nm, depending on the configurations, can be tuned to provide FWHMs between <0.25 nm and up to 10 nm. When operated in conjunction with a high intensity light source, they can provide a signal intensive enough to be detected by field spectrometers being used for fluorescence studies. One disadvantage of such systems is that their operation can be time consuming when a large spectral range needs to be considered for spectral calibration [
29]. Another type of source that can be used for spectral calibration is a tuneable laser that can provide multiple intense emission [
8,
29]; however, this approach is out of the scope of this study; as a system was not available for this work. However, the use of a tuneable laser for spectral calibration is planned for a future research project. This paper will discuss two different laboratory spectral calibration techniques (using narrow band pen-line emission sources and a double monochromator-based standard) applied to field spectrometers with different spectral ranges, sampling intervals and FWHMs. The spectrometers’ calibration accuracy necessarily depends on the calibration equipment performances, and since the spectral response can vary with different configurations, a proper characterization of this equipment is critical [
8].
The focus of our study was to compare wavelength calibration approaches and develop recommendations for the spectral characterization of: high and low-resolution spectrometers prior to developing appropriate procedures and protocols. Therefore, the evaluation of a Piccolo spectrometer system spectral response was selected. This instrument is a dual-field-of-view system able to incorporate multiple optical benches (individual spectrometers covering different spectral ranges) with a cosine-corrected fore optic to capture downwelling irradiance and the upwelling channel configured with a view angle-limited fore optic [
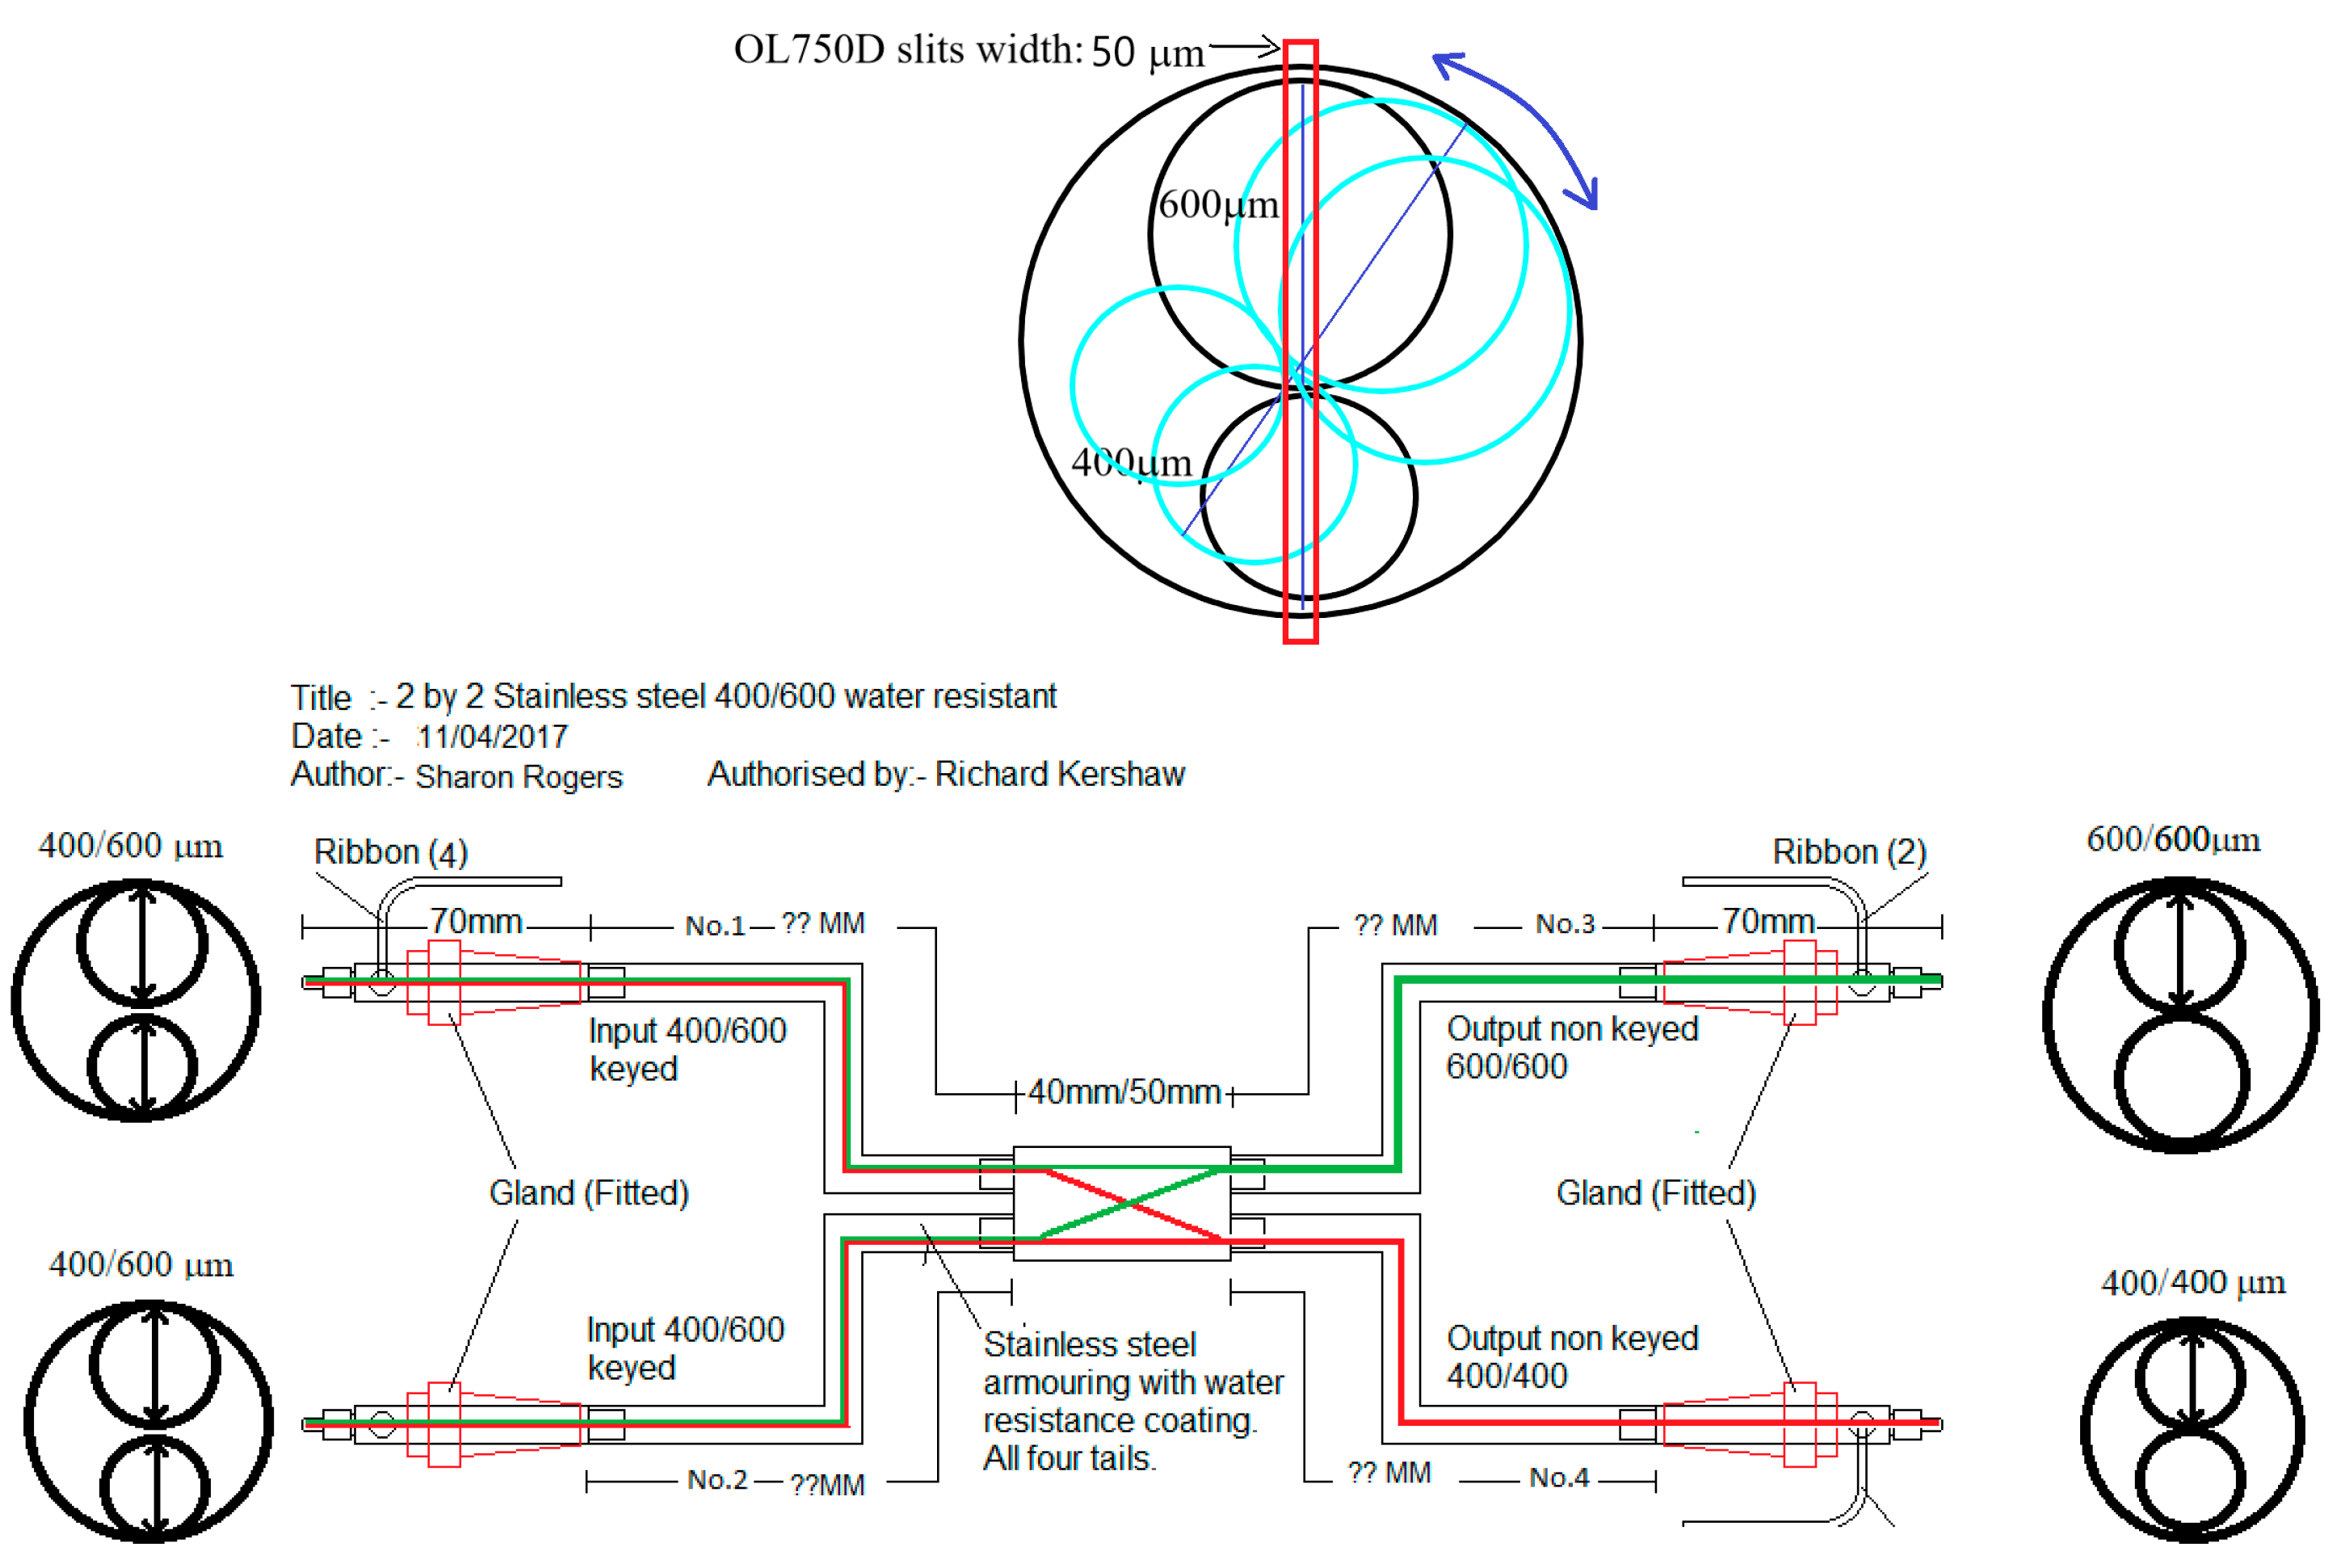
33]. Light is transmitted from the fore optics to each individual spectrometer through a bifurcated fibre optic assembly (
Figure 2). This assembly has two fibre optic cables, in each of its input legs (one leg for upwelling light and the other for downwelling light), and these cross over at the central block so that one upwelling and one downwelling fibre go to each spectrometer. As there is an electro-mechanical shutter in each fore optic, one can be closed to exclude light entering the system while the other is open. Hence, by switching between the two shutters, downwelling and upwelling light can be recorded sequentially. The upwelling and the downwelling channel fibres are aligned along each spectrometer optical slit as shown in
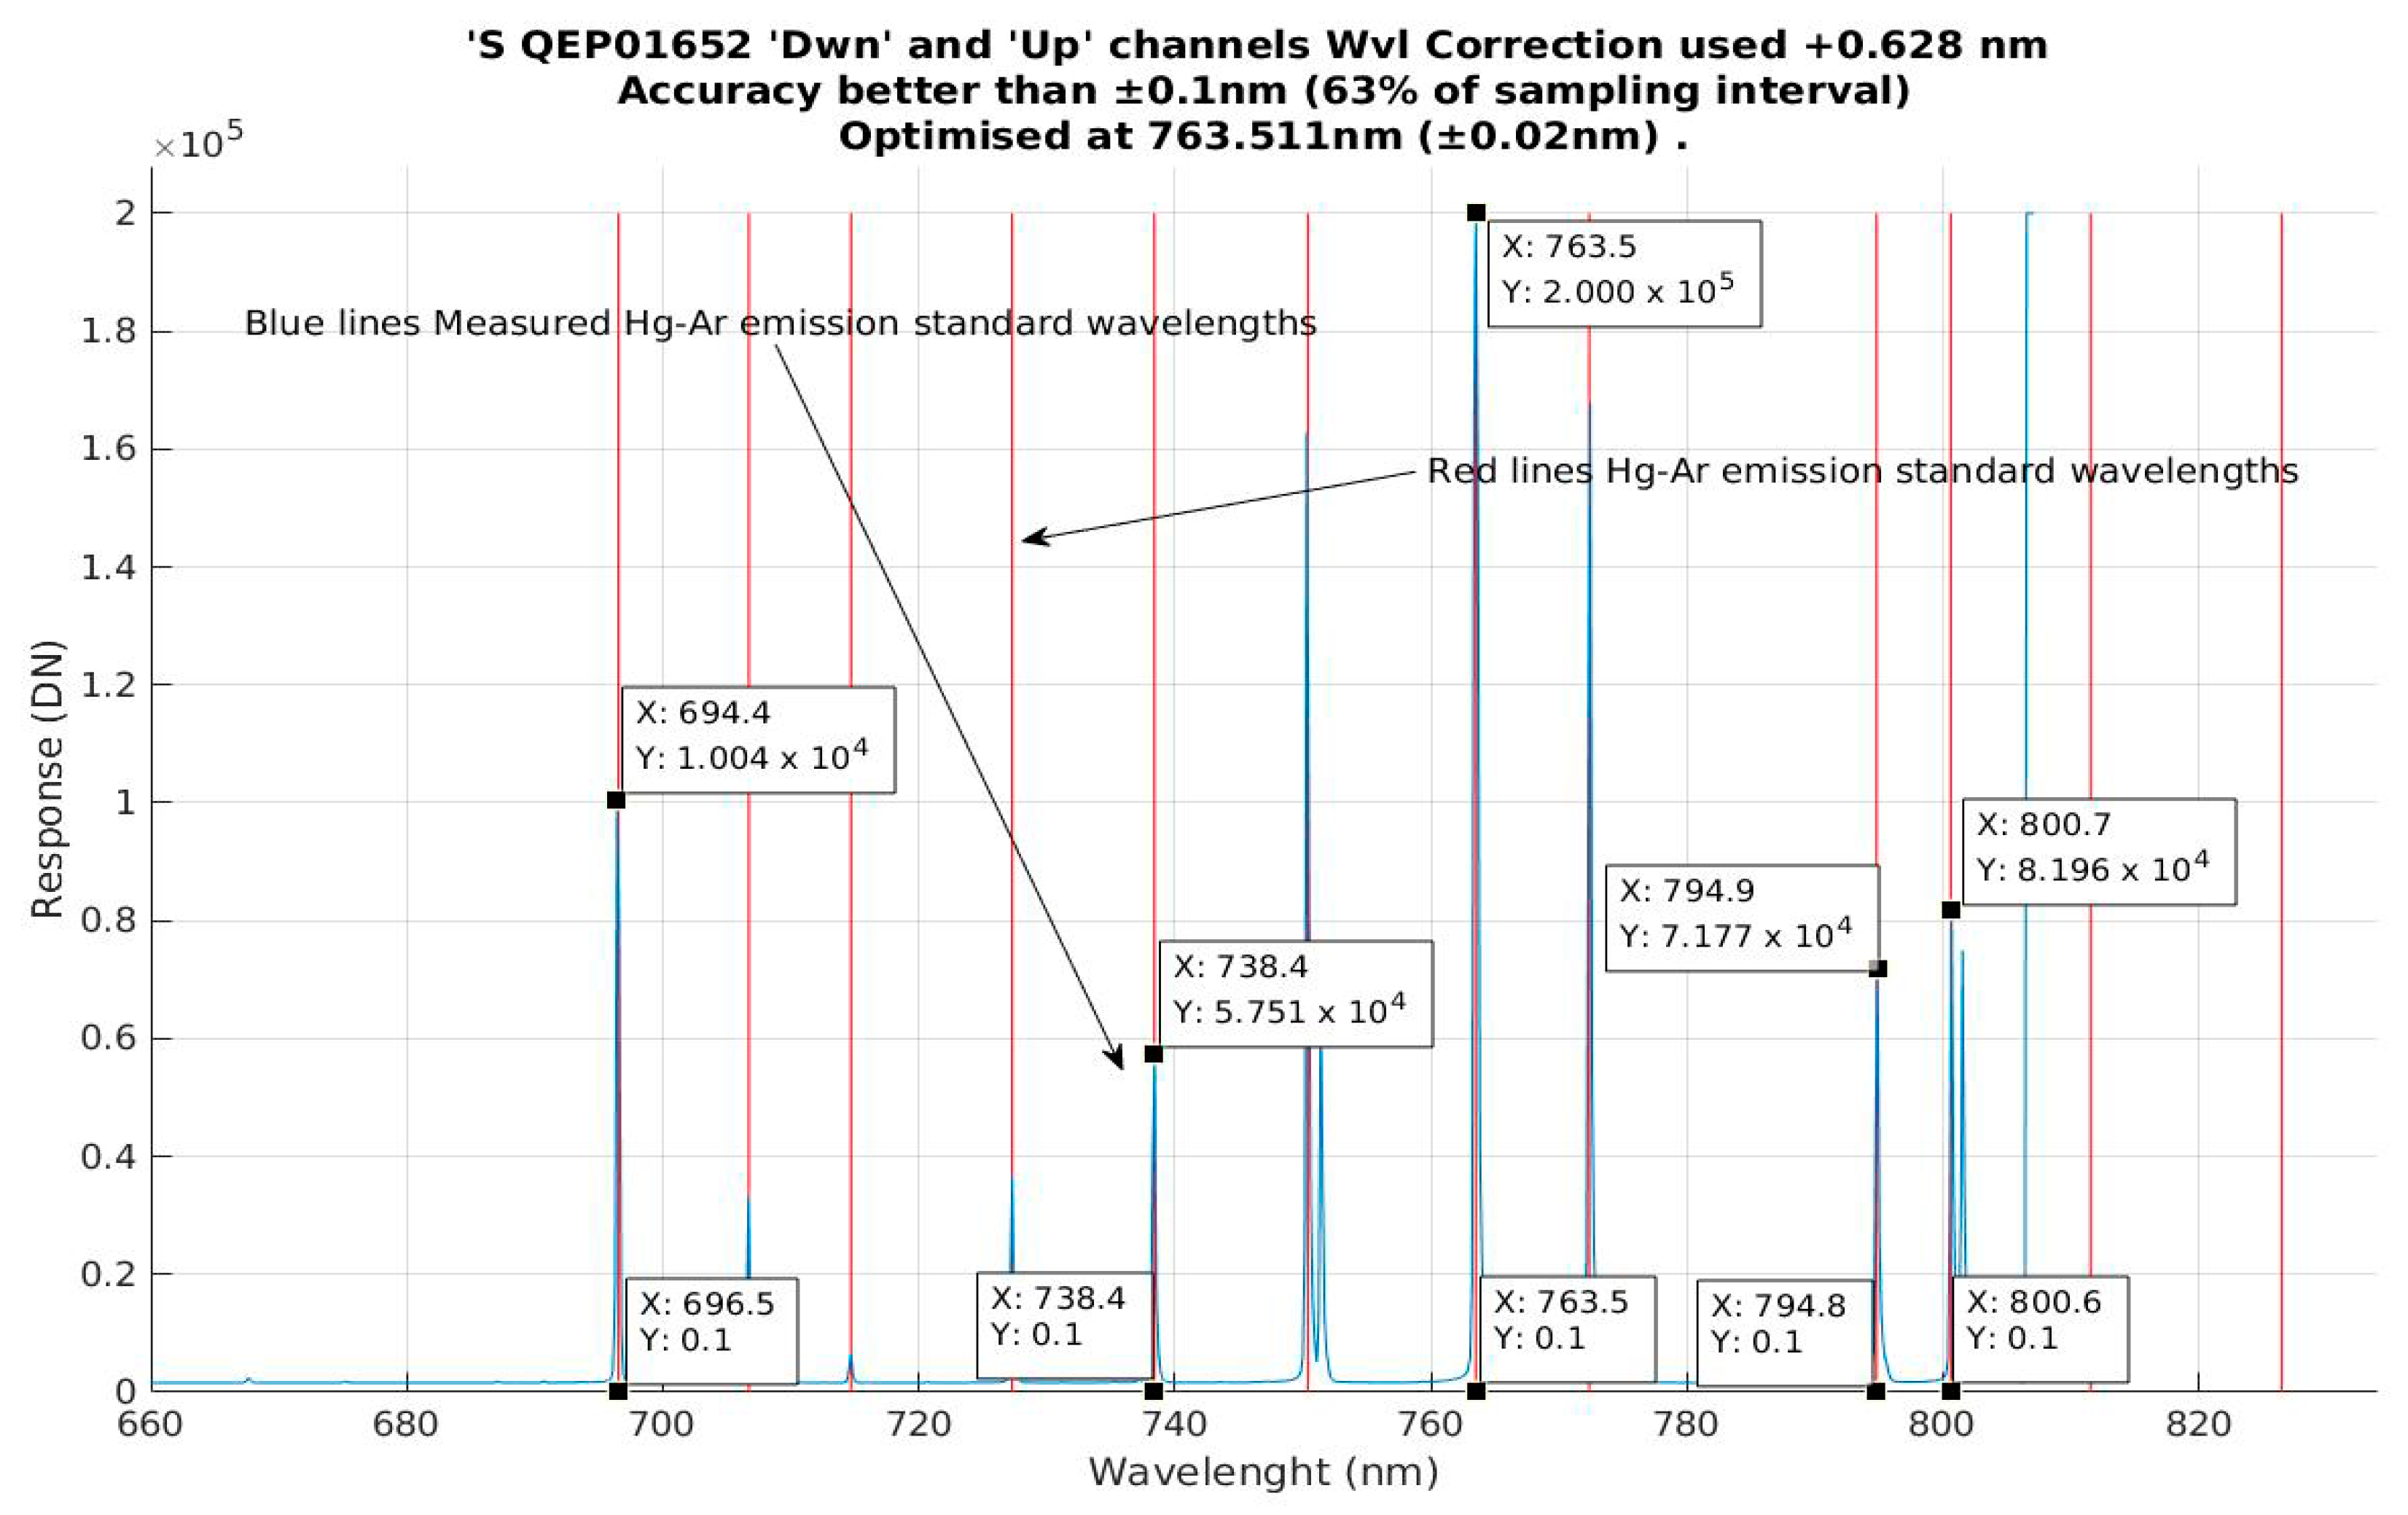
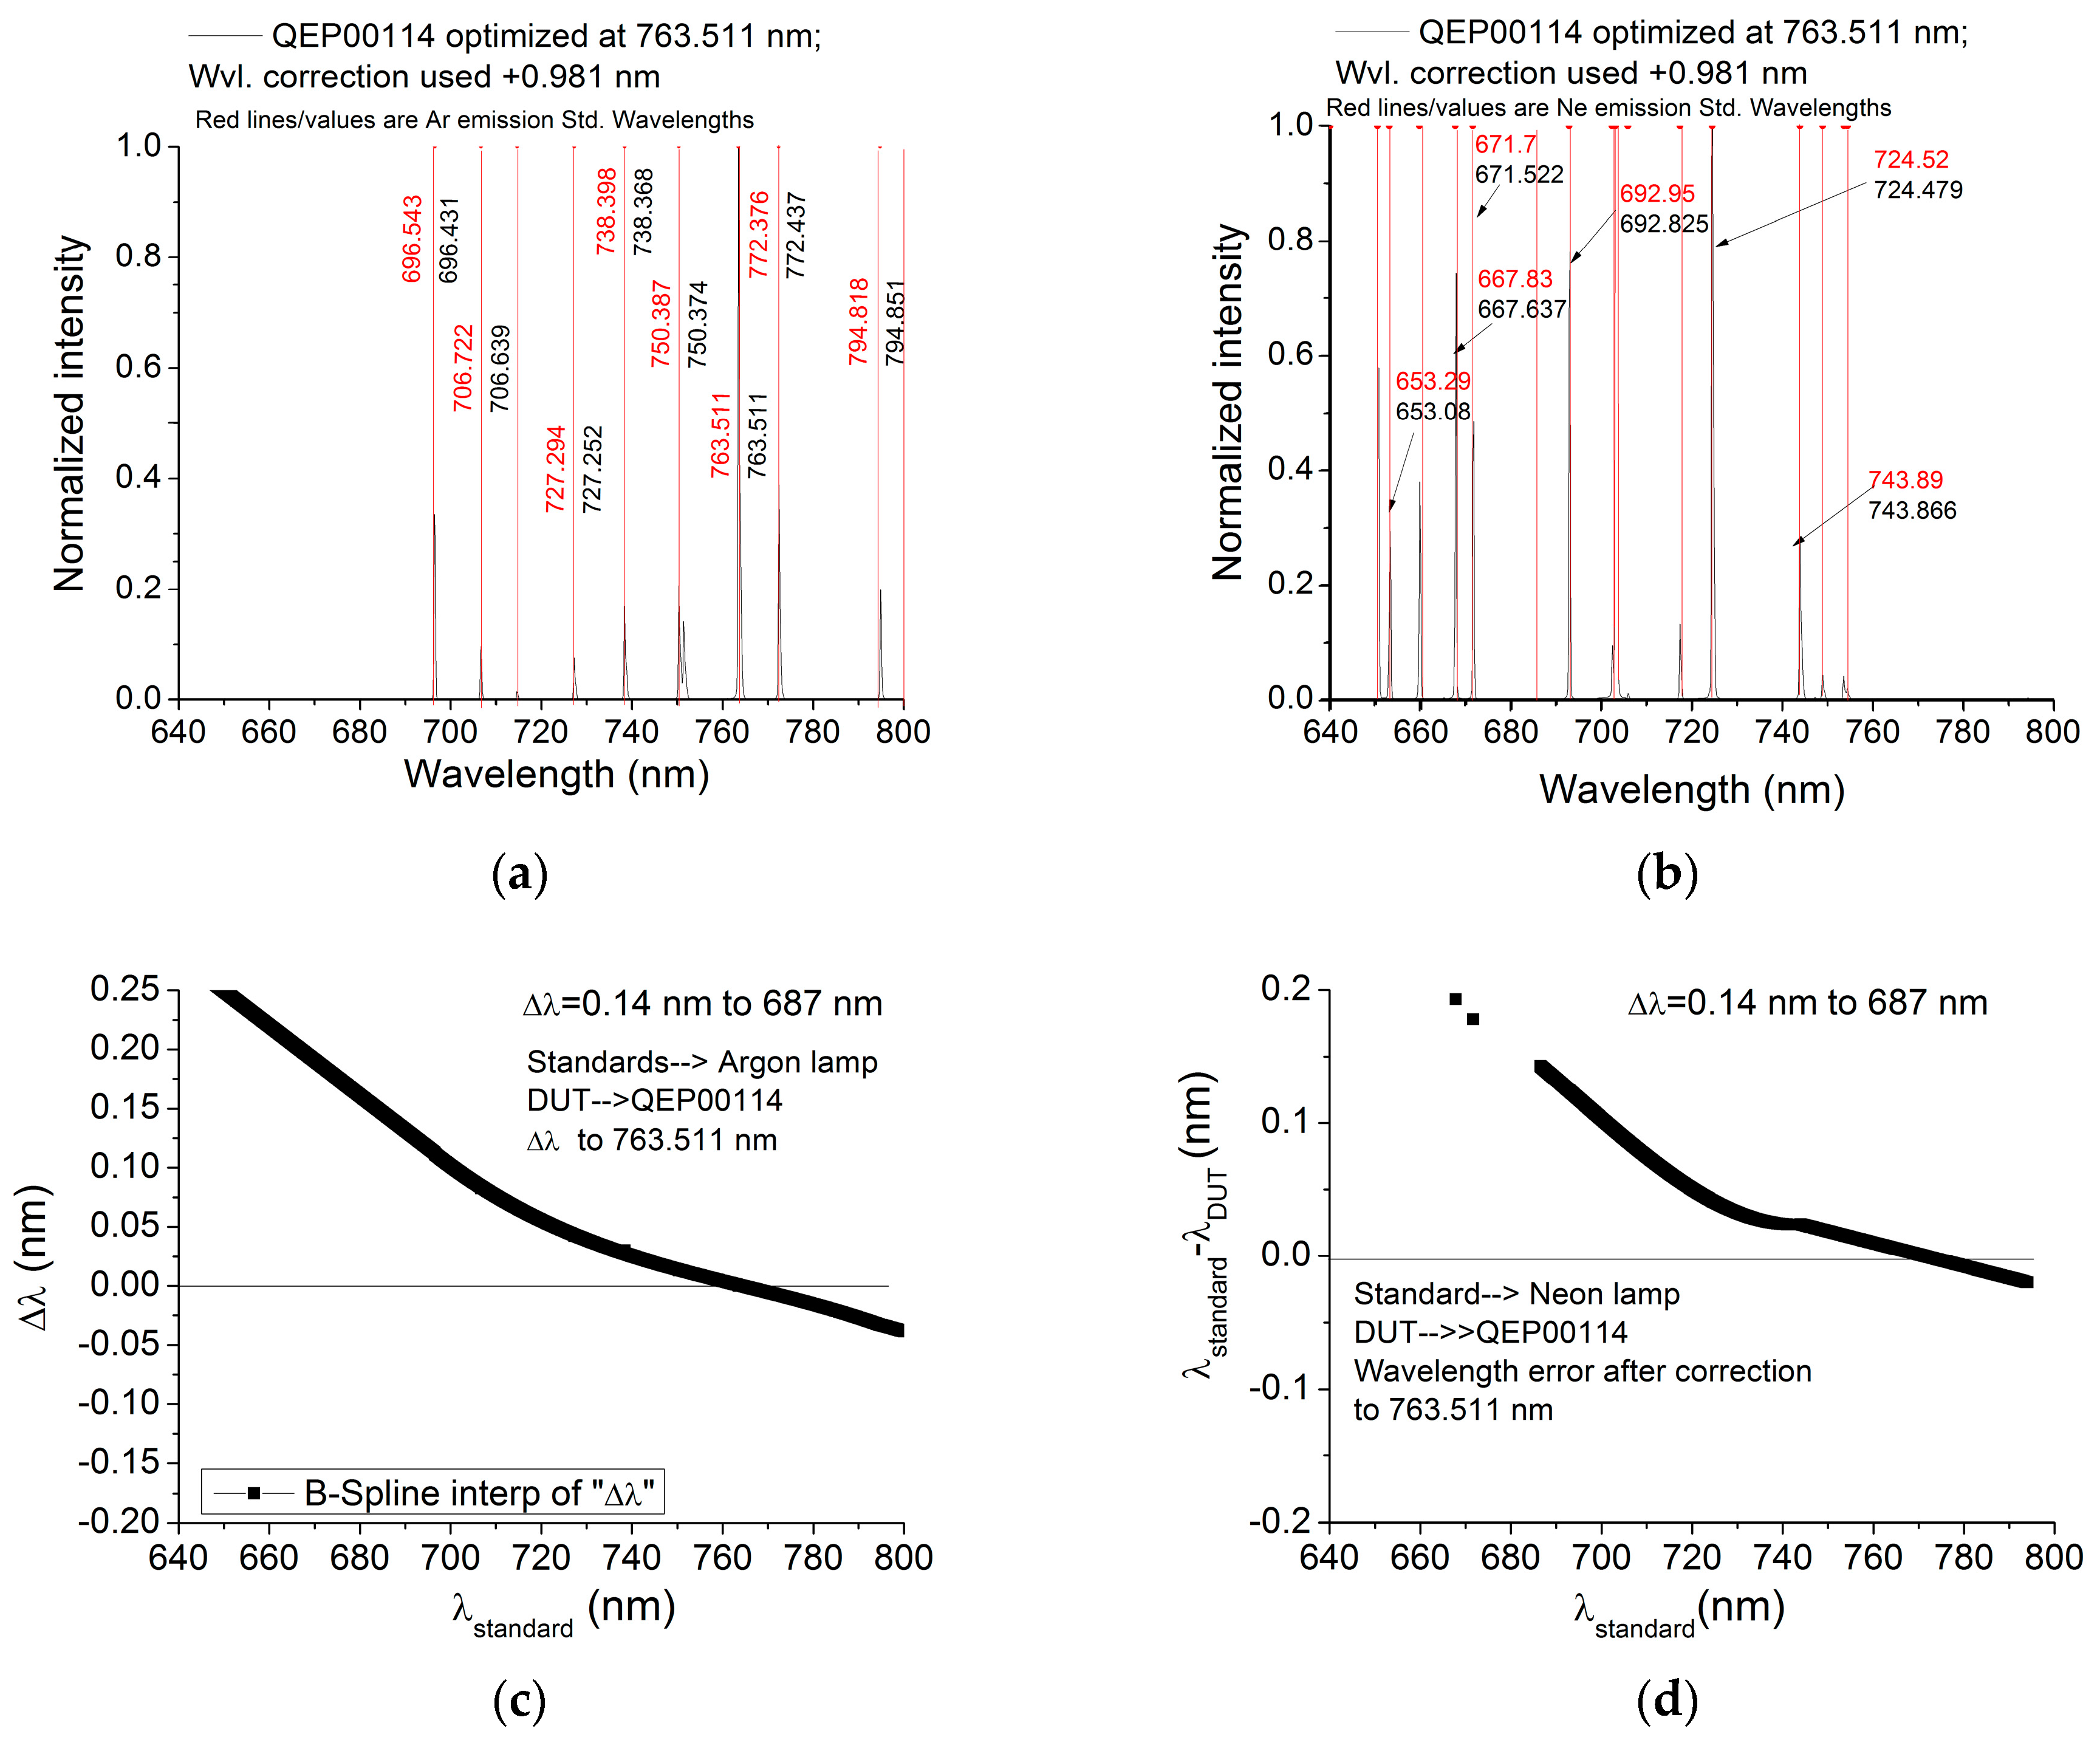
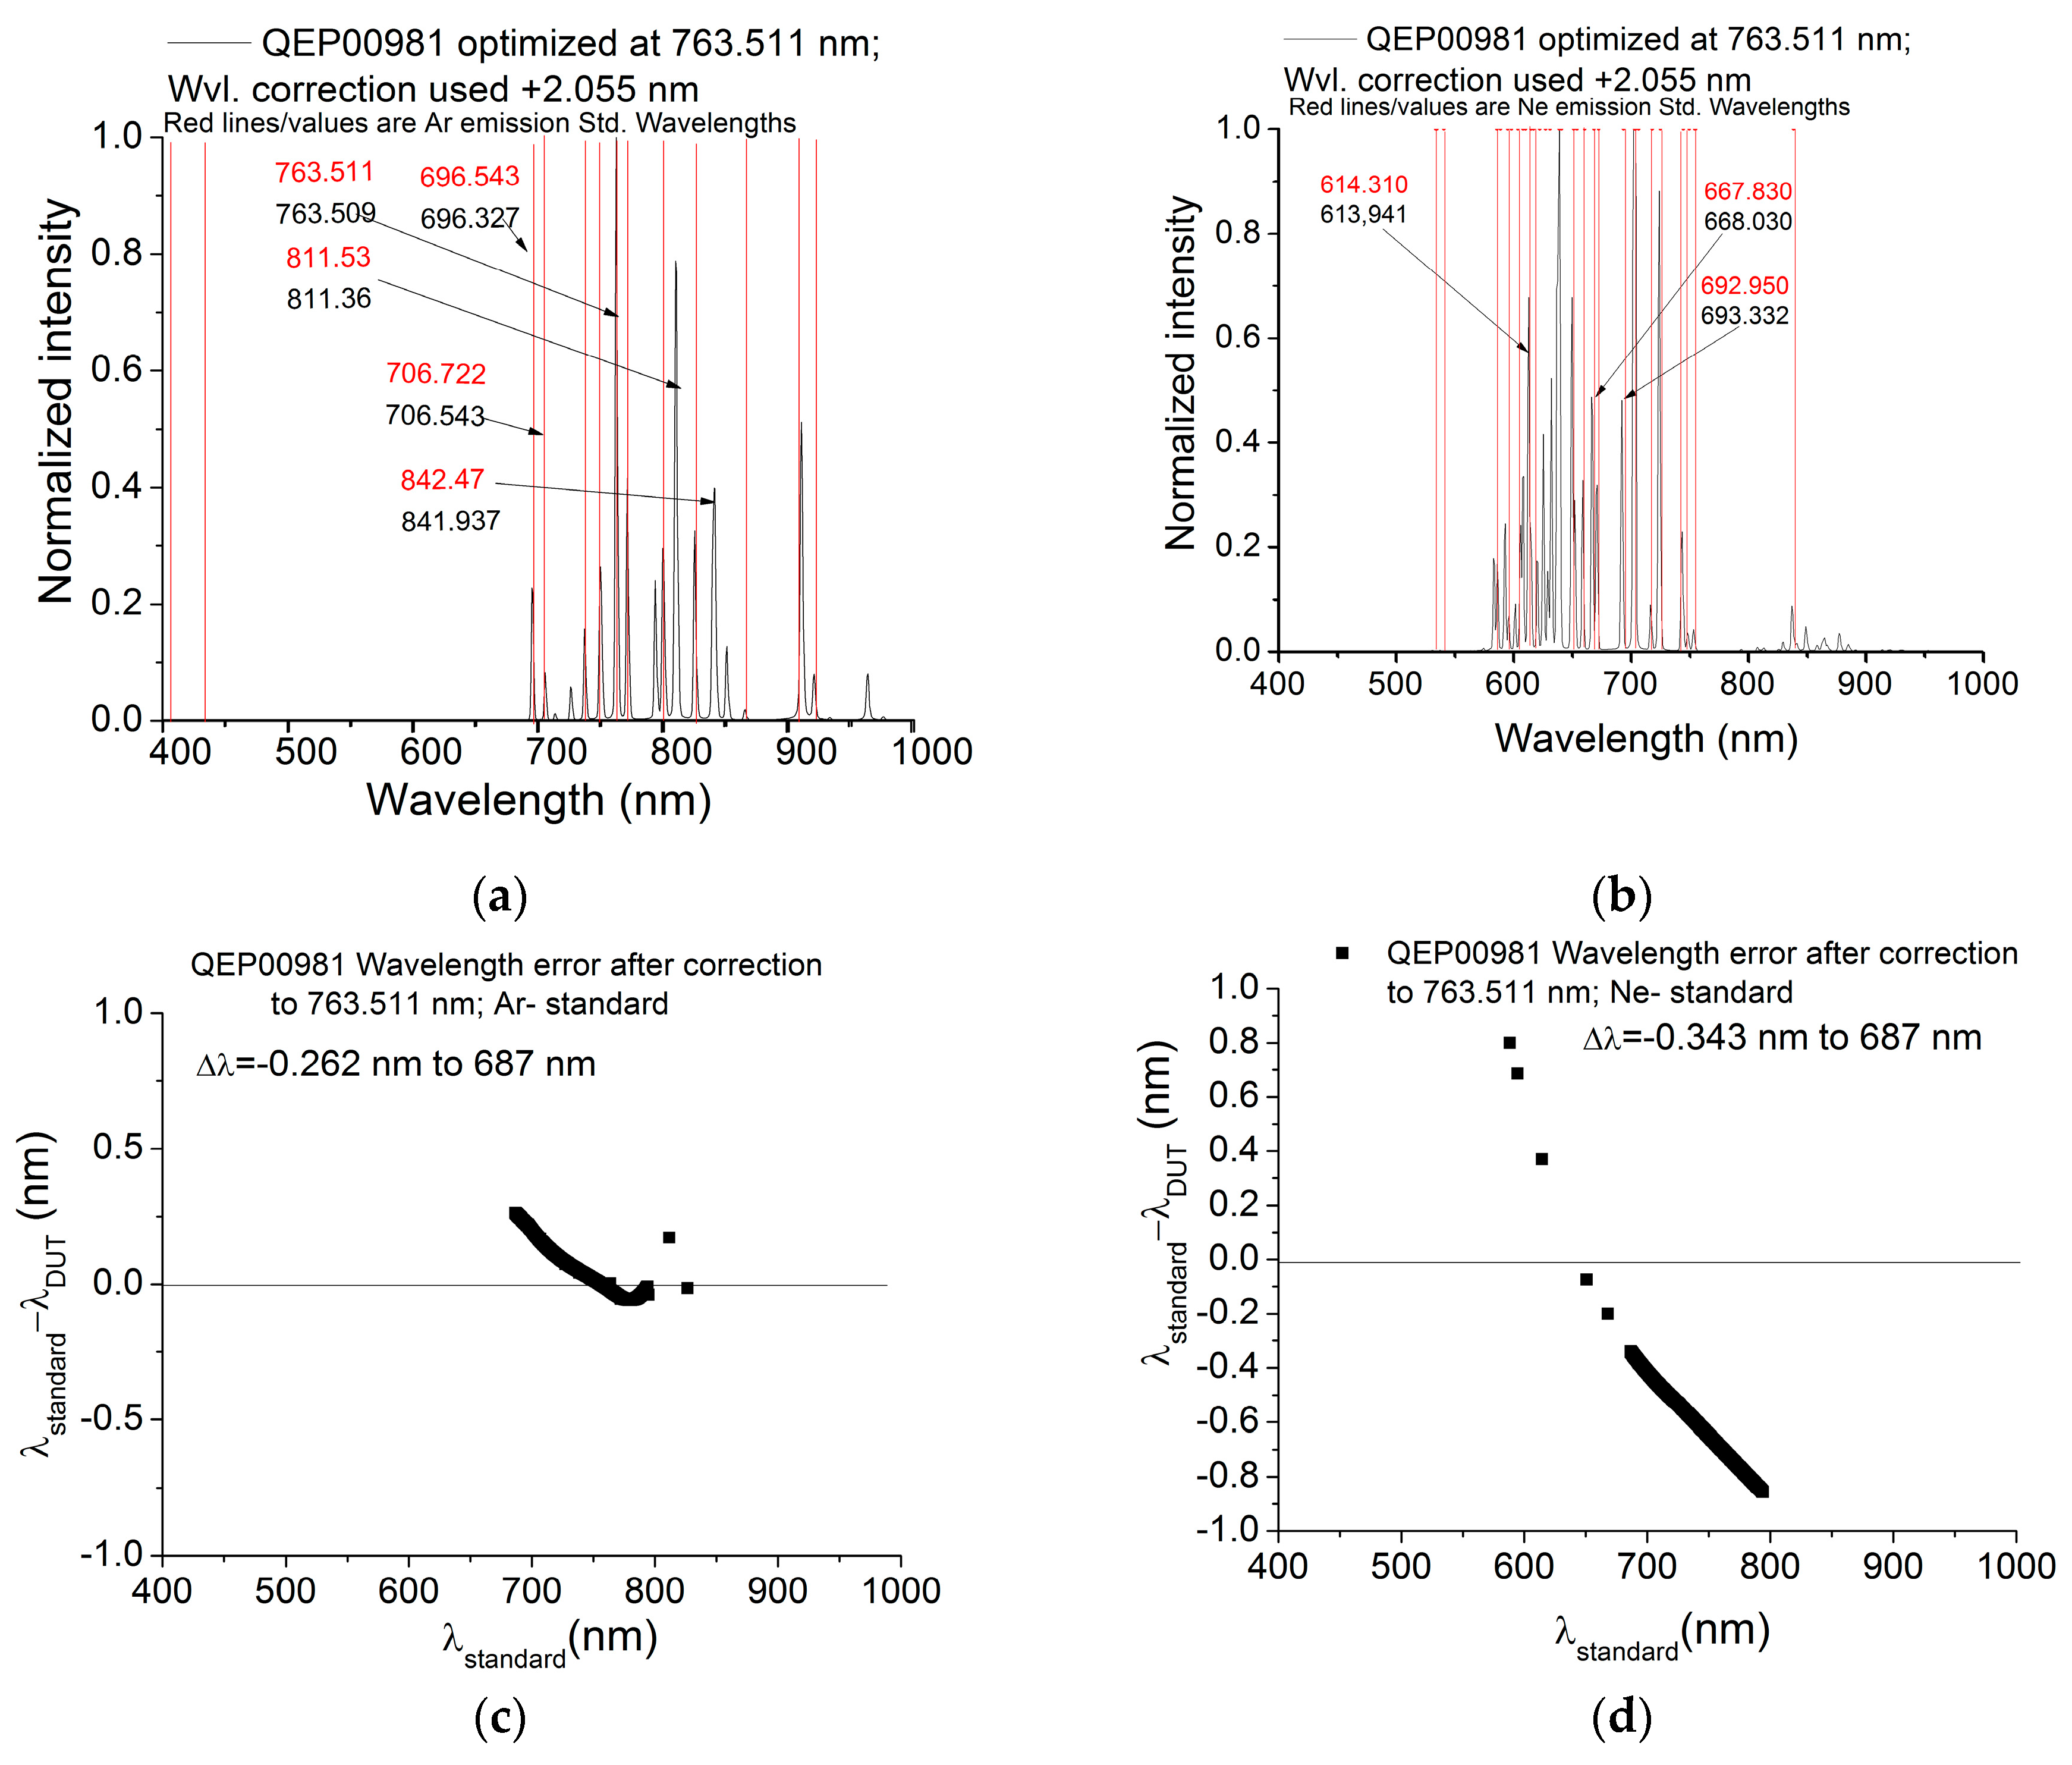
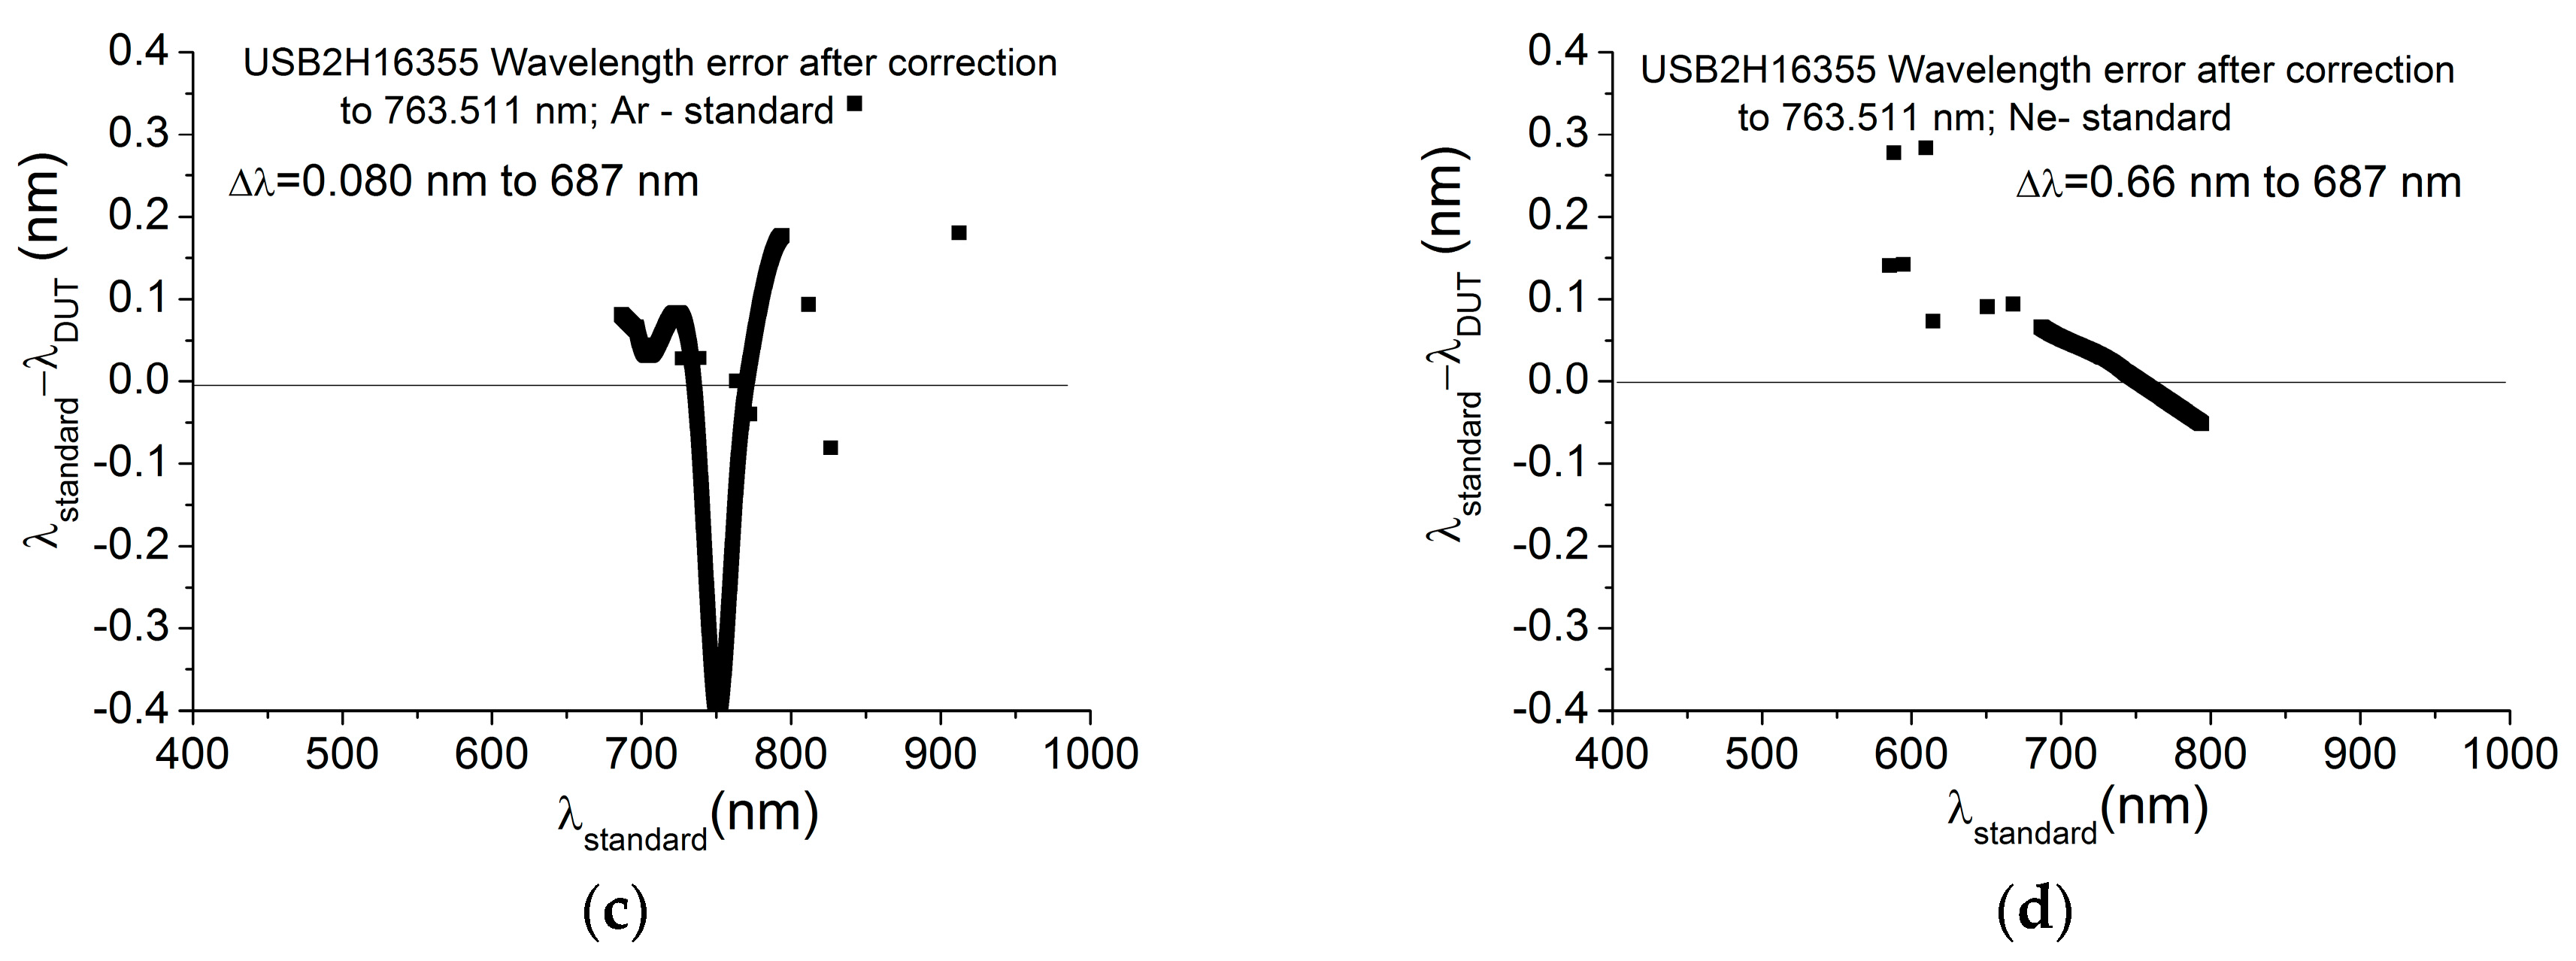
Figure 2. Consequentially, as the input geometry is different for each of these channels, each needs to have its wavelength calibrated. The spectrometers available for use with this system and investigated here are: (i) QE Pro spectrometer Serial Number QEP00114 (for fluorescence) with a 1044 × 68 2D pixel array measuring across the spectral range 640 nm–800 nm, providing a 0.15-nm sampling interval, and with a 10-µm slit, providing a 0.31-nm FHWM; (ii) QE Pro spectrometer Serial Number QEP0981 (for reflectance) with a 1044 × 68 2D pixel array measuring across the spectral range 400–950 nm and with a 25-µm slit providing around 2 nm FWHM; and (iii) USB2 + H16355 spectrometer (for reflectance) with a 2048 1D pixel array with a usable spectral range of 400 nm–950 nm, a 0.4 sampling interval and with a 25-µm slit providing around 1.5 nm FWHM. The QEPro 2D array pixel columns (68 pixels) are summed to provide an increased (200,000 usable counts) dynamic range. These spectrometers are provided by Ocean Optics (Dunedin, FL, USA) with a starting wavelength and a third order polynomial used to define the wavelength scale. The polynomial coefficients are generated from measurements of a Hg-Ag emission line lamp with light being transferred to the spectrometer by a single core fibre optic assembly. Due to a different fibre optic assembly geometry (a bifurcated fibre optic) being used to transfer light to the spectrometer when incorporated into the Piccolo system, a wavelength recalibration is required. The manufacturers of the Piccolo also use a Hg-Ar lamp. A wavelength offset for each channel of the bifurcated fibre is determined and applied to all pixels in the wavelength scale for that channel. Reports of this correction and an assessment of accuracies are then provided by the suppliers of the Piccolo system (
Figure 3 and
Figure 4 are examples) and demonstrate that the wavelength calibration of each channel of this system is the same; hence, there are no wavelength dependencies imposed by the downwelling channel cosine-corrected diffuser.
However, it should be noted that neither Hg-Ar lamp nor argon (Ar) lamps available for this study have usable emission lines between 650 nm and 696 nm. Therefore, the accuracy of the wavelength calibration at the 687nm O2-B absorption feature cannot be verified by this method.
This paper investigates alternative methods of wavelength calibration. It presents the results obtained from testing the double monochromator performances in multiple configurations, as well as the measurements of a neon (Ne) pen-type emission source, compared to an Ar source. The advantages and disadvantages of these two calibration methods are then discussed and conclusions presented.
2. Methods
The aim of our study was to identify the best practice related to wavelength calibration of high-resolution (narrow FWHM and high sampling interval) spectrometer systems across the telluric O2-A and O2-B bands using two different methods. As the wavelength calibration for each channel has been demonstrated to be the same (
Figure 3 and
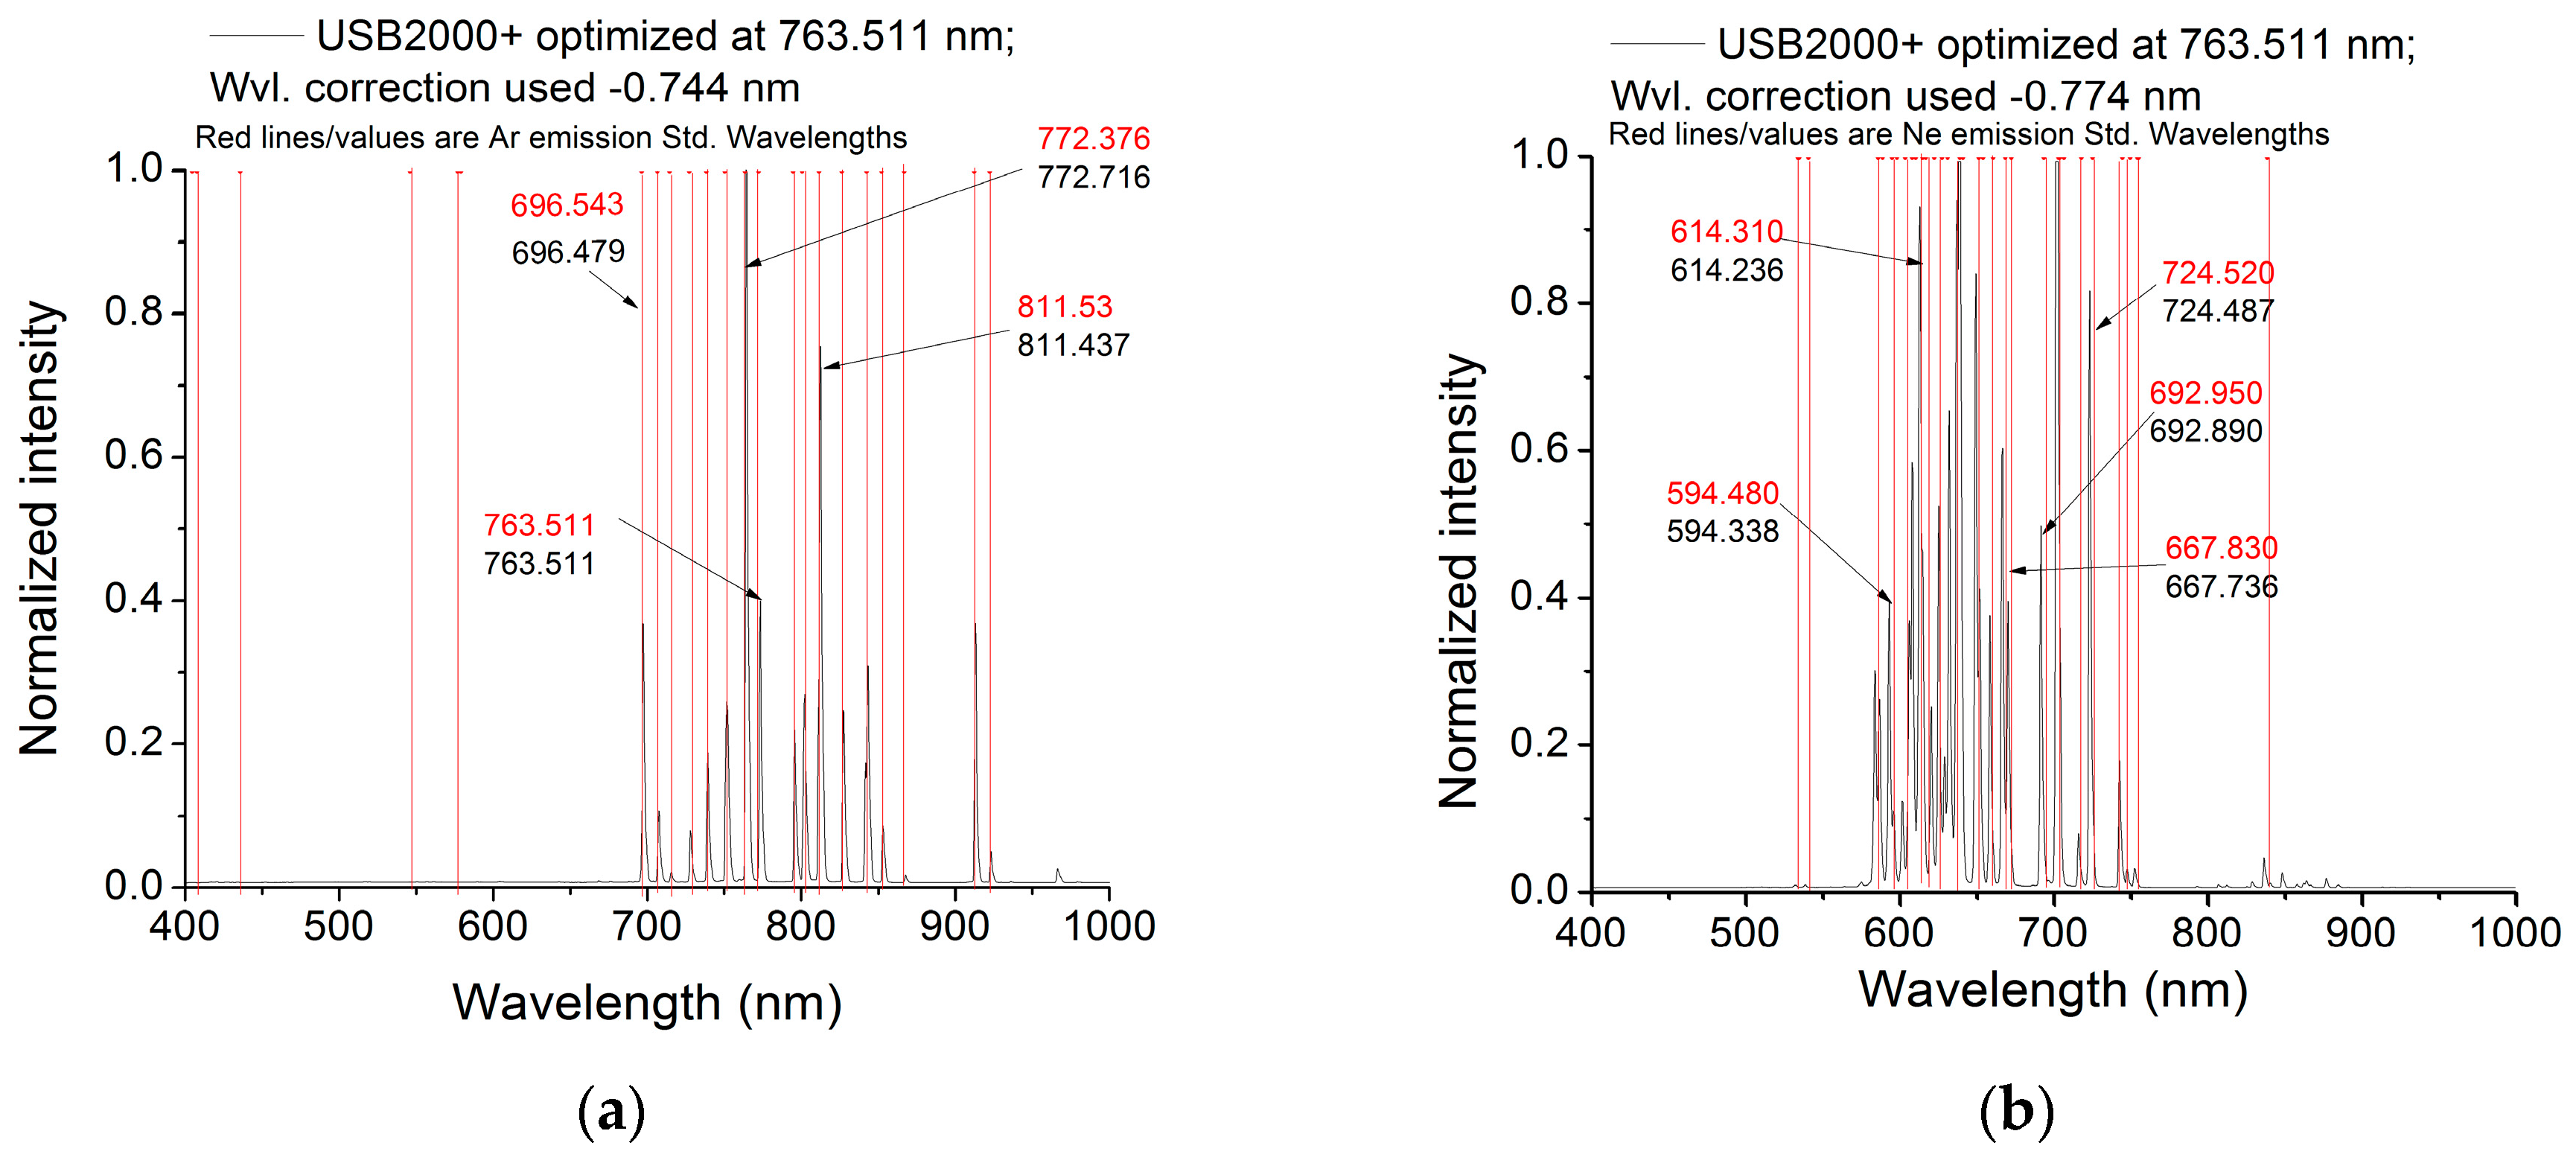
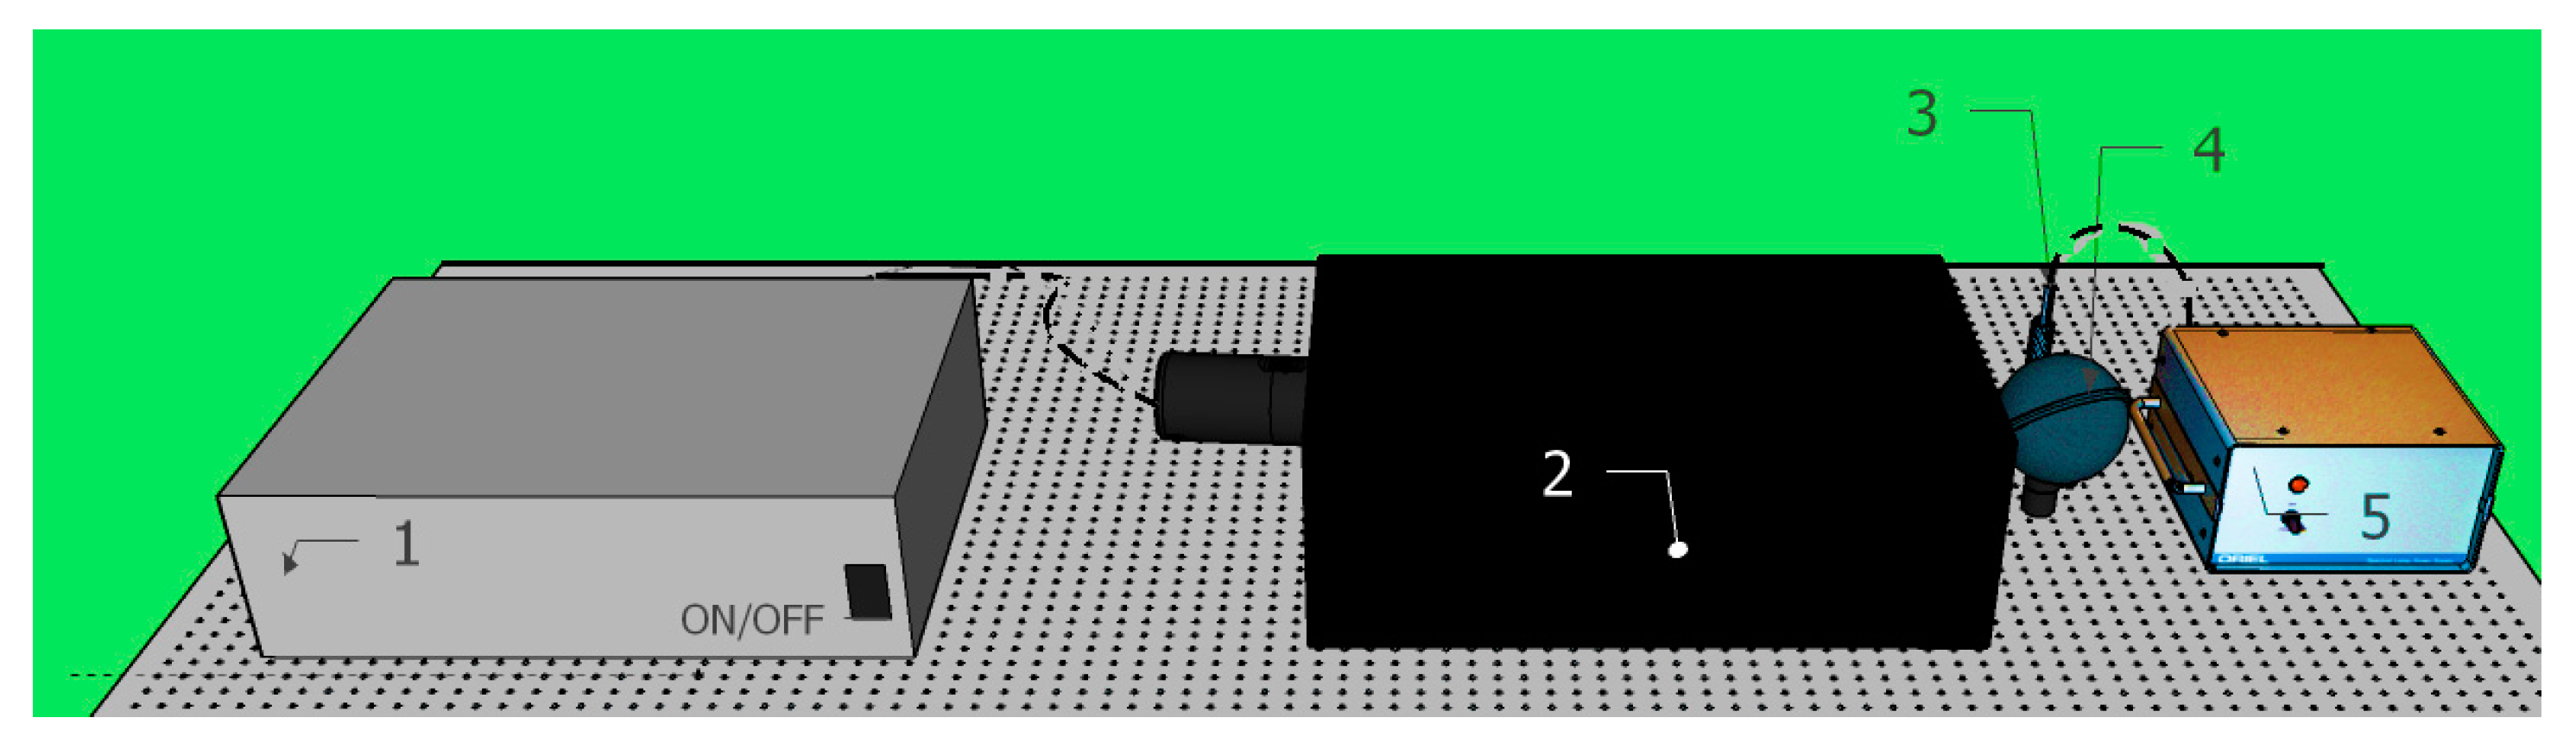
Figure 4) and as this work concerns methods rather than an absolute calibration, only one channel was investigated for each of the spectrometers. For the first approach, an Ar lamp was used, and the wavelength scale offset was determined in the same manner used by the Piccolo suppliers. For the first approach, each spectrometer (Serial Numbers QEP00114, QEP0981, USB2 + H16355) were incorporated into the Piccolo system and calibrated using an Ar lamp. Then, a Ne lamp was employed to assess the accuracy of this calibration at wavelengths closer to the O2-B absorption feature. The Ar lamp has more intense emission lines around 763 nm, and the Ne lamp has intense emission lines below 700 nm. These light sources are characterized by very narrow (line width below 0.001 nm), intense and stable lines (important when calibrating high spectral resolution systems) produced by excitation of metal and gas vapours, having traceability to NIST standards [
29,
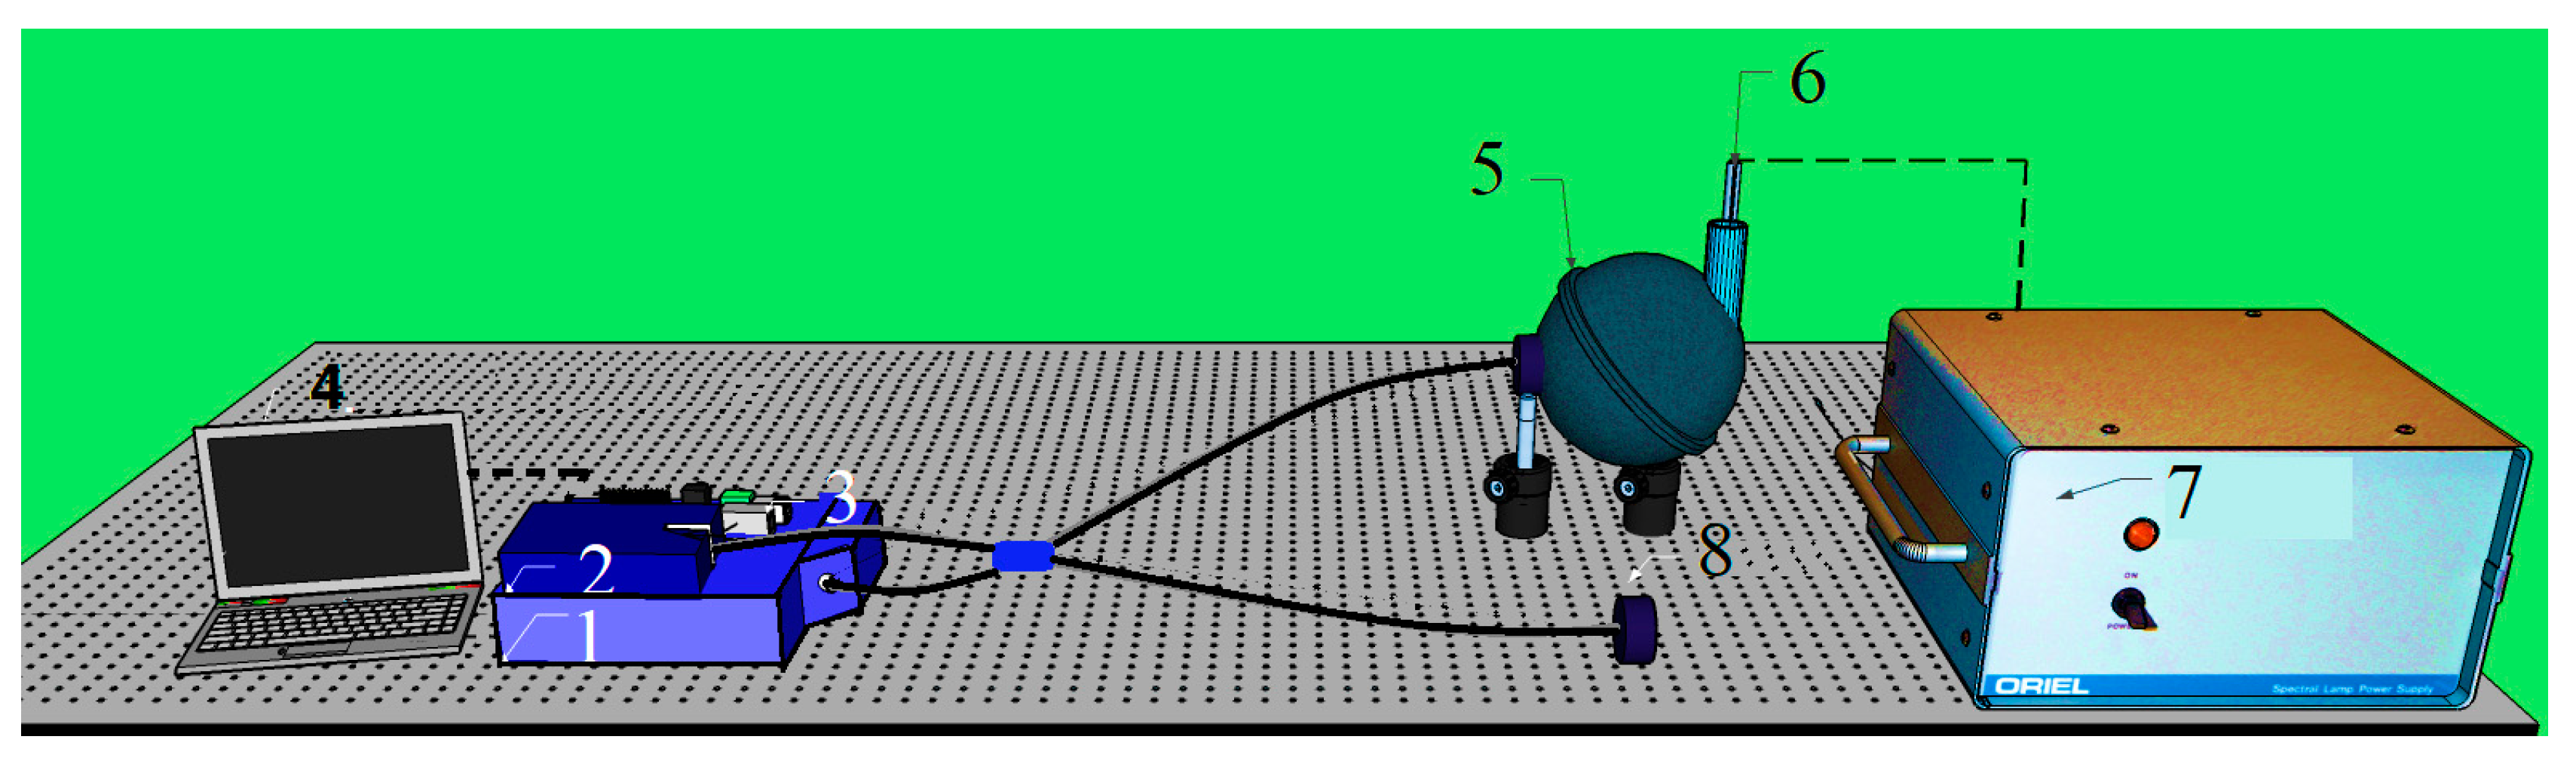
31]. The light from the gas lamps illuminated uniformly (through a 6” integrating sphere) one of the bifurcated optical fibre channels. First, the integrating sphere illuminated the fluorescence spectrometer (QEP0114) through the cosine-corrected fore optic, keeping the other fore optics covered with a dark coating. After that, reflectances spectrometers (QEP0981, USB2 + H16355) were illuminated using the view angle-limited fore optic, and the cosine diffuser was covered. Each optical fibre system input was aligned to the integrating sphere output using an optical fibre adapter (manufactured by an engineering company for this work) so that the light was normal to the optical fibre input. Ninety spectra were collected for each spectrometer test, with the integration time depending on the characterized system: 200 ms for QEP0114, 3 ms for USB2 + H16355 and 10 ms for QEP0981. All data were dark current corrected. The setup used for this method is represented in
Figure 5.
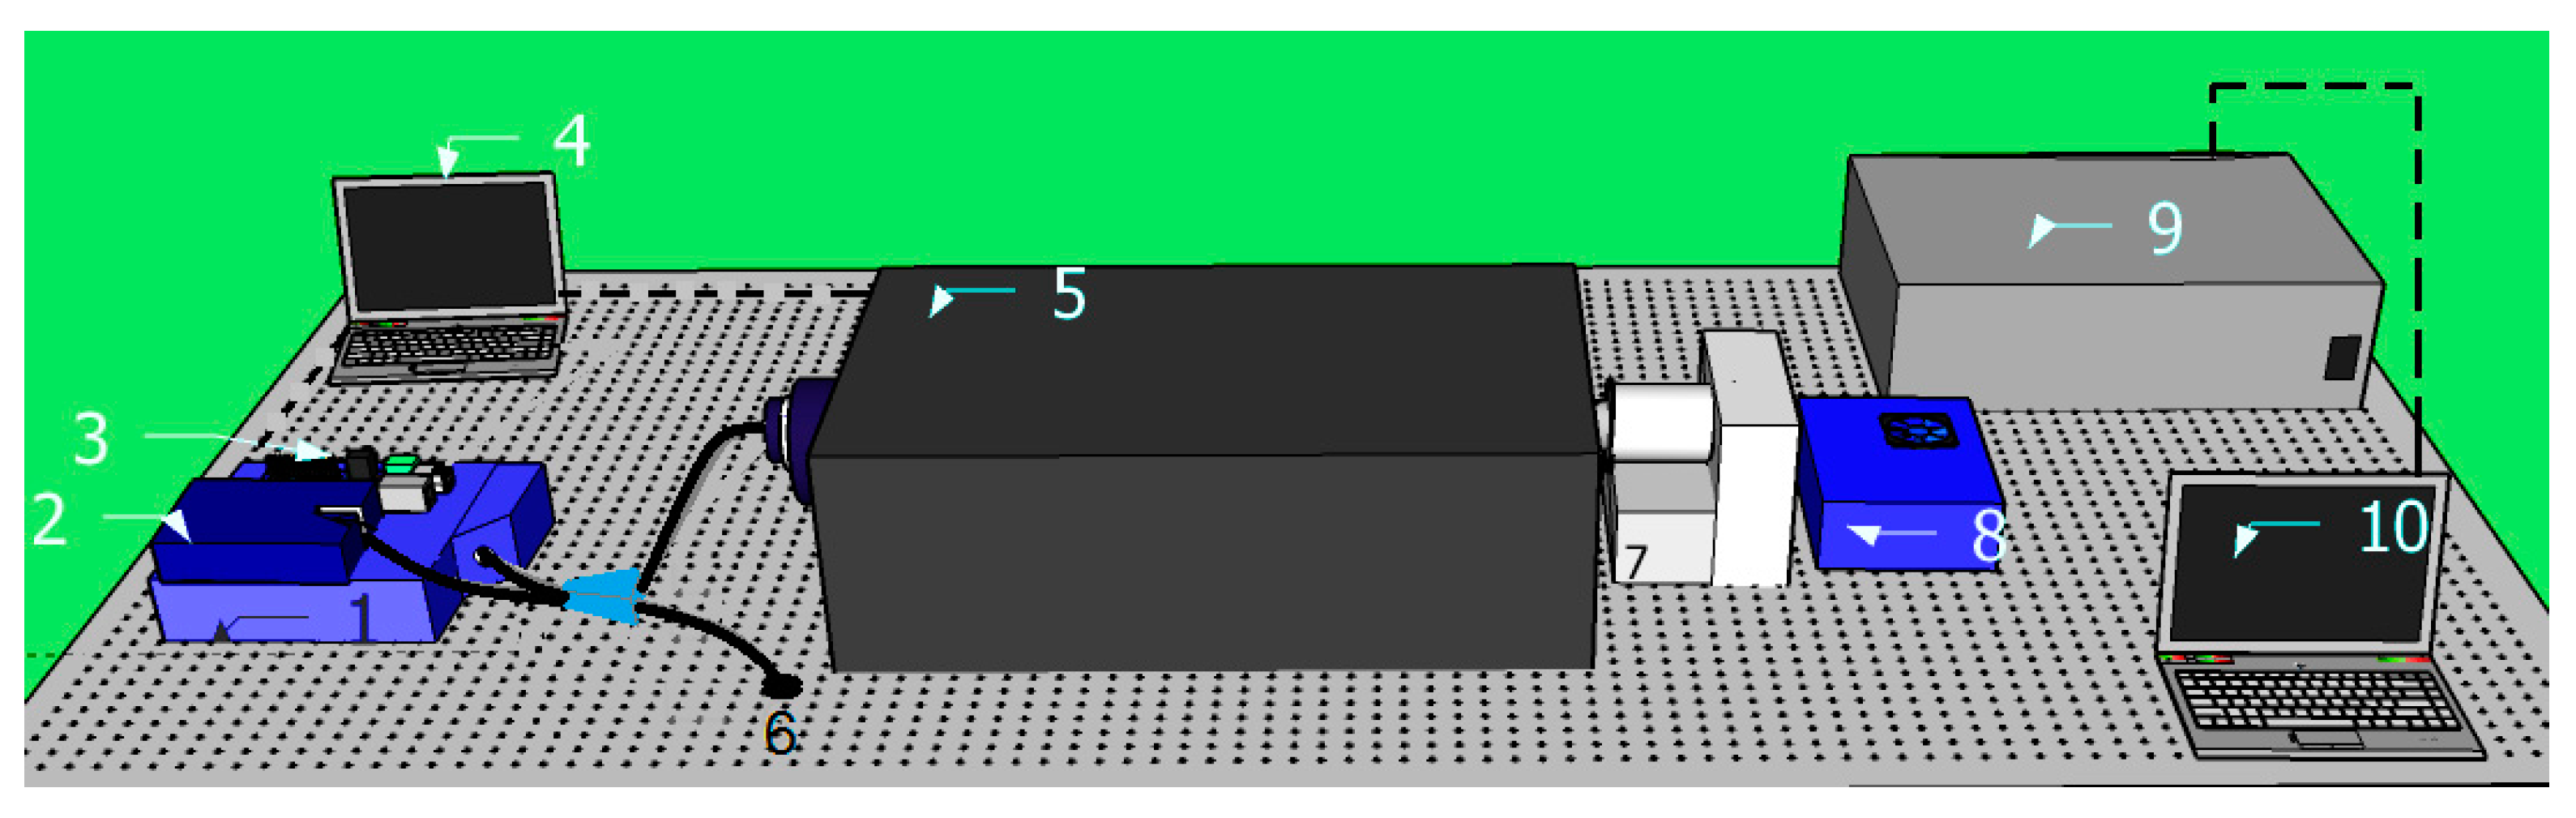
The second method used as a wavelength standard is a high-efficiency grating double monochromator OL750D system from Gooch & Housego (Orlando, FL, USA). This system can be used as an emission source for wavelength calibration (
Figure 6), or it can be used as a detection source to measure light, when combined with a detector. As the standard, this laboratory instrument can provide monochromatic light from 200 up to 800 nm with a nominal mechanical resolution of 0.05 nm and tuneable full-width half-maximum below 0.25 nm (with the standard configuration: slits of 0.125 mm, diffraction gratings 1800 grooves/mm, 0.5-µm blaze, FWHM of 0.15 nm, tungsten lamp). However, the OL 750D used in this study had been modified by the Field Spectroscopy Facility at the University of Edinburgh in collaboration with Gooch & Housego and configured with a high intensity light source (EX-99X LDSL from Energetiq, Woburn, MA, USA) and 0.05 mm, 0.5 mm and 0.05 mm slit widths at the monochromator entrance, middle and exits, respectively. The 0.05 mm slit size was chosen for the entrance and exit to enable the spectrometers spectral response to be characterized at a FWHM of less than 0.2 nm. When mounting the optical fibre with proper optics at the monochromator exit, an accurate alignment has to be performed to reduce the errors due to setup geometry. The bifurcated optical fibre used to transmit the light to the spectrometer has two cores of different diameters (400 nm and 600 nm). These cores therefore need to be aligned with the slit (
Figure 2). For this work, after optimizing the optical fibre position to obtain the maximum signal at the spectrometer sensor, a precision engineered adapter with key to maintain alignment was used. The wavelength corrections for each spectrometer using this setup were determined as the difference between the wavelengths set at the monochromator controller and the spectrometers’ readings. Therefore, the three spectrometers were spectrally characterized for all wavelength values within the 686 nm–688 nm and 759 nm–769 nm spectral ranges, in steps of 0.05 nm. Similar to the calibration procedure using the pen-lamps, the light was guided to the fluorescence spectrometer through the cosine-corrected fore optic, keeping the other fore optics covered with a dark coating, and to the reflectance spectrometers through the view angle-limited fore optic, with the cosine diffuser covered (
Figure 6).
In order to improve the accuracy and reliability of the results, some preliminary tests to check the double monochromator system performances using different configurations were carried out (
Table 1,
Figure 7).
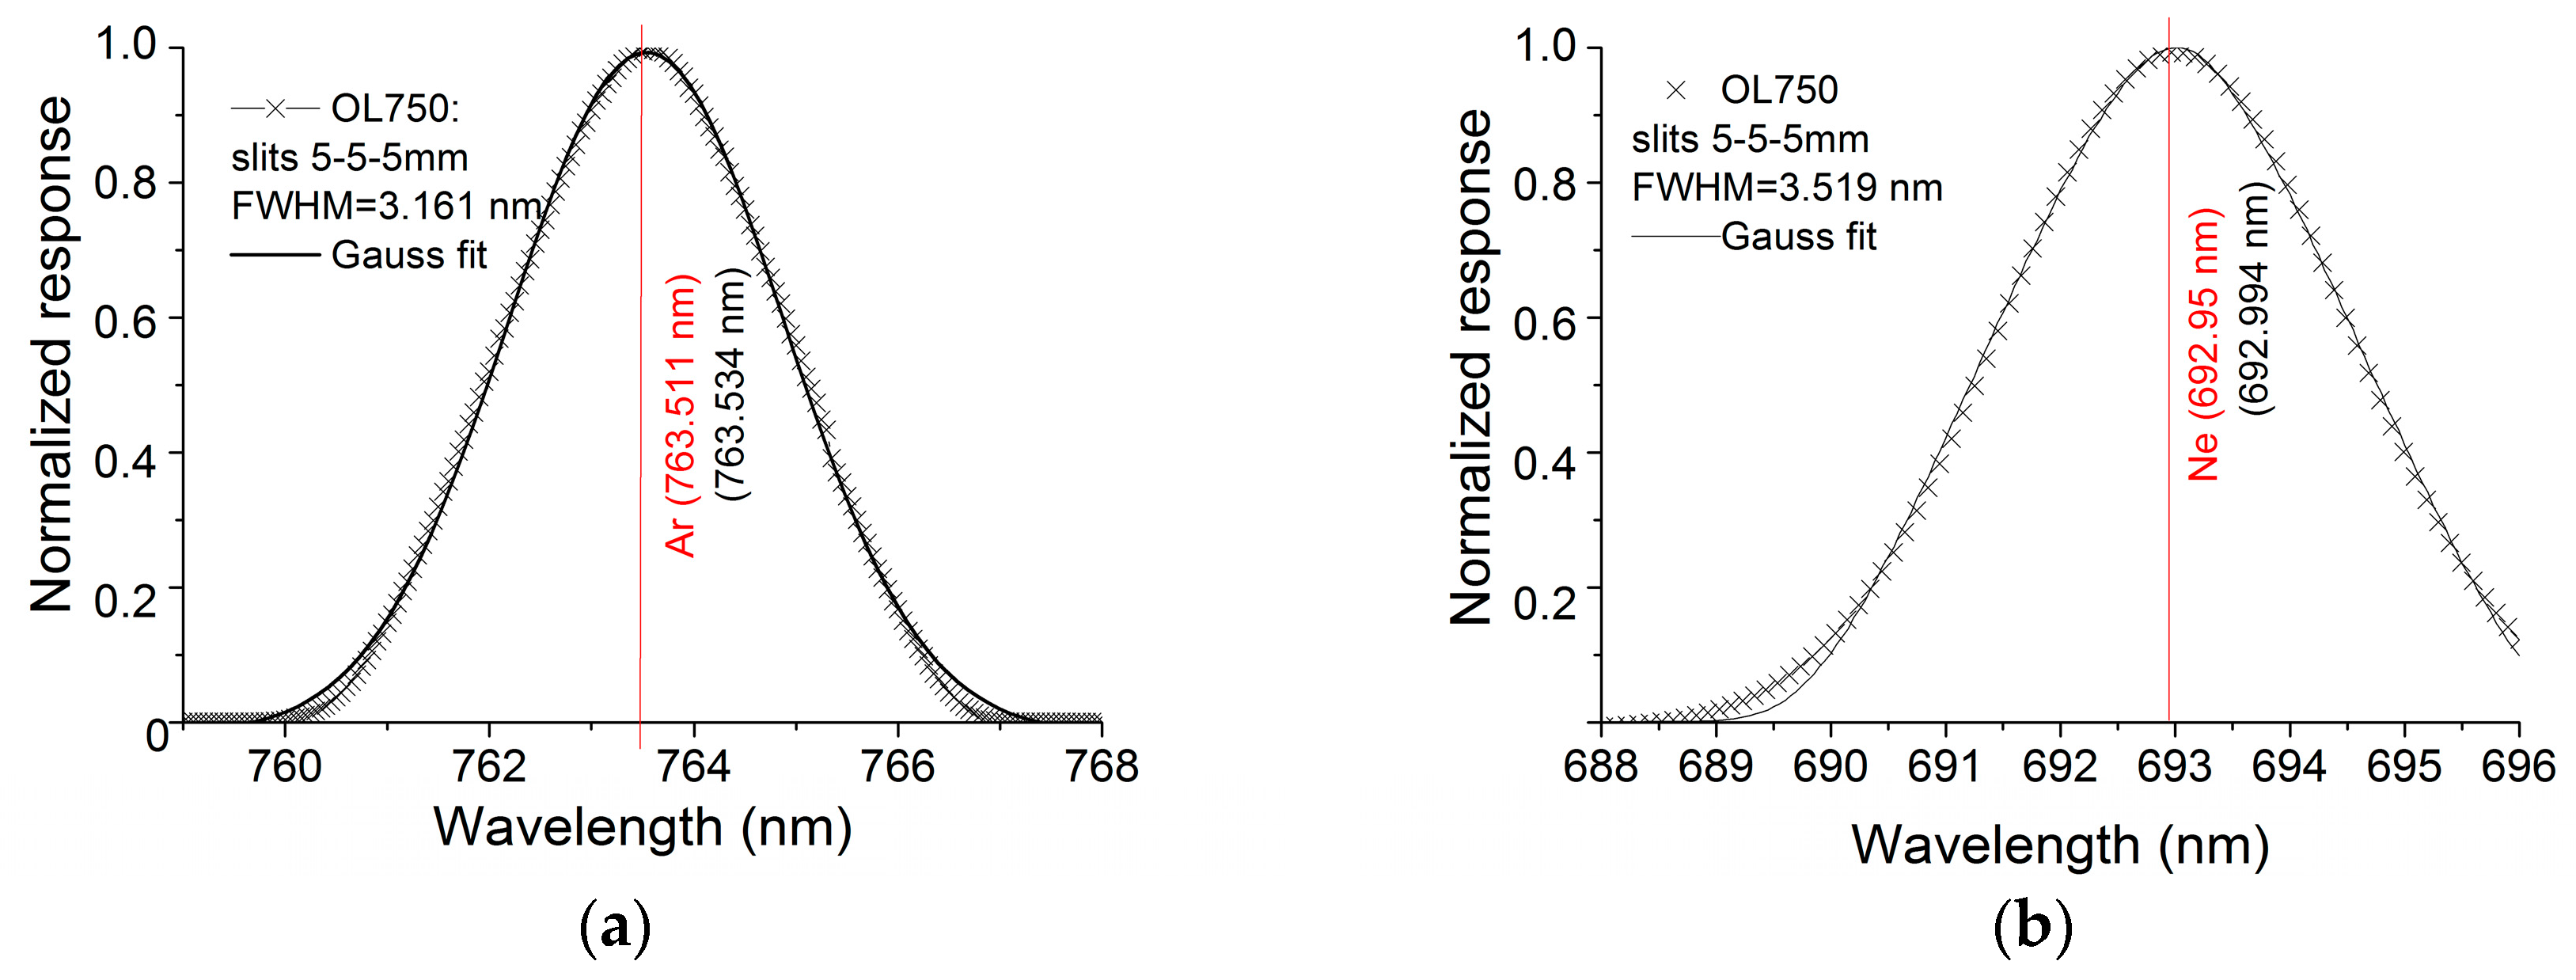
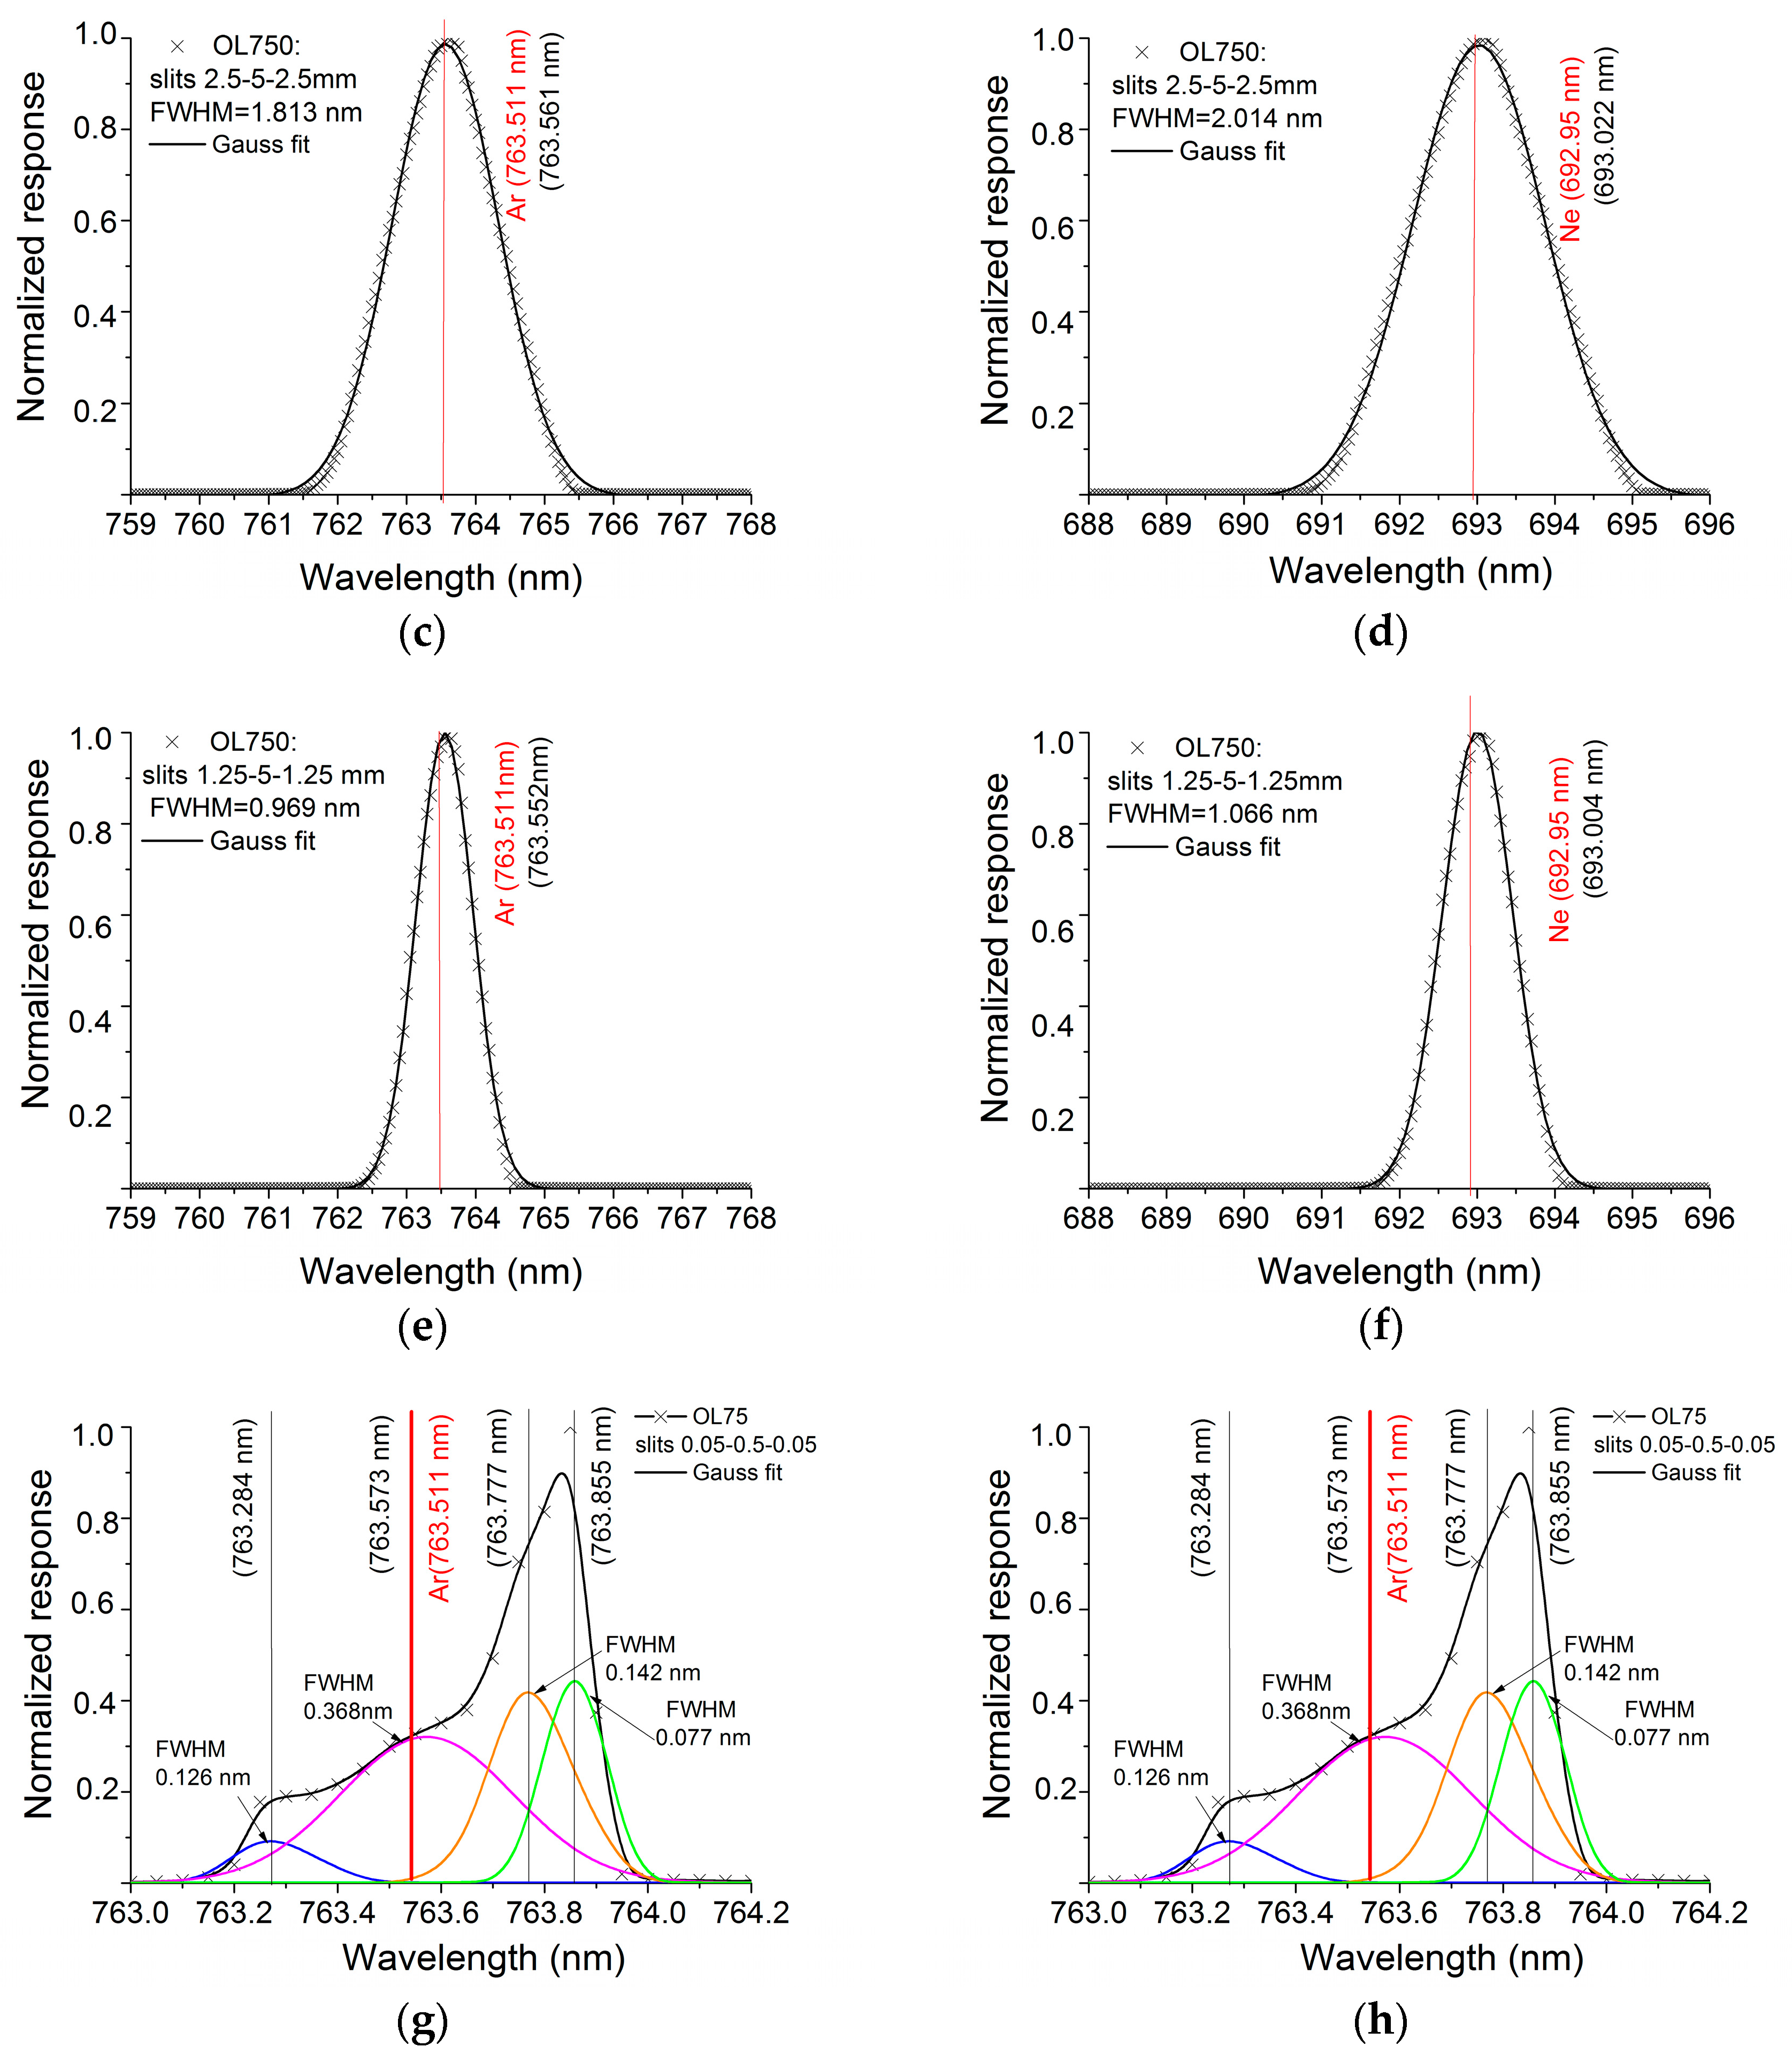
Because the OL750D is a configurable monochromator, its wavelength calibration, sampling step and FWHM also had to be characterized as part of this work. As the emission lines from the Ne and Ar lamps are well defined, these were used as sources to characterize the monochromator. The spectral response characterization was performed in all cases (spectrometers and monochromator characterization), applying to the measured spectral response a Gaussian fit (
Figure 8) defined in Equation (1):
Obtaining xc, the central wavelength, and the FWHM = sqrt(2 * ln(2)) * w, where w = w1/sqrt(ln(4).
The wavelength error was determined as the difference between the wavelength values corresponding to the Ne and Ar emission lines specified in the NIST database [
34,
35] and the centre wavelength obtained from the Gaussian fit applied to the measured spectral response using the field spectrometers. All wavelength correction values were obtained using the cubic B-spline interpolation function. This function splits data into multiple segments and fits each segment with Bezier splines [
36]. The results are presented in the section bellow.
4. Discussion
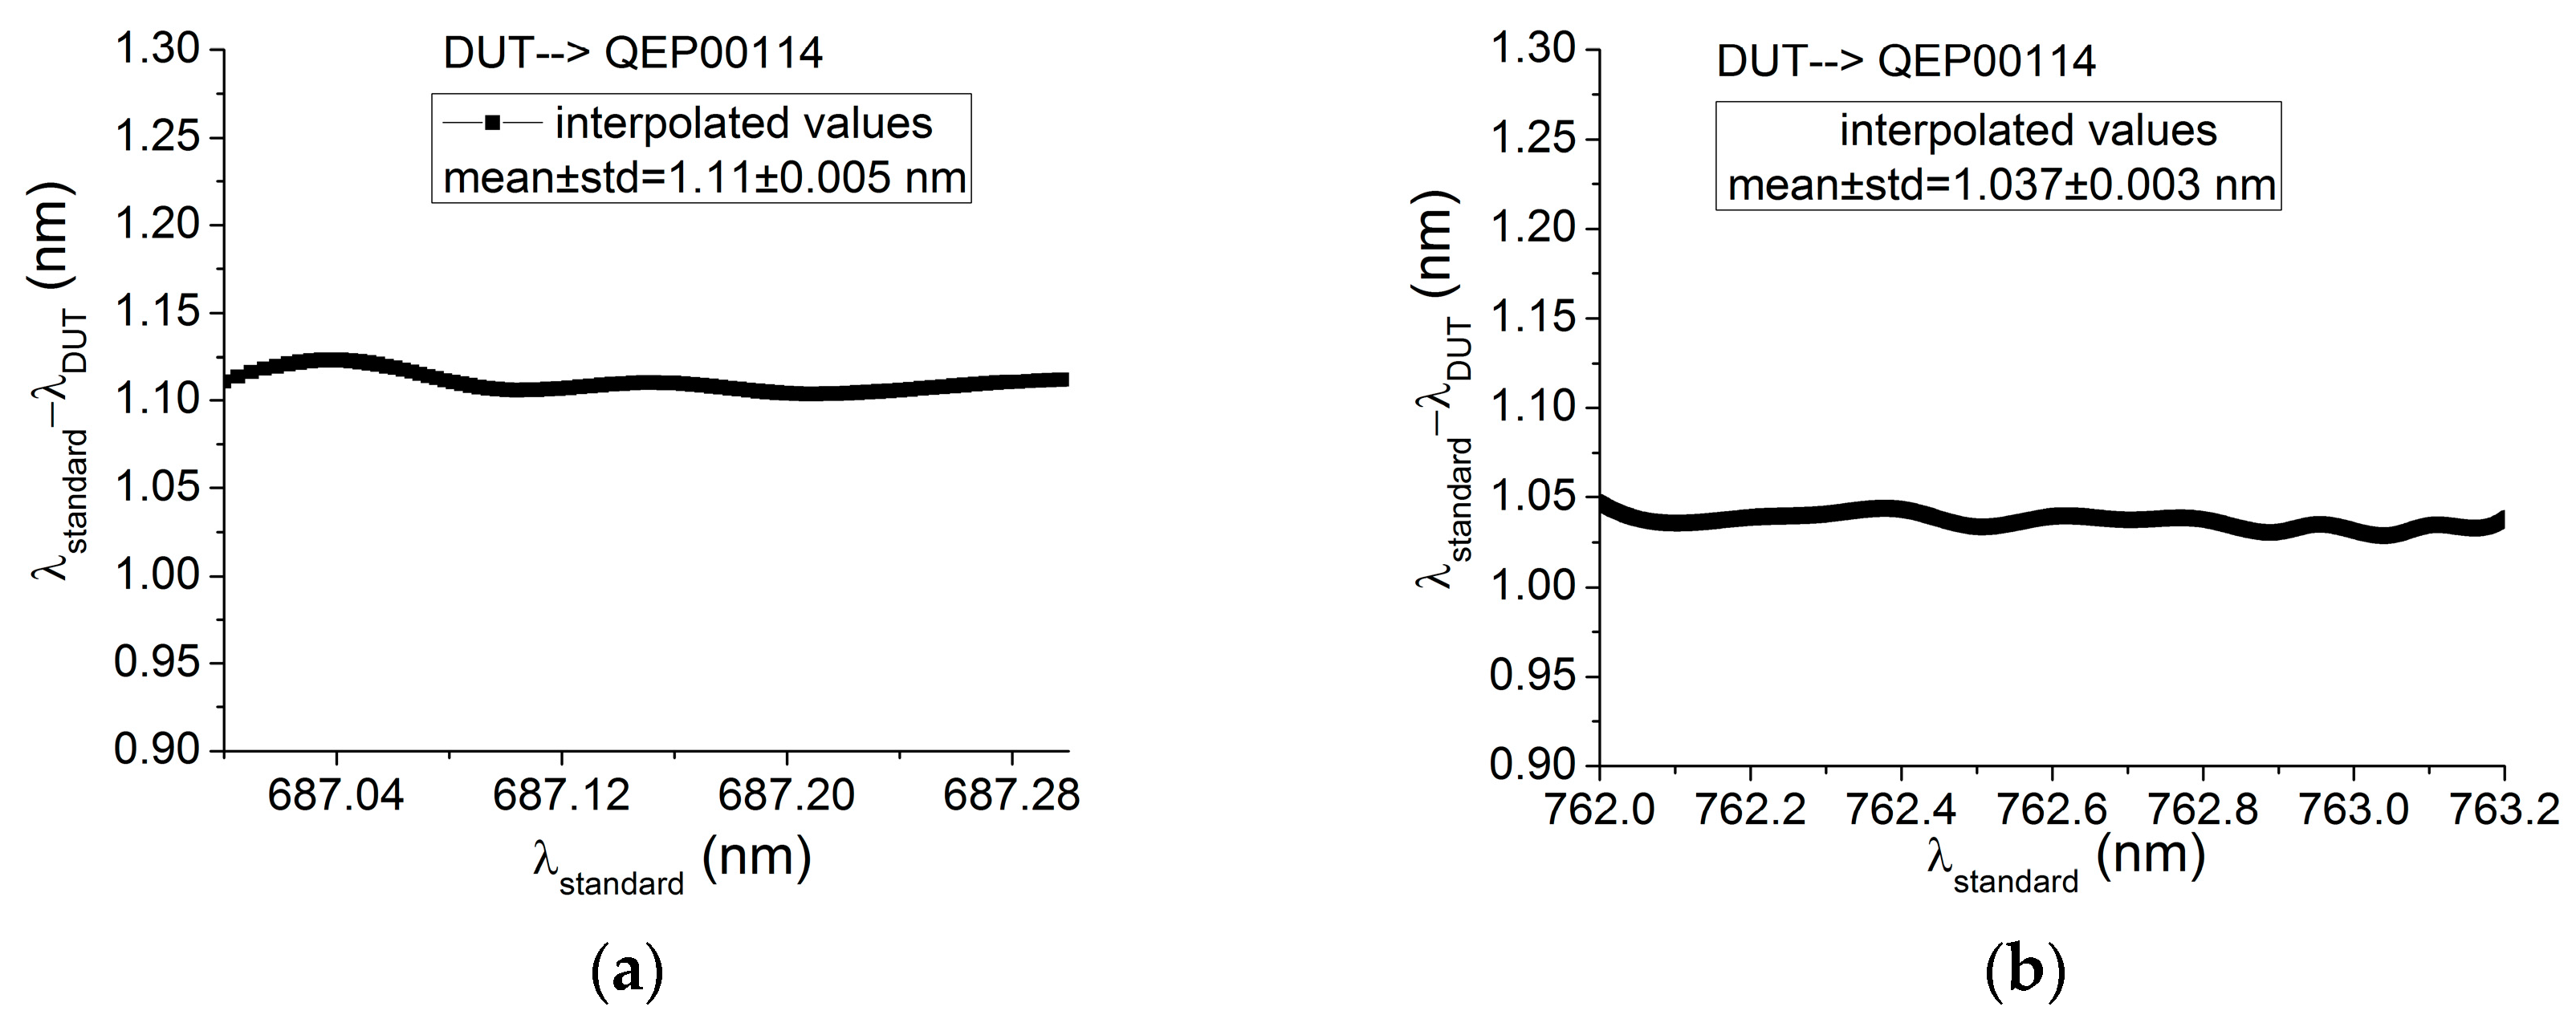
Two approaches have been used to assess the wavelength calibration and spectral response of three Ocean Optics spectrometers commonly used in fluorescence and reflectance studies. In the first case, emission reference lamps were used to optimize the wavelength calibration with the Ar emission lamp feature at 763.511 nm, the closest emission line to the O2-A absorption band. When using this correction, an error of 0.14 nm was noted for the QEP00981 spectrometer at the O2-B line centred at 687 nm, after data B-spline interpolation. For USB2H1635, the errors values varied within 0.4 nm over the entire selected spectral range and within 0.66 nm for the QEP00981 spectrometer.
To calibrate the wavelength scale of their spectrometers, Ocean Optics recommend using a third order polynomial fit to establish the relationship between a number of pixels and the emission lines of a Hg-Ar lamp [
37]. This polynomial is then used to predict and assign a wavelength value to all pixels. From this process, the difference between the predicted wavelengths and the reference emission source wavelengths can be determined. The errors at each of the emission line wavelengths can then be tabulated and, as the example in [
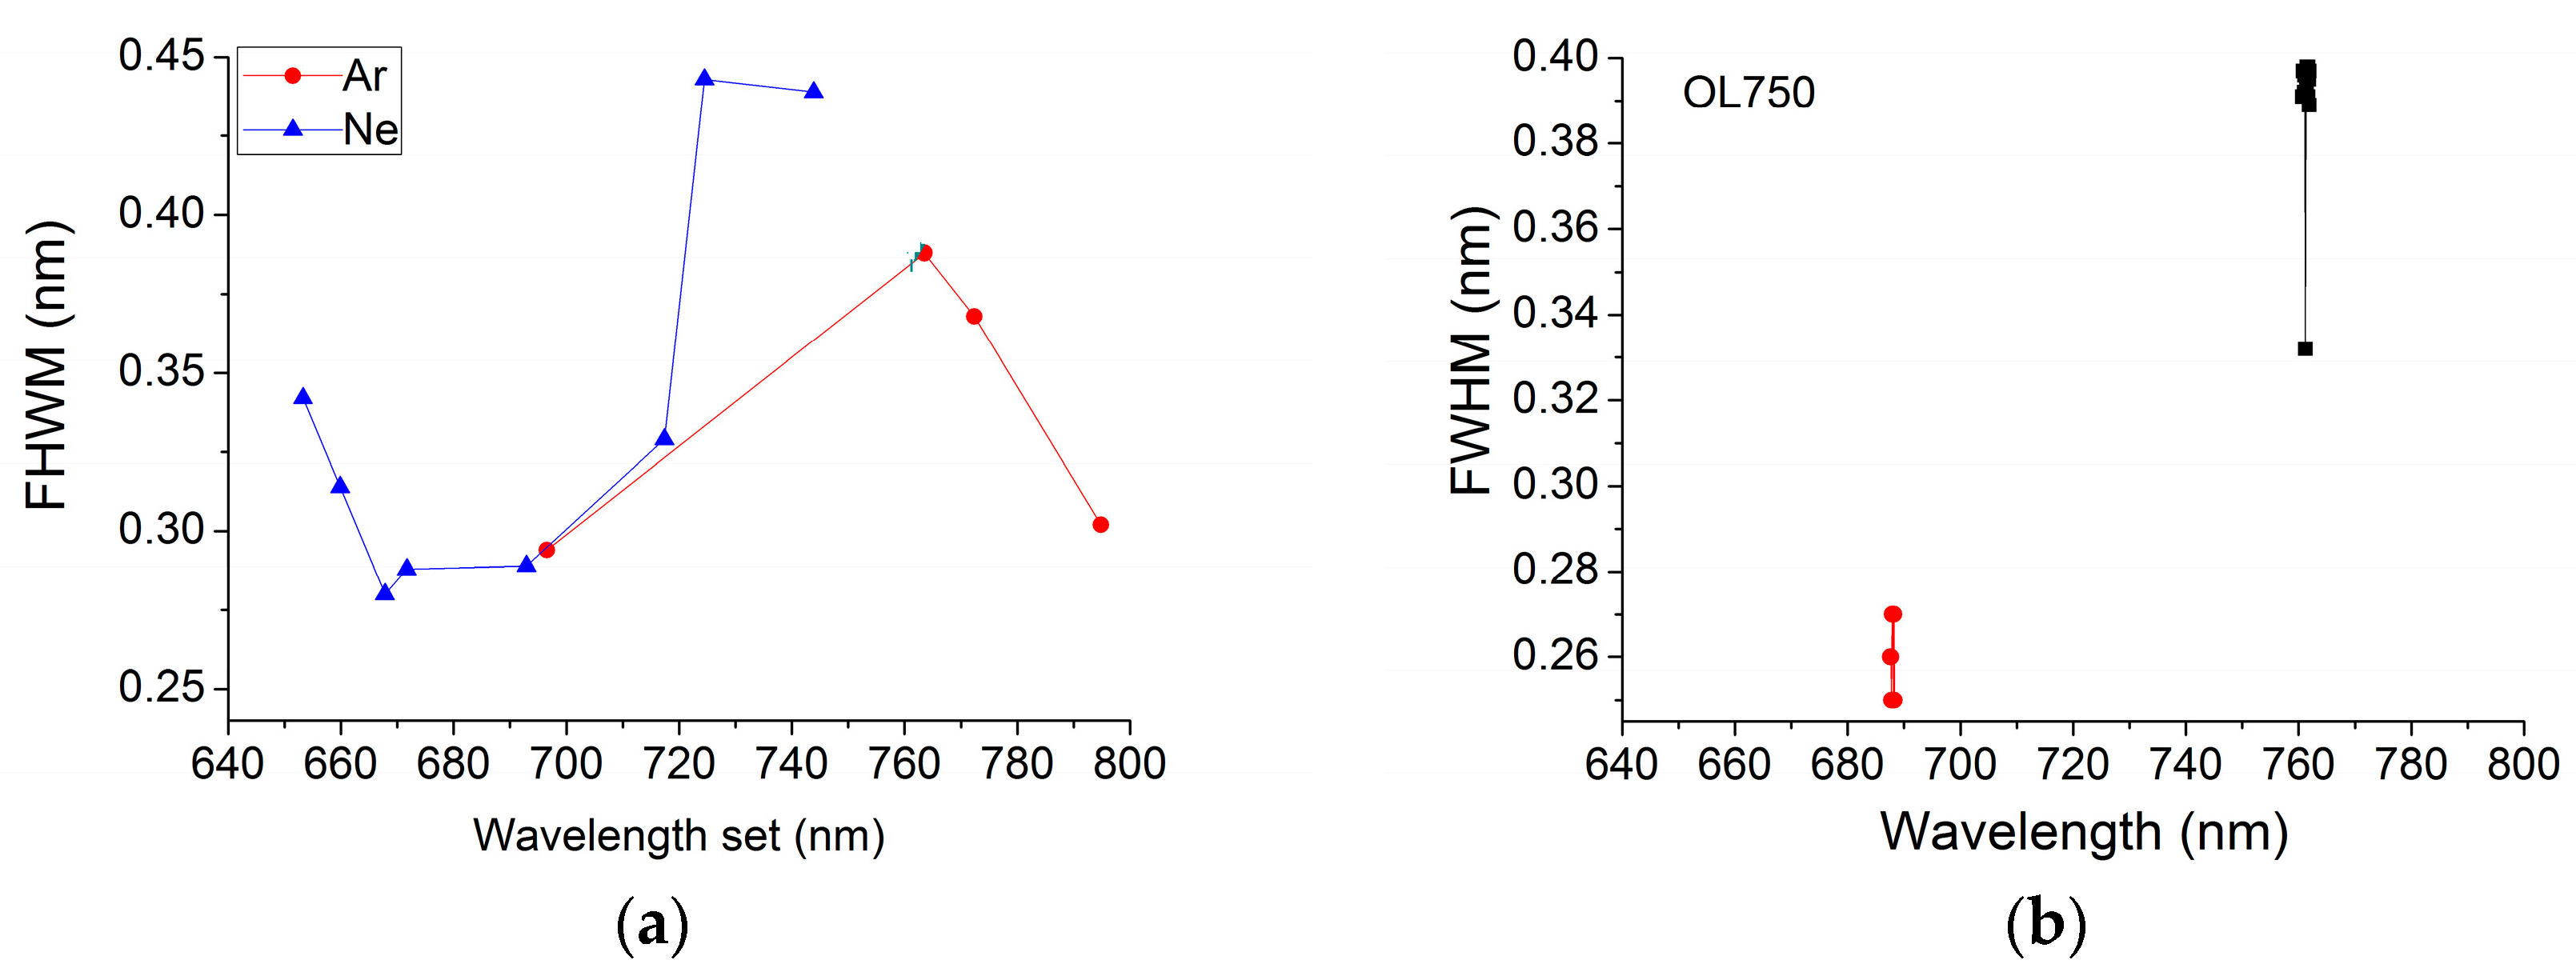
37] shows, can be seen to be distributed across the spectral range of the spectrometer where emission lines are present. However, for spectrometers for fluorescence investigation having a spectral range in the spectral range from 640 nm–800 nm, few Hg-Ar or Ar emission lines are present. The polynomial derived will therefore be less accurate as there are fewer points to determine the fit. The polynomial also does not optimise the calibration at or near the wavelengths of interest for these fluorescence studies, but distributes the calibration coefficients across the entire spectral range of the spectrometer. By selecting other emission lamps with other gasses (i.e., Ne), additional emission lines can be used for the fit, and these might be closer to the wavelengths of interest for fluorescence studies. If multiple emission sources are employed, they could be measured independently, then the data compiled and analysed simultaneously. This would enable emission lines across the 579-nm–696-nm region, for example, to be included in the polynomial fit as emission lines are present in this region in Ne gas. However, it is worth noting that the change in sampling interval and in FWHM across the spectral ranges of each Ocean Optics spectrometer is a characteristic of the Czerny–Turner optical bench design as the light impinging on the diffraction grating is not perpendicular to the grating across its full width. As such, they cannot be avoided, but should be characterized and reported.
The use of a monochromator system as a wavelength standard instead of line lamps was also investigated in this work. First, the monochromator was characterized in spectral response using the same technique like in the case of the field spectrometer, being employed as standard wavelengths the Ar and Ne line lamps. Combining different slit widths and different light sources, the spectral resolution of the monochromator was tuned between <0.1 nm and 3.5 nm. It was observed that for lower FWHM values, the error increased, when compared with the standard values. The highest error was in the case of 0.05-mm slits, when a peak asymmetry was also noticed. The peak asymmetry can induce an uncertainty on the centre wavelength determination. We presume that this asymmetry is the result of either the misalignment of the LDLS light source to the monochromator entrance or due to the diffractions associated with slit width. A more detailed monochromator system characterization, for all components (slits width between 1.25 and 0.05 nm, light source, gratings, detector) will need to be considered in the future to understand the source of this error and to reduce it.
After OL750D wavelength calibration, the system was used as the wavelength transfer standard to calibrate the field spectrometers at 687 nm and 760 nm. The wavelength correction was similar for the QEP00114 fluorescence spectrometer when two different calibration sources were used: +1.121 nm when the pen-ray lamp was considered as the standard and +1.11 nm in the case of the monochromator system (with a maximum standard deviation of ±0.005 nm). The advantage of using the monochromator source is that the wavelength calibration can be performed at specific lines corresponding to chlorophyll fluorescence emission, and not at fixed lines as in the case of the reference lamp used. Furthermore, the spectral features of the spectrometer related to the FWHM can be determined at any desired wavelength when using a double monochromator source with high accuracy if the system is fully characterized as has been demonstrated in this paper.
Considering all of the above-mentioned issues, we may say that the following options are available to correct the spectrometers spectral data to be used for fluorescence measurements:
- -
to calculate the wavelength errors considering the difference between each standard line (NIST database) and the measured spectral line; in this way, a wavelength correction of ±3.2 nm will be applied to all data, with an accuracy of ±0.3 nm (see
Figure 3 and
Figure 4);
- -
to optimise the wavelength correction close to O2-A and/or O2-B features, obtaining minimum error at specific wavelengths, but higher error outside this range. This method still relies on a polynomial fit. This method can be a better option for high resolution spectrometers used for SIF studies. If the correction is optimised to only one wavelength close to the O2-A absorption line, an error of ±0.125 nm (
Table 2) is obtained for the O2-B line. Therefore, it is highly recommended to have wavelength correction at both telluric bands using an additional line lamp (e.g., Ne) to minimize the error. Furthermore, the double monochromator could be used at any wavelength, but an uncertainty due to limited standard calibration has to be considered.
A better accuracy for a larger spectral range can be reached by using a tuneable laser as a spectral standard.
As concerns the uncertainties of the sources in the case of field spectrometers’ spectral calibration, the temperature variation effect has to be addressed. Two aspects have to be considered: either the sensor is thermally controlled or the entire system is cooled. If only the detector is temperature controlled, then a wavelength shifts can appear due to the thermal expansion of optical and mechanical parts. For field spectrometers, it is strongly recommended to wait for a thermal stabilization of the instruments according to the manufacturer’s recommendations [
18]. A compact design of the spectrometer’s optical setup, a lack of moving parts and the appropriate selection of materials with low expansion coefficients (±0.01 to ±0.08 nm/°C [
38]) assure a good reproducibility of wavelength measurements and provide a low wavelength shift (e.g., ±0.17 pixel/°C for the high resolution AvaSpec-ULS3648, having a pitch of 8 μm and operating in the 600–700-nm spectral band [
39]).
In relation to the optical signal coupling to the spectrometers, additional precautions have to be taken in order to reduce the wavelength calibration errors: (i) the numerical aperture (NA) of the coupling optical fibre has to be larger than the NA of the instrument; (ii) for spectrometers having entrance slit widths less than 70 μm, it is recommended to select an optical fibre core three-times larger than the slit width. A mismatch between the connecting optical fibre and the spectrometer input optics can lead either to a wavelength shift or to the decrease in spectral data reproducibility [
38]. Furthermore, a misalignment of the light source to the monochromator input port can distort the shape of the spectral line symmetry.
5. Conclusions
This paper presents the results obtained from spectral calibration of three field spectrometers configured for fluorescence and reflectance measurements. Two different approaches were described for this purpose. In the first case, two different standard pen-ray line lamps, having well-known spectral features, were used as wavelength standards, and for the second case, a monochromator-based system was developed to calibrate the spectrometers.
One may conclude from the results is that if the first method is selected, either the wavelength correction is performed for multiple emission lines corresponding to the standard line-lamps and an accuracy of ±0.3 nm is obtained for the entire spectral range (
Figure 3 and
Figure 4), or the spectral corrections are optimized at emission lines close to telluric oxygen Bands A and B, using a combination of line lamps (e.g., Ar/Hg-Ar and Ne). Still, these gas lamps have not enough spectral features in the desired range. This issue could be partially solved using a monochromator system instead that can be tuned to characterize and calibrate the spectrometers to specific wavelengths.
The characterization of a double monochromator was presented here for different slit width dimensions to obtain different spectral resolutions. However, this would be time consuming, and further work is required to optimise the sampling interval and interpolation method if it were not to be done pixel by pixel. Thus, further work is required for a better characterization of the OL750 monochromator system, particularly at the highest resolutions (lowest FWHM) and identifying asymmetries.
Therefore, we may conclude that employing either the line-lamp or the double monochromator standards for field spectrometers’ spectral calibration, the wavelength correction is limited by the availability of appropriate emission lines of the gas lamps (monochromator being calibrated using line-lamps also). There is a gap in the spectral calibration over the O2 telluric bands, a gap that could be covered using a tuneable laser source. The use of a tuneable laser for this purpose is the subject of our future projects.
Finally, it was noted during this work that the sampling intervals and FWHM of these spectrometers changed across their spectral range. These aspects of spectrometer performances have implications on the choice of instrument and the performance specifications that are required to enable reliable and replicable measurements of fluorescence signals with quantifiable accuracies and precision.
The steps suggested in this paper could be replicated at various facilities and laboratories for different types of spectrometer systems, such as the FLEX fluorescence imager, at a sampling interval and band widths that make the detection of the solar flux in the telluric oxygen A and B bands possible.


