1. Introduction
Biological diversity (i.e., biodiversity) can be defined in numerous ways, from the genetic diversity of a local population to variety of species in a given area and related variability of these characteristics across a landscape. Perhaps the most common approach to relate biodiversity is via relating species diversity (e.g., [
1,
2,
3]), which is usually measured as number of species, in other words, species richness [
4]. In addition to species diversity, structural and functional variety of a forest ecosystem can be used as measures of biodiversity. Structural variety describes variation in number of tree canopy layers, but also, the existence or absence of herbs and shrubs. Functional diversity includes particular growth strategies or environmental conditions favored by given species, for example, shade tolerant vs. light demanding and deep-rooted vs. shallow rooted [
4]. Changes in forested area, forest biomass, habitat fragmentation, as well as biodiversity monitoring are increasingly important related to sustainable use of forest resources, but also maintaining the natural environments. Biodiversity is decreasing due to land-use changes, climate change, and fragmentation of habitats because of infrastructure development [
5,
6,
7,
8,
9]. In boreal forests in Nordic countries, forestry is changing structure of the forests in addition to a small constant annual change in land-use when forests are changed for other land uses classes mainly due to urbanization. Although boreal forests are not as rich in species when compared to tropical forests, they contribute to global biodiversity by approximately one-third of the world’s forested land [
10]. Small changes over a large area and over time add up to have aggregate effects beyond the singular localized events. Thus, changes in boreal forests can affect both local and global biodiversity.
However, to acquire frequent and spatially extensive and detailed information on species diversity (i.e., number and distribution) is prohibitively expensive. Thus, estimating biodiversity is often based on measuring other environmental factors possible to be linked with species diversity, and therefore biodiversity. In forest ecosystems, trees are the primary producers and have a prevailing impact on forest ecosystem characteristics. Understanding relations between trees and other organisms in a forest ecosystem is required to apprehend but also identify biodiversity of the ecosystem [
11]. Therefore, biodiversity can be assessed with several forest structural attributes, such as size variability, canopy cover, amount of dead wood, as well as number of tree species [
11,
12,
13,
14,
15,
16]. According to [
17], wide variability in tree size, age, and genotype represent a diverse stand, as well as species richness. In [
18], diameter-at-breast height (dbh) and height were used to describe variability in tree size, thus stand structural diversity. Indicators of biodiversity of boreal forests include amount of old growth [
12,
19] and deciduous [
13,
14] trees, as well as dead trees and decaying wood [
15]. After assessing biodiversity indicators, indices describing biodiversity can be calculated and then values of these indices can be used in monitoring biodiversity in the area of interest (e.g., [
20,
21]).
To complement field assessments of biodiversity, remote sensing is nowadays commonly used for mapping and monitoring biodiversity indicators over large areas that may have limited accessibility [
20]. Remote sensing has made it possible to reduce the amount of expensive and laborious field assessments besides improving the spatial resolution and repeatability of the biodiversity assessments. However, the extent of the area of interest as well as the definition of biodiversity to be assessed (i.e., from individual tree species to variability of biotic communities across a landscape) set requirements for remote sensing methods [
22]. Remote sensing can be used for measuring various environmental parameters, such as reflectance properties and three-dimensional (3D) structure of vegetation related to biodiversity (e.g., [
23,
24]). Reflectance properties capture variation between some of the tree species [
25,
26] as well as tree vigor [
27,
28]. Various remote sensing data sets (e.g., point clouds derived from airborne laser scanning (ALS) or optical imagery) enable characterizing forest structure through height, height variation, and density of the vegetation. ALS data have been used to map and monitor old deciduous trees within stands [
26], stands with mixed species and multiple canopy layers [
29,
30,
31,
32], site type [
33], as well as amount of dead wood [
34], and canopy gaps [
35], all being related to diversity of forest ecosystem. In addition, sparse ALS data was used by [
36] to locate potential wildlife habitats, but concluded that information on shrub and herb layers, important habitat characteristics for game birds studied, was challenging.
During recent years, the use of unmanned aerial vehicles (UAVs) in support of forest science has increased rapidly [
37,
38,
39]. The use of UAVs has enabled the on-demand collection of high spatial resolution imagery, serving to improve the resolution of photogrammetric point clouds, and therefore offer improved characterization of forest structure [
40,
41]. Furthermore, aerial imagery with small UAVs has been used in depicting forest characteristics that are related to biodiversity. For instance, in [
42], UAV-based aerial photographs were utilized in detecting fallen trees on the ground, whereas canopy gaps were delineated from high resolution RGB images acquired with a UAV in [
43]. Point clouds were generated from RGB imagery to characterize forest canopy structure in [
44,
45]. In addition, UAV-based hyperspectral imagery has been utilized in identifying individual tree species [
25], as well as damaged and dead trees [
46]. However, these studies have not included more than one forest attributes considered important for biodiversity. In addition, in the above-mentioned studies the attributes of interest were assessed at individual tree-level. Biodiversity assessments beyond single or few stands would require at least plot-level attributes.
Although remote sensing has improved quality of the biodiversity assessments for large areas, quality of an assessment is still heavily dependent on the availability and quality of field data. The data collected from a limited number of field plots is used for linking remote sensing measurements to the attributes of interests. For example, forest structure measured with laser scanning describes height and density of vegetation [
47], but does not necessarily directly provide the same attributes that are important for biodiversity assessments, such as variation in tree size and species, or the amount of dead wood. Thus, prediction models are usually developed for each mapping and monitoring campaign used for biodiversity assessments. However, some of the important biodiversity indicators that are required for building prediction models could be measured detailed enough by using high resolution remote sensing data collected with UAVs. This information could serve supplement or replace part of the currently required field work to support biodiversity assessments [
48]. It should be pointed out that at least so far, UAVs are not capable for large area mapping and thus remote sensing data collected using airborne and satellite sensors is required for that purpose. Nevertheless, UAVs have shown potential in offering scale-appropriate information for biodiversity assessment in temperate forest through canopy gaps, for example [
49].
With high spatial and temporal resolution at reasonable costs [
50], the potential of UAVs can be expanded to enhancing sampling for large area inventories. In [
37], it was suggested that UAVs could be used in identifying forest areas in need for management, such as thinning or fertilizer to concentrate activities for those and increase efficiency that way. Similarly in assessing biodiversity, UAVs can be seen as support tool when planning field campaigns. For example, in multi-phase sampling where airborne or satellite data are usually used for stratifying the first phase of sampling for biodiversity mapping, UAVs could be used in second phase before determining the final field plots. In other words, data from a UAV would be complementary for part of the traditional field measurements that can be accurately derived from UAV data (e.g., vegetation height, canopy gaps) [
37,
43,
51].
The aim of this study is to increase the understanding and capacity for how important biodiversity indicators can be mapped using spectral and 3D features based on hyperspectral imagery and photogrammetric point clouds acquired with a UAV in southern boreal forest conditions at plot level. In our study, the investigated biodiversity indicators included stand successional stage (maturity), amount of old deciduous trees, structural diversity, and the amount of dead wood. We concentrated on how accurately we can derive these biodiversity indicators that can in turn be further used to support biodiversity assessments for large areas based on remote sensing.
4. Discussion
The novel low-cost hyperspectral camera technology based on the tuneable FPI by Senop Ltd. (
www.senop.fi) was used in predicting biodiversity indicators at plot level. The FPI-camera is capable of producing freely selectable spectral bands with 1 nm spectral sampling interval and approximately with 10 nm spectral resolution (FWHM). Only 22 bands were used due to the limitations of the former version of the camera that was used in the data acquisition for this study. However, the spectral data represented the spectral characteristics of the objects of interest well, thus, we considered the data hyperspectral. The current versions of the camera can be programmed to capture for instance 100 bands with approximately 3 s imaging interval, thus, producing denser spectral sampling (
www.senop.fi).
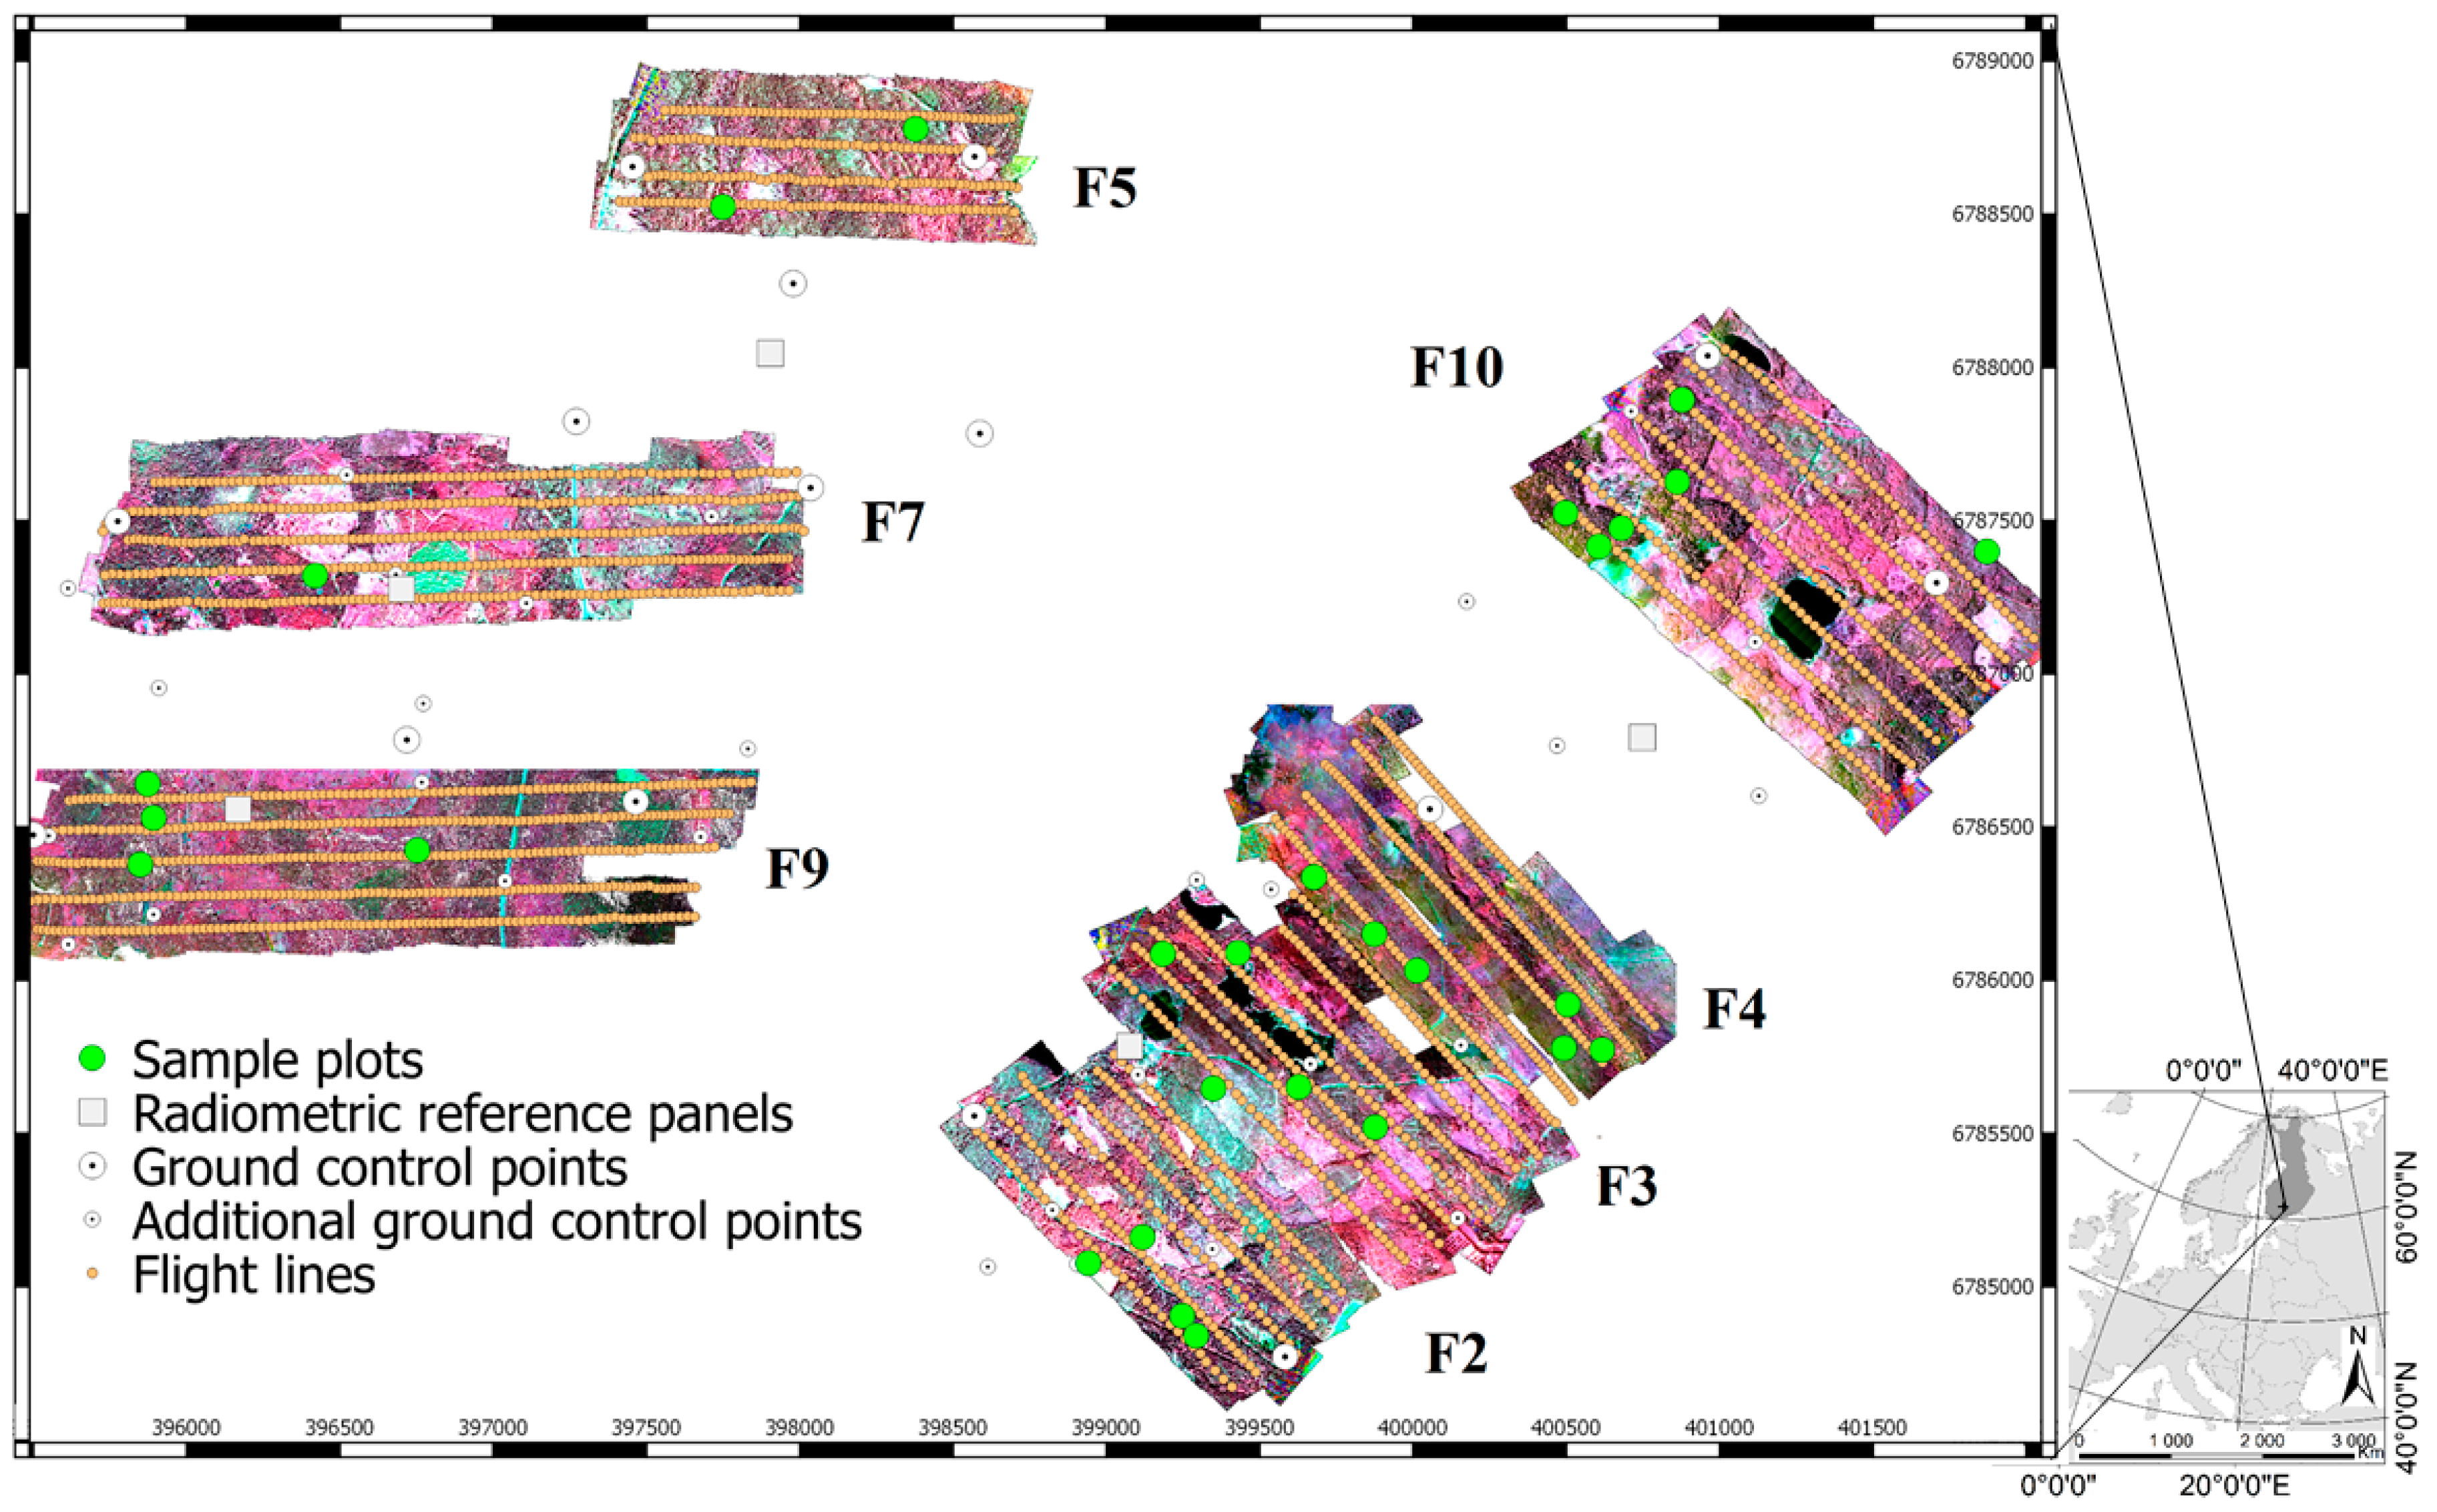
We captured the UAV datasets using a flight altitude of 400 m in order to cover the area where the sample plots were located as cost efficiently as possible. This is higher altitude than usually used in UAV flights and special permits were acquired from the local authorities for the flights. The resulting GSD was 25 cm for the hyperspectral data and 10 cm for the RGB data. Data acquisition from lower flight altitude would have been less efficient because more flight lines and lower flight speed, as well as more GCPs and more time for image data post-processing would have been required. On the other hand, the resulting spatial resolution of the data would have been finer. For example, the typical flight altitude of 120 m would have produced GSDs of 3 cm and 7.5 cm for the RGB and hyperspectral imagery, respectively. Improved resolution would provide more accurate and detailed geometric and radiometric description of the object that might improve the interpretation accuracy. For example, the study by [
64] showed that hyperspectral datasets with 9 cm GSD outperformed datasets with 50 cm GSD when identifying spruces suffering of bark beetle infestation at individual tree level. The overall accuracy and Cohen’s kappa were 81% and 0.70, and 73% and 0.56 for the GSDs of 9 cm and 50 cm, respectively, in comparable cases. The finer GSD could also improve the quality of the geometric features extracted from the point clouds. However, in this study, the majority of the trees were relatively mature and large (average height of live trees 15.7 m) and the terrain level was obtained from the ALS, thus, we expect that better spatial resolution would not have improved the accuracy in this study. This assumption follows the results by [
65] showing that GSDs of 5–30 cm provided stable tree height estimates.
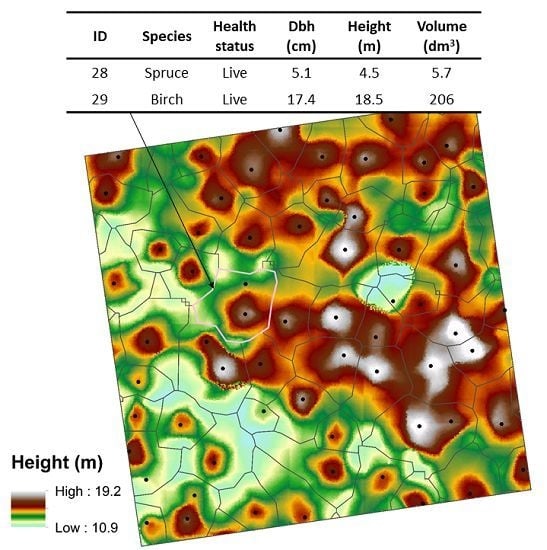
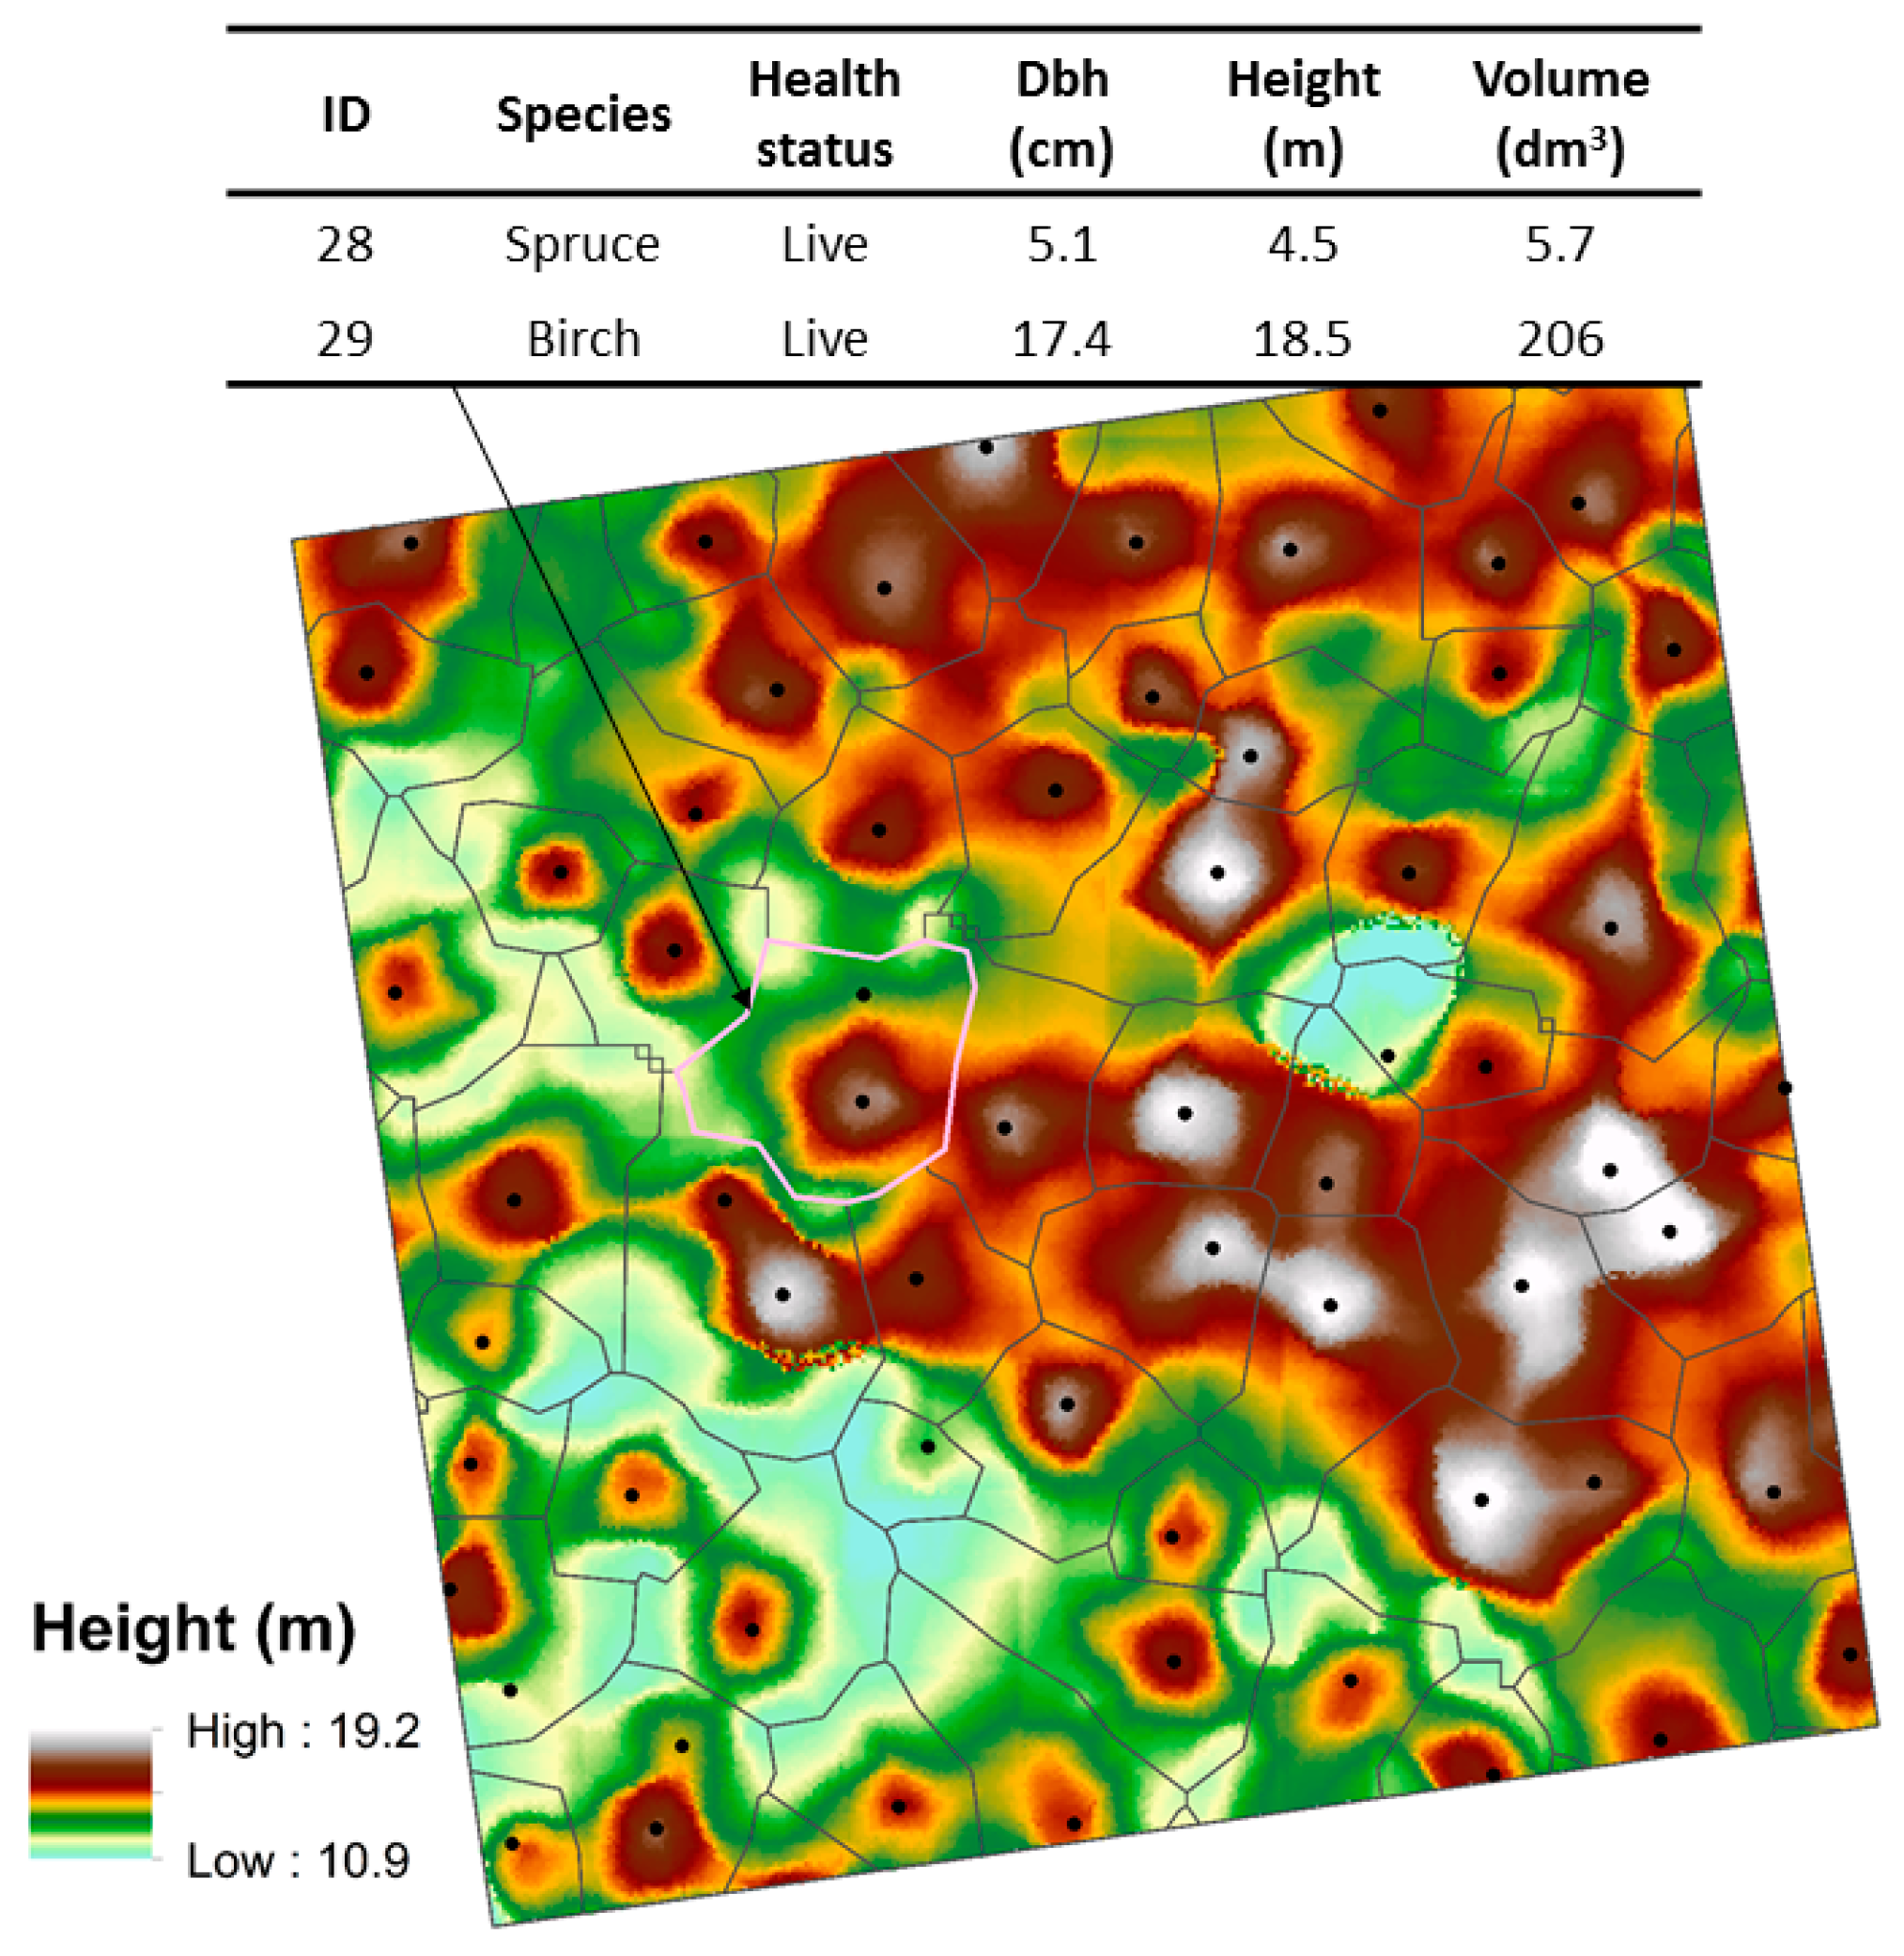
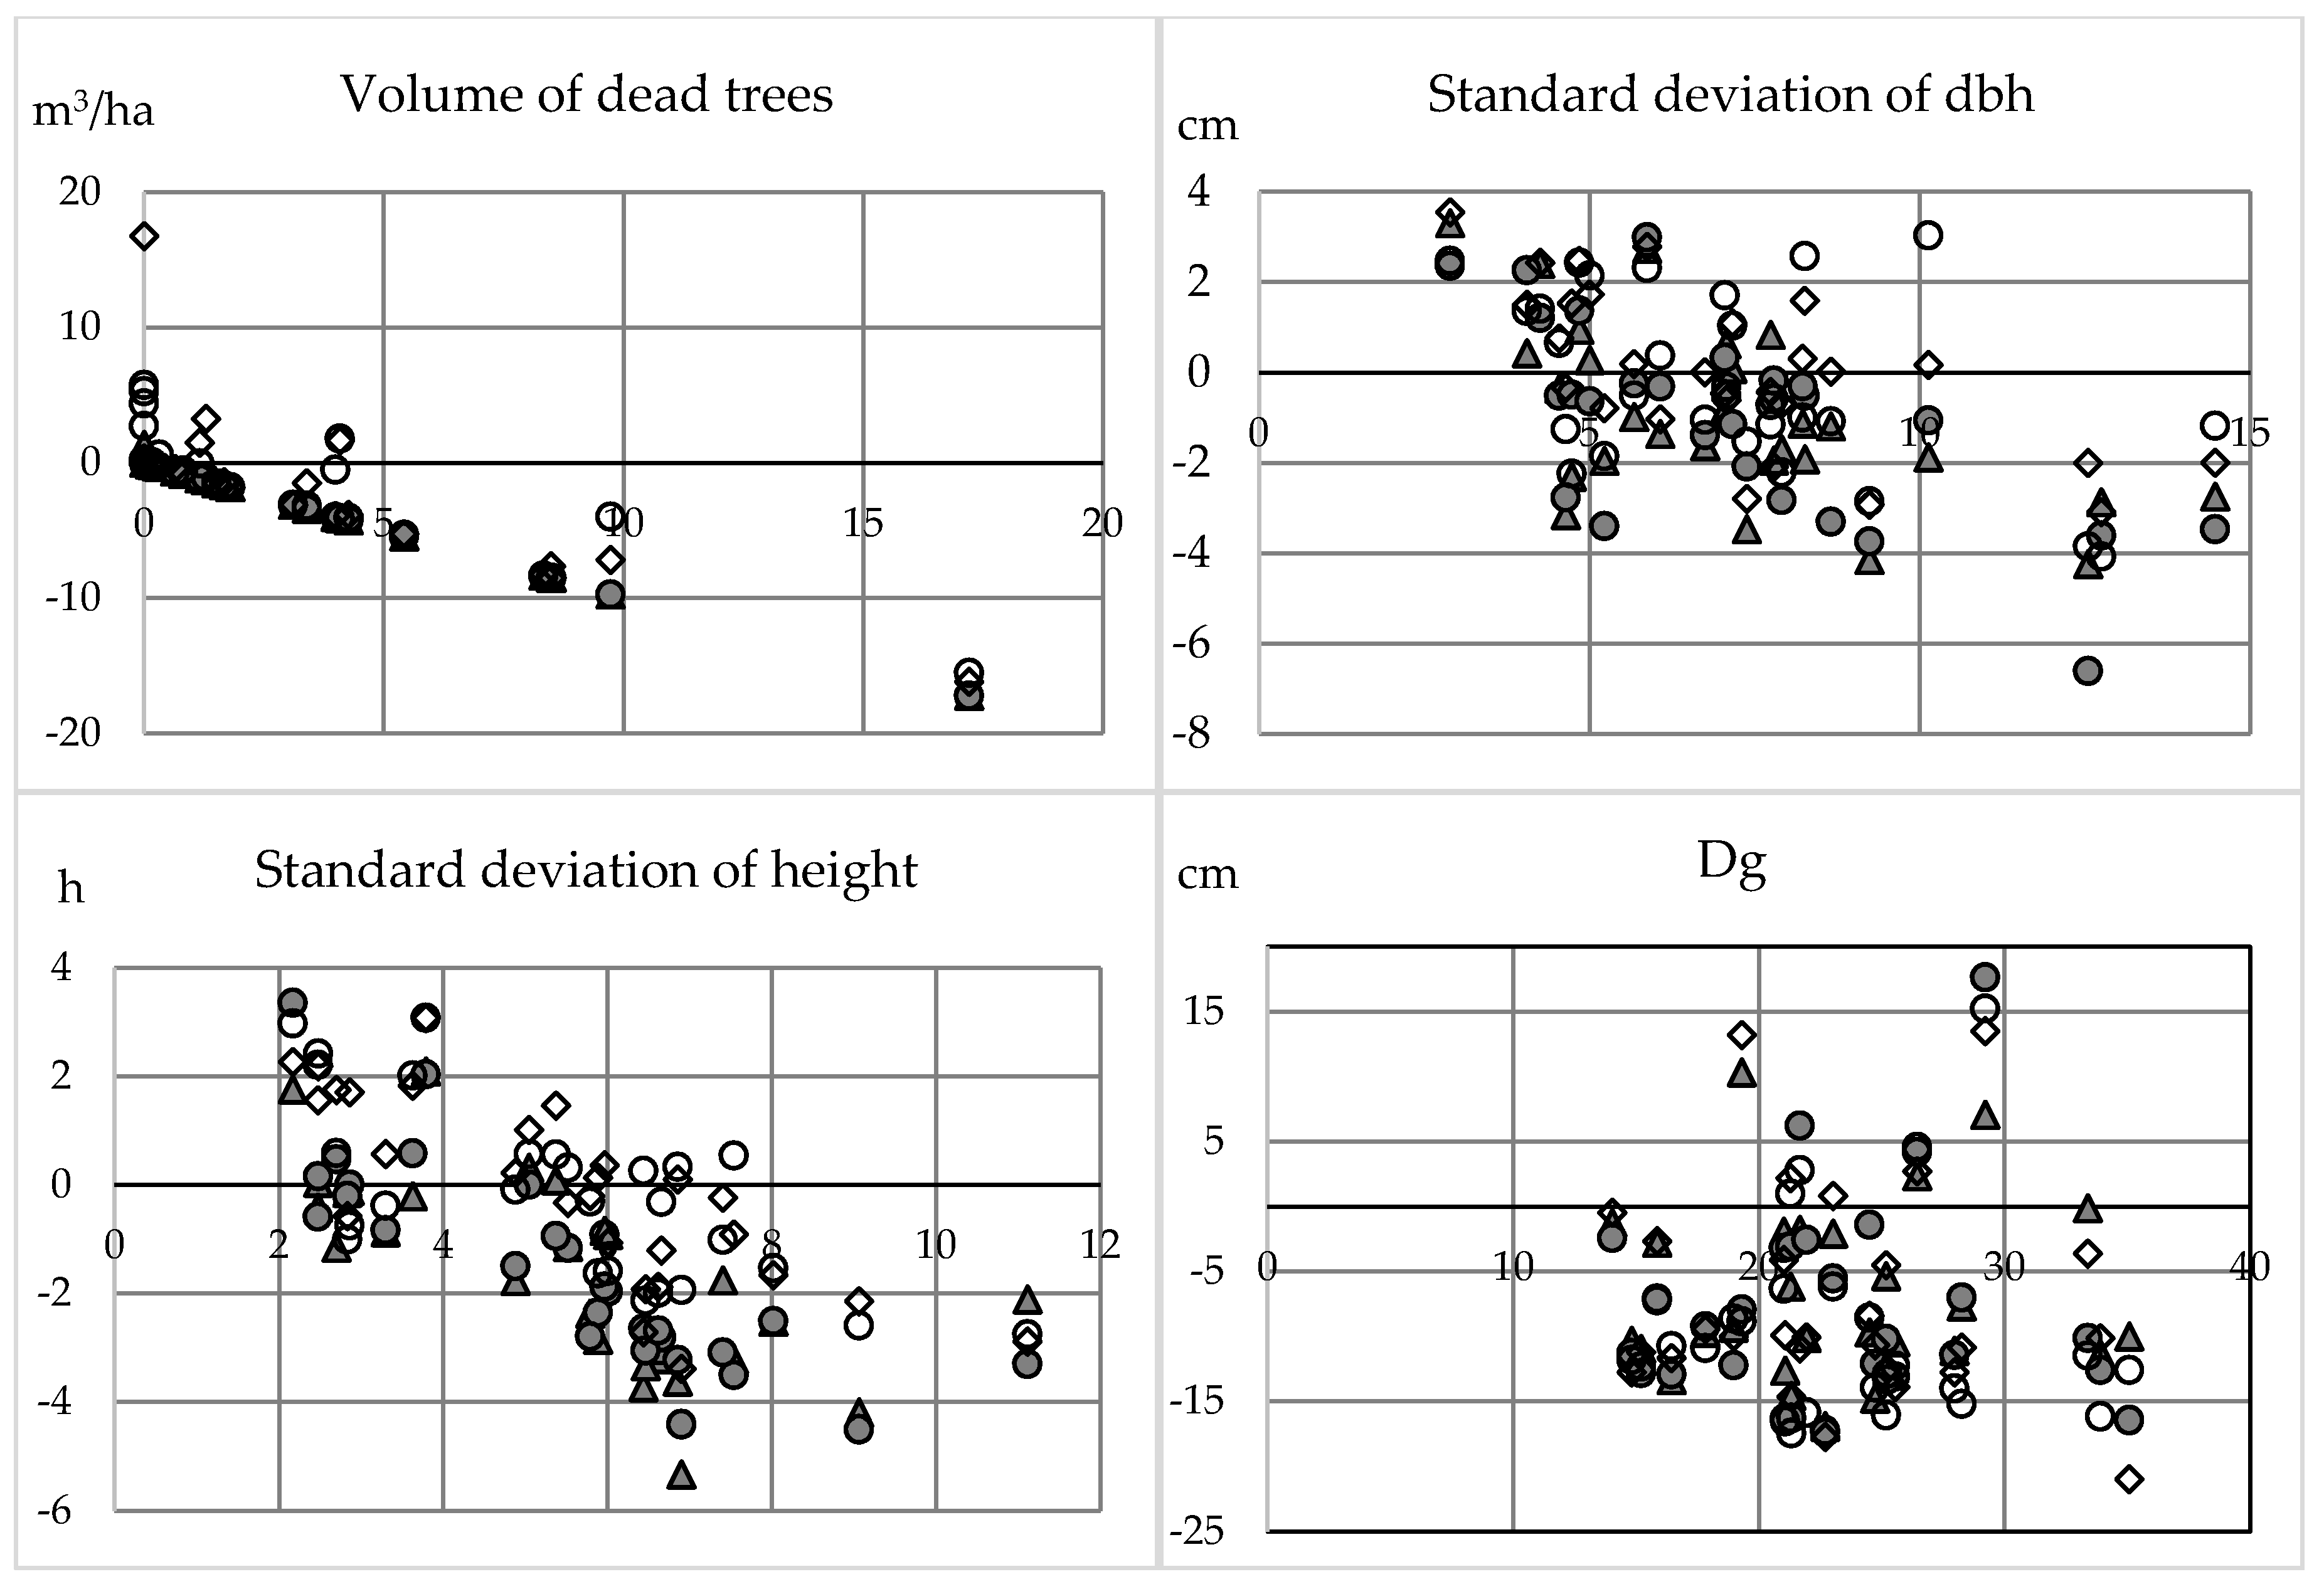
Biodiversity indicators related to forest structure (i.e., maturity and structural complexity through size) were more accurately assessed as compared to indicators that are associated with health status or species (i.e., species richness, the amount of dead wood, and large deciduous trees). The accuracy of individual tree detection affects the estimated variability in tree height, as suppressed trees are problematic to identify with photogrammetric point clouds because penetration through canopy is challenging [
44,
66,
67]. As there can be more than one tree within a crown segment in the semi-ITC, smaller trees, usually below the main canopy, and covered by adjacent tree crowns, were better represented in the predictions. Thus, structural heterogeneity (i.e., standard deviation of dbh and height) was more accurately predicted with semi-ITC compared to ITC.
UAV-based photogrammetric point clouds have been used in estimating canopy height [
44,
65,
68], but also plot-level forest inventory attributes [
69]. Our aim was to characterize complexity of canopy structure, thus, standard deviation of tree height was assessed. Therefore, the comparison between our results is not straightforward. In [
45], however, UAV-based photogrammetric point cloud and canopy height model (CHM) generated were used to assess restoration of tropical forest with various restoration treatments. They determined the average of the absolute deviation of each pixel from the average CHM height across each treatment as a canopy roughness (i.e., indicator of structural diversity). The RMSE for canopy roughness was reported 0.82 m when compared to standard deviation of field-measured tree height. In our study, the smallest RMSE (1.61 m) for standard deviation of tree height was obtained with semi-ITC when vegetation indices were included in the predictions together with Hmax. However, our flight altitude was 400 m, whereas, in [
45], it was between 30 m and 40 m. In addition, tree height varied only from app. 0.5 m to app. 13 m in [
45] as compared to larger range in our study site between 2.0 m and 31.9 m. When considering these differences, our results are comparable if not even auspicious. In addition to UAVs, other remote sensing data sets have also been used in estimating structural diversity. In [
70], plot-level tree size diversity was modelled through ALS-based features, whereas in [
71], structural diversity of urban forests was estimated with various satellite imagery. Both studies conclude that the used remote sensing data sets can be utilized in characterizing structural diversity.
In [
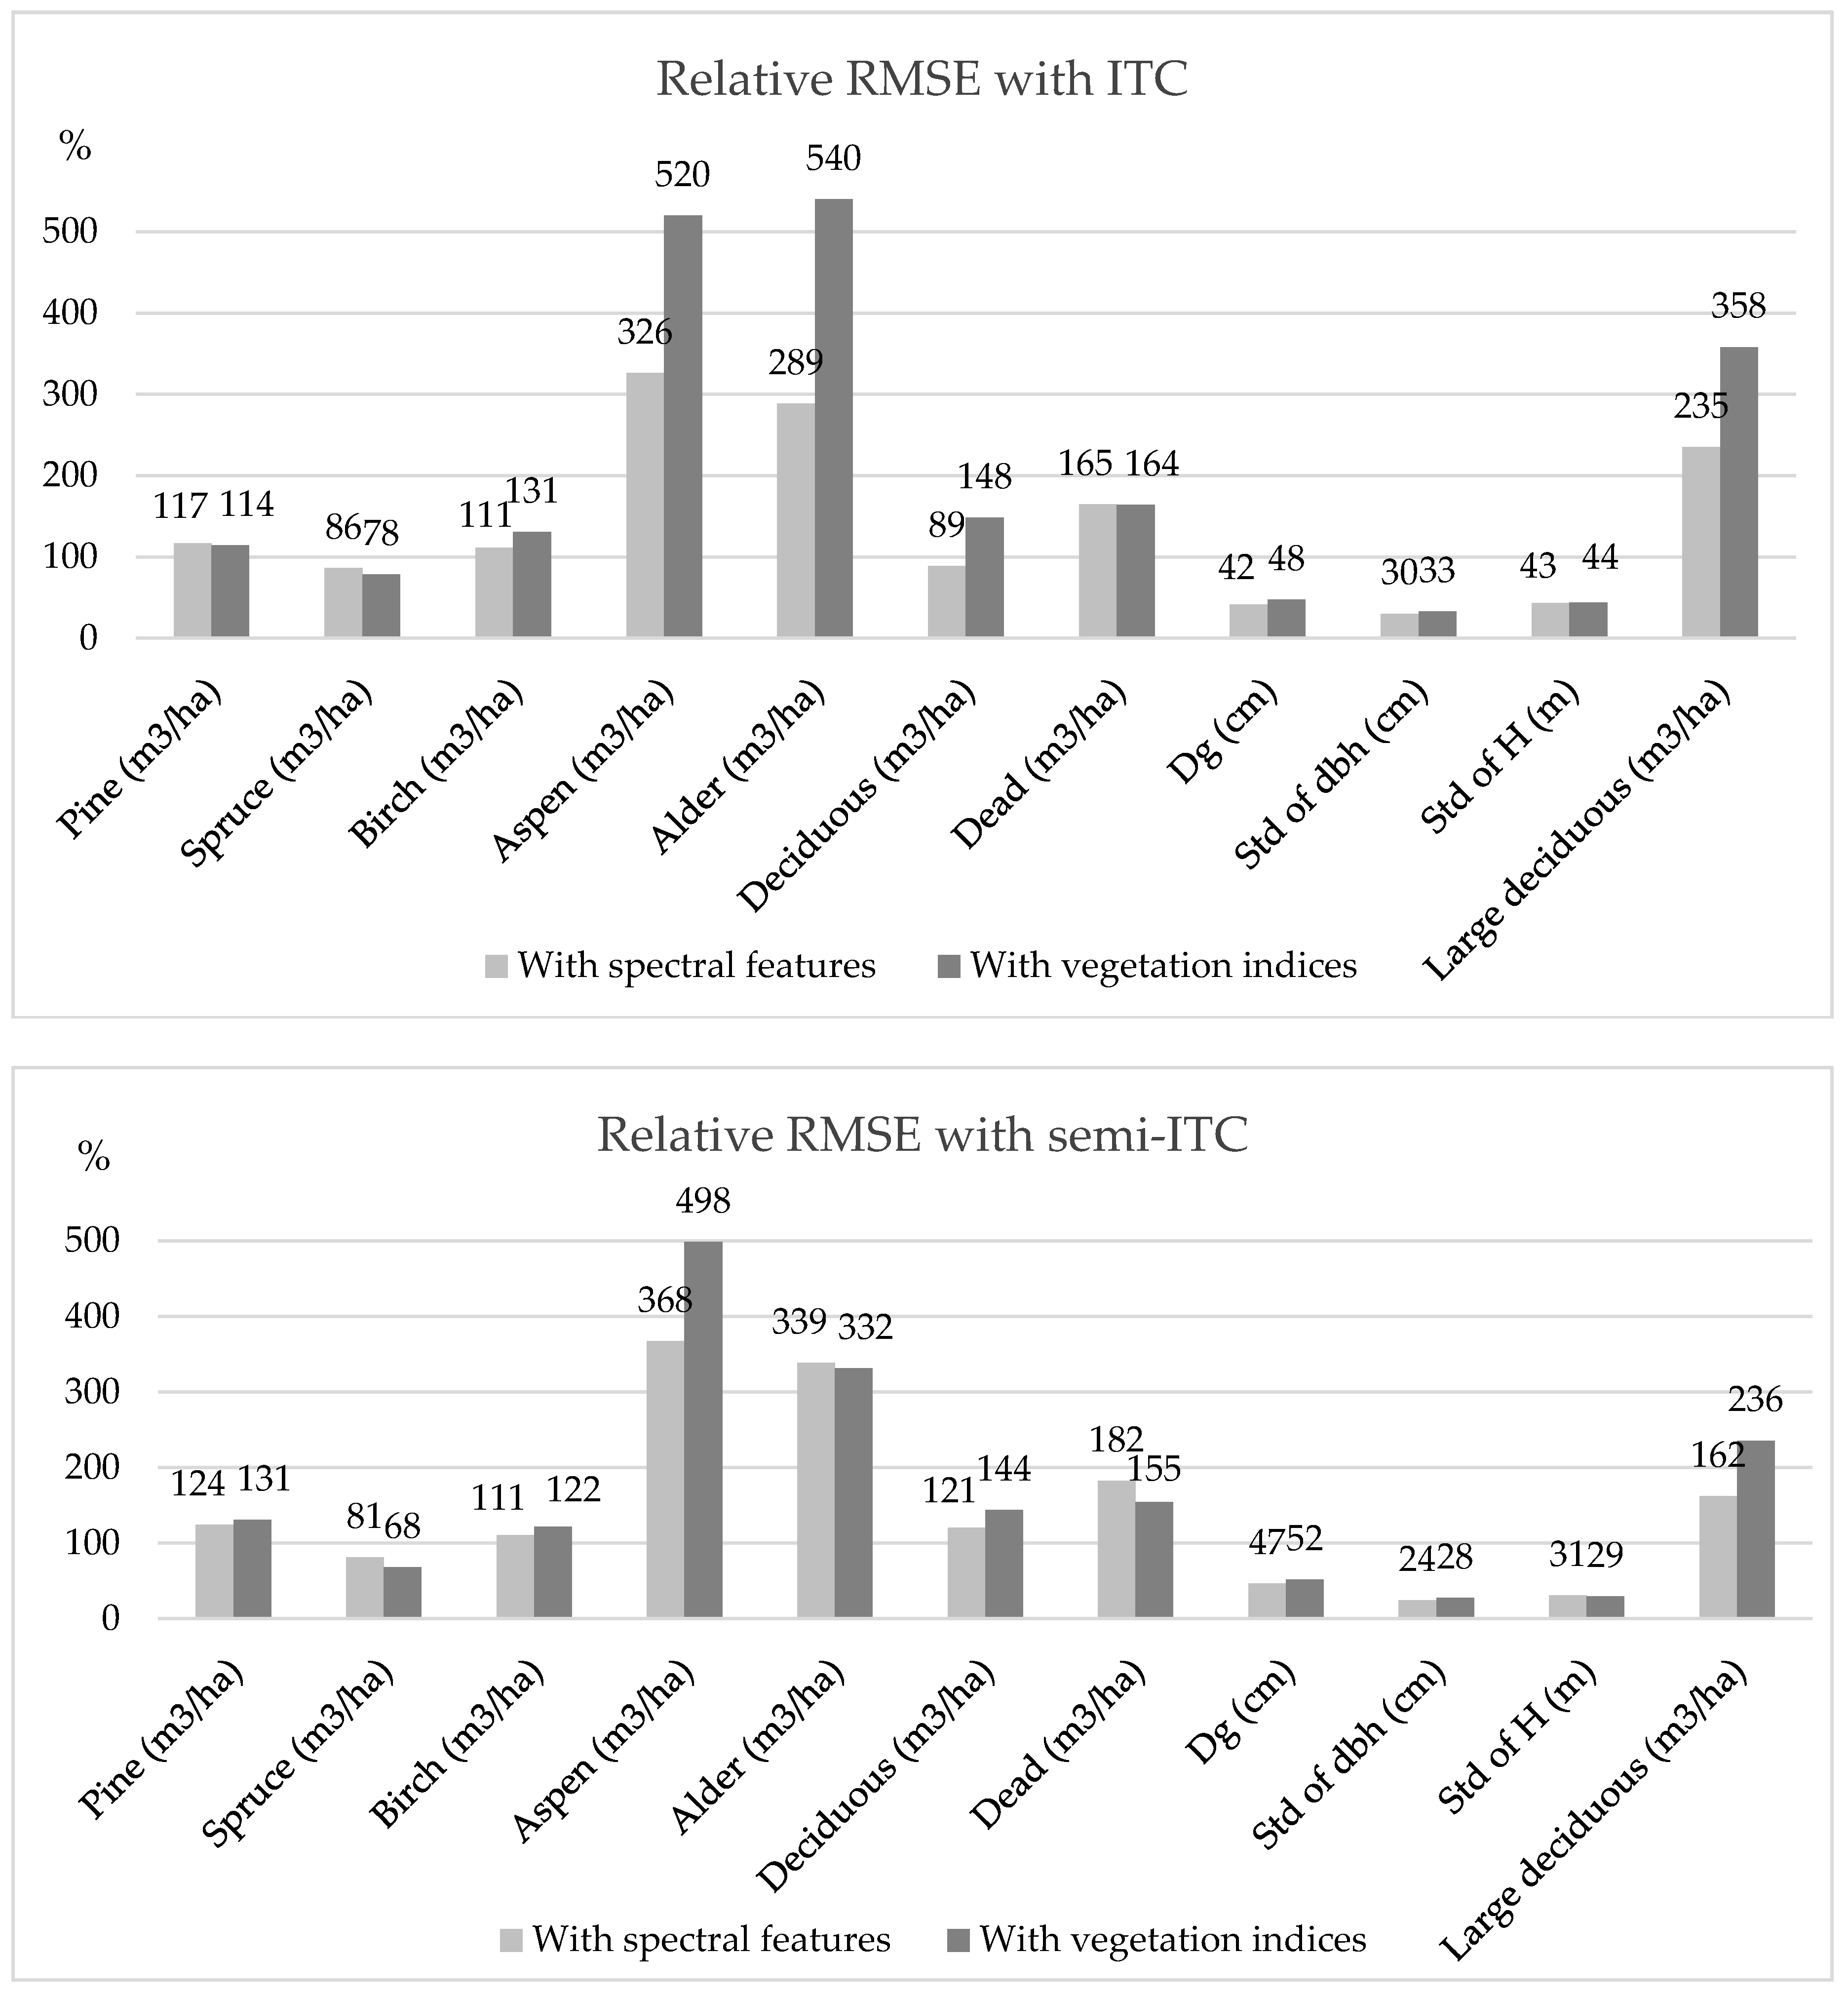
69], plot-level estimates for volumes of Scots pine, Norway spruce, and deciduous trees were estimated using similar UAV to this study. They had altitude of about 90 m, which is considerably lower than our 400 m and did not use ITC, but so-called area-based approach in the predictions. Nevertheless, our results are comparable to theirs as the relative RMSE for pine varied between 34.51% and 45.66%, but for spruce it was between 57.16% and 97.58%. Relative RMSE for pine in this study was greater (between 114.42% and 130.65%), but similar for spruce (between 68.13% and 86.38%). Especially with ITC and spectral features, we were able to obtain similar results for deciduous trees (relative RMSE 89.07%) to theirs (relative RMSE ranging from 42.00% to 81.98%). In [
72], photogrammetric point clouds were utilized to predict total stem volume and stem number at plot level with semi-ITC. The relative RMSE was 46% for stem density, but it was 25% and 30% for volume estimates depending on modelling technique (i.e., multivariate or univariate kNN). These results are noticeably better compared to our results.
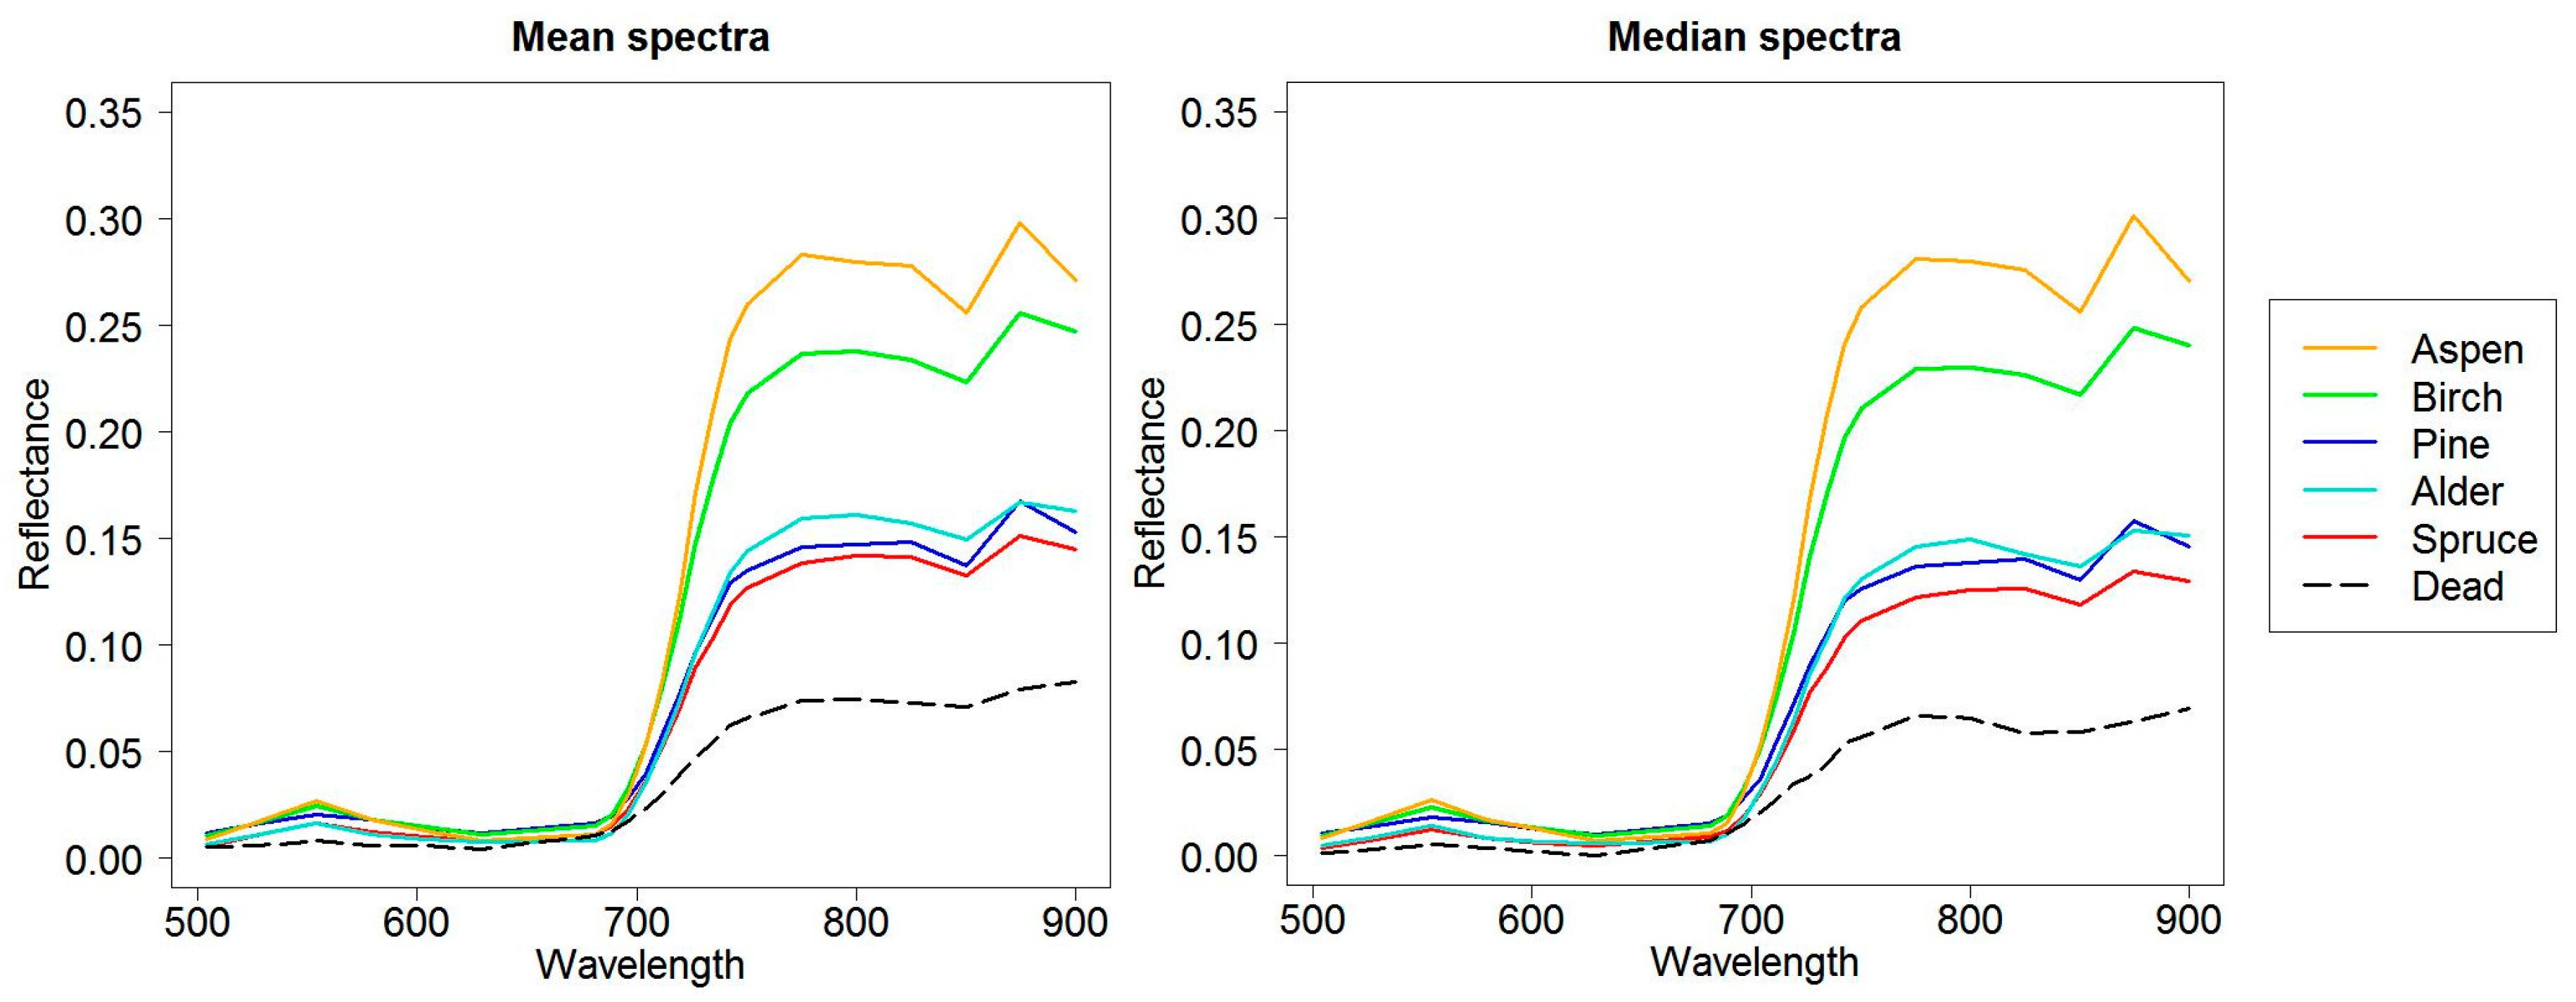
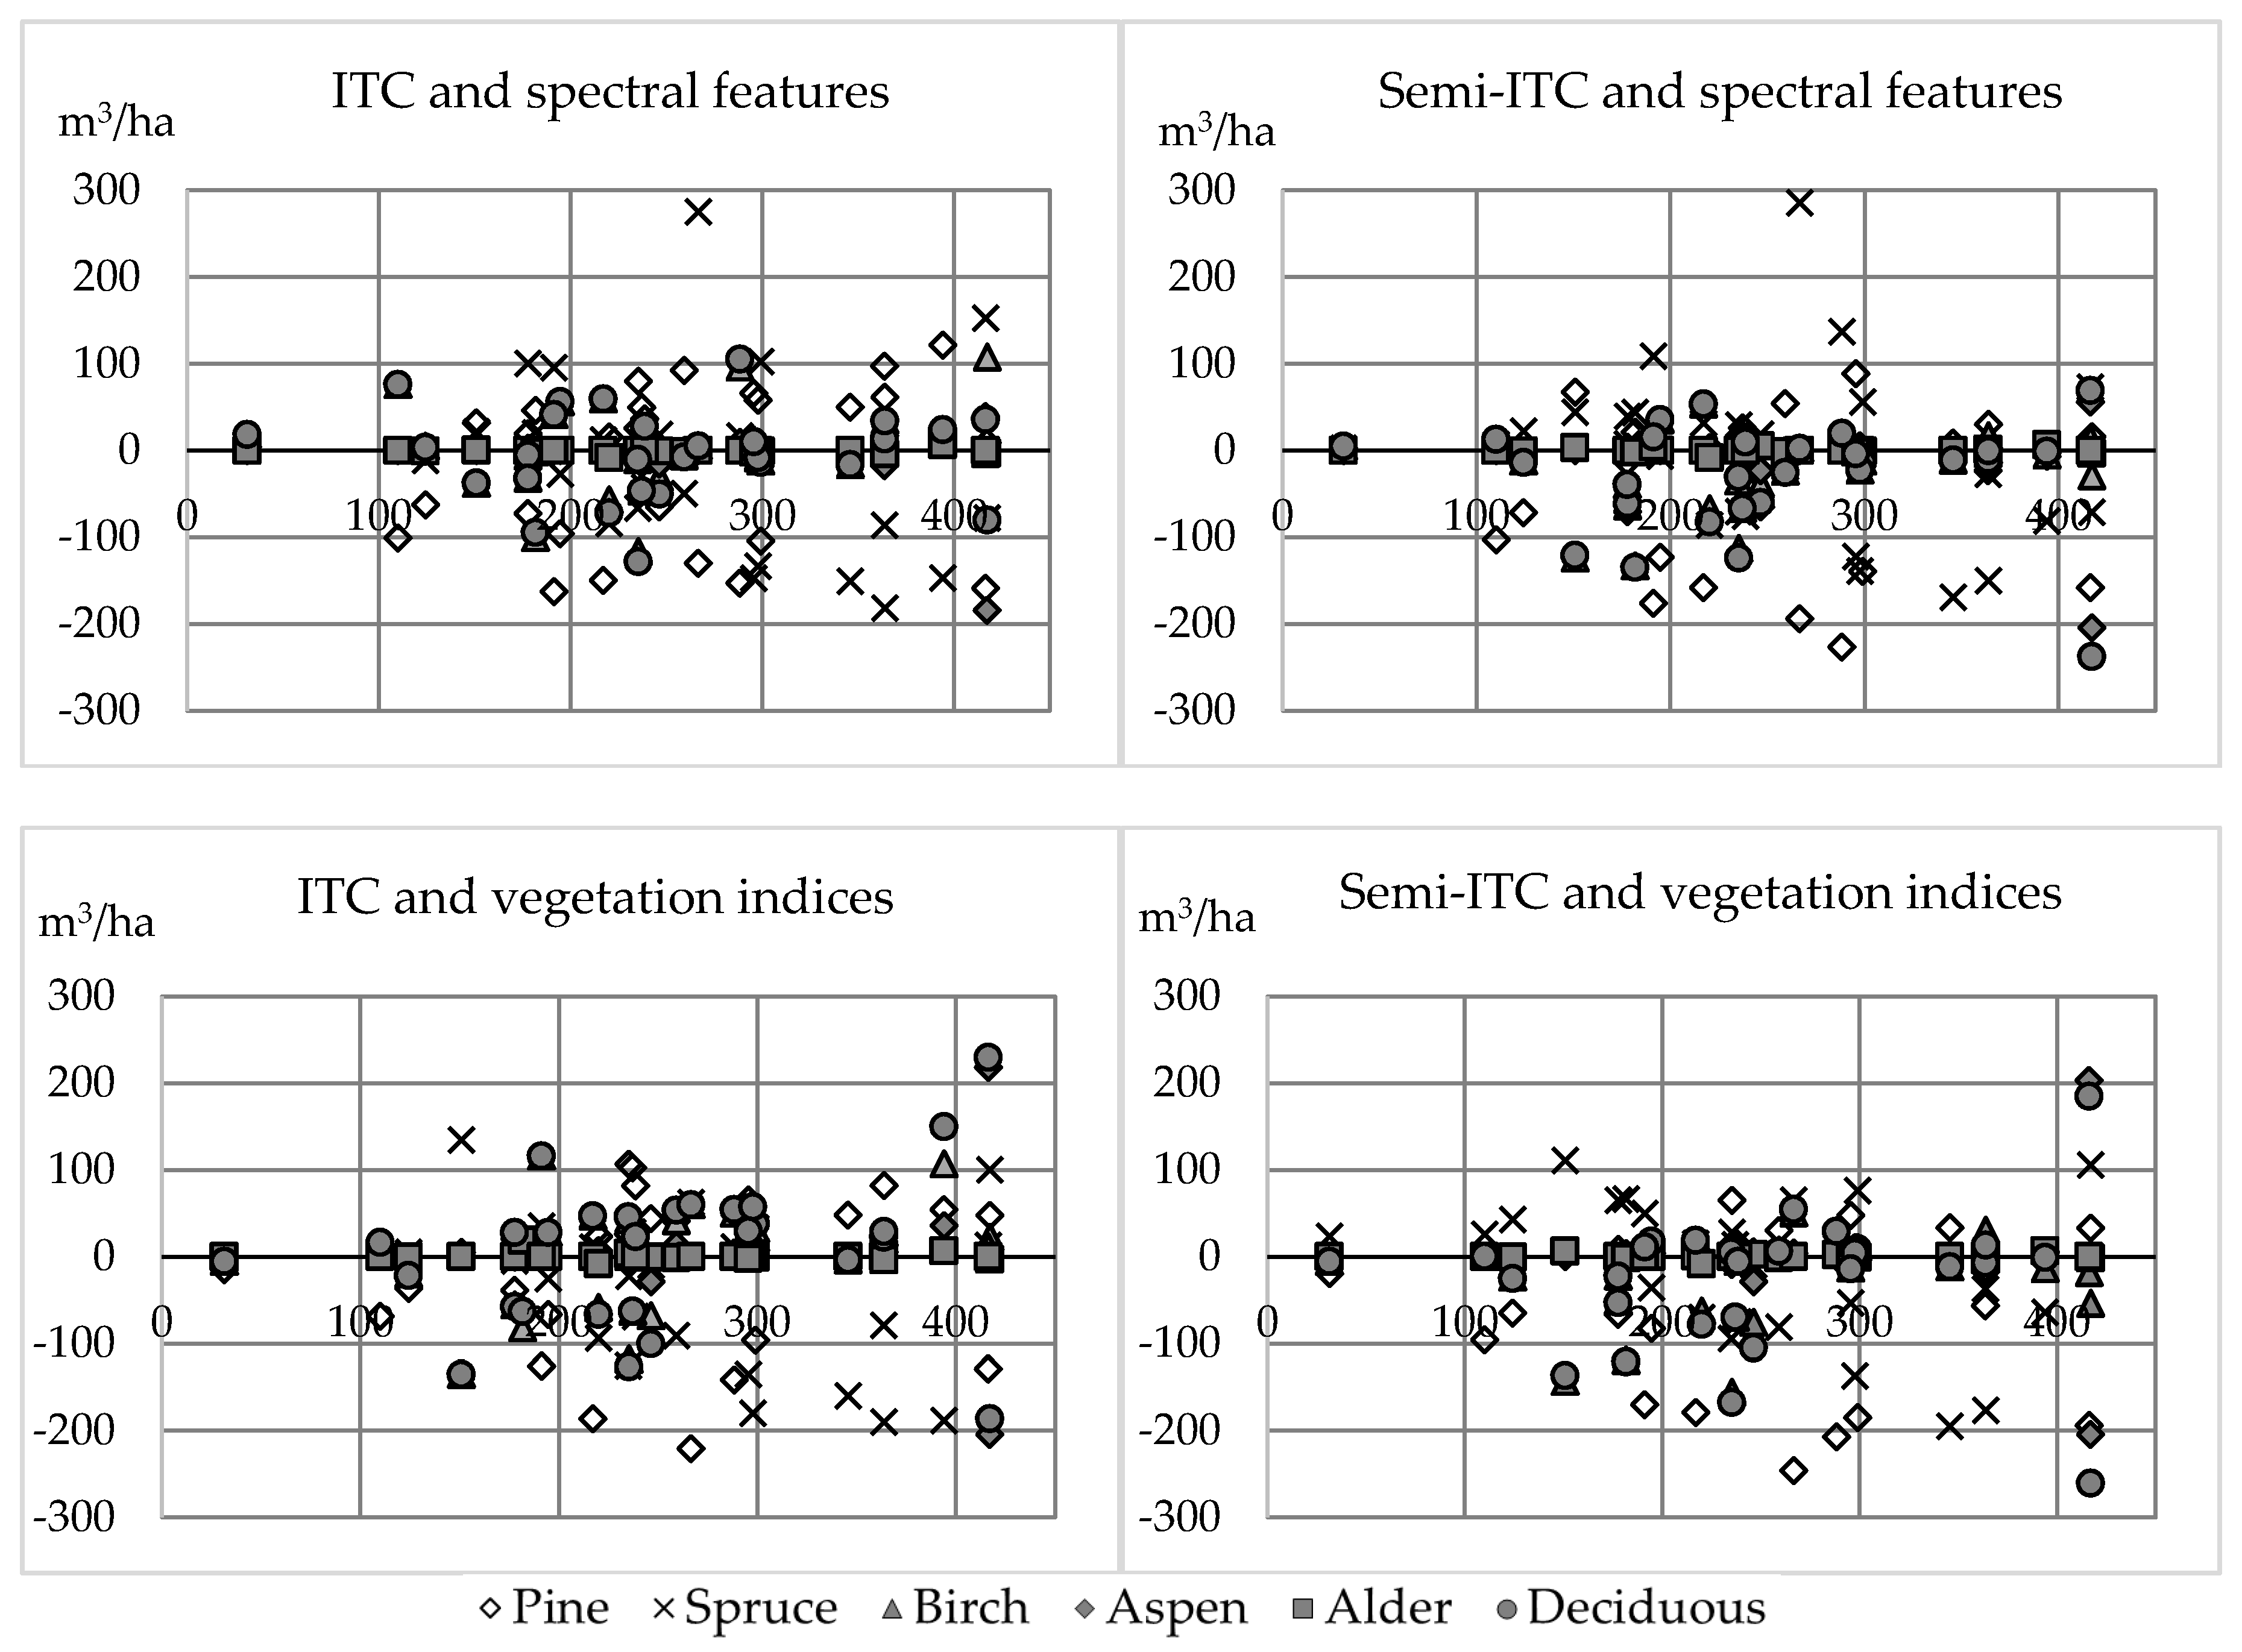
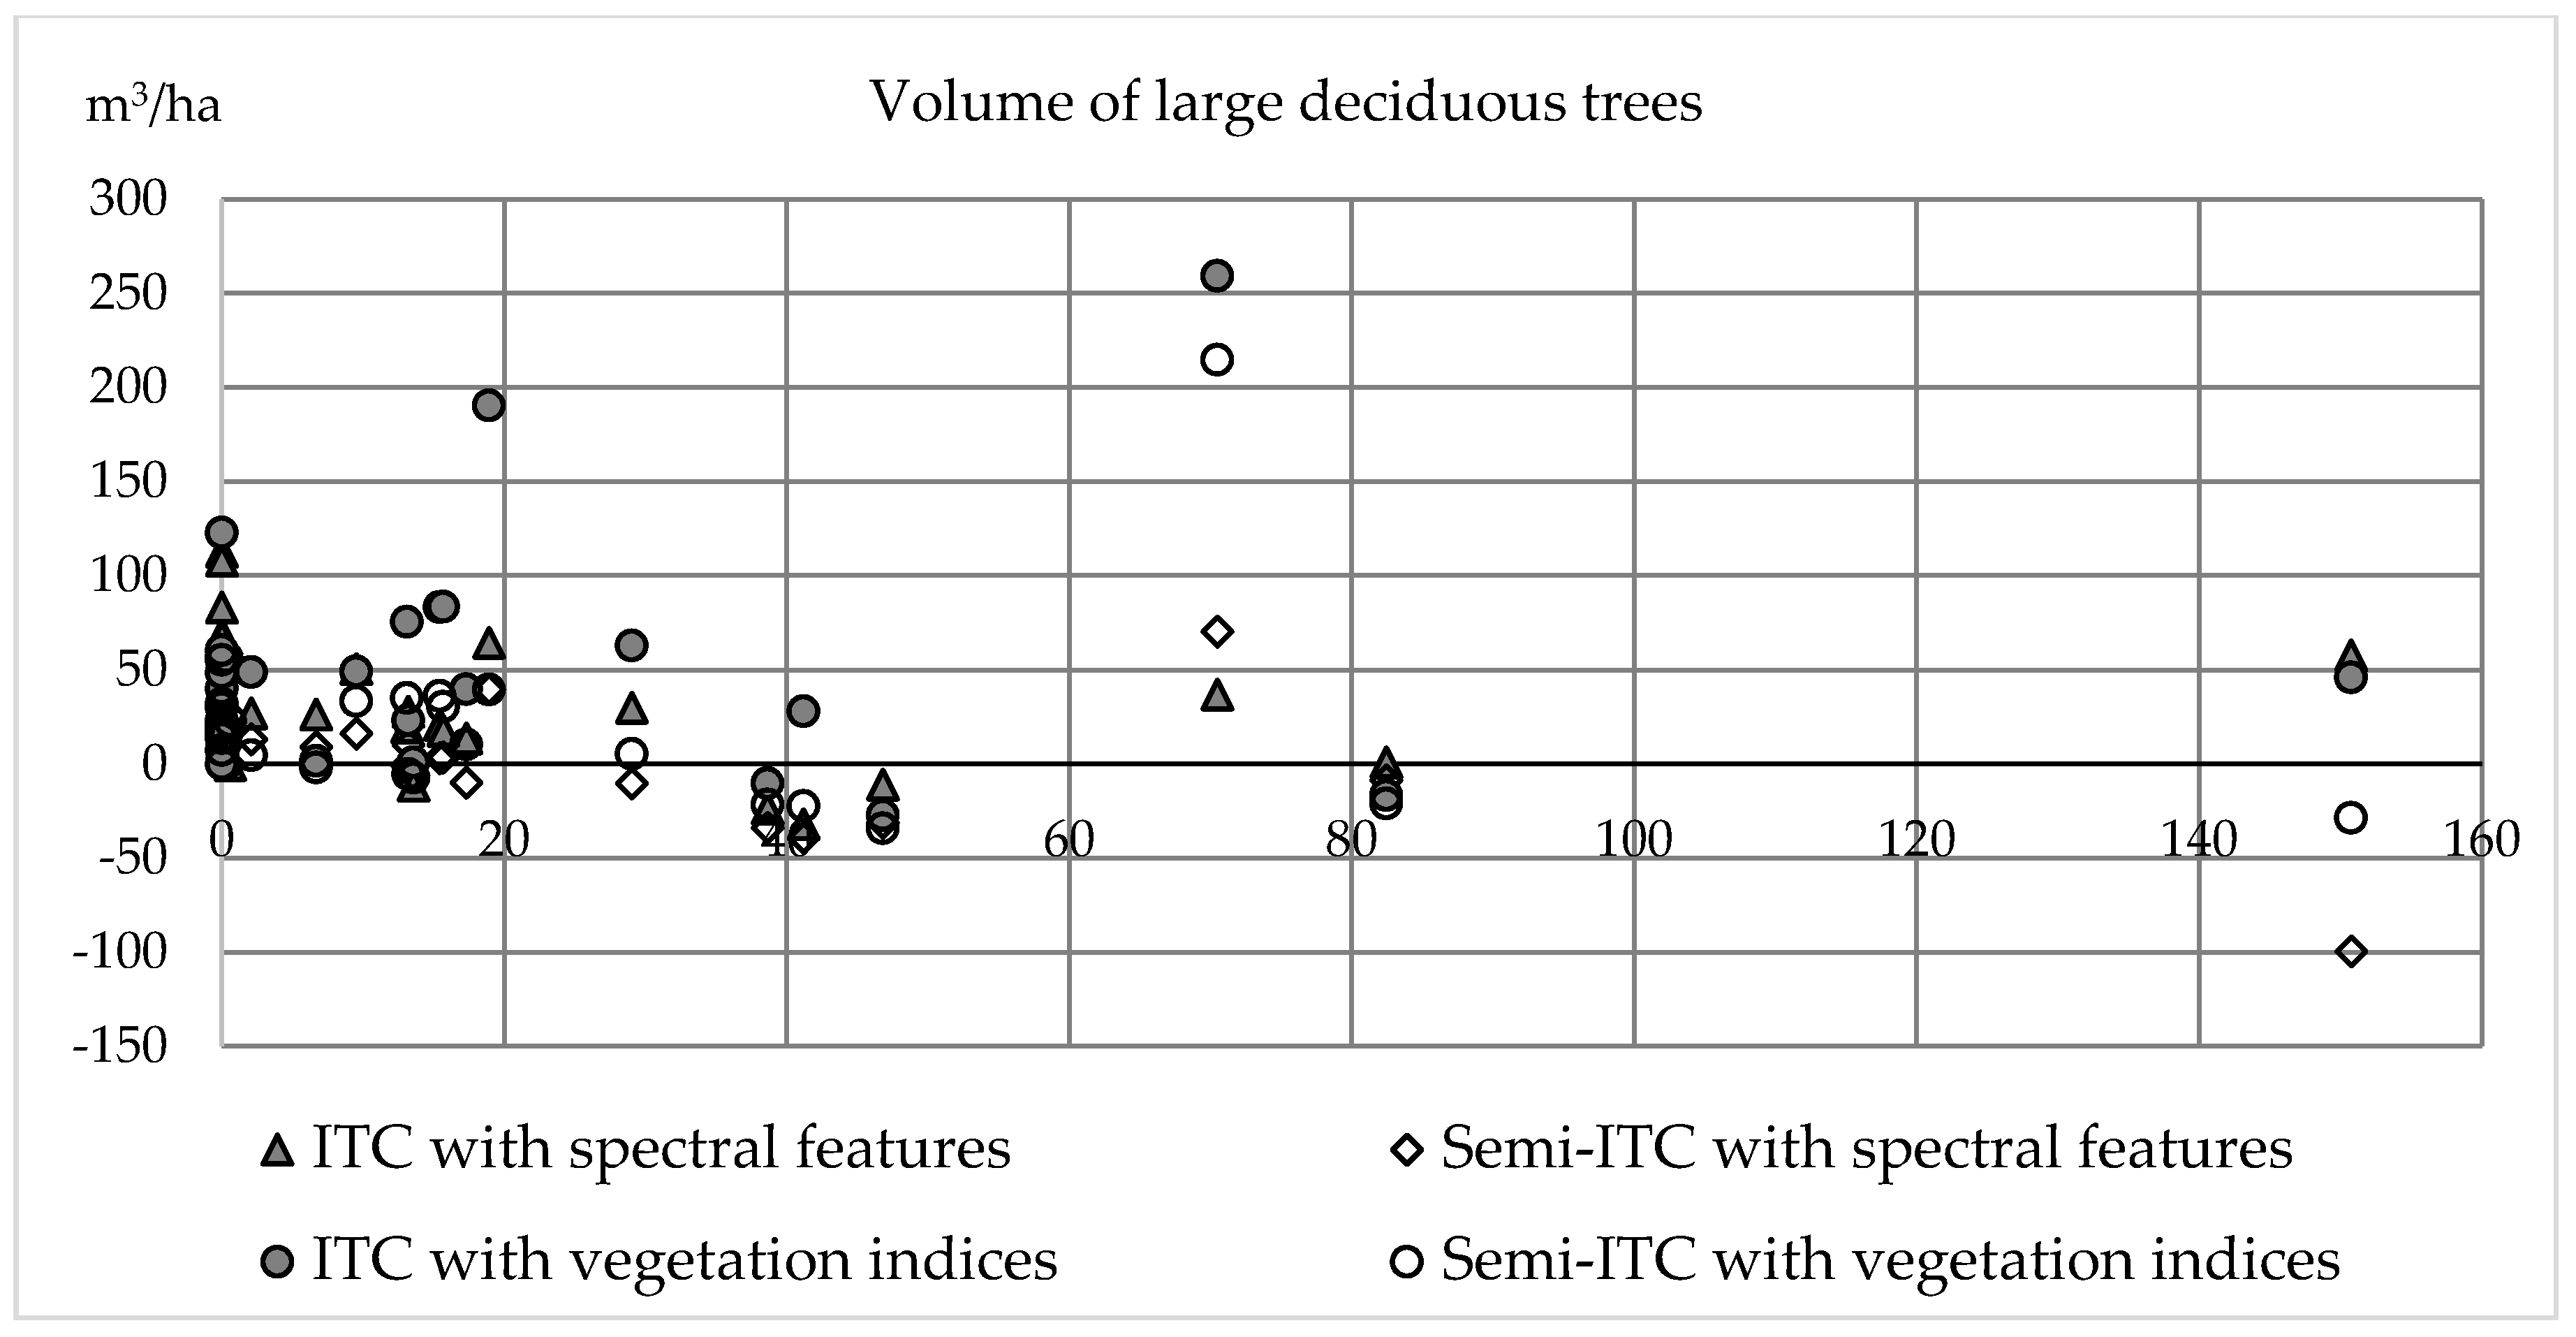
The amount of large broadleaved trees, as well as the volume of birch, aspen, and alder, were overestimated when compared to other species. In [
25], on the other hand, individual tree crowns were identified and tree species was classified with similar UAV to this study. Again, the difference between flight altitude was noteworthy (app. 90 m vs. 400 m). They were able to identify individual tree species of Scots pine, Norway spruce, birch, and larch with classification accuracy varying from 89.5% to 93.1% when utilizing the nearest neighbor in their predictions, similar to this study. Their results are, however, reported at tree level classification and we used plot-level volume for each tree as the attributes to be estimated. They reported most errors when differentiating spruce from pine, whereas in this study volume of deciduous trees was overestimated as compared to other tree species. In [
73], it was stated that pine could have higher intensity values when mixed with broadleaved species. This is true in our study area and can explain partly the difference in volume estimates of deciduous trees.
Photogrammetric point clouds were used to derive information from vertical structure of Brazilian semideciduous tropical forest in [
74], and they concluded that it was possible to classify successional stage with this information. Our results support their findings. In [
75], basal-area weighted mean diameter was estimated with relative RMSE of 28% with ITC, whereas with semi-ITC the relative RMSE varied between 12.1% and 14.3%. Our results showed lower accuracies as the relative RMSE with ITC was 41.73% and 47.64% with spectral features and vegetation indices, respectively, and with semi-ITC the corresponding values were 46.68% and 51.95%. In [
72] the relative RMSE was 26% for quadratic mean diameter.
Semi-ITC was used in predicting species-specific volume at plot level with ALS data in [
63] and they reported relative RMSE of 56.46%, 47.40%, 100.80%, and 209.71% for pine, spruce, birch, and aspen, respectively. The relative bias for corresponding tree species was −3.61%, 8.64%, 40.52%, and 64.39%, respectively. In this study, the relative RMSE was notably larger for all the trees species. Relative bias for spruce was similar in this study (i.e., 4.02% with spectral features and 10.09% with vegetation indices), but for all other tree species relative bias was larger when compared to the results of [
63].
In [
75], on the other hand, ALS data was combined with red-green-infrared, multispectral, and hyperspectral imagery to estimate total volume and species-specific stem number with ITC and semi-ITC. With semi-ITC, the mean relative RMSE for number of pine stems per hectare varied between 34.7% and 47.8% depending on whether only ALS was used or a combination of ALS and aerial imagery. Respectively relative RMSE for stem number of spruce was reported to vary from 33.2% to 51.5%, and for deciduous trees from 110.2% to 144.8%. In this study, the relative RMSE for pine and spruce were larger but for deciduous trees the relative RMSEs were similar as compared to the results by [
75]. The relative RMSE value based on ITC, as reported by [
75], for stem number of spruce varied between 80.7% and 83.5%, for pine between 55.3% and 60.0%, and for deciduous trees between 102.9% and 121.3%. Again, our results are not as accurate for pine and spruce, but were similar for deciduous trees.
Also, in [
76], ITC and semi-ITC were compared when predicting species composition using ALS only and combining ALS and colour infrared, multispectral, and hyperspectral aerial imagery. However, they estimated plot-level proportion of pine, spruce and deciduous trees and comparison to their results is not conceivable.
ALS data were utilized in [
34] to predict plot-level volume for dead trees. They reported a relative RMSE of 78.8% for dead wood volume of standing trees, which is less than in our predictions. However, it should be noted that they used bias correction and estimation was carried out for each plot with so-called area-based approach, no individual trees were identified but variables from ALS data were calculated for each plot and regression models for the amount of dead wood at plot level were developed. In [
77], fallen trees were identified with two ALS data sets from different years using ITC. Their results were presented as absolute volume (i.e., m
3) and predictions resulted in overestimates varying between 21.8% and 28.3% for conifer and underestimates varying from 21.2% to 252.7% for deciduous trees at stand level. Relative RMSE reported in this study for mean volume per hectare of deciduous trees fall within the error range in [
77].
Structural attributes describing biodiversity were more accurately assessed with semi-ITC when compared to ITC. Our results for structural heterogeneity were comparable with other studies using different remote sensing datasets and modelling approaches. The accuracies for species-specific volume, which can be used as proxy for a biodiversity indicator, such as species diversity, or volume of dead trees reported here were moderate. However, they are in line with previous studies using various remote sensing datasets for estimating volume of various tree species. Thus, this study provided new insight for biodiversity assessment to compliment field measurements at plot level where UAV-based photogrammetric point clouds and hyperspectral imagery have not yet been widely studied.

 ,
, 


