1. Introduction
Rice is one of the important food resources for most of the world’s population, especially those in Asia [
1,
2]. The annual average of rice consumption per capita was approximately 54 kg during 2017–2018 (Agricultural Market Information System (AMIS),
http://statistics.amis-outlook.org/), and the consumption has increased with increasing world population [
3]. Muthayya et al. [
4] noted that the demand for rice over the next 30 years is expected to increase by 90% in Asia. Paddy rice mapping and monitoring are crucial for food security and agricultural mitigation because they allow for identifying and forecasting rice production [
5]. In general, the annual or seasonal surveys have been conducted for measuring cultivated areas during the crop growing season [
5,
6]. The sampling survey, however, is costly, labor-intensive, and time-consuming. In addition, the survey based paddy rice mapping has a relatively slow update cycle (e.g., every five years). Rice cultivated areas often change due to human activities as well as natural disasters such as drought, floods, and wildfire. Thus, up-to-date information on paddy rice areas is essential for decision makers, scientists, and also farmers to monitor and manage the areas in a timely and sustainable manner.
Satellite remote sensing has been employed as an alternative with advantages of high temporal resolution and spatial continuity. There are several studies for paddy rice classification using single optical sensor data, such as Moderate Resolution Imaging Spectroradiometer (MODIS) and Advanced Very High Resolution Radiometer (AVHRR) [
7,
8]. However, mixed pixels have often caused misclassification when using single sensor data (e.g., MODIS) [
9]. Multi-temporal and high-resolution data have been used to overcome such a mixed pixel problem [
10]. Recent studies have emphasized the capability of multi-temporal data to identify paddy rice areas because paddy rice has its own phenology (e.g., transplanting), which is a distinct characteristic of paddy rice compared to other crop or land cover types [
11,
12,
13,
14,
15,
16,
17]. Clauss et al. [
18] mapped paddy rice in China using Support Vector Machine (SVM) with MODIS time series data. Their approach performed well to map paddy rice with an overall accuracy of 90%. Jin et al. [
9] attempted to map paddy rice distribution using multi-temporal Landsat data at regional scale with phenology information. They used a rule-based decision tree approach to determine optimal threshold values to map paddy rice using multi-temporal Normalized Difference Vegetation Index (NDVI), Enhanced Vegetation Index (EVI), and Land Surface Water Index (LSWI) as input data. The results showed the coefficient of determination (R
2) of 0.85 between satellite-based and census recorded paddy rice areas. Dong et al. [
19] developed a time series Landsat-based paddy rice mapping platform to produce paddy rice maps from 1986 to 2010. Vegetation indices were used to conduct paddy rice mapping with a five-year interval based on a land cover-adapted thresholding approach.
Although optical sensor data are useful to map paddy rice, there is a limitation for data acquisition due to cloud contamination. Synthetic Aperture Radar (SAR) data have been used to complement the cloud problems of optical sensor images because SAR data are not influenced by weather conditions [
20,
21]. Several studies employed SAR data for land cover/land use as well as paddy rice mapping [
1,
21,
22,
23,
24]. Optical sensor and SAR data have complementary information. Multi- or hyperspectral data provide information of reflective and emissive features of the Earth’s surface, while the SAR data provide information about the surface roughness, texture and dielectric properties of natural and man-made objects [
22,
25]. Thus, the integration of multispectral and SAR data produces more reliable results than those from single sensor data [
25]. Over the years, research efforts have been made in fusion of different sensor data in the remote sensing field [
1,
23,
26,
27]. Torbick et al. [
26] aimed to monitor paddy rice agriculture fusing optical vegetation indices from Landsat 8 and dual-polarization C and L band backscattering coefficients from Sentnel-1 and PALSAR-2 across the Myanmar using a random forest (RF) approach. The results showed the accuracy with R
2 of 0.78 for the harvested rice areas in comparison with census statistics. They concluded that the fusion of optical and SAR data has a great potential to monitor and analyze paddy rice production.
Given the increasing interests in remote sensing-based paddy rice mapping and monitoring, several review papers on this topic have been published [
5,
17,
28]. Dong et al. [
17] divided paddy rice mapping studies into four categories, using (1) reflectance data and statistical approaches, (2) vegetation index (VI) and enhanced statistical approaches, (3) temporal analysis approaches with VI or RADAR data, and (4) phenology-based approaches. They discussed the current challenges and opportunities in future paddy rice mapping: to improve algorithms with the development of land cover classification approaches, to improve data acquisition capacity with high spatial resolution (~30 m) such as combined Landsat and Sentinel-2 data, and to improve computing capacity such as using Google Earth Engine. In particular, the Landsat series have been provided for free with an opening from the archive datasets to the general public. Added to this benefit are large swaths with a width of 185-km and a 16-day temporal resolution, which produces valuable information for the repeated measurement of space and time [
29,
30]. Moreover, accumulated archives with more than 40 years of data have the potential to fuel long-term studies with regional and global land cover classifications [
31]. Given this background, we identified some issues that should be improved. This present study investigated the following approaches to improve the identification of paddy rice areas over two distinct regions with different climatic and environmental characteristics:
paddy rice classification using multi-sensor fusion (optical sensor and SAR) and multi-temporal data through machine learning approaches (RF and SVM);
development of a paddy rice mapping index (PMI) while considering spectral and phenological characteristics; and,
paddy rice classification using Google Earth Engine based on the PMI approach over larger areas.
The present study aims at advance paddy rice classification by expanding the dimensionality of data on both spectral and temporal domains. We conducted paddy rice classification through fusion of optical sensor and SAR time series data using two machine learning approaches, RF and SVM. This study examined six schemes to identify the effect of data dimensionality on paddy rice classification. The six schemes composed of various combinations of input data by sensor and collection date considering the phenology of paddy rice over two different regions. This study also proposed Paddy rice Mapping Index (PMI) when considering the spectral and temporal characteristics of paddy rice that can be applied to areas that have different climatic and environmental characteristics.
3. Methodology
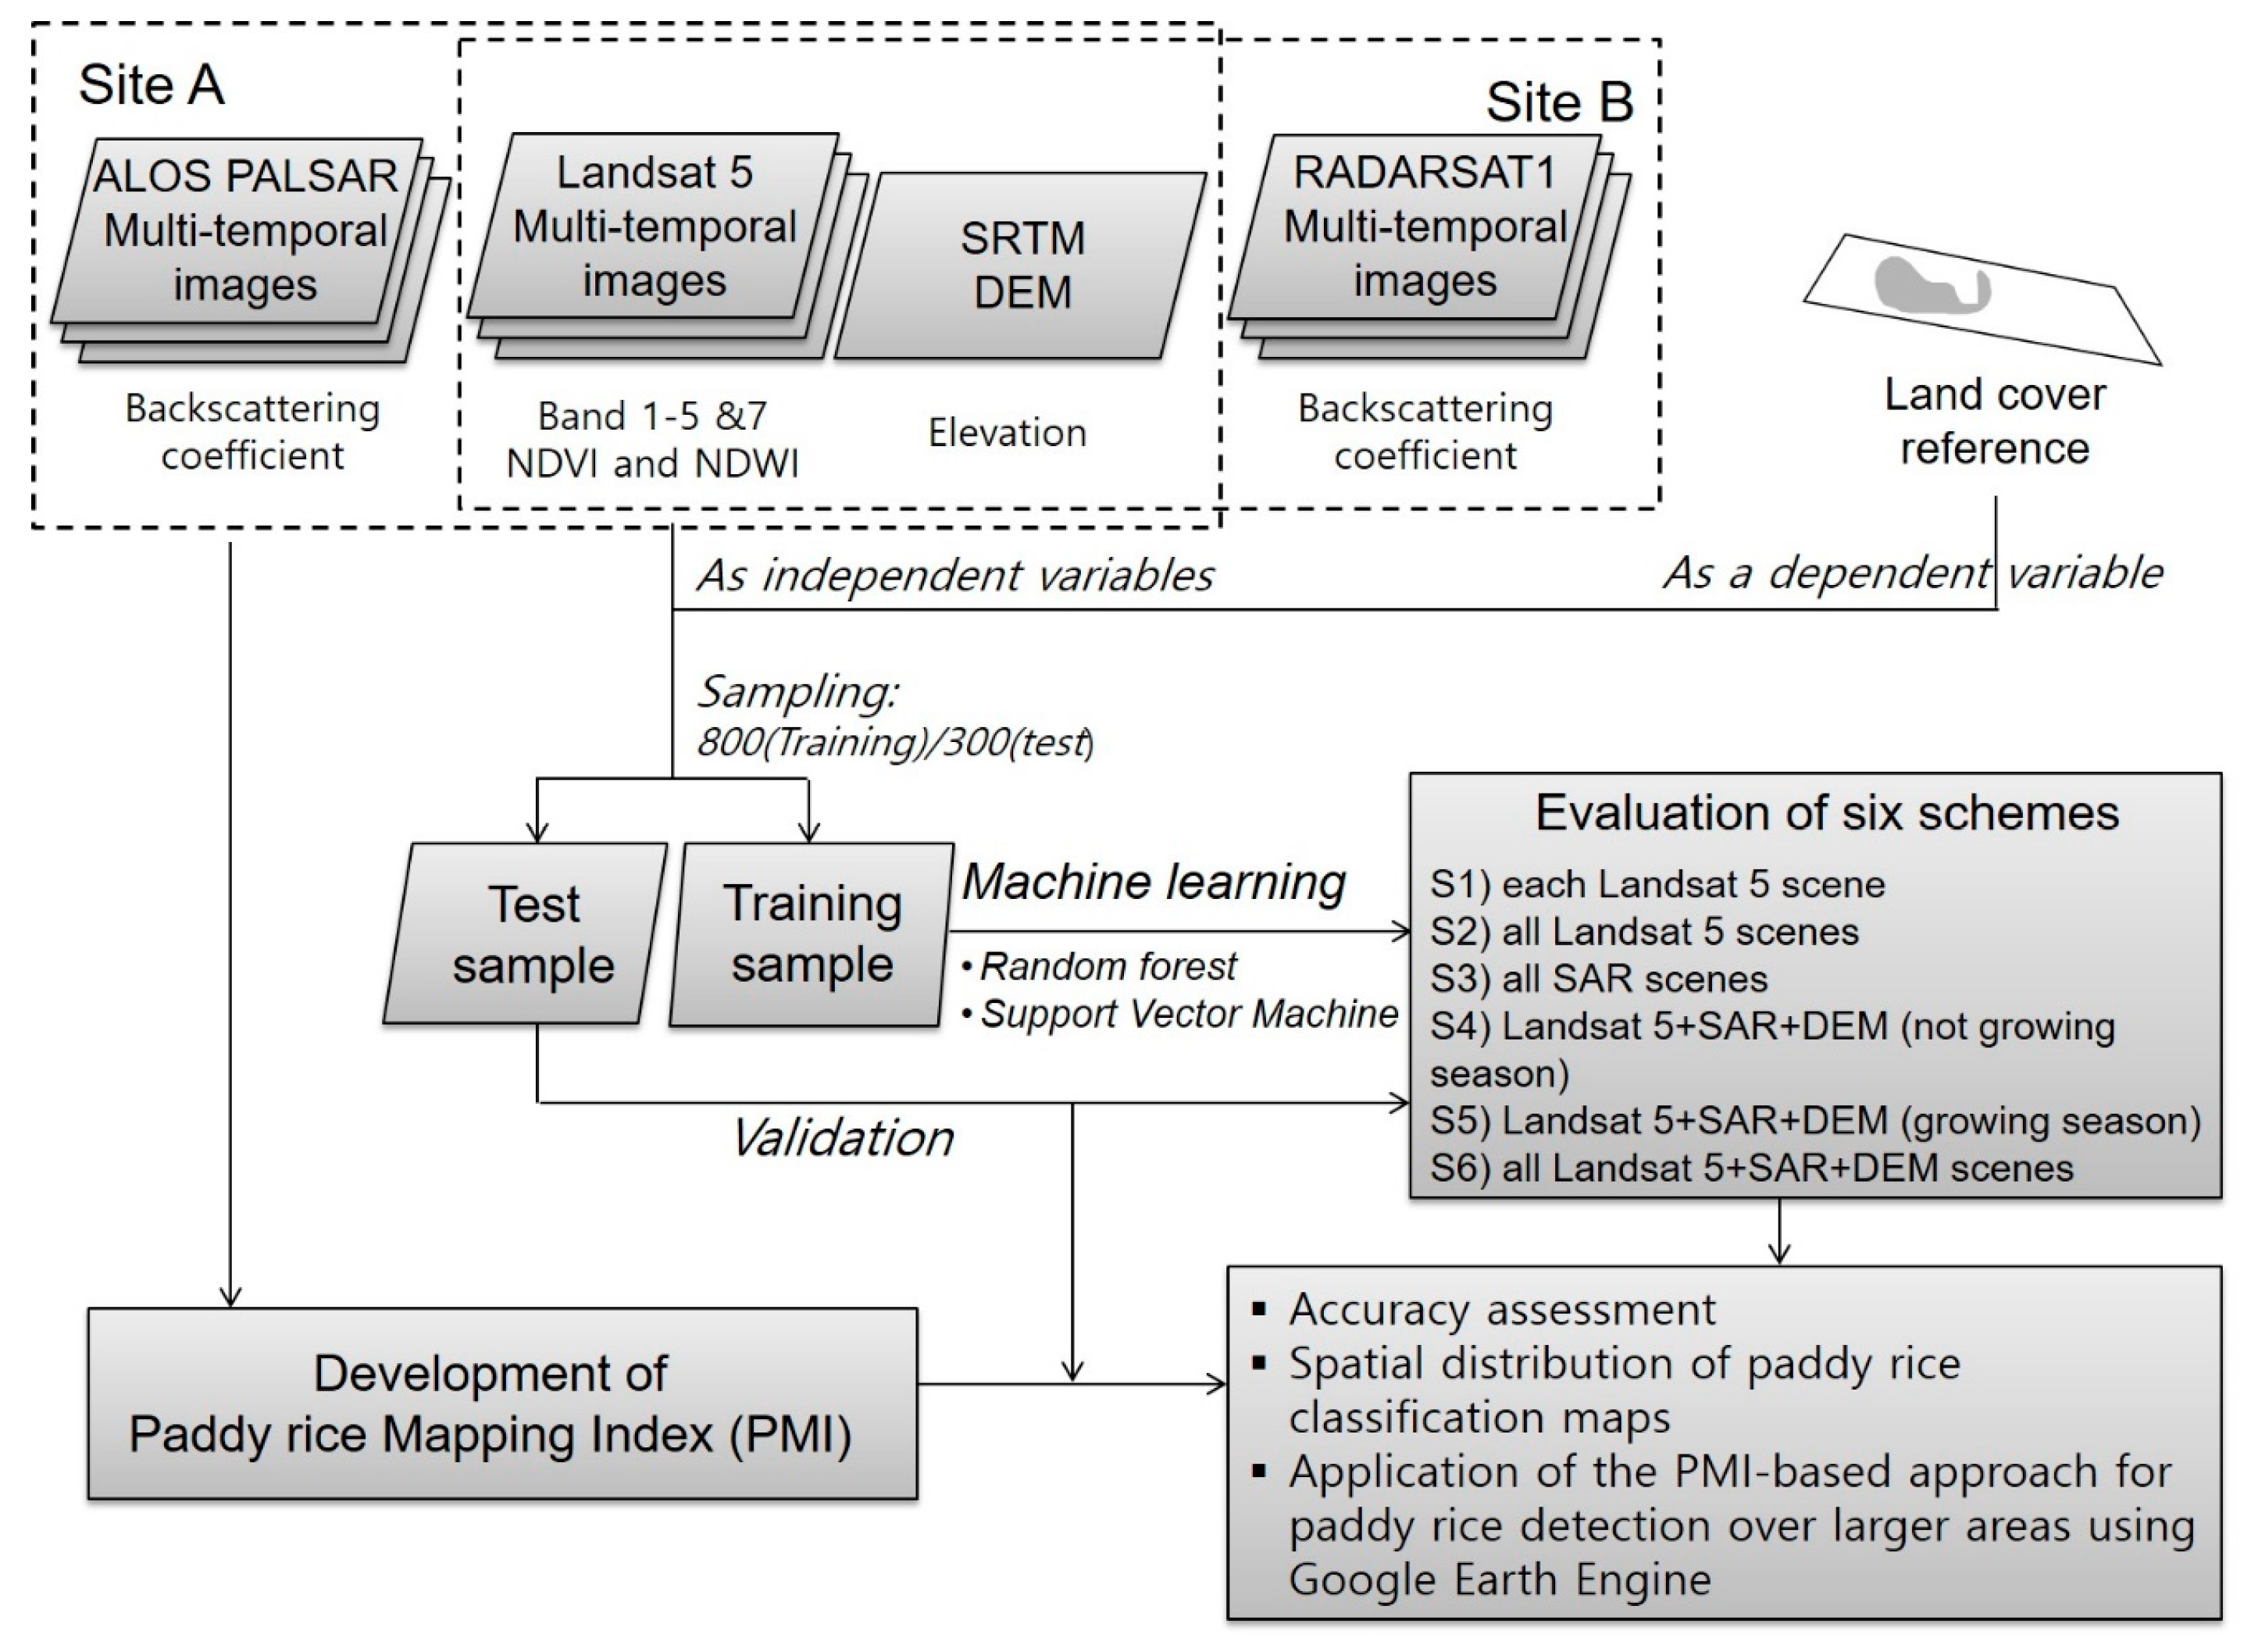
A total of 10 input variables—Landsat bands 1–5 and 7, NDVI, NDWI, SAR backscattering coefficients, and DEM—were used for paddy rice classification.
Figure 3 shows a flowchart of this study. Classification models were constructed using training data through two machine learning approaches, RF and SVM.
RF is based on classification and regression trees (CART), which is a non-parametric model and constructs rule sets from data [
42,
43]. RF has two randomization processes, randomly selecting a subset of training samples (e.g., ~70%) for each tree and selecting a subset of variables at each node of a tree (e.g., squared root of the number of total variables). RF consists of many decision trees (the number of trees is 1000 in this study), and each tree has a decision. Finally, the class of an unknown pixel is determined through the majority voting of the results of trees. RF has been successfully conducted for various classification tasks in the literature [
38,
44,
45,
46,
47,
48,
49,
50,
51]. RF also provides information about relative variable importance. Relative variable importance is based on an increased mean squared error (MSE) using out-of-bag data (i.e., unused training samples for each tree), which is calculated when randomly permuting an independent variable [
52,
53]. In this study, RF was implemented by R software (
https://www.r-project.org/) through Random forest package with default settings (i.e., the number of randomly sampled variables as candidates at each split is the square root of the number of input variables; the minimum size of the terminal node is 1), except for the number of trees.
SVM is a supervised non-parametric approach and has been used in many studies in the remote sensing field [
54,
55,
56,
57,
58,
59,
60]. The use of SVM has significantly increased because it works well in cases of limited training data sets and produces higher accuracy than other traditional approaches, such as Maximum Likelihood (ML) [
61,
62]. SVM conducts classification by determining hyperplanes that optimally separates classes [
63]. One hyperplane only separates two classes so multiple hyperplanes are used to classify multiple classes. Kernel functions are typically adopted to transform the data dimensionality to make it easy to identify optimum hyperplanes. There are various kernel functions including linear, polynomial, radial basis function (RBF), and sigmoid [
64]. This study used RBF kernel, widely used in classification tasks, and a grid-search method was used to determine the optimum values of parameters (i.e., gamma in the kernel function and penalty parameter) [
65,
66].
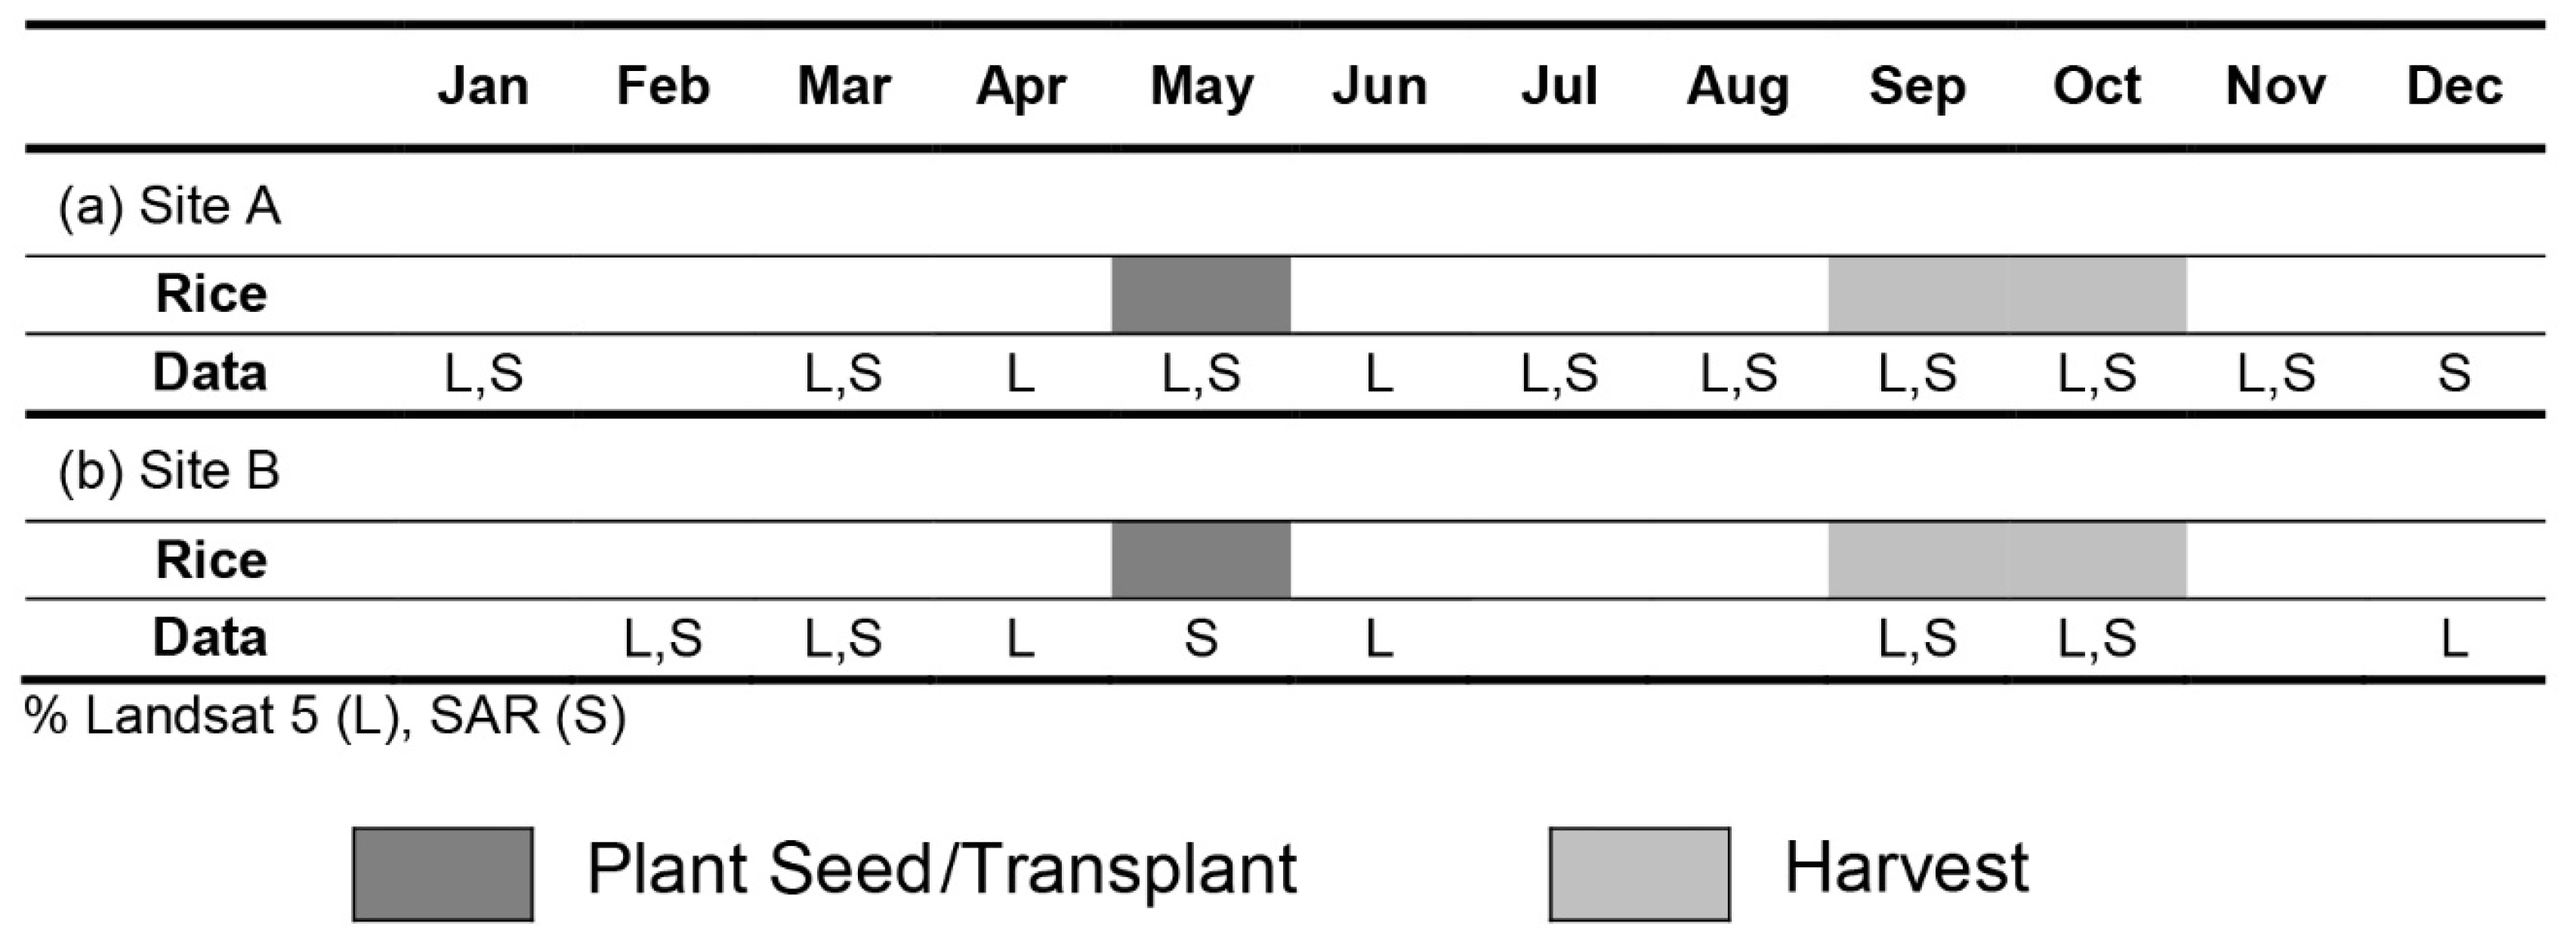
In this study, six schemes were tested to identify the improvement of classification performance when fusing multi-sensor time series data. Accuracy assessment was conducted under each scenario using test data (300 samples). Overall accuracies of multi-class classification (six classes for site A and eight classes for site B) and binary classification (i.e., paddy rice vs. non-paddy rice) were calculated for six schemes. The six schemes were designed considering sensor types and collection dates.
Scheme 1 (S1): only Landsat data on each date were used for classification.
Scheme 2 (S2): only Landsat data on all dates were used for classification.
Scheme 3 (S3): only SAR data on all dates were used for classification.
Scheme 4 (S4): Landsat, SAR, and DEM data during no growing season (November to March) were used for classification.
Scheme 5 (S5): Landsat, SAR, and DEM data during the growing season (April to October) were used for classification.
Scheme 6 (S6): Landsat, SAR, and DEM data on all dates were used for classification.
In order to evaluate the significant difference between classifications, the McNemar test, a non-parametric test based on the proportion correct/incorrect was conducted. Large error matrices can be collapsed to a binary size (i.e., 2 × 2) as the binary distinction between correct and incorrect class allocations should be focused for comparison [
67,
68]. The standardized normal test statistics (z) from the McNemar test is calculated as:
where f
AB indicates the samples correctly identified in classification A, but is incorrectly classified in classification B; and, f
BA means the samples correctly identified in classification B, but incorrectly classified in classification A. The 5% level of significance (α = 0.05) was used for the McNemar test.
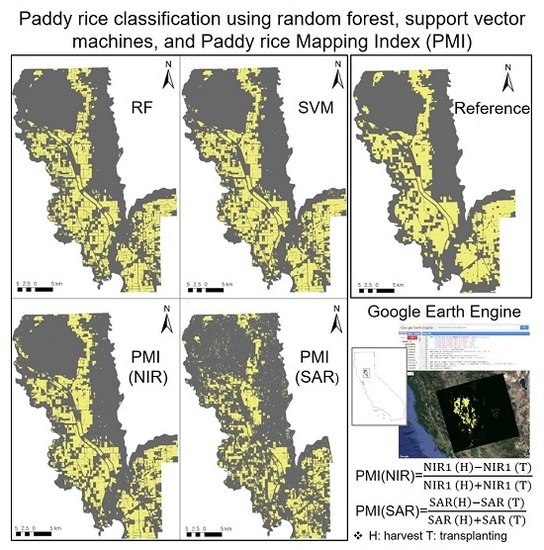
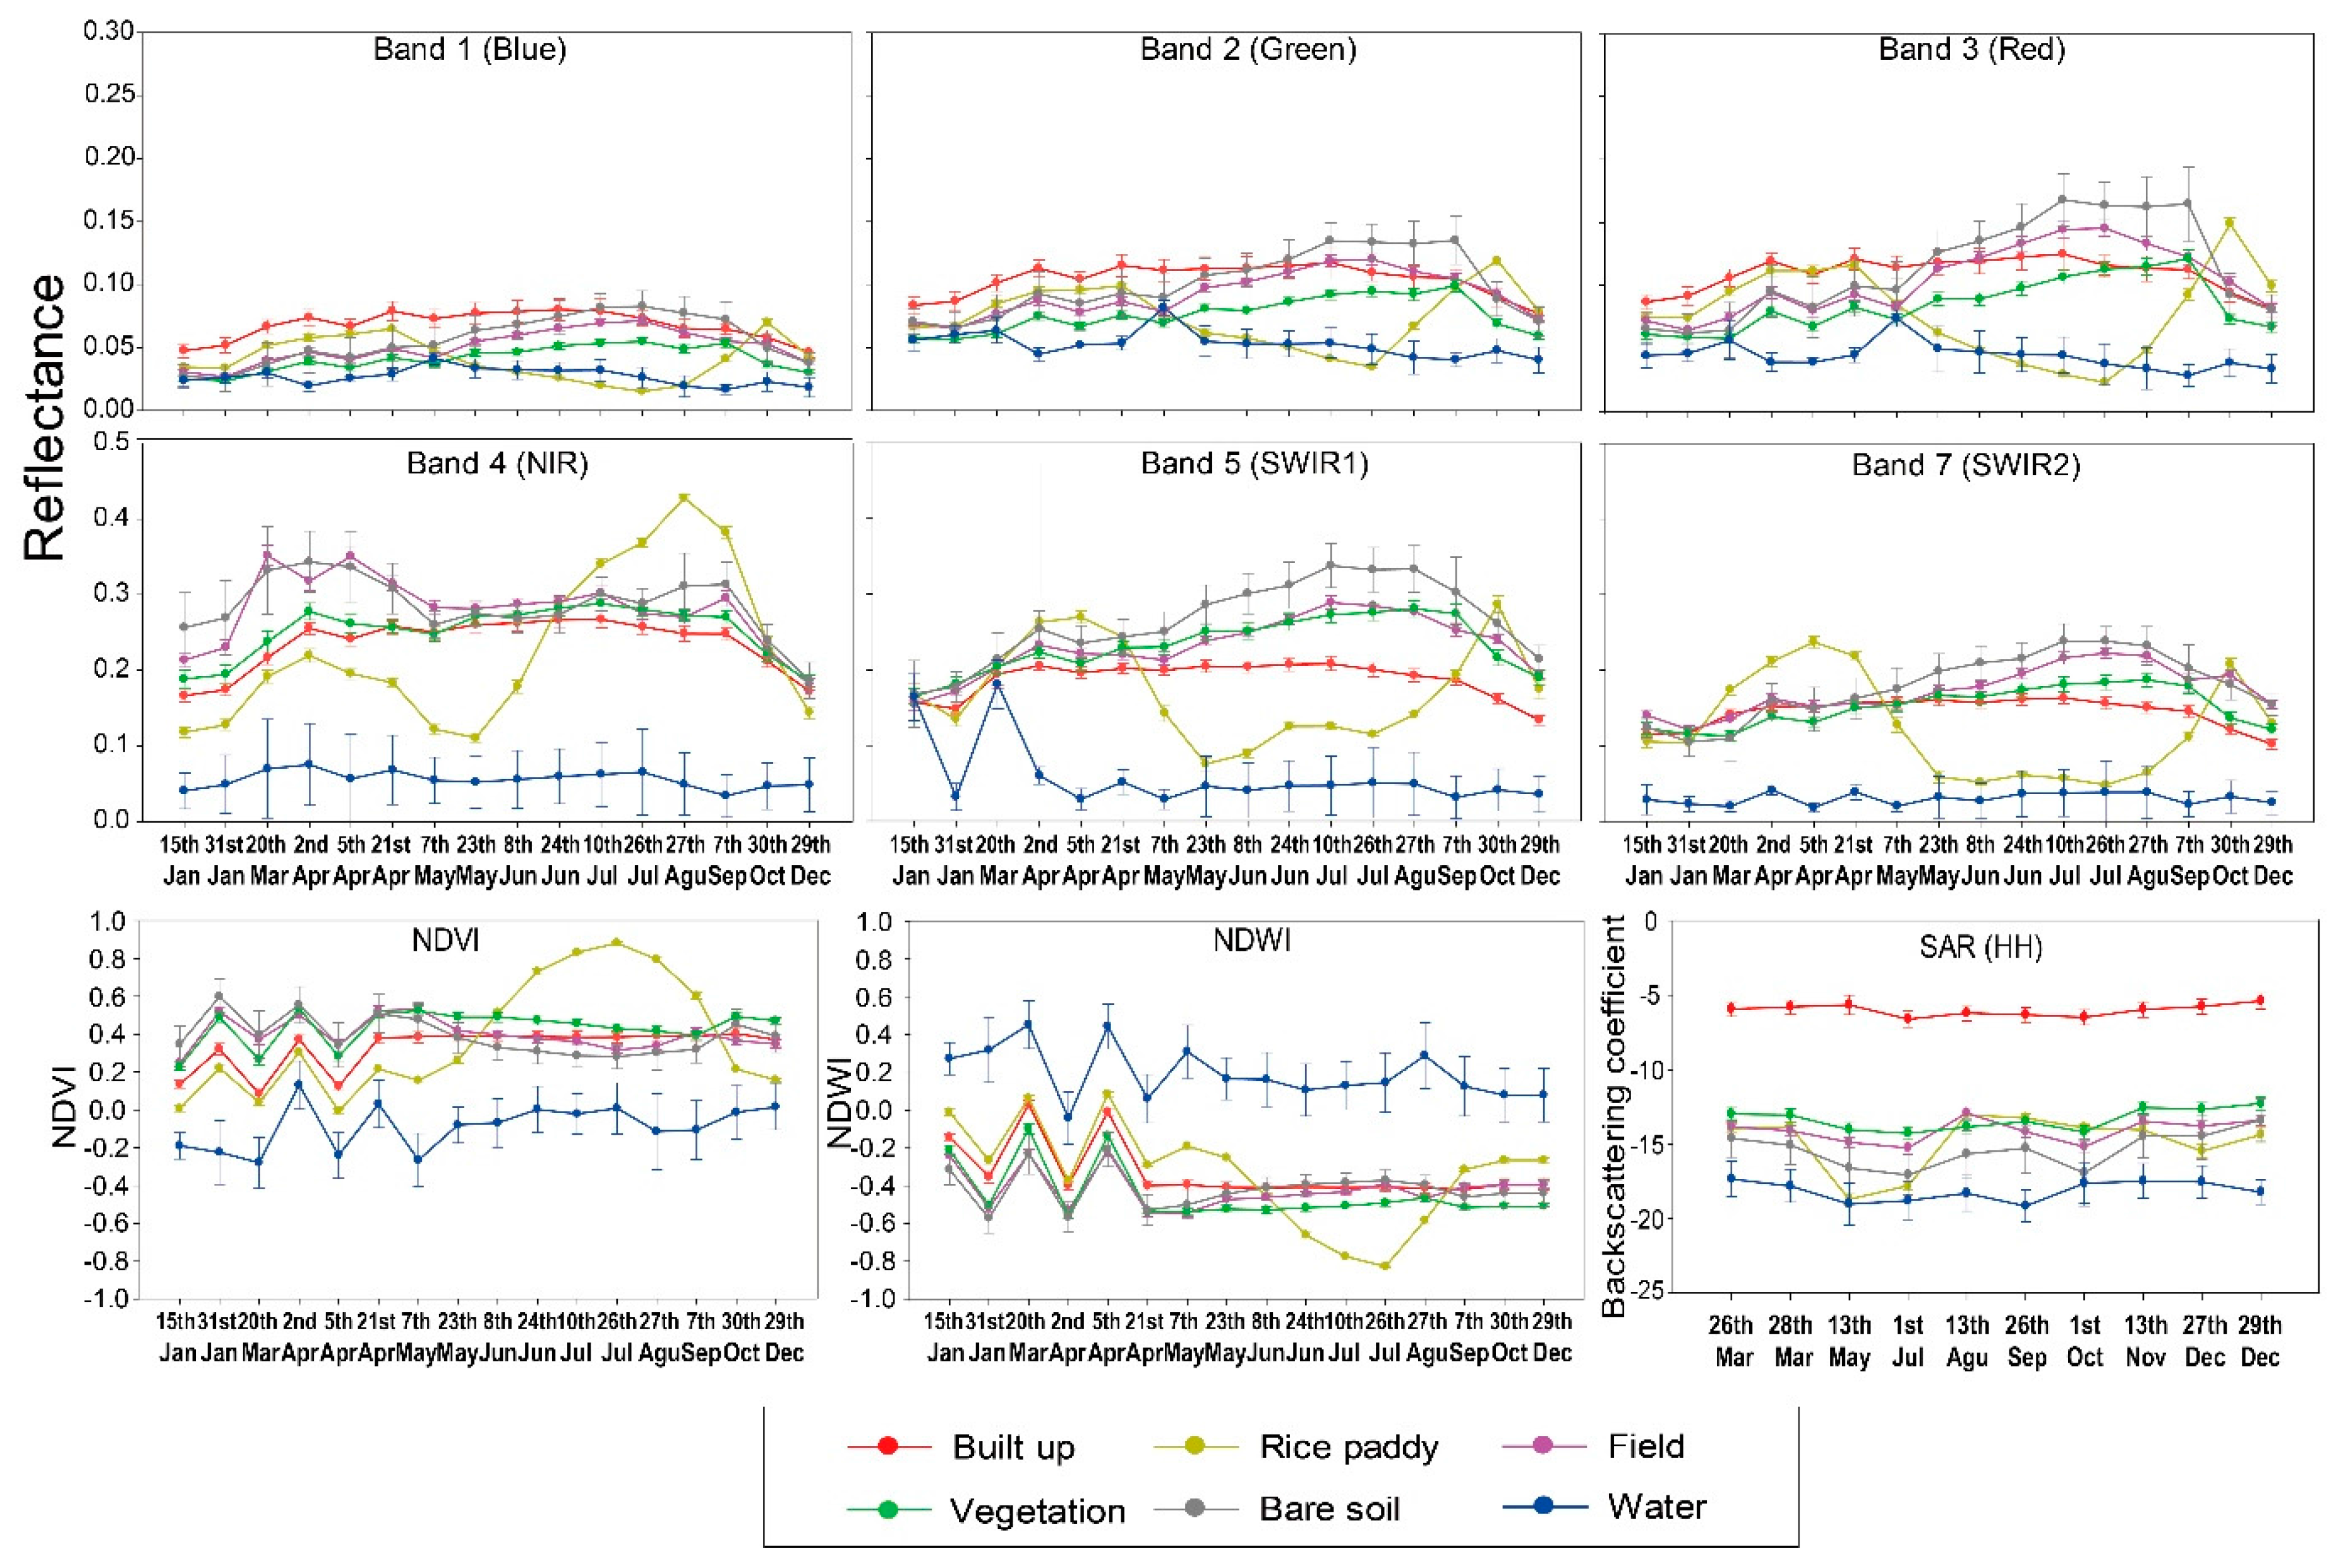
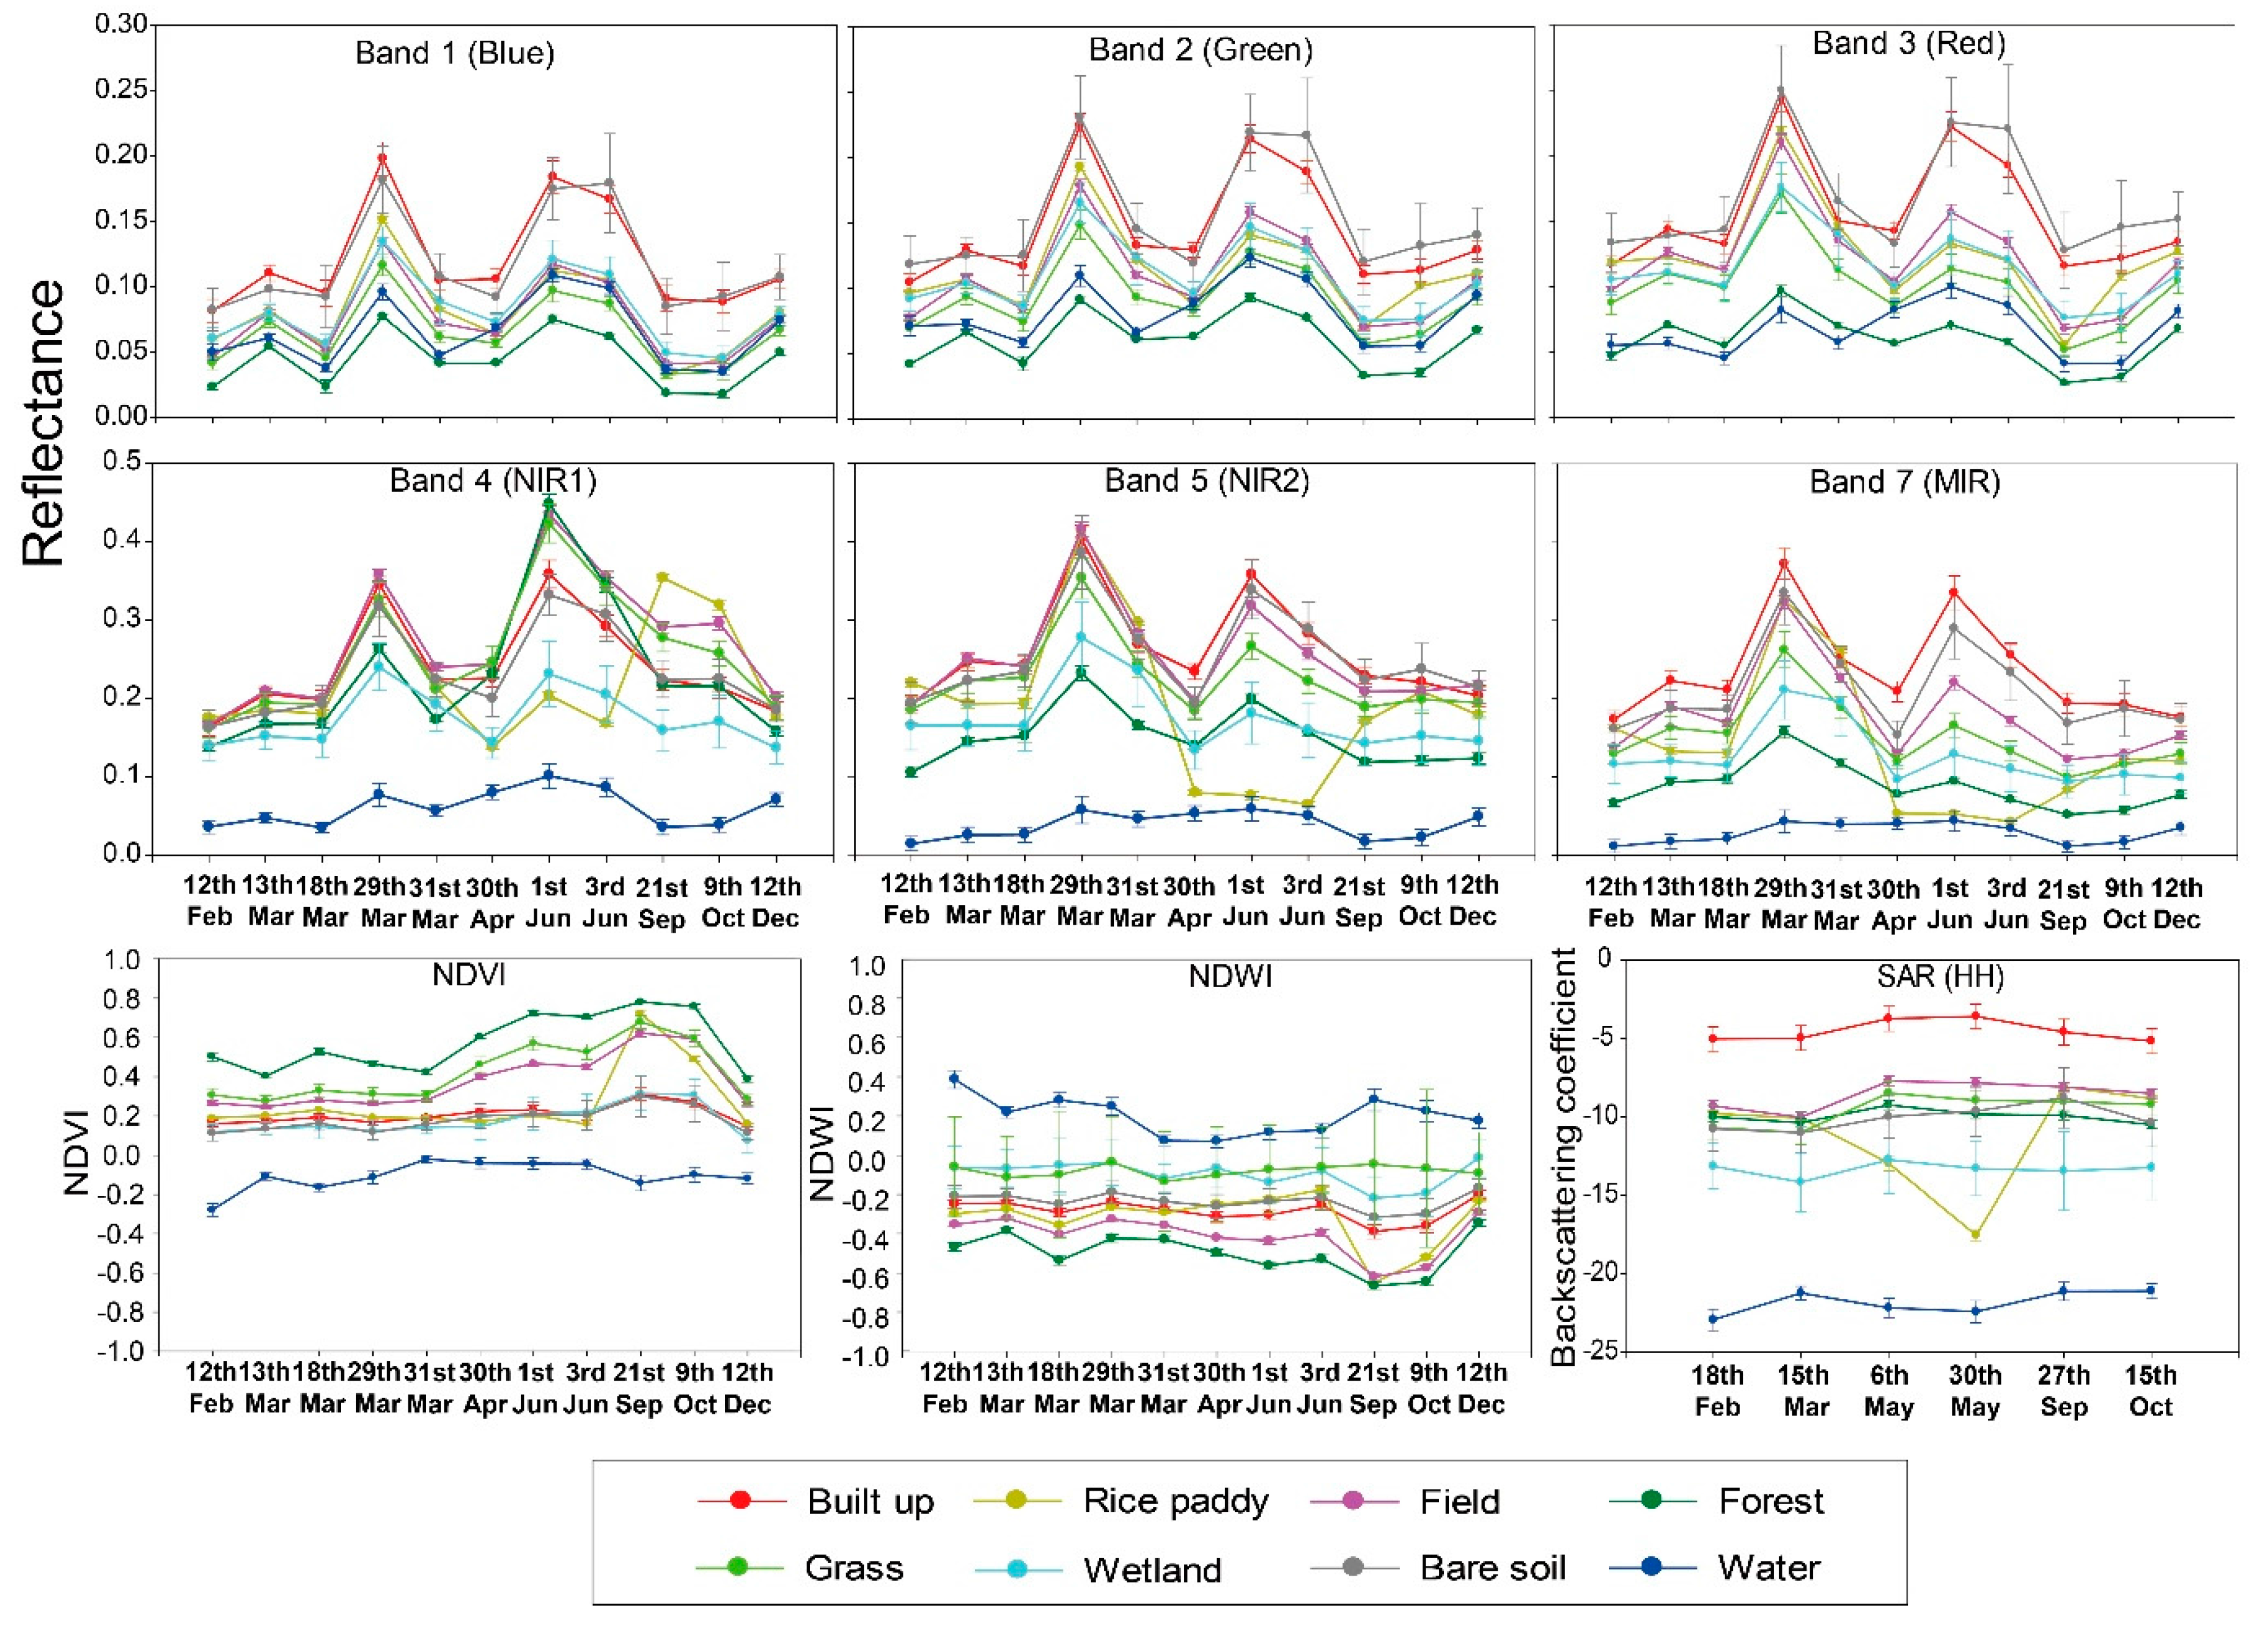
Important spectral and temporal characteristics for paddy rice classification were identified from the temporal pattern of each variable and variable importance, as provided by RF. In this study, Paddy rice Mapping Index (PMI) was proposed by considering the phenological characteristics of paddy rice in NIR and SAR backscattering coefficients. NIR reflectance and SAR backscattering coefficients are low during the planting/transplanting season (May) and increase during the growing season (
Figure 4 and
Figure 5). Paddy rice maps were produced from two classification models and PMI. The spatial distribution of the paddy rice maps was also compared with the reference paddy rice maps. PMI-based paddy rice mapping over a larger area (i.e., entire California State) was also conducted using Google Earth Engine.
5. Discussion
Paddy rice classification was conducted by expanding the dimensionality of data on both spectral and temporal domains using two machine learning approaches, RF and SVM. The six schemes that were composed of various combinations of input data by sensor and collection date were carried out, and the effect of data dimensionality was analyzed over two different regions. The spectral and temporal characteristics of paddy rice were identified, and Paddy rice Mapping Index (PMI) was proposed based on the phenological characteristics of paddy rice.
SAR data contributed to paddy rice classification more for site A than site B, which implies that it might not be ideal to use SAR data only for paddy rice classification in areas with rugged terrains and heterogeneous land cover. Nonetheless, SAR data were able to improve classification accuracy when using with Landsat data. Although it is considered that the fusion of Landsat and SAR might not be necessary for areas with low cloud cover, such a fusion can be effective to paddy rice classification for Asia because most regions in Asia are very cloudy, especially for the growing season, which limits the availability of optical time series data.
The performance of SVM was better than that of RF at both sites, which is consistent with Pouteau et al. [
70] and Raczko & Zagajewski [
71]. In this study, classifications were conducted in a 10-dimensional feature space for scheme 1, and more than 60-dimensional feature space for the other schemes. As SVM is known to work well in a large dimensional feature space, it could be better for SVM to classify paddy rice than RF [
70]. Raczko and Zagajewski [
71] stated that the number of training samples has an impact on the performance of a classifier, and Kavzoglu & Mather [
72] stated that more than 400 pixels per class are needed for robust classification. In this study, a relatively small number of training samples (less than 200 pixels per class) were used, which might explain the better performance of SVM than RF because SVM works well with a small sample size as well as mixed pixels [
56,
73].
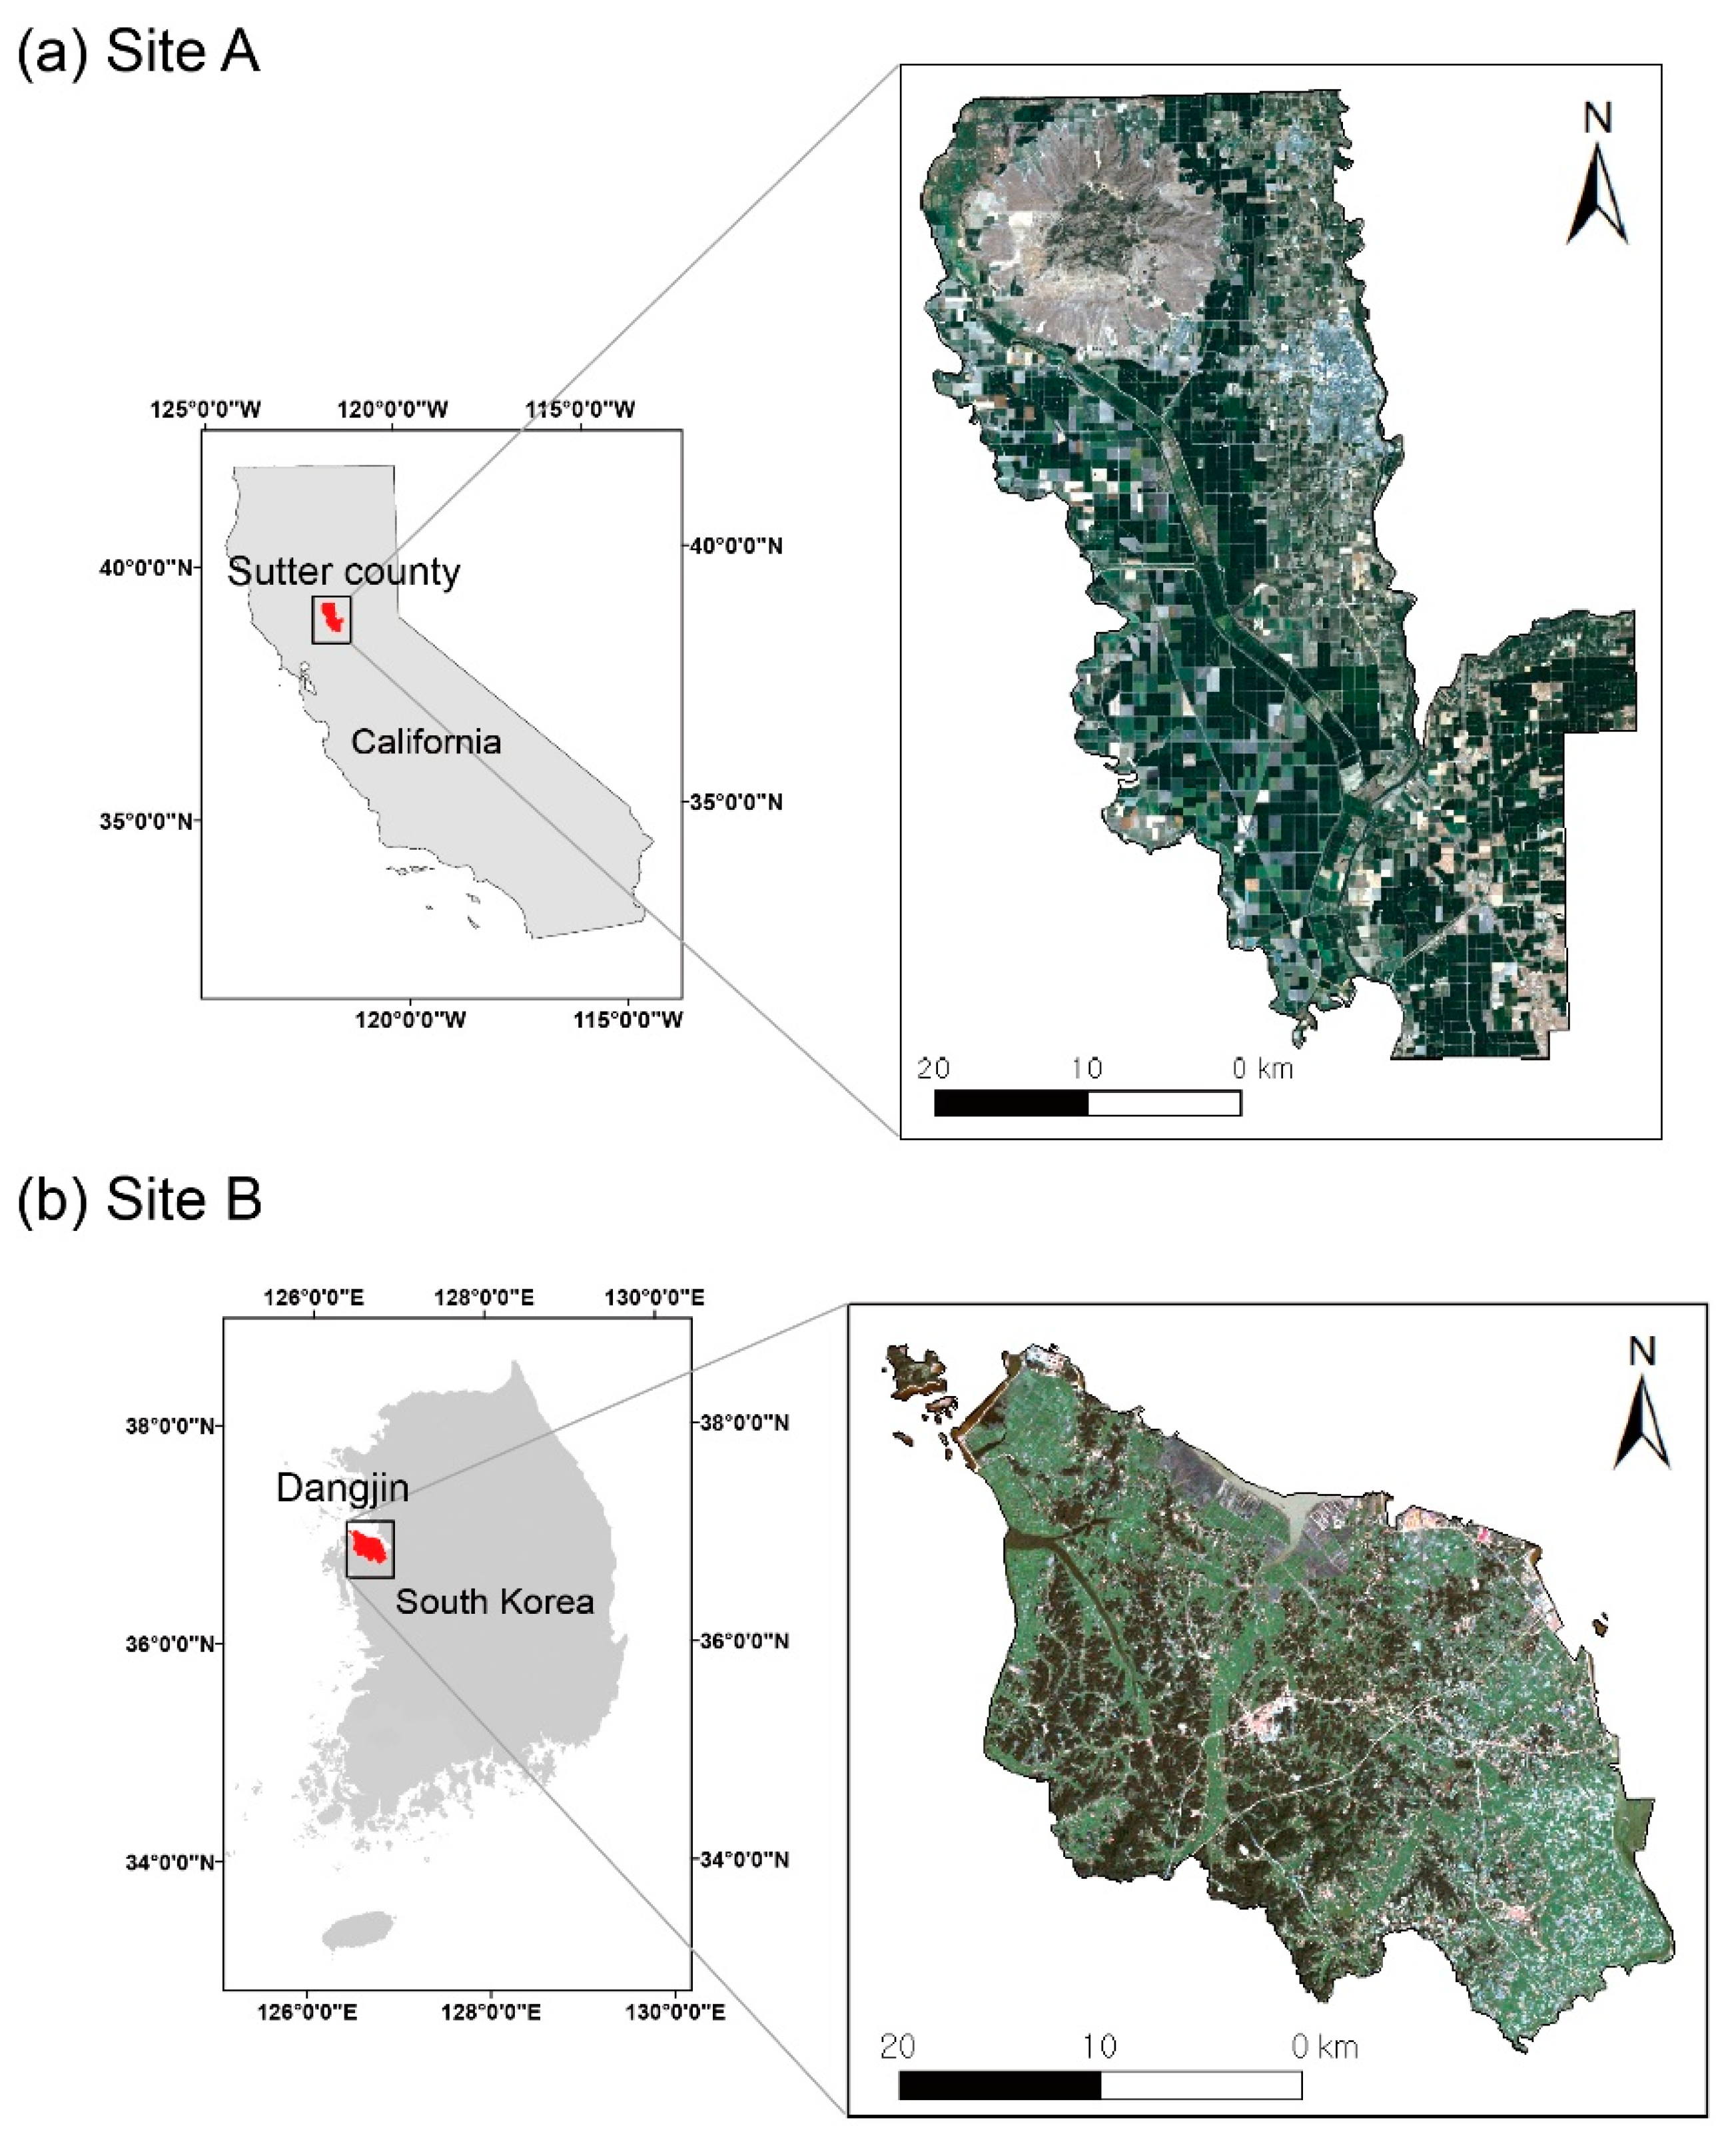
Land cover was more heterogeneous in site B than site A with a higher number of classes (six classes in site A and eight classes in site B). The population density of site B (249 people/km
2) was about four times more than that of site A (61 people/km
2), and classes were more patched and thus more mixed within a pixel in site B than site A. Those factors influenced the classification accuracy at site B. The size of paddy rice fields needs to be considered in the future research as discussed in Dong et al. [
17]. Higher resolution data, such as RapidEye, are needed to classify paddy rice where the size of paddy rice field is small, such as in site B.
The approach proposed in this study have benefited from the use of phenological characteristics of paddy rice (i.e., time series data). The phenology of paddy rice in terms of various spectral bands and vegetation indices can be used for numerous applications because such phenology is a relative characteristic that varies by region. There are many fields that use the phenological characteristics of crops (e.g., paddy rice), such as classifying different vegetation (crop) types [
74,
75], crop yield estimation [
76,
77], gross and net primary production (GPP/NPP) estimation [
78], and quantifying crop water requirements [
79]. In addition, the approach that was developed in this study can be applied to any inaccessible regions where in situ data are not available, such as North Korea. For example, previous studies conducted classification over inaccessible regions applying training samples from different areas that have similar climate and environmental characteristics [
80] or unsupervised classification [
81].
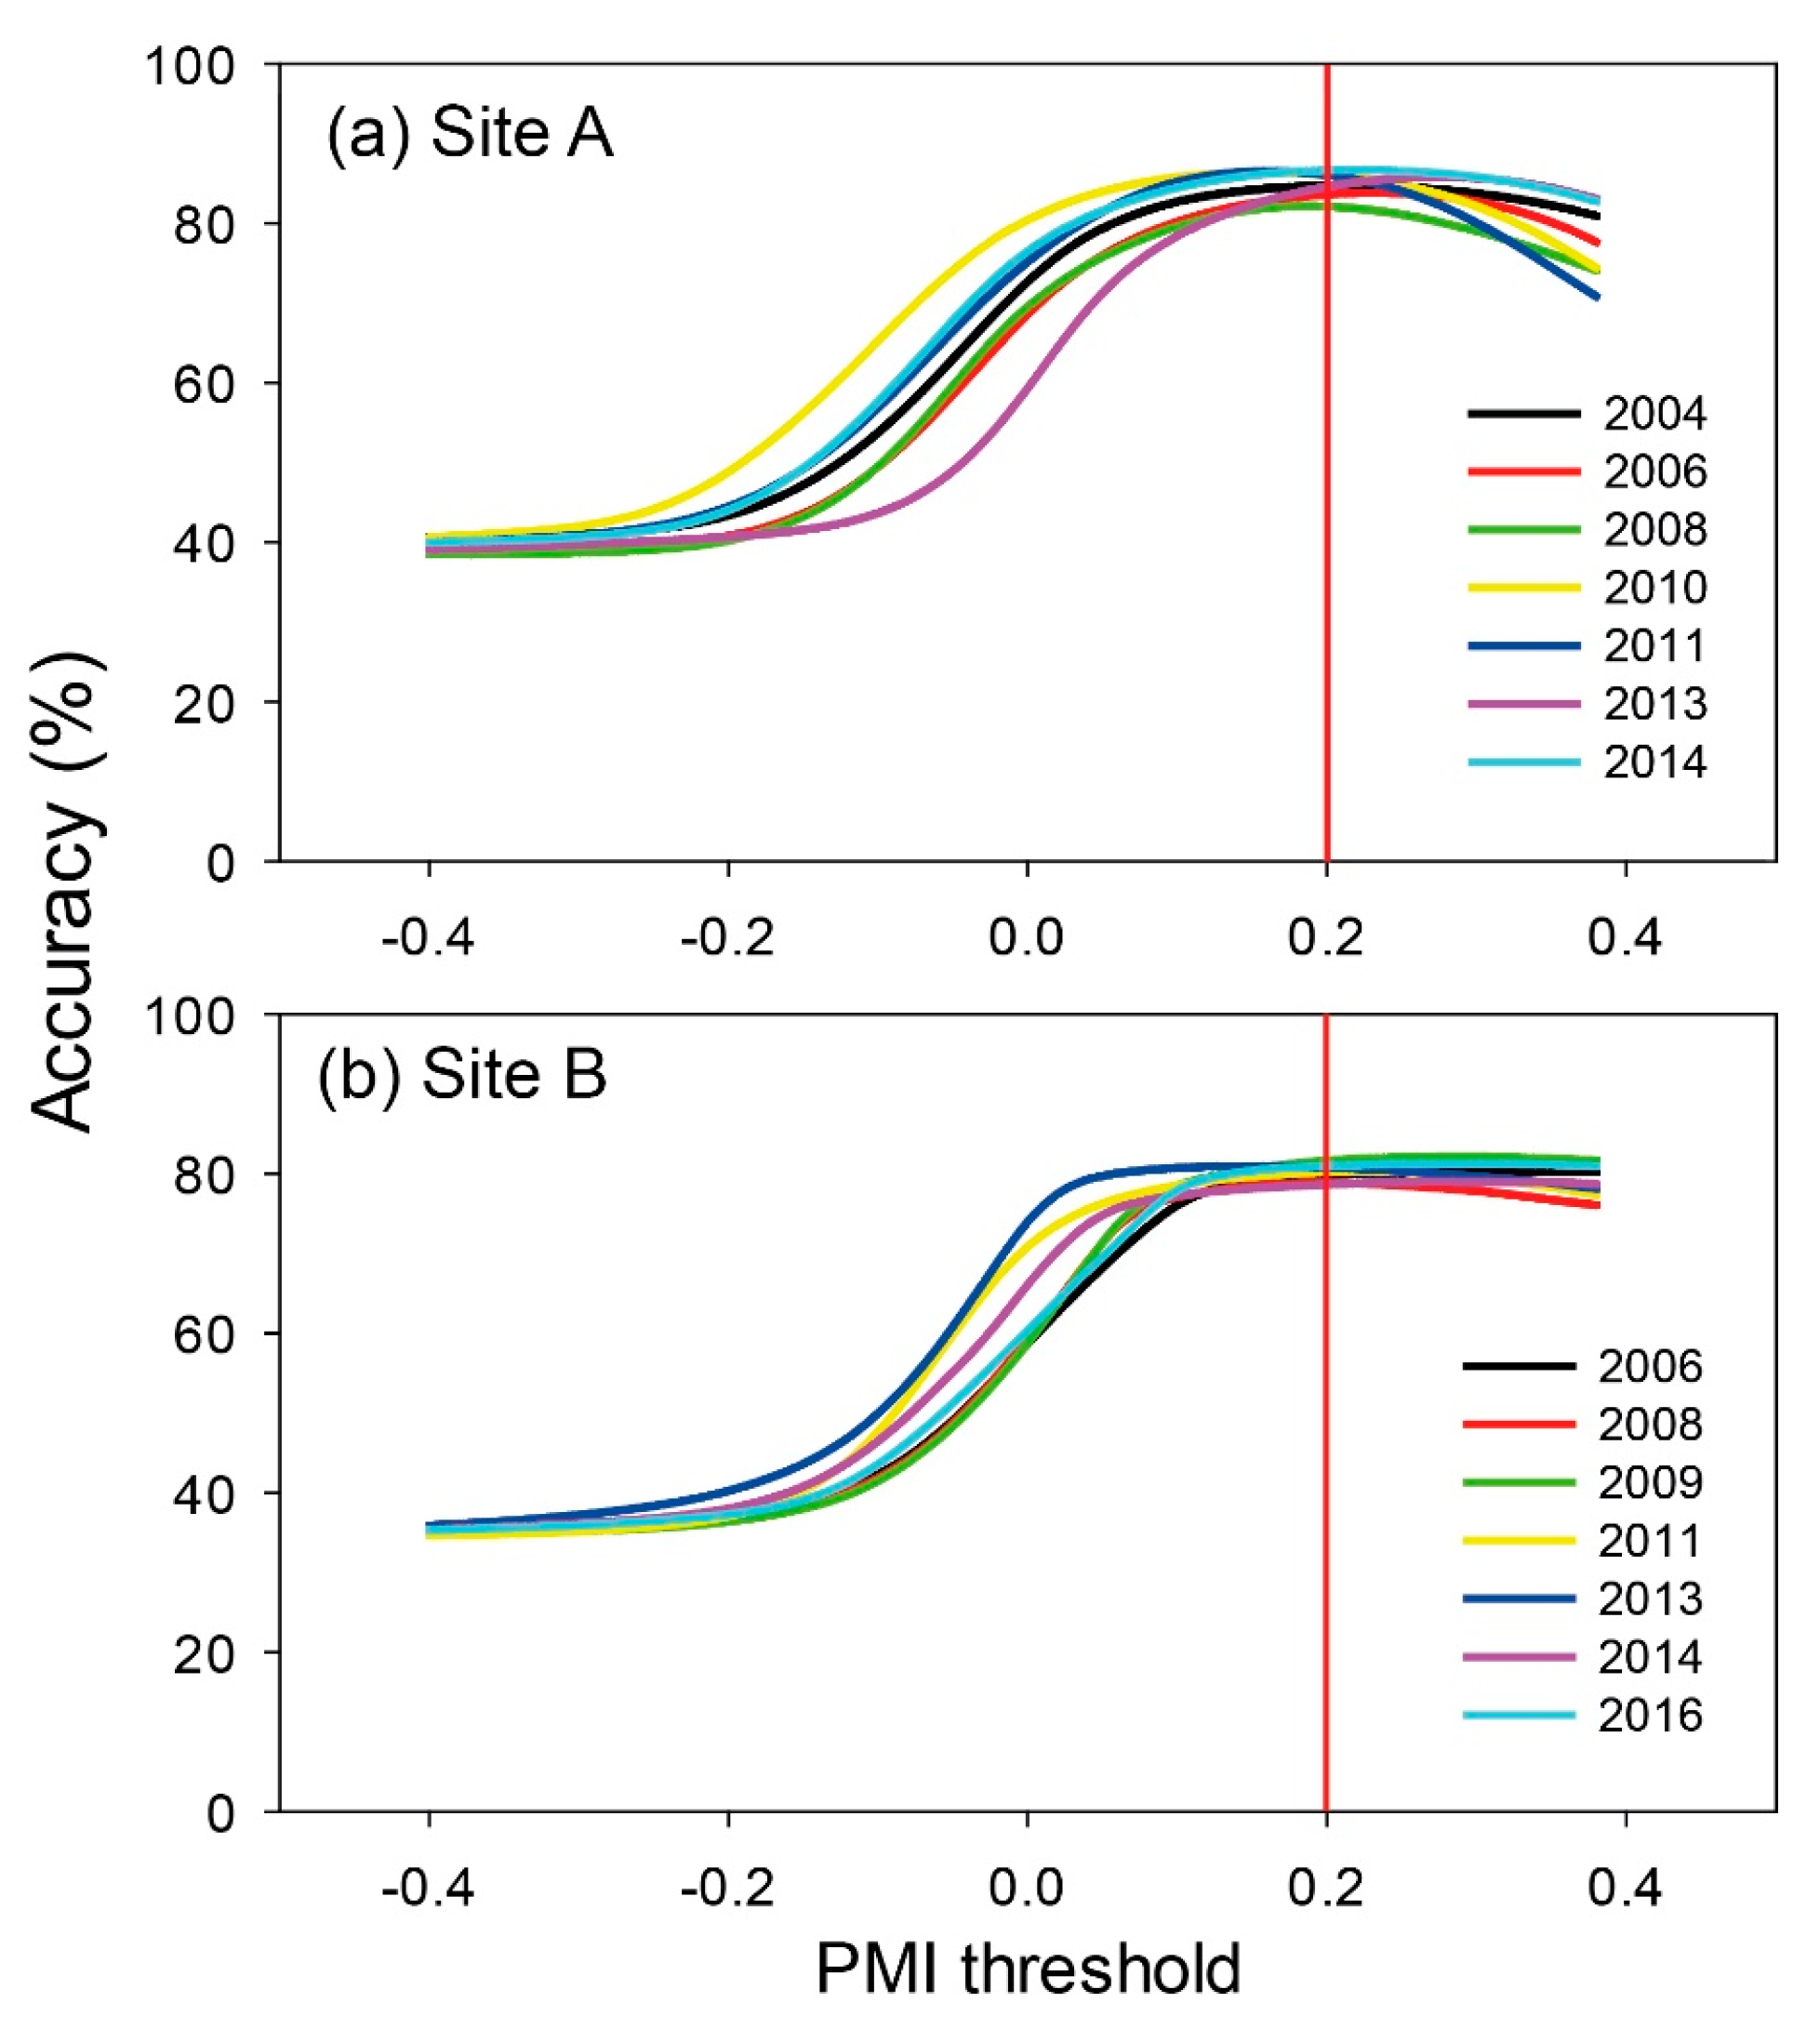
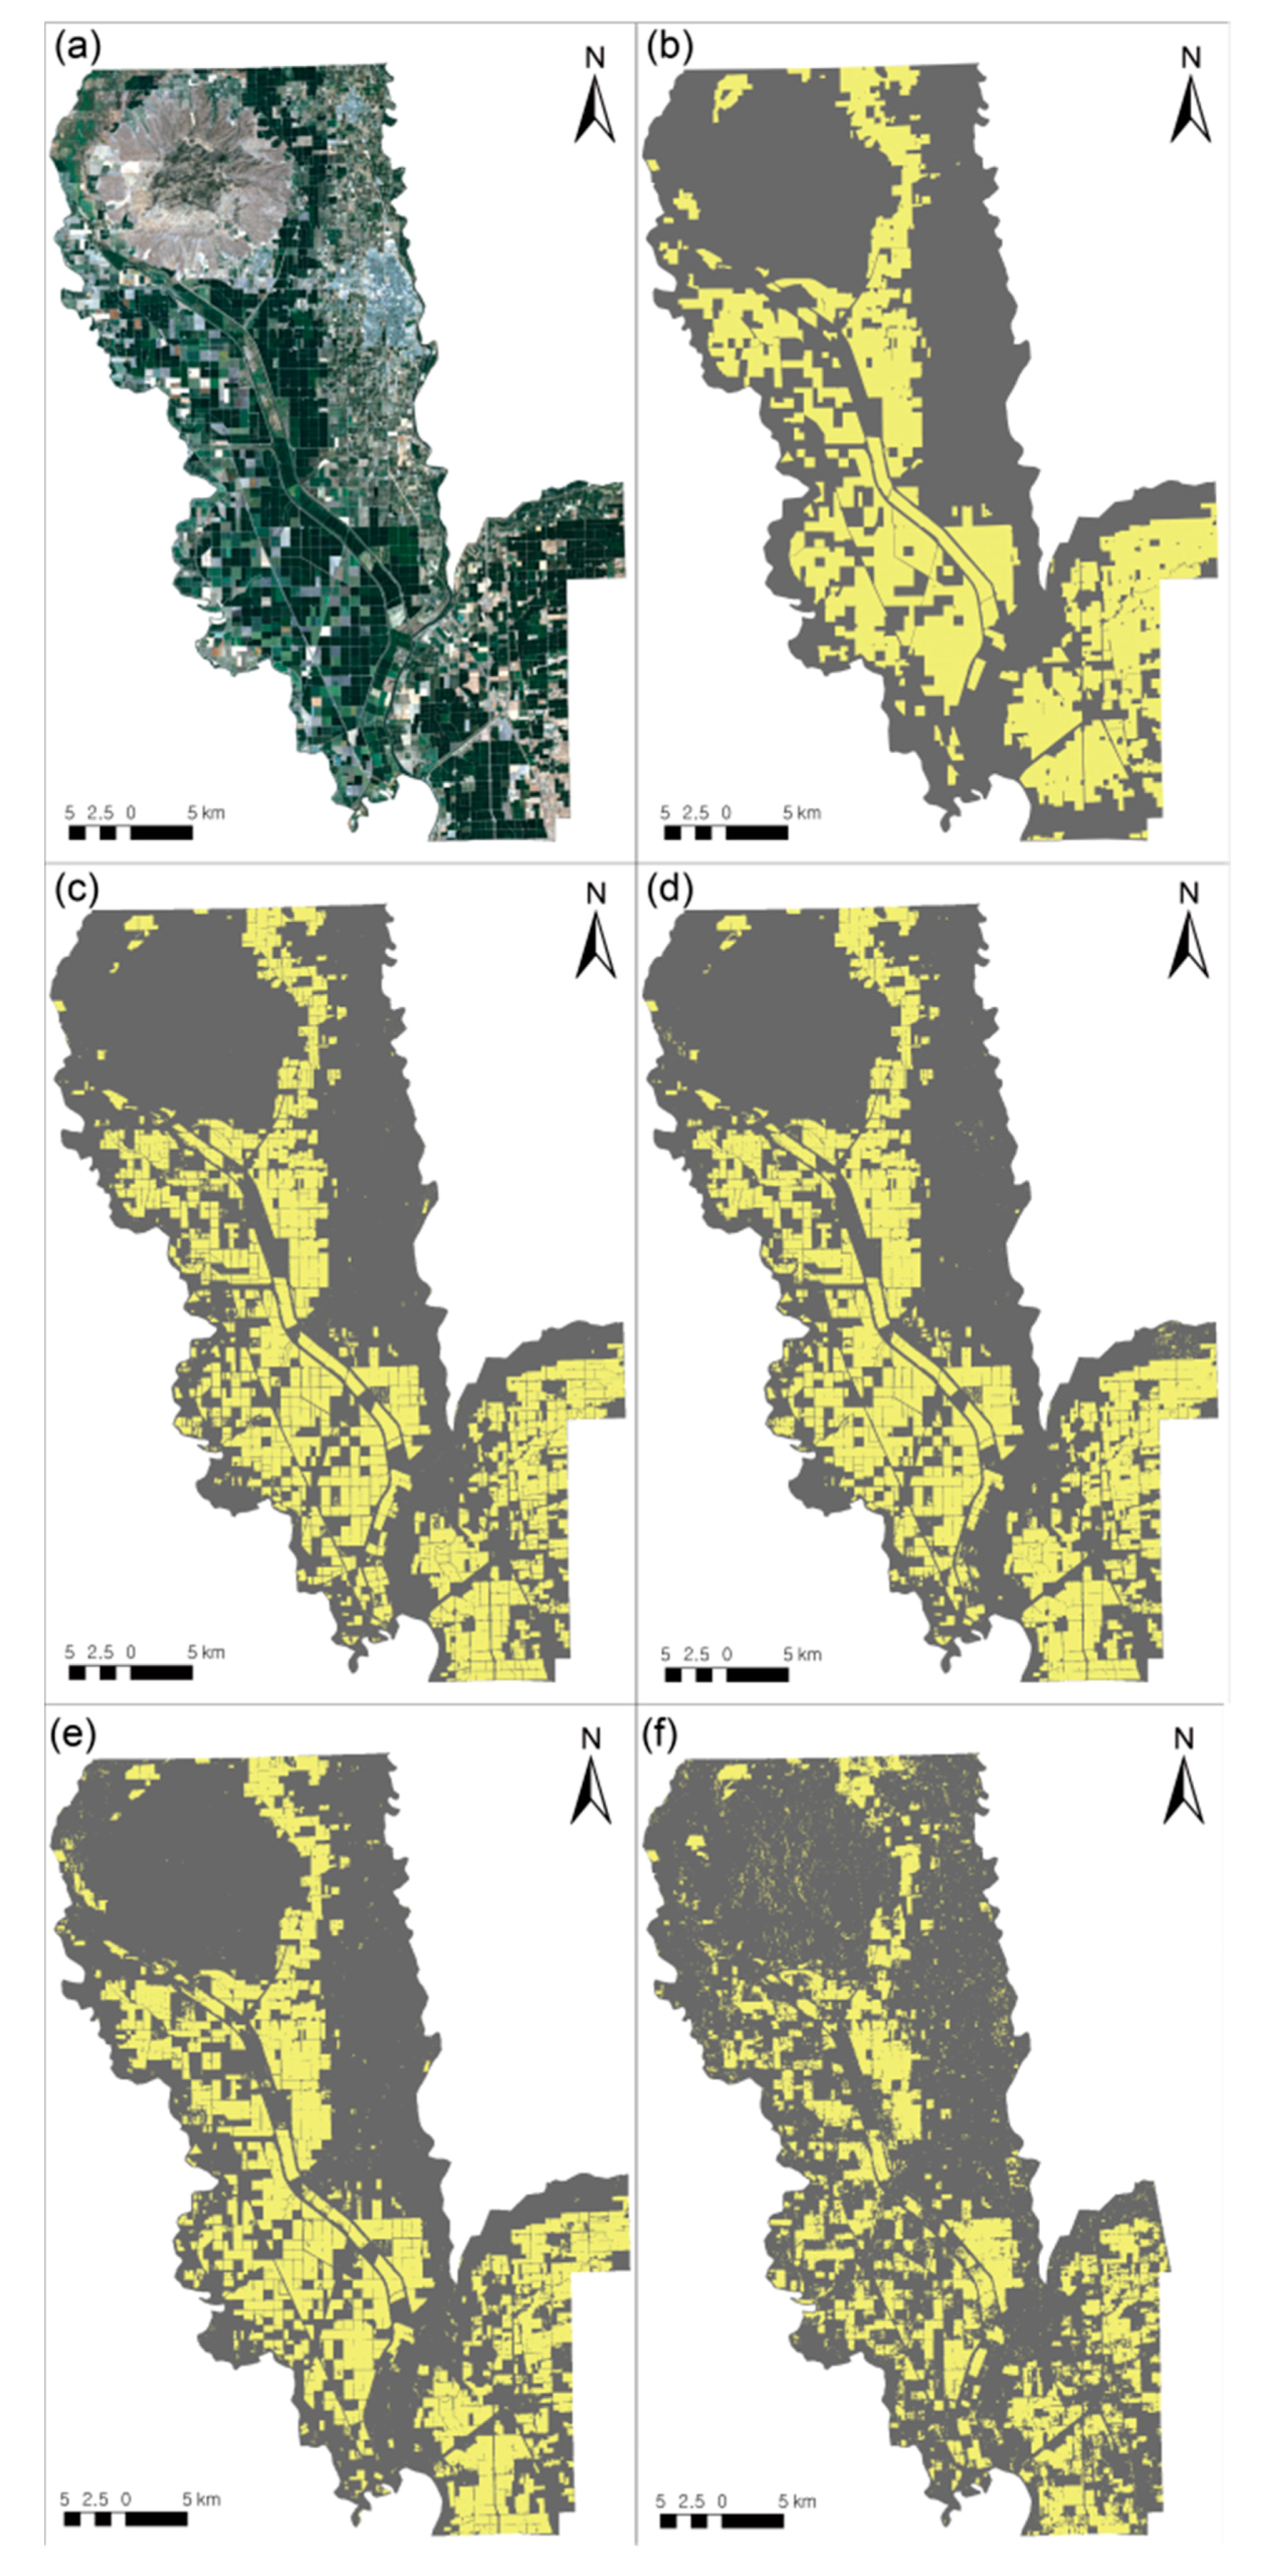
While machine learning-based classification requires training data, which is often challenging for certain areas, PMI-based paddy rice mapping does not require any in situ data for training. Although the validation accuracy of PMI based results was relatively lower than those of the machine learning approaches, the spatial distribution of paddy rice well matched that of the reference paddy rice data. PMI can be applied to different regions with the same threshold (greater than 0.2) or an adjusted threshold considering the dates of data acquisition. Consequently, PMI is considered to be useful to map paddy rice because PMI is calculated using a very simple equation and needs only two Landsat images or similar satellite data with NIR bands during the planting and harvest seasons. An annual update of paddy rice maps is possible using PMI. However, the availability of optical sensor data due to cloud contamination could be a limiting factor, especially for East Asia. This limitation can be overcome using geostationary satellite data, such as planned Geostationary Ocean Color Imager (GOCI)-2, which have high temporal resolution (~hourly) with 250 m spatial resolution. It is expected that fully clear images during two seasons can be successfully obtained every year using geostationary satellite data.
Paddy rice mapping at a regional or continental scale can be conducted using PMI through Google Earth Engine with an aid of the continued improvement of computing capacity. However, in this study, paddy rice detected using PMI was somewhat confused with other crops where paddy rice is planted in dry fields. It is one of the limitations of using PMI, in that PMI can be successfully applied only where paddy rice is planted in flooded fields.
6. Conclusions
As the population in the world increases, the demand of rice also increases. Thus, providing accurate and up-to-date paddy rice maps is very important. A satellite-based approach produces paddy rice maps with a fast update cycle in comparison with the traditional survey approach. In this study, Landsat, SAR, and SRTM data were used to classify paddy rice at two sites that have different climatic and environmental characteristics. This study evaluated six schemes to identify the improvement of classification performance through the investigation of the characteristics of study areas, classifiers, and fusion of multi-sensor time series data. As expected, the classification accuracy was the highest when using multi-sensor time series data (scheme 6). Site A showed better performance than site B because Site A consisted of more homogeneous land cover and had higher data availability during the growing season than site B. The performance of SVM classifier was slightly better (accuracy of 1–3%) than RF, especially at site B because SVM works well in a small sample size and at a mixed pixel. Paddy Rice Mapping Index (PMI) considering spectral and phenological characteristics of paddy rice was proposed in this study. NIR and SAR backscattering coefficients detected the phenological characteristic of paddy rice well. Although the performance of PMI is slightly worse than the RF or SVM classifications based on multi-sensor time series data, PMI is useful to operationally map paddy rice, because PMI is simply calculated only using two scenes and does not require training data, which implies that the PMI-based approach can be applied to different regions. In addition, paddy rice can be easily mapped using the Google Earth Engine platform.
There are some limitations in the use of PMI. PMI can be applied only where paddy rice areas are flooded during the transplanting season. As the current threshold, greater than 0.21, based on the results for 13 years is a little arbitrary, more robust and adaptive thresholding approaches should be considered. There are some misclassified pixels due to the heterogeneous composition of the land cover within a pixel at site B. In further studies, the size of paddy rice fields need to be considered when selecting satellite images, and higher resolution data, such as RapidEye or Worldview series, need to be evaluated to detect small size paddy rice patches.

 ,
, 


