After publication of the research paper [1], the authors wish to make the following correction. In Figures 7, 9, 11, 12, the legend depicted first-year ice (FYI) in red, and multiyear ice (MYI) in blue. The legend should have been reversed with FYI shown in blue and MYI in red. Both original and corrected versions of Figures 7, 9, 11, and 12 are given below.
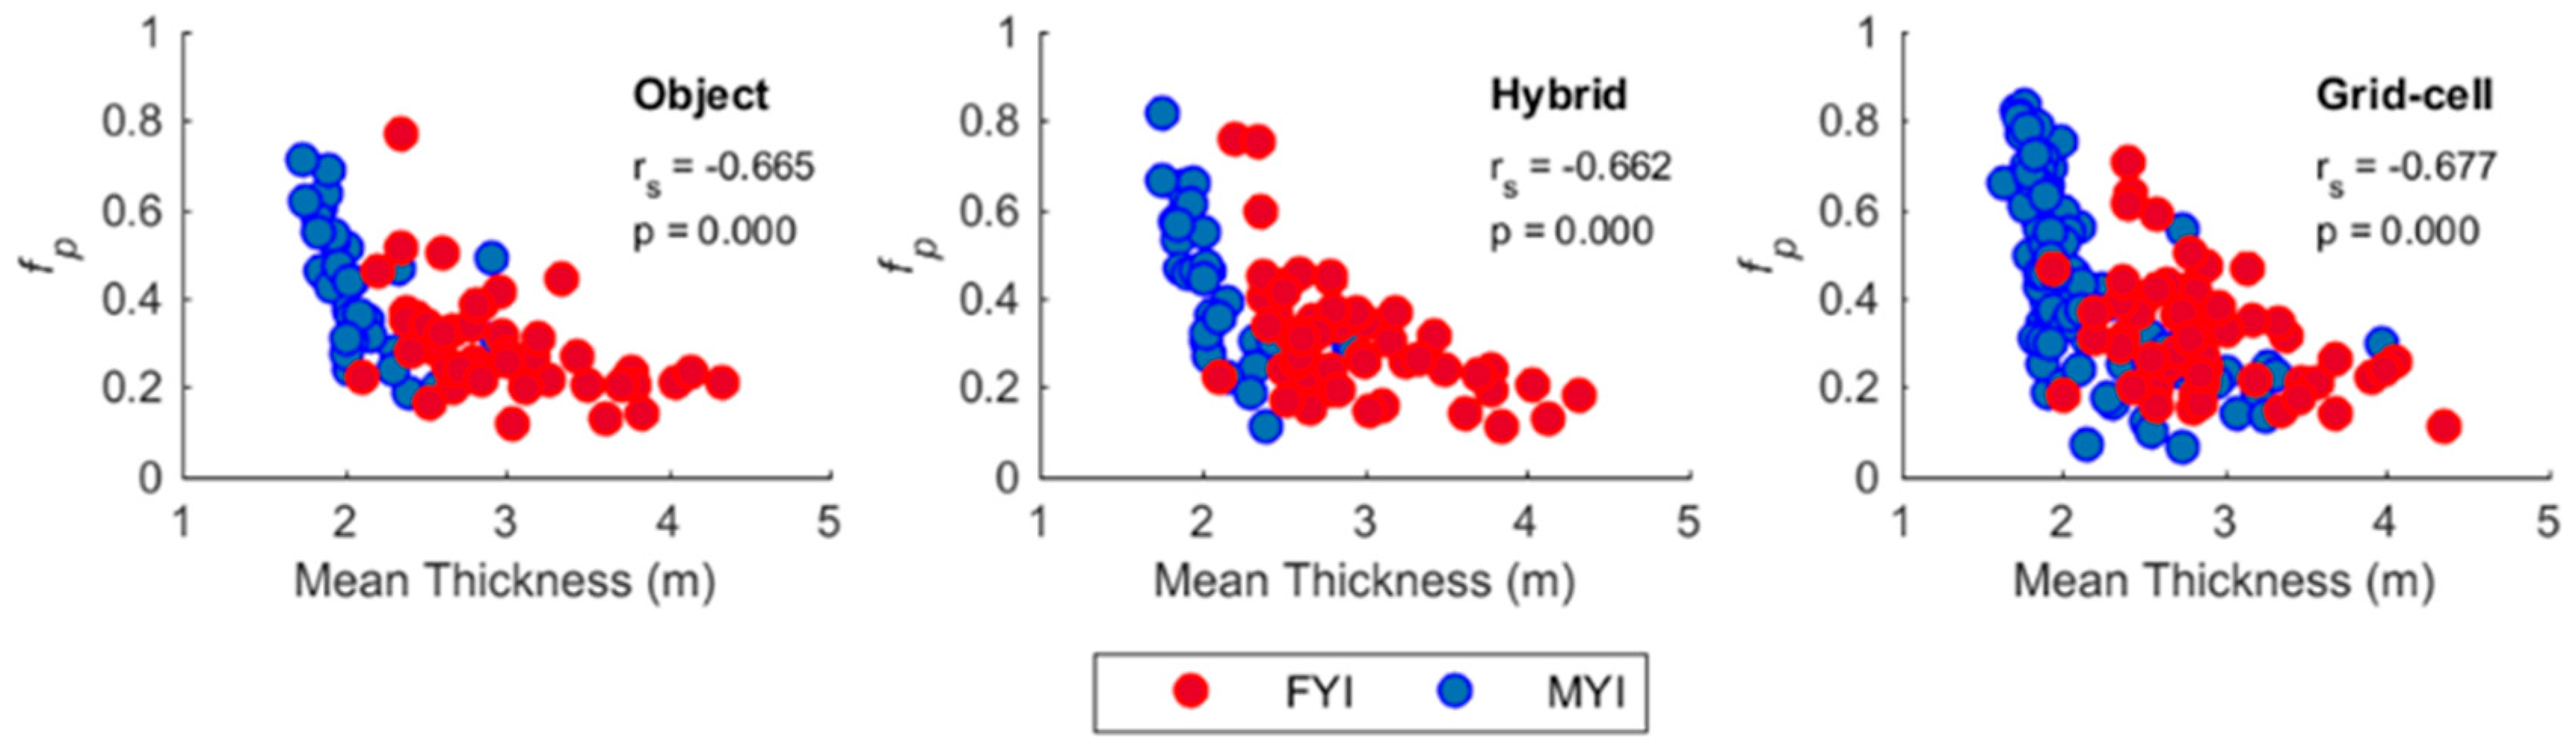
Original Figure 7:
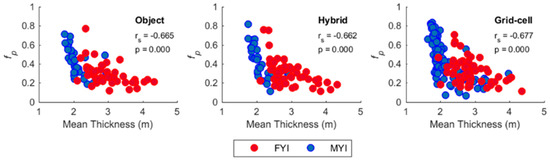
Figure 7.
Scatter plots of fp as a function of mean thickness at the medium scale using object (left), hybrid object (middle) and 240 m grid-cell (right) aggregation approaches. Spearman correlation coefficients (rs) and corresponding p-values are shown for pooled FYI and MYI data.
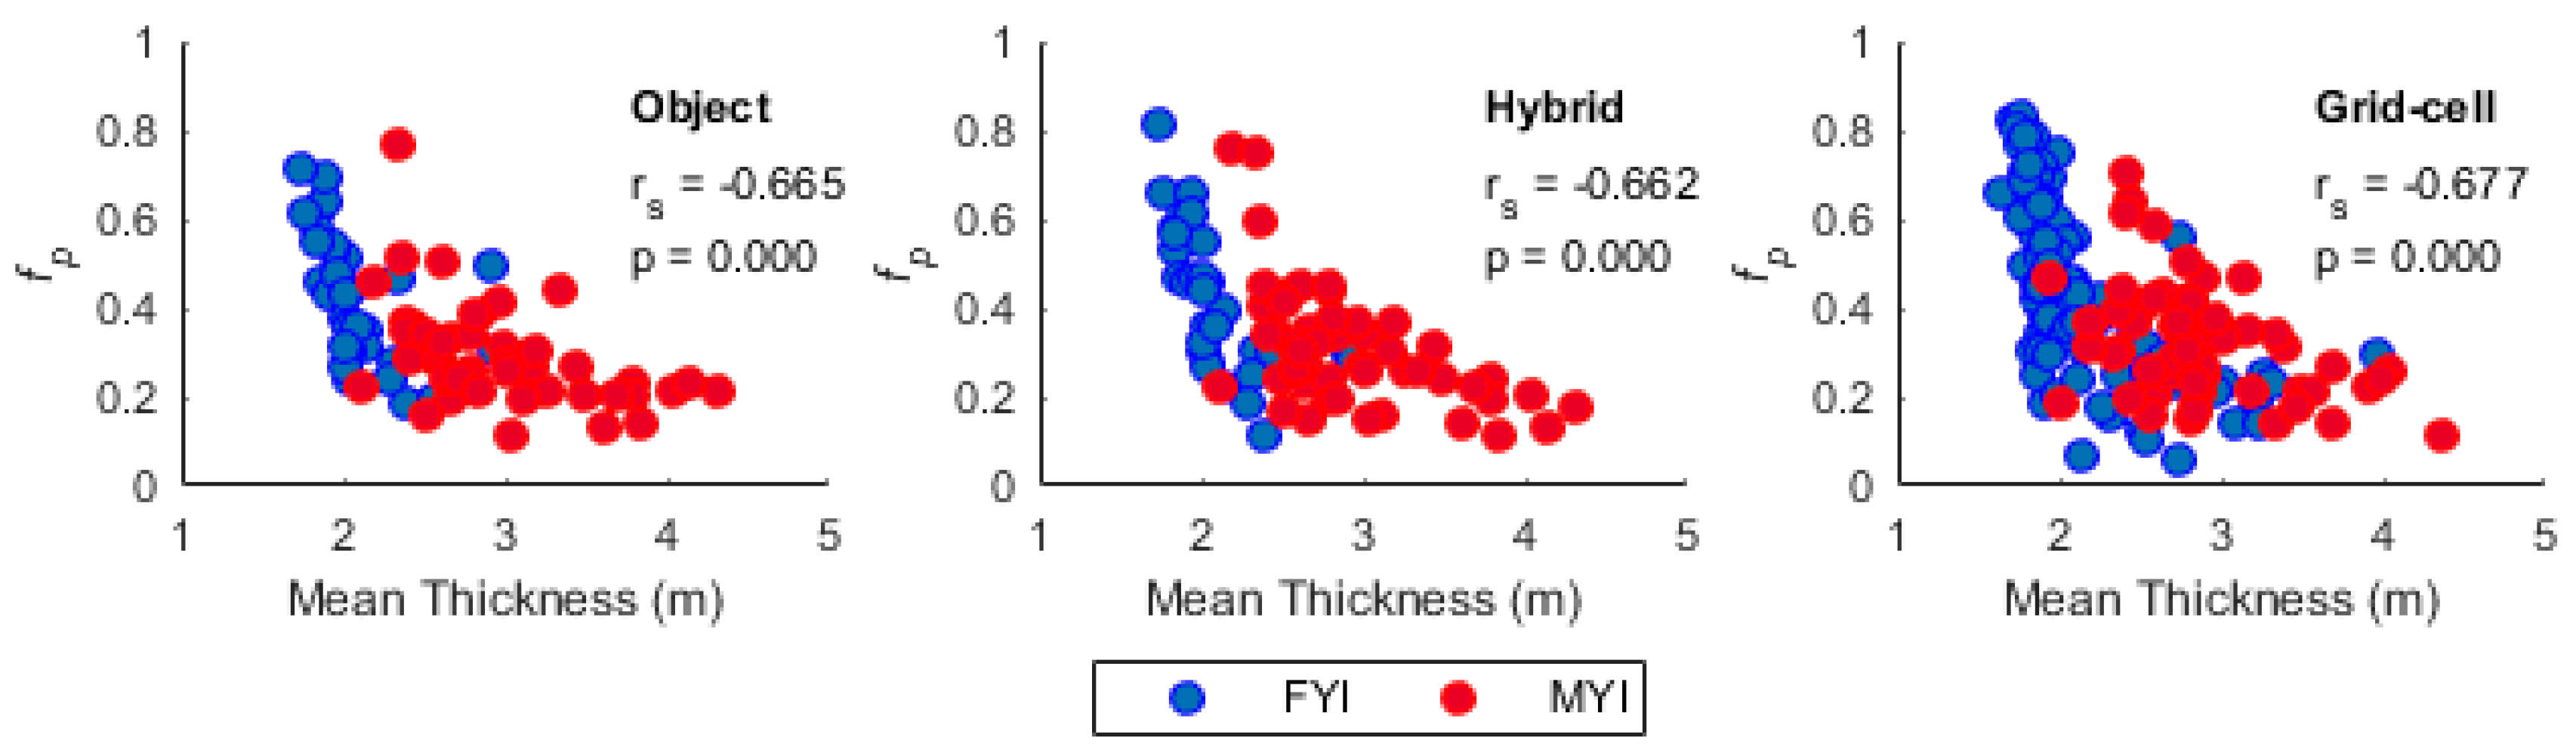
Corrected Figure 7:
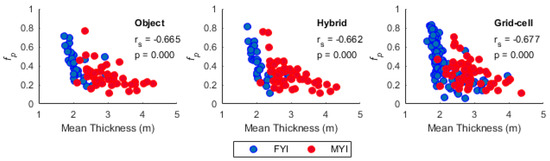
Figure 7.
Scatter plots of fp as a function of mean thickness at the medium scale using object (left), hybrid object (middle) and 240 m grid-cell (right) aggregation approaches. Spearman correlation coefficients (rs) and corresponding p-values are shown for pooled FYI and MYI data.
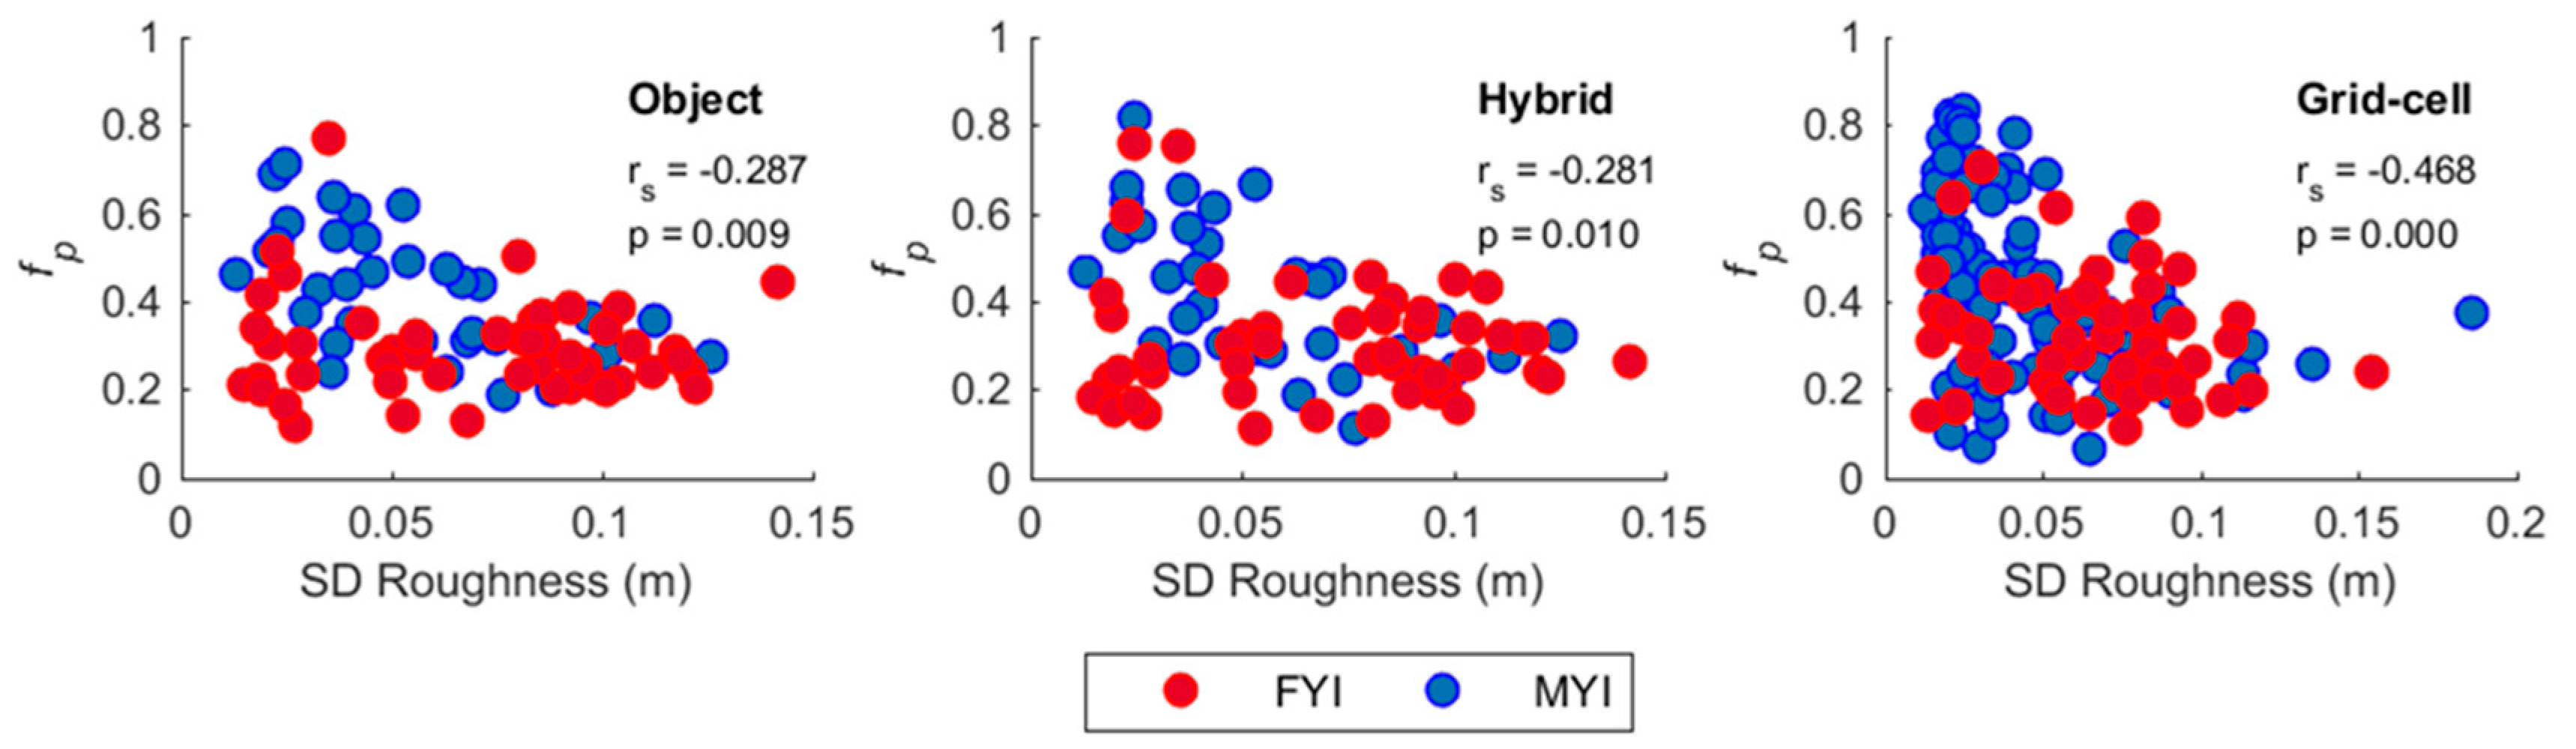
Original Figure 9:

Figure 9.
Scatter plots of fp as a function of standard deviation of roughness at the medium scale using object (left), hybrid object (middle) and 240 m grid-cell (right) aggregation approaches. Spearman correlation coefficients (rs) and corresponding p-values are shown for pooled FYI and MYI data.
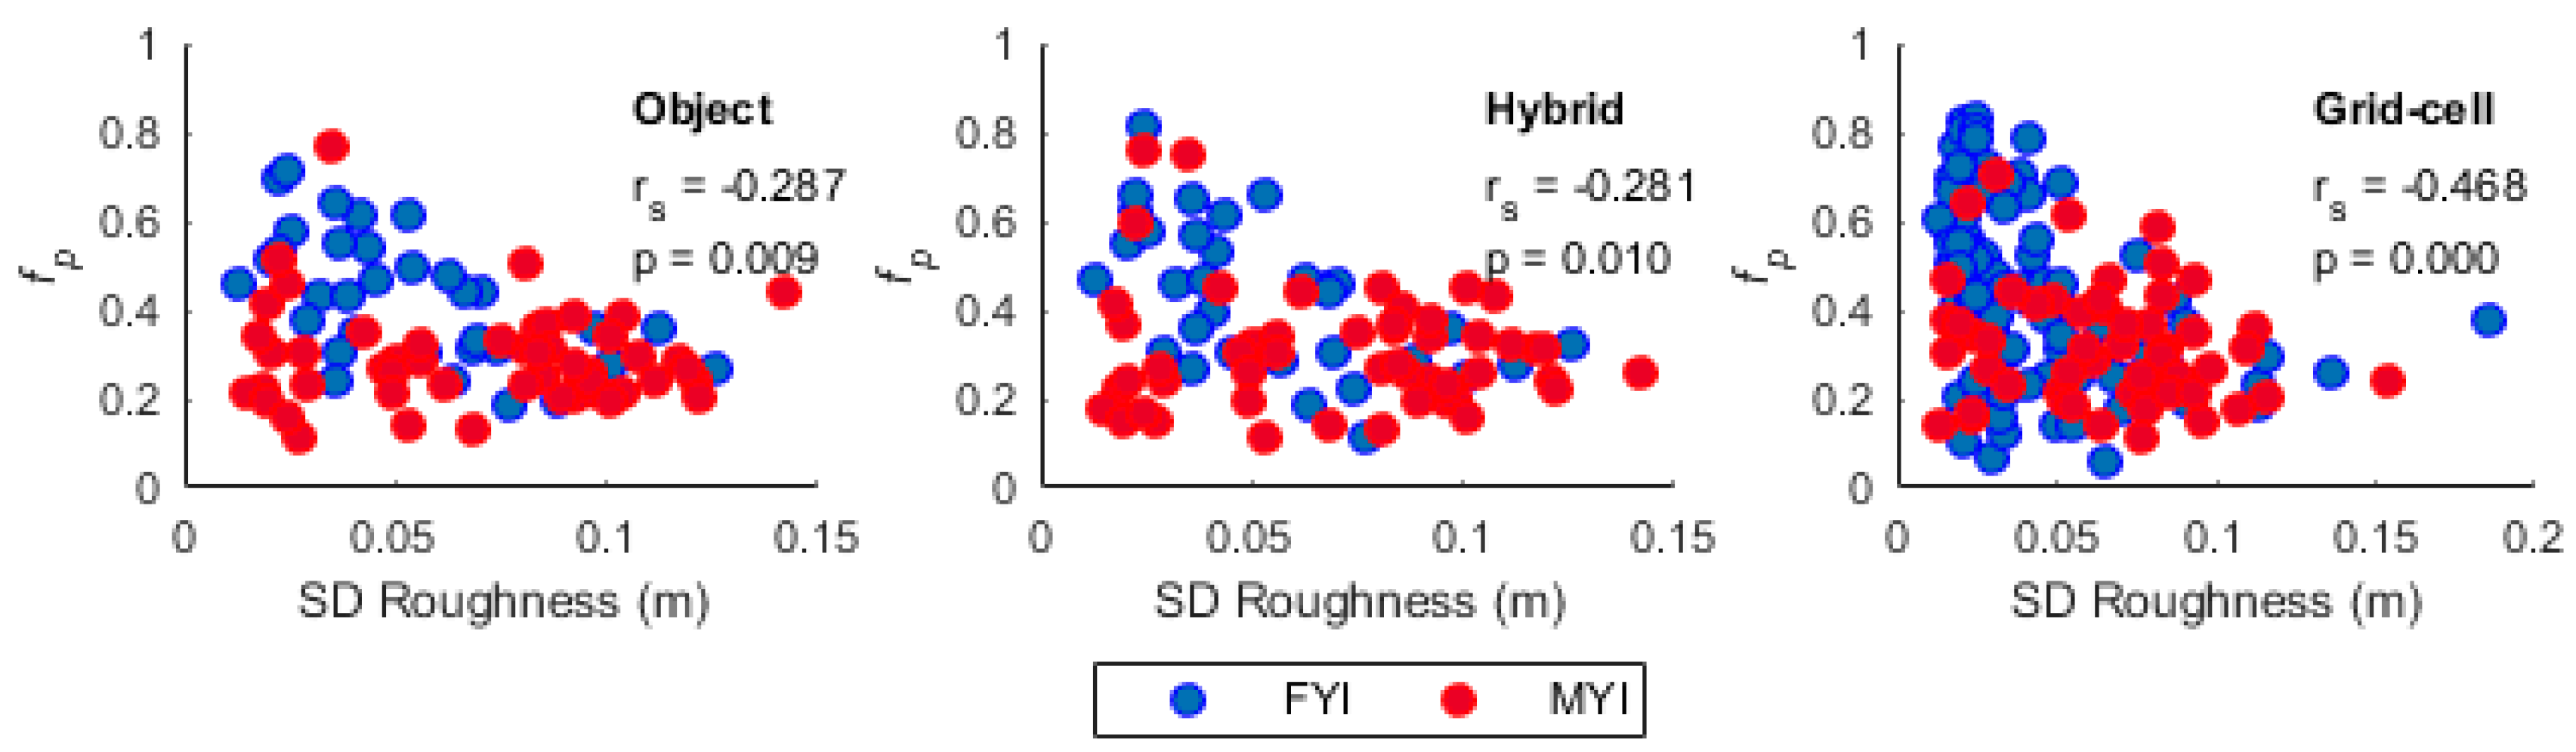
Corrected Figure 9:
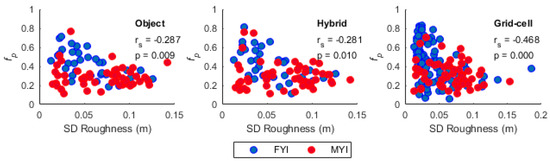
Figure 9.
Scatter plots of fp as a function of standard deviation of roughness at the medium scale using object (left), hybrid object (middle) and 240 m grid-cell (right) aggregation approaches. Spearman correlation coefficients (rs) and corresponding p-values are shown for pooled FYI and MYI data.
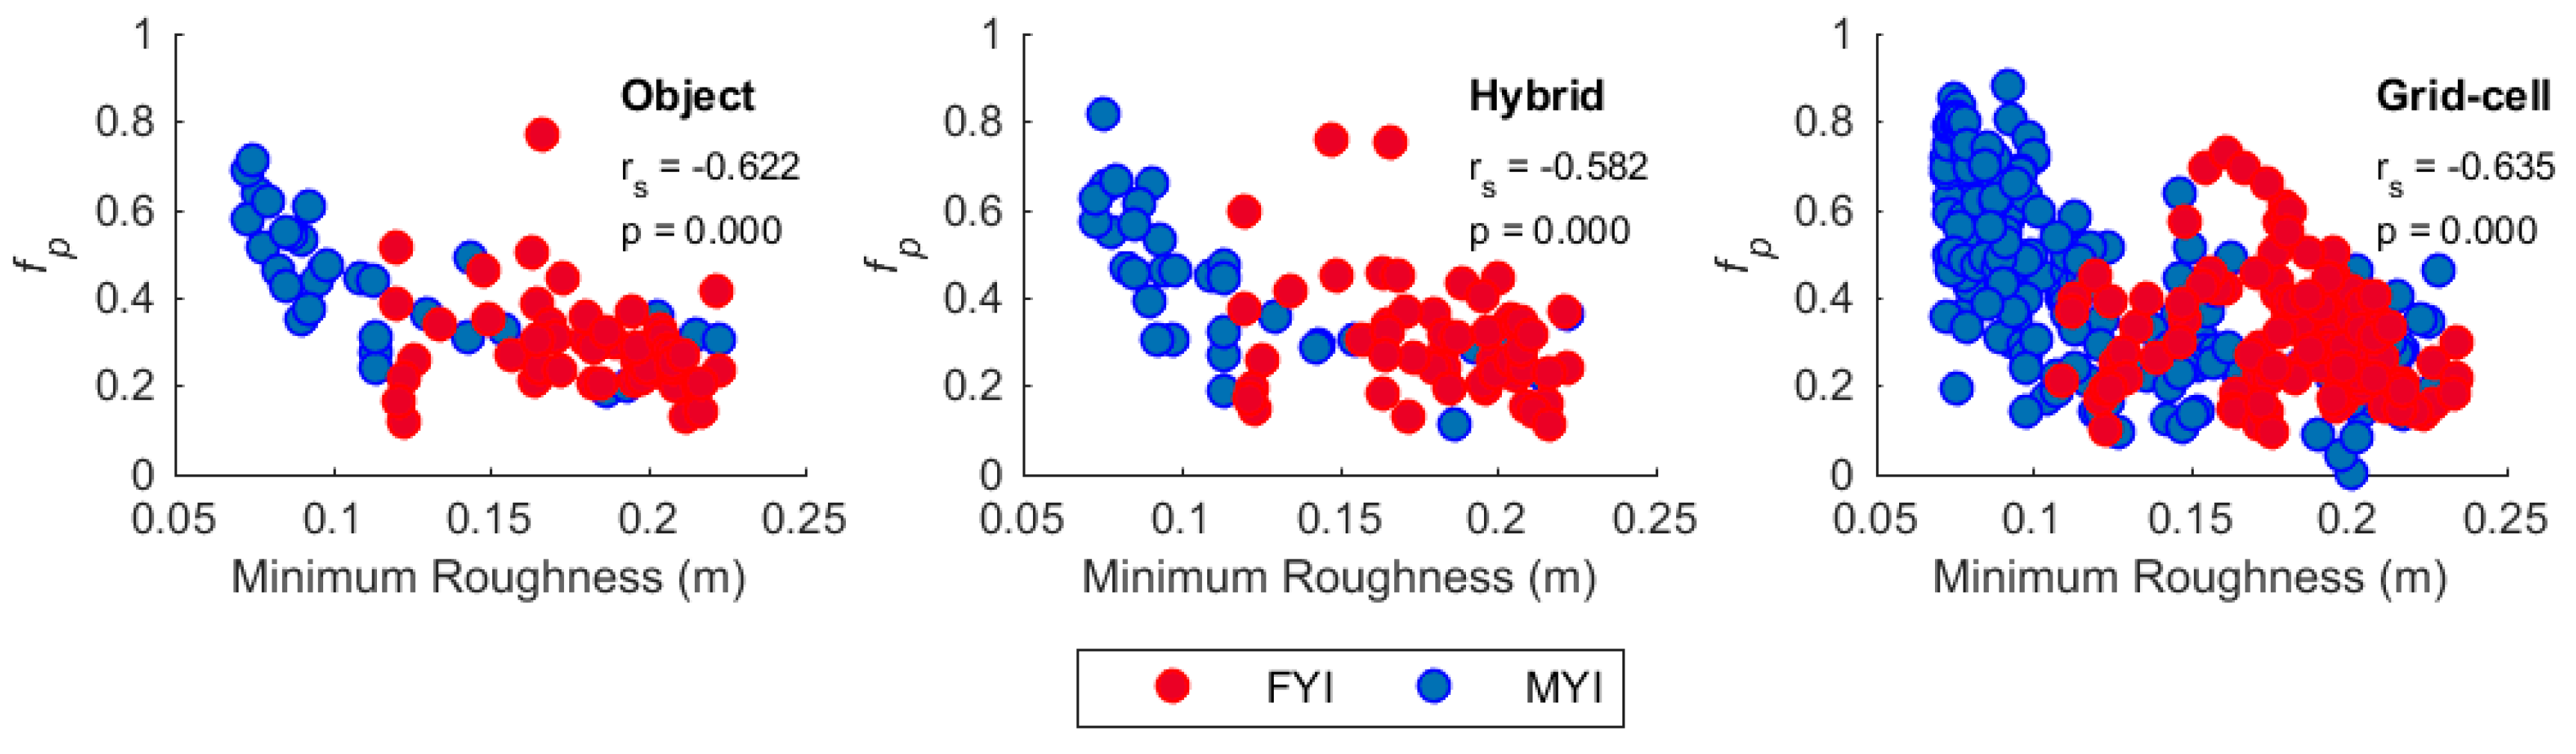
Original Figure 11:
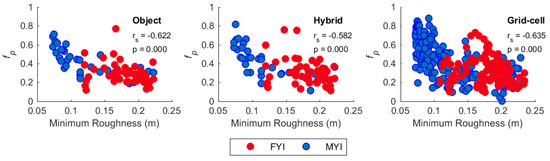
Figure 11.
Scatter plots of fp as a function of smoothed minimum surface roughness at the medium scale using object (left), hybrid object (middle) and 240 m grid-cell (right) aggregation approaches. Spearman correlation coefficients (rs) and corresponding p-values are shown for pooled FYI and MYI data.
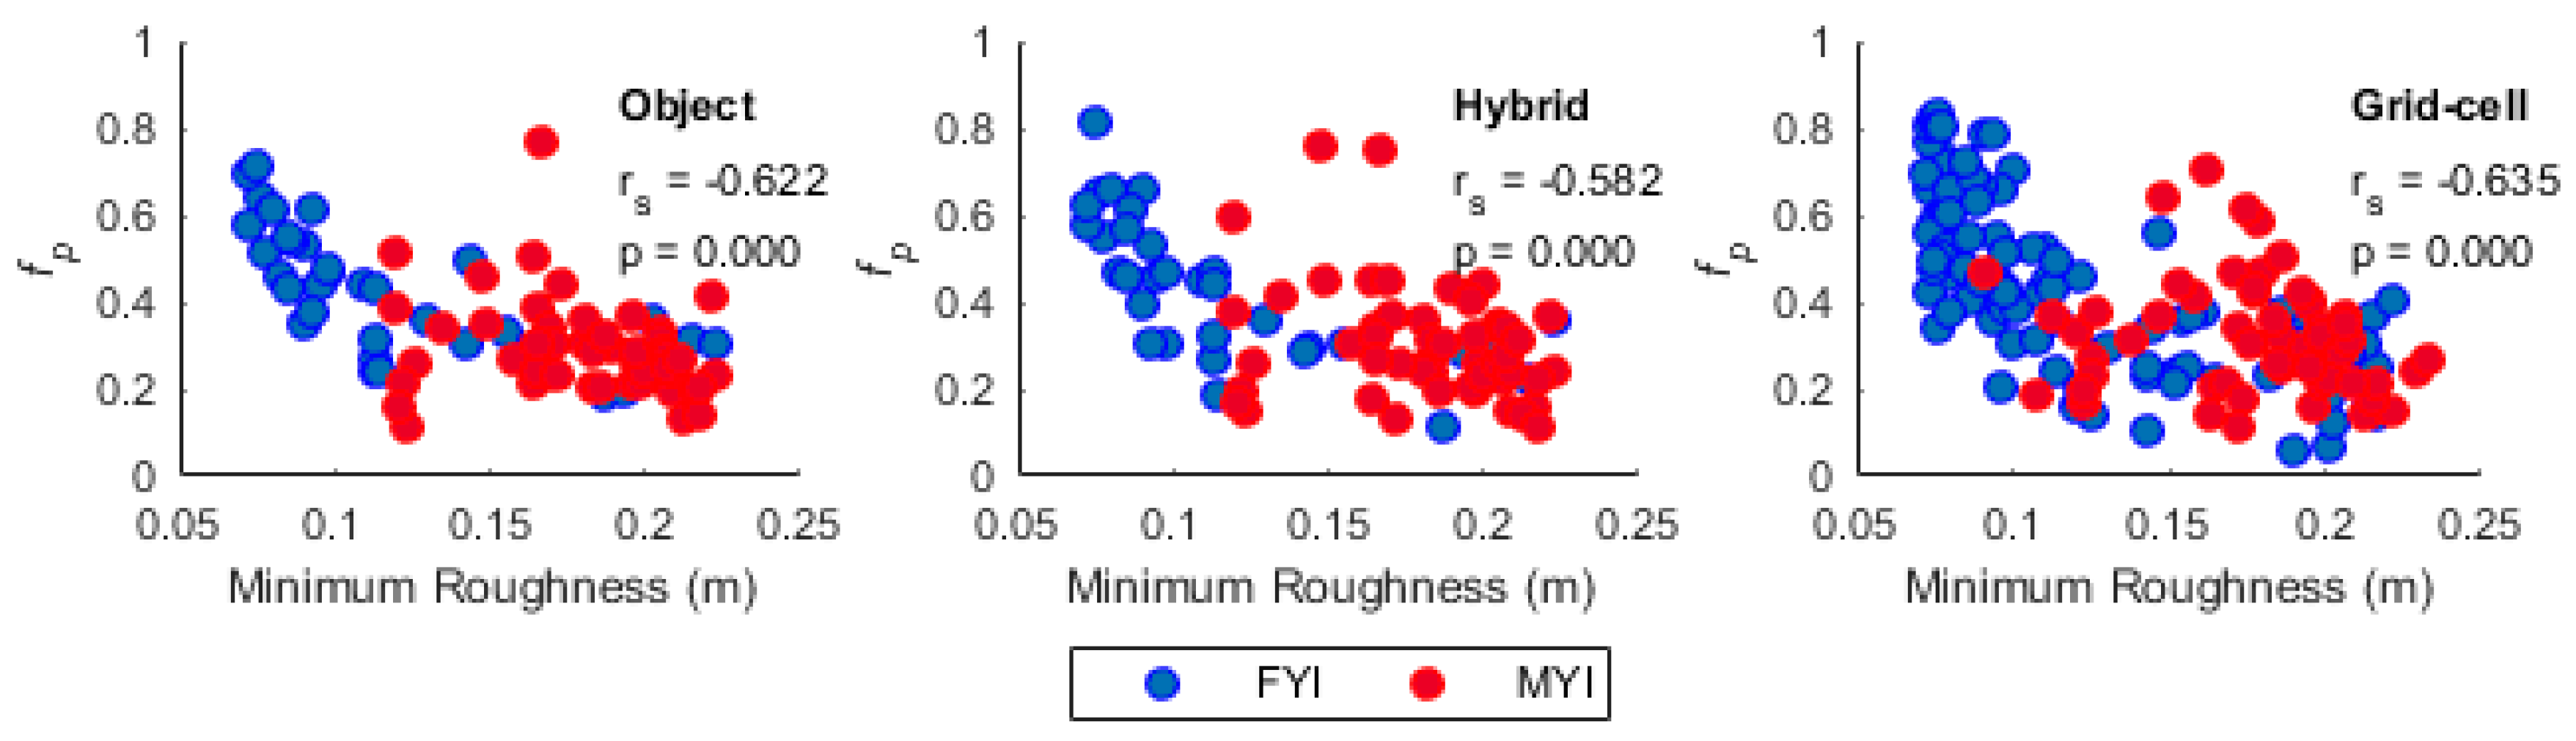
Corrected Figure 11:
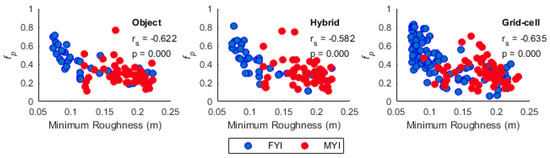
Figure 11.
Scatter plots of fp as a function of smoothed minimum surface roughness at the medium scale using object (left), hybrid object (middle) and 240 m grid-cell (right) aggregation approaches. Spearman correlation coefficients (rs) and corresponding p-values are shown for pooled FYI and MYI data.
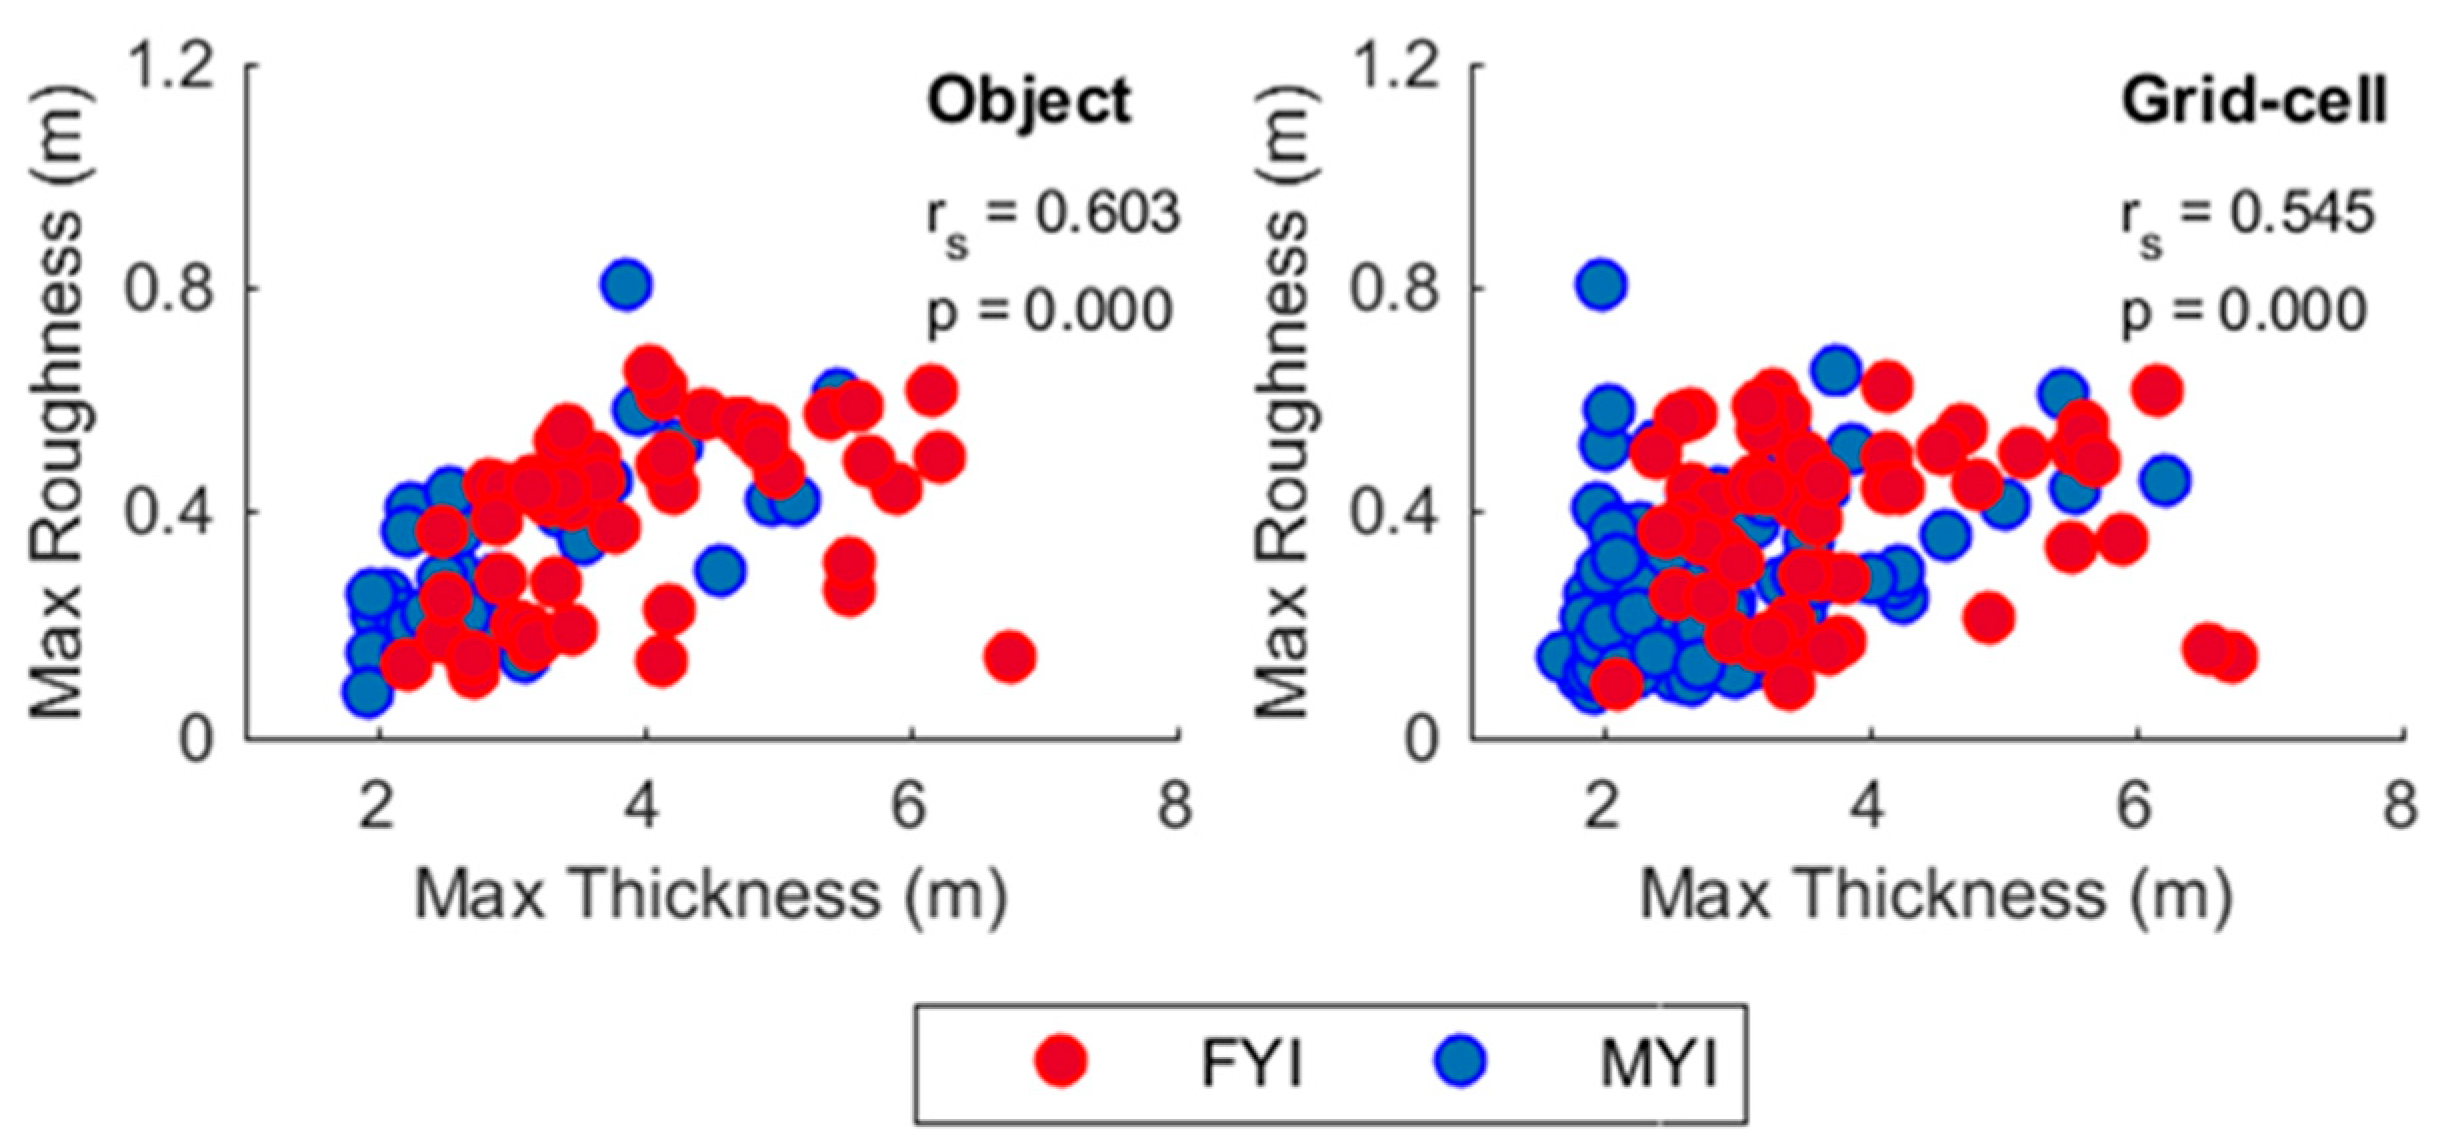
Original Figure 12:
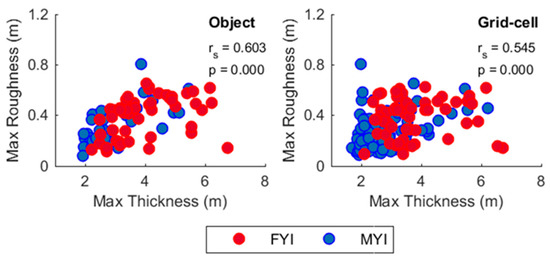
Figure 12.
Scatter plots of maximum roughness as a function of maximum thickness at the medium scale using object (left) and 240 m grid-cell (right) aggregation approaches. Spearman correlation coefficients (rs) and corresponding p-values are shown for pooled FYI and MYI data.
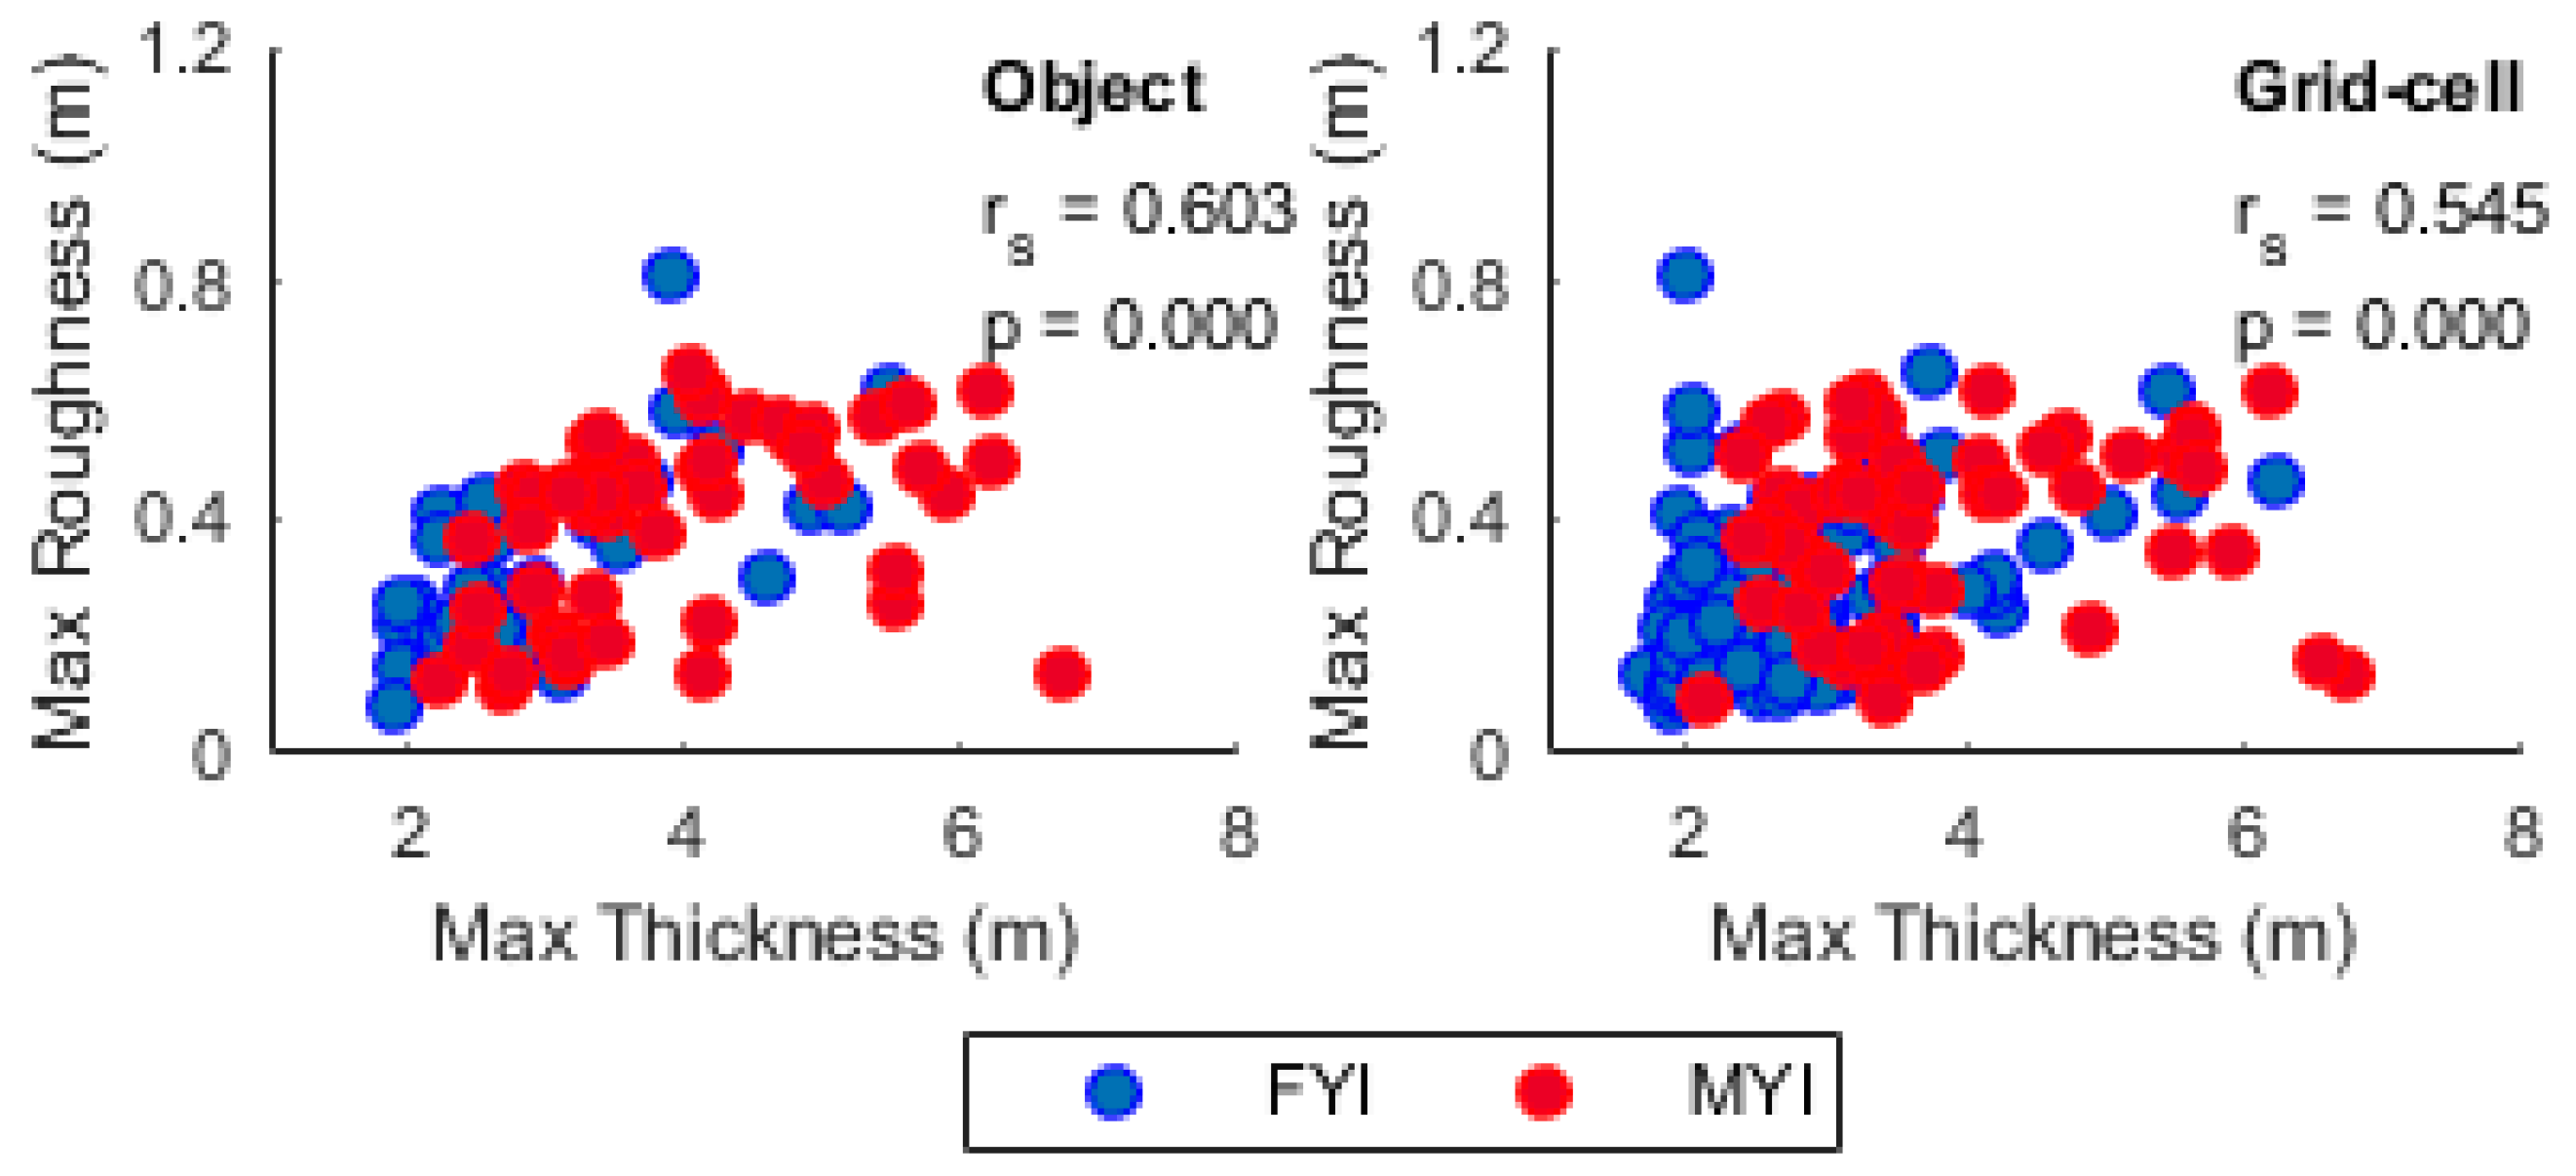
Corrected Figure 12:

Figure 12.
Scatter plots of maximum roughness as a function of maximum thickness at the medium scale using object (left) and 240 m grid-cell (right) aggregation approaches. Spearman correlation coefficients (rs) and corresponding p-values are shown for pooled FYI and MYI data.
The blue points correspond to first-year ice (FYI) and red points to multiyear (MYI); however, a typo was made in the legends. This correction will not change the results or any statements in the paper. The authors apologize for any inconvenience caused for readers.
Conflicts of Interest
The authors declare no conflicts of interest.
Reference
- Nasonova, S.; Scharien, R.K.; Haas, C.; Howell, S.E.L. Linking Regional Winter Sea Ice Thickness and Surface Roughness to Spring Melt Pond Fraction on Landfast Arctic Sea Ice. Remote Sens. 2018, 10, 37. [Google Scholar] [CrossRef]
© 2018 by the authors. Licensee MDPI, Basel, Switzerland. This article is an open access article distributed under the terms and conditions of the Creative Commons Attribution (CC BY) license (http://creativecommons.org/licenses/by/4.0/).