Initially, the system was run over the stable ground as any calculated displacement over the stable ground was thought to be an error, provided that there was no expected movement of the stable ground. The toolbox was run over the stable ground in Libya and Australia, with high potential for useful cloudless acquisitions. The areas were primarily used to understand the effect of mission combination on displacement magnitude estimation, and the effect of the sensor health on displacement magnitude estimation.
SenDiT provides displacement fields for all image pairs adhering with specified temporal feature tracking parameters. The pairs with the same-orbit imagery were later identified and information was supplied to a user in a separate text file. Within the toolbox, there is no distinction between the imagery from the 2A and 2B missions. The primary intention of the toolbox is for it to be used over moving targets, specifically glaciers, but also other mass wasting movements such as major landslides. To test the toolbox functionality over moving targets, outlet glaciers Engabreen, Nigardsbreen, Tunsbergdalsbreen, Stigaholtbreen and Rembedalskåka (mainland Norway) alongside with Skeiðarárjökull (Iceland), Jakobshavn Isbræ (Greenland), and Tasman Glacier (New Zealand) were selected for analysis.
3.1. Performance over Stable Ground
The arid areas in Libya and Australia were chosen as they offer superior quality due to good visual contrast, richness of terrain features, no expected terrain changes, no snow, low probability of cloud cover and remoteness from inhabited areas, or worked farmland. The coverage of potentially moving targets such as rivers, and coverage of homogeneous surfaces such as pure sand was minimized and eliminated by visual inspection where possible. We attempted to maximize spatial coverage of both stable areas, while avoiding homogeneous sand, farmed land, rivers, and water bodies. The arid areas in Libya and Australia were thought to be superior to areas of stable terrain in the proximity to glaciers due to absence of snow cover, cloud cover, and absence of large bodies of water such as proglacial lakes hindering the performance of feature tracking and maximizing the size of the sample for the analysis. The first stable area (
Figure 4A) was located in the Northern Territory state of Australia and was dominated by several prominent ridges, surrounded by flat and rugged terrain. The second stable area in Libya (
Figure 4B), was dominated by a series of valleys cutting through the rugged terrain, with a minimal extent of the homogeneous sand cover.
Only imagery with less than 1% cloud cover was used for analysis. This imagery was further manually inspected and filtered to eliminate imagery with even minimal presence of clouds. Imagery across both stable areas was paired using the same feature tracking parameters to make the two areas statistically comparable. The effect of seasonality on image pairing is known and studies have underlined importance of keeping the temporal separation to minimum in order to avoid changes in illumination conditions, shadowing, snow cover, but also vegetation [
1,
24]. Hence, the temporal difference was kept to a minimum; 10 days for single mission combination and 5 days for a 2A–2B mission combination to keep the influence of varying lighting conditions to a minimum. To analyze the role of mission pairing, we used results of 20 pairs over the stable ground in Libya and 28 pairs over the stable ground in Australia. Out of 48 pairs, 23 pairs were paired using Sentinel 2A–2B combination and 25 pairs were paired using either Sentinel 2A–2A or Sentinel 2B–2B combination. Twenty-one out of 25 pairs using a combination of imagery from the same mission were found to have mean displacement, within a 95% confidence interval (2σ) of less than 4 m, which corresponds to less than 0.4 pixels of the 10 m band. On the other hand, only three out of 23 pairs using Sentinel 2A–2B imagery combination led to a mean of less than 4 m within a 95% confidence interval (2σ). From the analysis using a limited number of pairs, it became clear that displacement magnitude of the pairs with a combination of Sentinel-2A and Sentinel-2B imagery was higher than when using single mission acquisitions for the pair.
Many glaciated areas are located in the steep mountainous terrain where shadowing can affect feature tracking. Shadowing can (a) be misrepresented as a moving feature and introduce outliers, as well as (b) result in a complete loss of trackable features due to a change of the pixel intensity values. Shadowing on glacier surface can be due to crevassing, large debris, or the surrounding mountainous topography and it is advantageous to understand how displacement estimation can change in response to changes in illumination conditions. To analyze the effect of the temporal differences on displacement estimation, we used pairs with a wide range of temporal separation (20–140 days), which closely resembled the minimum and maximum separation within a typical melt season, with useful imagery. Using the linear regression for the relationship between the temporal difference and displacement, we found a degree of dependence (R2 = 0.44) for 25 pairs over the stable area in Libya. Increase in the displacement over stable ground with increasing time separation of the image pair was likely due to the changing lighting conditions manifesting by introduced shadowing that becomes more extensive with larger temporal gaps. This suggests that the number of outliers can increase with an increase in the temporal separation of the image pair.
The health of the optical sensor is critical for the usefulness of acquired imagery. Most satellite imagery is obtained using push-broom or whiskbroom systems, which can be subjected to jitter [
25], or sensor misalignment [
26]. Problems with sensor geometry have been identified in the Sentinel-2A satellite [
27] and are found to be present in other systems such as ASTER [
25], but also Quickbird and SPOT satellites [
26]. Satellite imagery can also be subjected to data voids due to failure of the scan line corrector (SLC), as has been the case of the Landsat 7 ETM+ mission for acquisitions since 2003. This resulted in ~22% of pixels not being scanned [
28]. While studies have tried to correct for the missing or erroneous data [
25,
28], other studies have taken a non-inclusive data approach, eliminating the faulty images [
29]. Satellite platform vibration induced by the onboard dynamic components and exterior perturbation deteriorates platform stability and causes attitude jitter, resulting in image distortion and geometric accuracy degradation [
30]. The multi spectral instrument of the Sentinel 2A-2B constellation operates with a push-broom concept, where the push-broom sensor works by collecting rows of image data across the orbital swath and utilizes the forward motion of the spacecraft along the path of the orbit [
31]. With 12 push-broom modules covering each swath, the misregistration of the push-broom data can lead to bias and characteristic stripe pattern of the images. Each swath is approximately 290 km wide [
31] and this pattern can therefore be visible in orbit direction mimicking the orbit track each ~24 km.
Our analysis showed the presence of images with a detrimental effect on the displacement measurement results via jitter manifesting in bands of differential displacement within a single push-broom module as well as across more push-broom modules within a single scene (
Figure 4D). The bands of differential displacement were found to reach magnitudes of up to 16 m and wavelengths of ~2.5–6 km. Considering the orbital speed of ~7 km/second of the Sentinel 2A satellite [
31], the jitter undulations could have been occurring with a period of ~0.33–0.87 s per undulation. Also, the analysis found image pairs (
Figure 4C) to be subjected to striping at ~24 km width in the orbit direction, corresponding to the width of each of the 12 adjacent push-broom sensor modules. Equally, [
27] reported some image pairs to be subjected to striping at ~20 km width in the orbit direction that was interpreted to be due to misalignments in the overlap areas of 12 adjacent push-broom modules covering the Sentinel-2 swath width of 290 km. Given the maximum cloud cover threshold of 30%, only two images with significant jitter effect were found for the stable area in Libya from 06.09.2015 and 04.01.2016, respectively. No image pairs with push-broom and in-push-broom error patterns attributed to jitter were found after June 2016 in the stable area in Libya, for either the Sentinel-2A or the Sentinel-2B mission, confirming that the jitter error has been rectified by ESA after that date [
31].
3.2. Main Sources of Error
When considering sources of movement in a displacement map, there are three main components of it: true movement over a number of days of the pair; co-registration accuracy error; and orthorectification error. Displacement maps can also be affected by jitter as well as failures of parts of the system as explained in
Section 3.1. Correction of the Sentinel-2A jitter effect after June 2016 improves the co-registration accuracy that could have reached 18 m before that date [
32]. However, it is worth noting that this error did not affect all scenes up to June 2016. According to Castriotta and Knowelden [
23], the relative co-registration accuracy of any two images should at the moment be less or equal to 1.12-pixel size (11.2 m for the 10 m bands), with a 95% (2σ) confidence interval. In our analysis of 48 pairs over the stable areas in Libya and Australia, the largest co-registration accuracy error was found to be 10.9 m (2σ), corresponding to ca. 1.09 pixels. Co-registration error will often manifest itself as a homogeneous translation with almost uniform displacement magnitude and displacement vector direction. When using imagery from the same orbit, the co-registration error should be the main source of error [
27].
Sentinel-2A and Sentinel-2B scenes are provided as the orthorectified L1C (Level-1 Corrected) products. Two types of errors contribute to vertical offsets between the terrain and its approximation by a Digital Elevation Model (DEM): a) measurement or production errors where DEM elevation does not agree with terrain elevation at the time of acquisition of the elevation data; and b) changes in terrain elevation over time between elevation measurement and satellite scene acquisition [
27]. To quantify glacier displacement over time, the latter error is the most prominent one, often encountered as the glaciers can lose tens of meters of elevation between the DEM acquisition date and the date a satellite scene is ingested and orthorectified. Equally, the first error type can be also prominent, especially in glaciated regions with steep mountainous terrain where elevation of the slopes immediately bordering the glaciers can affect the elevation detected, depending on the ground resolution and terrain ruggedness. When co-registering the images from the same relative orbit, the DEM effects and most of the orthorectification error will be eliminated [
27].
Co-registration accuracy of the images from two different, usually immediately adjacent orbits will be influenced by the orthorectification as well as co-registration errors. The orthorectification error will reach its maximum in steep mountainous areas, where the terrain itself induces errors in the DEM, and over the ablation zones of alpine glaciers, especially glacier tongues where extensive melting may have occurred in the time gap between the DEM acquisition and satellite image orthorectification. Sentinel-2A and Sentinel-2B constellation imagery is orthorectified using the Planet DEM 90, and other non-specified DEMs for the areas outside the Shuttle Radar Topography Mission (SRTM) coverage (North of 60° latitude) [
27]. The Planet DEM 90 is of 90 m resolution, and it is mainly derived from SRTM DEM, which was acquired in February 2000 [
33]. There is very limited documentation on the Planet DEM 90 and other DEMs used for the orthorectification of Sentinel-2 imagery. The uncertainty of the Planet DEM 90 is 16 m (2σ) [
32]. Unavailability of the Planet DEM 90 makes it hard to understand exact magnitude of DEM errors as well as the mechanisms used to fill in the voids left in the SRTM data.
To test the orthorectification error in practice, we used a pair with a minimal temporal baseline difference of two days over Skeiðarárjökull glacier (64°07’N 17°15’W) in Iceland (
Figure 5A). The measured displacement reached magnitudes of over 35 m around the glacier lateral margins and terminus. The mean of apparent displacement of the stable area West of the glacier was ~6.7 m. The prominent vector direction of movement in the stable area was ~180–215°, so the co-registration error shift was in the south direction (
Figure 5B). Considering the orthorectification error component alone, the terminal portion of the glacier tongue where such error is expected to be at its maximum can be looked at in detail. In the case of this pair, the apparent displacement magnitude appeared to gradually increase within 1–4 km from the terminal and East lateral glacier margins from ~16–18 m to ~35 m or more (
Figure 5C). The temporal gap between the SRTM DEM acquisition in February 2000 and imagery acquisition in August 2017 was ~17.5 years. In this time, the glacier had retreated up to 3 km from its position in summer 1999 to where it was in August 2017 (
Figure 5C). A large portion of the displacement seen in
Figure 5A,C can be attributed to the orthorectification error as the areas with the highest error magnitude are within the space where the glacier has retreated.. The gradual nature of the error increase towards the terminus suggests continuous thinning with a maximum at the termini. While the DEM used for orthorectification of the Icelandic imagery may not have necessarily come from 2000, the nature of the error and its largest magnitude in areas where the retreat occurred suggest that orthorectification was performed with a regional DEM from a similar point in time. Considering the movement over the two days in the glacier terminus as negligible, the orthorectification error alone is the dominant source of error. Though, in parts of the glacier with less elevation change over the period between the DEM acquisition and date of imagery acquisition the orthorectification error component will be reduced. However, a magnitude of error is unacceptable in most studies and therefore results from using pairs with imagery from different orbits must be treated with caution. With the trend of glacier thinning and retreat over the past ~19 years, the displacement maps of the glacier termini using the imagery sourced from different orbits will present a major source of error. If Sentinel-2 imagery will continue to be orthorectified by Planet DEM 90, which is mostly based on the SRTM DEM acquired in 2000, but also on other regional DEMs [
27], the magnitude of orthorectification error component will keep increasing if glacier thinning continues. However, the elevation changes of each glacier will vary. In the case of Skeiðarárjökull, the orthorectification error component is reduced further upstream. To further analyze the orthorectification error component, pairs from 22.08.2017–25.08.2017 and 25.08.2017–27.08.2017 were used to record the maxima of the displacement at glacier termini of Nigardsbreen and Stigaholtbreen in mainland Norway, which retreated 367 m and 130 m respectively in period 2007–2017 [
34]. The maxima reached 17.6 m for Nigardsbreen and 18.4 m for Stigaholtsbreen. Having analyzed the displacement over the 22.08.2017–16.09.2017 pair, it was clear that such a large displacement at the glacier termini was due to imagery coming from different relative orbit introducing orthorectification error. The orthorectification errors over Skeiðarárjökull, Nigardsbreen and Stigaholtsbreen were comparable to errors reported by Kääb et al. [
27] for Aletschgletscher, Findelengletscher and Gornergletscher in the Swiss Alps, where in all cases, magnitude of displacement reaches tens of meters.
3.3. Application over Glaciers
A range of glaciers was selected to include glaciers with diverse dynamics, dimensions and ice cover characteristics. Using a fast-moving glacier was required to test the maximum magnitude of observable displacement using the toolbox. Jakobshavn Isbræ (69°06’N 49°20’W) was the fastest outlet glacier of the Greenland ice sheet, and can reach velocities of 14,000–16,000 m/year [
35]. The velocities were at the highest near the terminus at the grounding line, where Lemos et al. [
16] reported an average velocity of ~13,000 m/year for the period between 2014 and 2017, translating to a maximum of approximately 35 m/day. Application of the toolbox over Jakobshavn Isbræ illustrated the practicality of having prior knowledge of maximum expected displacement for the analysis. With a range of different feature tracking parameters, displacement at the short 5-day temporal gap and longest possible 25-day temporal gap was calculated. The temporal difference of 25 days was found to be the maximum baseline for Jakobshavn Isbræ. While the displacement field was, in the case of a 5-day temporal difference, only affected by the presence of supraglacial lakes and changes in the appearance of calved ice behind the grounding line (
Figure 6A), in the latter case, it is believed to have been affected by one or a combination of: a) a change in the direction of the ice flow causing decorrelation and non-translational change to feature appearance; b) a displacement too large, which falls outside the search window region (
Figure 6B). Therefore, as the specific region has a good coverage from four different orbits, it is more likely to obtain smooth displacement fields using pairs with the shortest time gap possible of 5 and 10 days respectively. The certain true observable maximum of the movement of any glacier, detectable with the toolbox is 620 m but this can reach ca. 880 m in cases of NE, SE, SW, and NW movement.
Analysis over the Tasman glacier was performed to study the possibility of obtaining the displacement field over a debris covered glacier. The Tasman glacier (43°36’S 170°13’E) is New Zealand’s longest and largest glacier fed by numerous tributaries, and extensively covered by debris in its lower portion [
13]. The displacement field over the debris covered parts has a smooth appearance (
Figure 6C). The quality of the result over debris covered glaciers is in general likely to be influenced by the distribution and appearance of the debris. A perfectly smooth, homogeneous debris cover will likely yield no useful results. On the other hand, variety in distribution of the debris, certain roughness of the terrain as well as the presence of supraglacial lakes, such as in the case of the Tasman glacier, all help to form the features that are both trackable and resistant to change.
Figure 6C also illustrates the differences in the level of noise in an image pair. While there was a generally homogeneous apparent displacement over the stable area in the valley adjacent east of the glacier, the magnitude of outliers in the snow-covered parts of the glacier can reach over 60 m.
To illustrate the system performance over the narrow, alpine glaciers, Nigardsbreen, Engabreen and Rembedalskåka glaciers from mainland Norway were selected. All three glaciers have long mass balance measurement time series [
34]. The glaciers also belong to a group that have stake velocity measurement data in Norway, which can serve for ground truthing. Rembedalskåka (60°32’N 7°21’E) is a southwestern outlet glacier flowing from the Hardangerjøkulen ice cap, Nigardsbreen (61°42’N 7°09’E) is a southern outlet of the Jostedalsbreen ice cap and Engabreen (66°40’N 13°48’E) is a northwestern outlet of West Svartisen ice cap [
34].
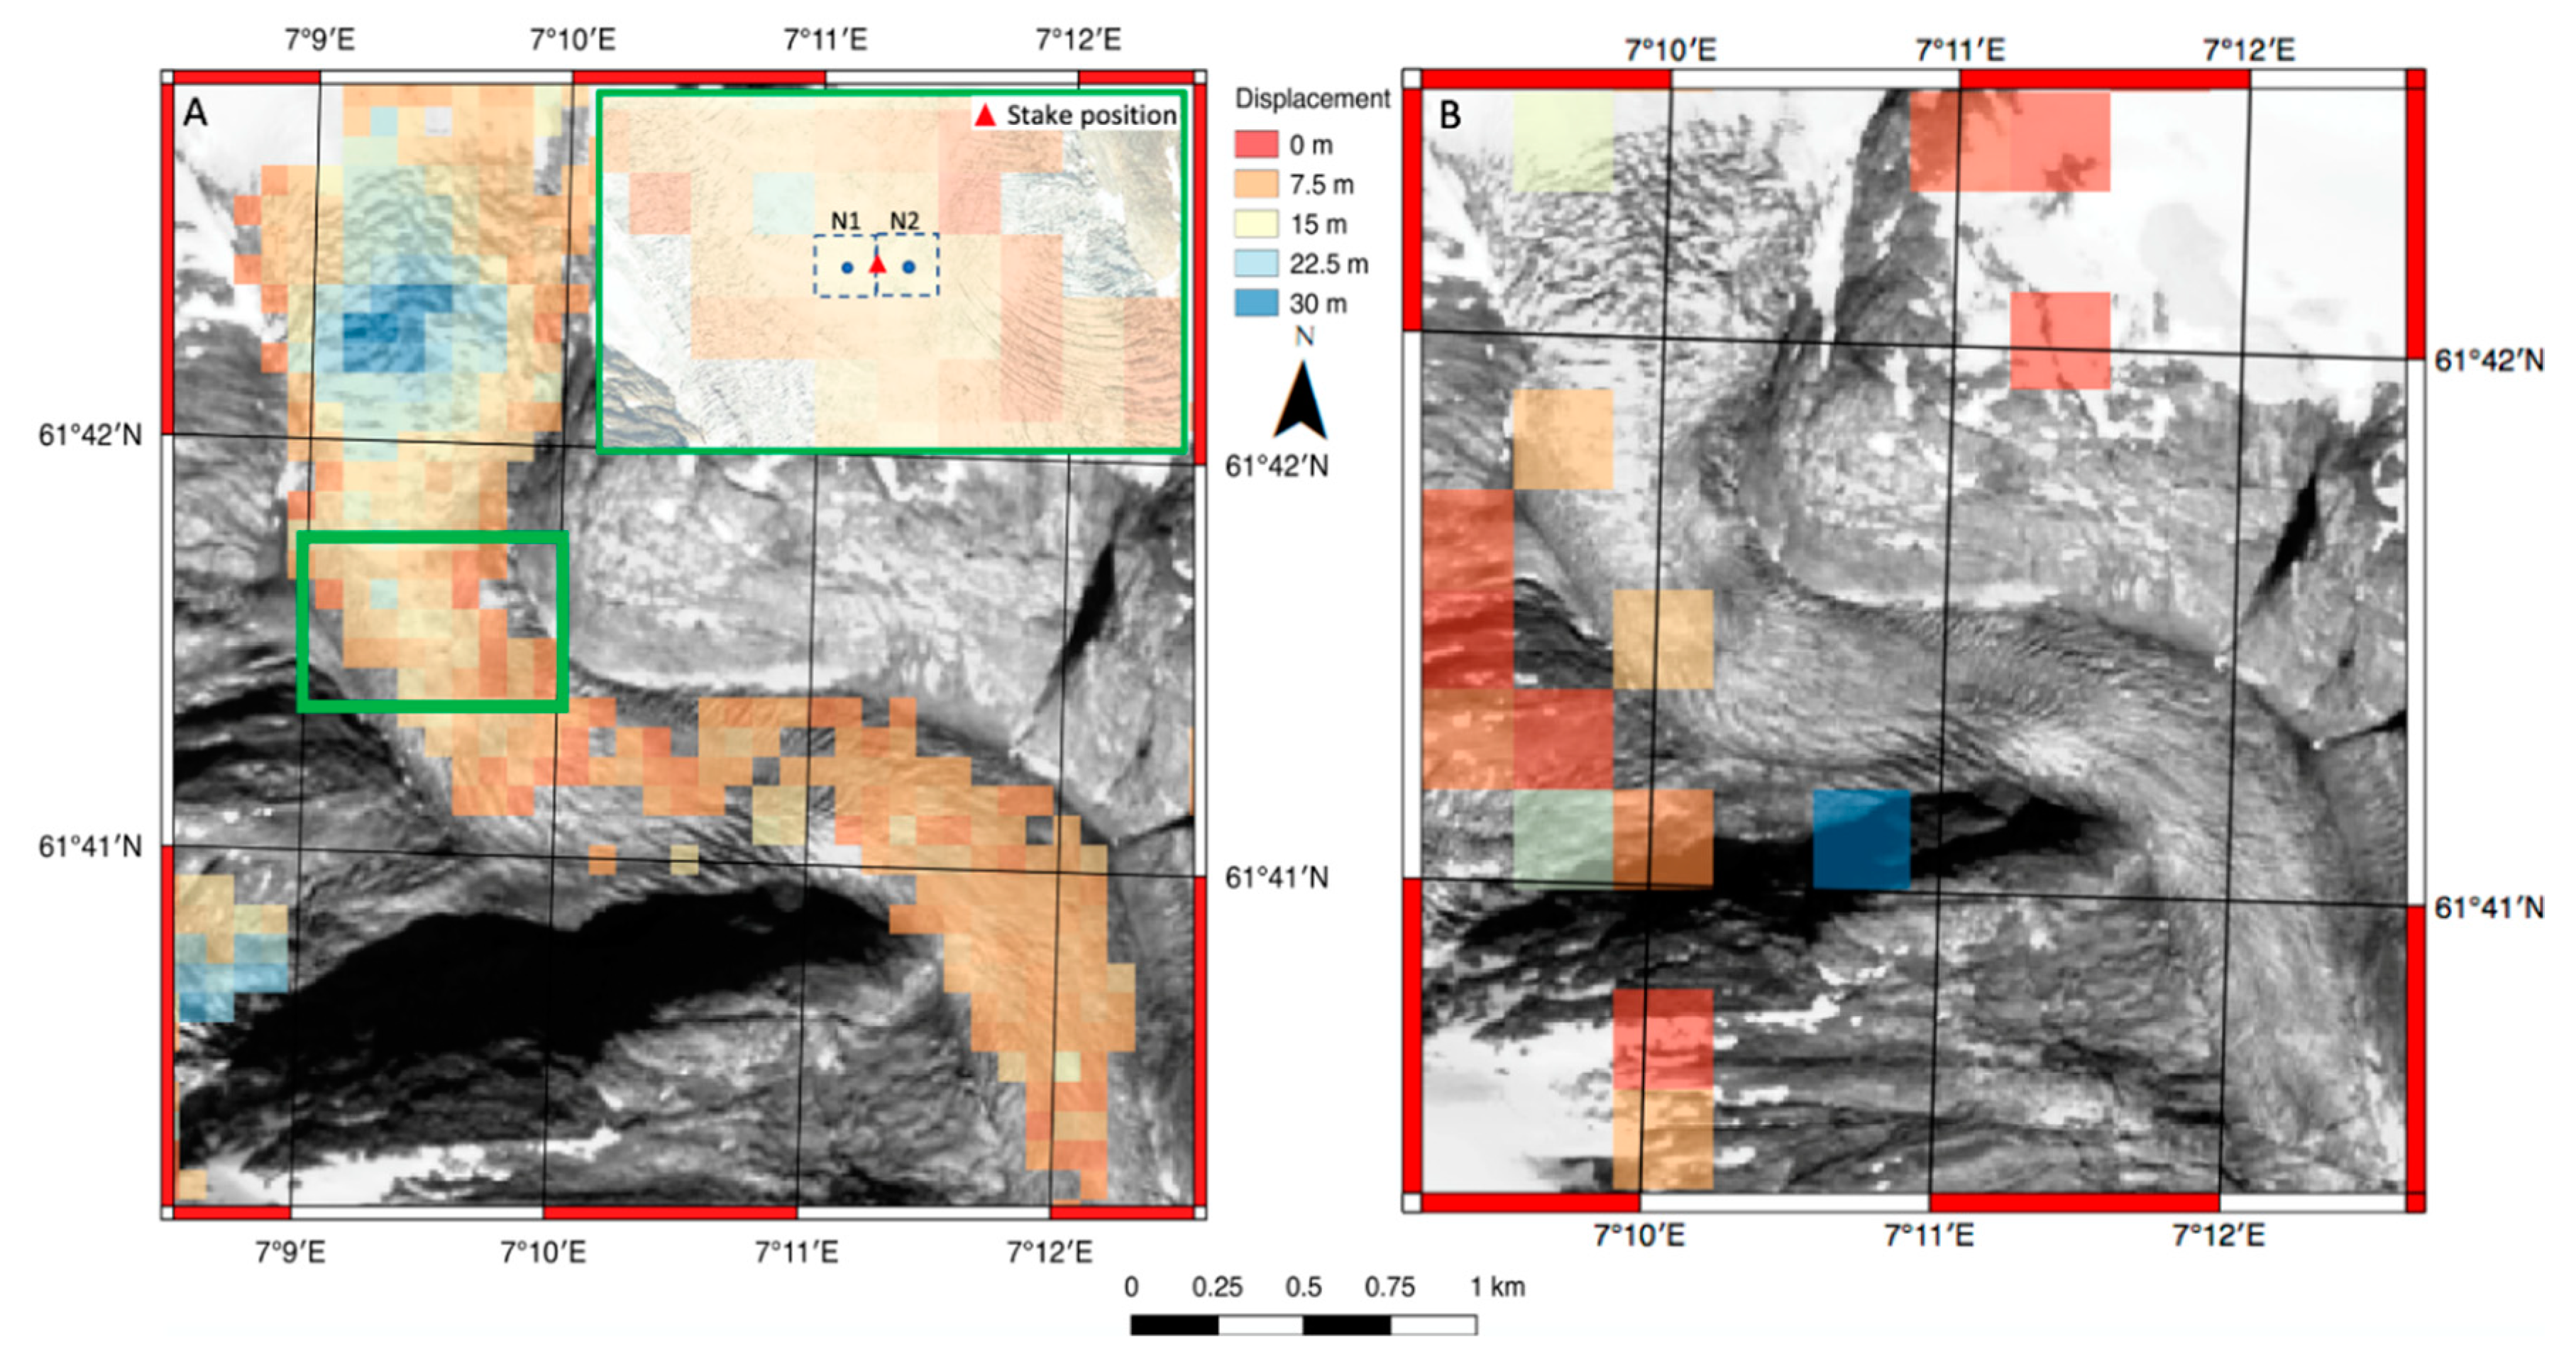
Stake point measurement data was available only for a handful of mass balance stakes on each of the trio of glaciers. The stakes were usually located in the interior of the glaciers, not in the termini or outlets, where crevassing is predominant. While this crevassing offers potentially good targets for feature tracking, heavy crevassing, relatively fast flow of the outlets and large mass turnover do not offer good conditions for long-term stake surveying. To compare the results of feature tracking obtained by SenDiT with the in situ measurements, three stakes were selected, which maximize a spatial overlap with feature tracking results, as well as a temporal overlap over the surveyed periods (
Table 1).
Displacement at points N1 and N2 on Nigardsbreen was measured using a pair, which has a complete temporal overlap with the stake measurement temporal window (
Figure 7A). The resulting feature tracking velocity was found to be within the error limit of the stake measurement. In the case of Nigardsbreen, the displacement field was relatively smooth, with spatially limited sections with no data (
Figure 7A). The magnitude of displacement in raster cells surrounding the position of the stake (
Figure 7A) was also relatively uniform. Out of a trio of glacier stakes, the stake measurement on Nigardsbreen was closest to the measured displacement (ca. 39 and 44 m away), which likely factors in the overlap of velocity derived by stake measurements and SenDiT. For Rembedalskåka, there was only a partial temporal overlap of approximately 9 months, accounting for ca. half of the total surveying time. With a limited temporal and spatial overlap (stakes positioned ca. 104 and 117 m away) the resulting feature tracking velocity as well as flow direction were found to be very close to data indicated by stake measurement. At the point R2, the result of the feature tracking was within the limit suggested by the stake measurement. On the other hand, the result of feature tracking was just outside the velocity spread suggested by stake measurement at the point R1. On Engabreen, there was a partial overlap of ca. 11 months between the two time periods, which could together with a longer distance (up to ca. 307 m) between the stake and feature tracking measurements account for a fact that stake measurement did not fall within the displacement range of points E1 and E2 indicated by feature tracking results. However, both the flow direction and displacement magnitude differences of ca. 17° and 0.03 m/day at the point E1 were relatively minor and indicated a good performance of SenDiT. Moreover, at the point E2, flow direction of the stake measurement conformed with the result of feature tracking using SenDiT.
To illustrate the system performance compared to other services, we conducted analyses using Nigardsbreen and Jakobshaven Isbræ. First, an analysis was conducted over the outlet of Nigardsbreen using the results of SenDiT and GoLIVE service. The GoLIVE service is currently the only service providing continuously updated velocity data for the glaciated areas outside the Ice Sheets. For the ablation season of 2017, we were able to identify only one pair from the GoLIVE service with a temporal separation of 32 days, using images from 22.08.2017 and 23.09.2017, respectively. Given the full temporal overlap of the pair used by SenDiT (
Figure 7A) with the pair from the GoLIVE service (
Figure 7B), we compared their spatial coverage over Nigardsbreen outlet south of 61°43’N. While SenDiT results spatially covered ca. 2.15 km
2, the resulting velocity field of the GoLIVE product covered ca. 0.36 km
2. Unlike the SenDiT result (
Figure 7A), the GoLIVE’s result (
Figure 7B) was reduced to four data points, that could be attributed to noise, compared to ca. 240 data points using SenDiT.
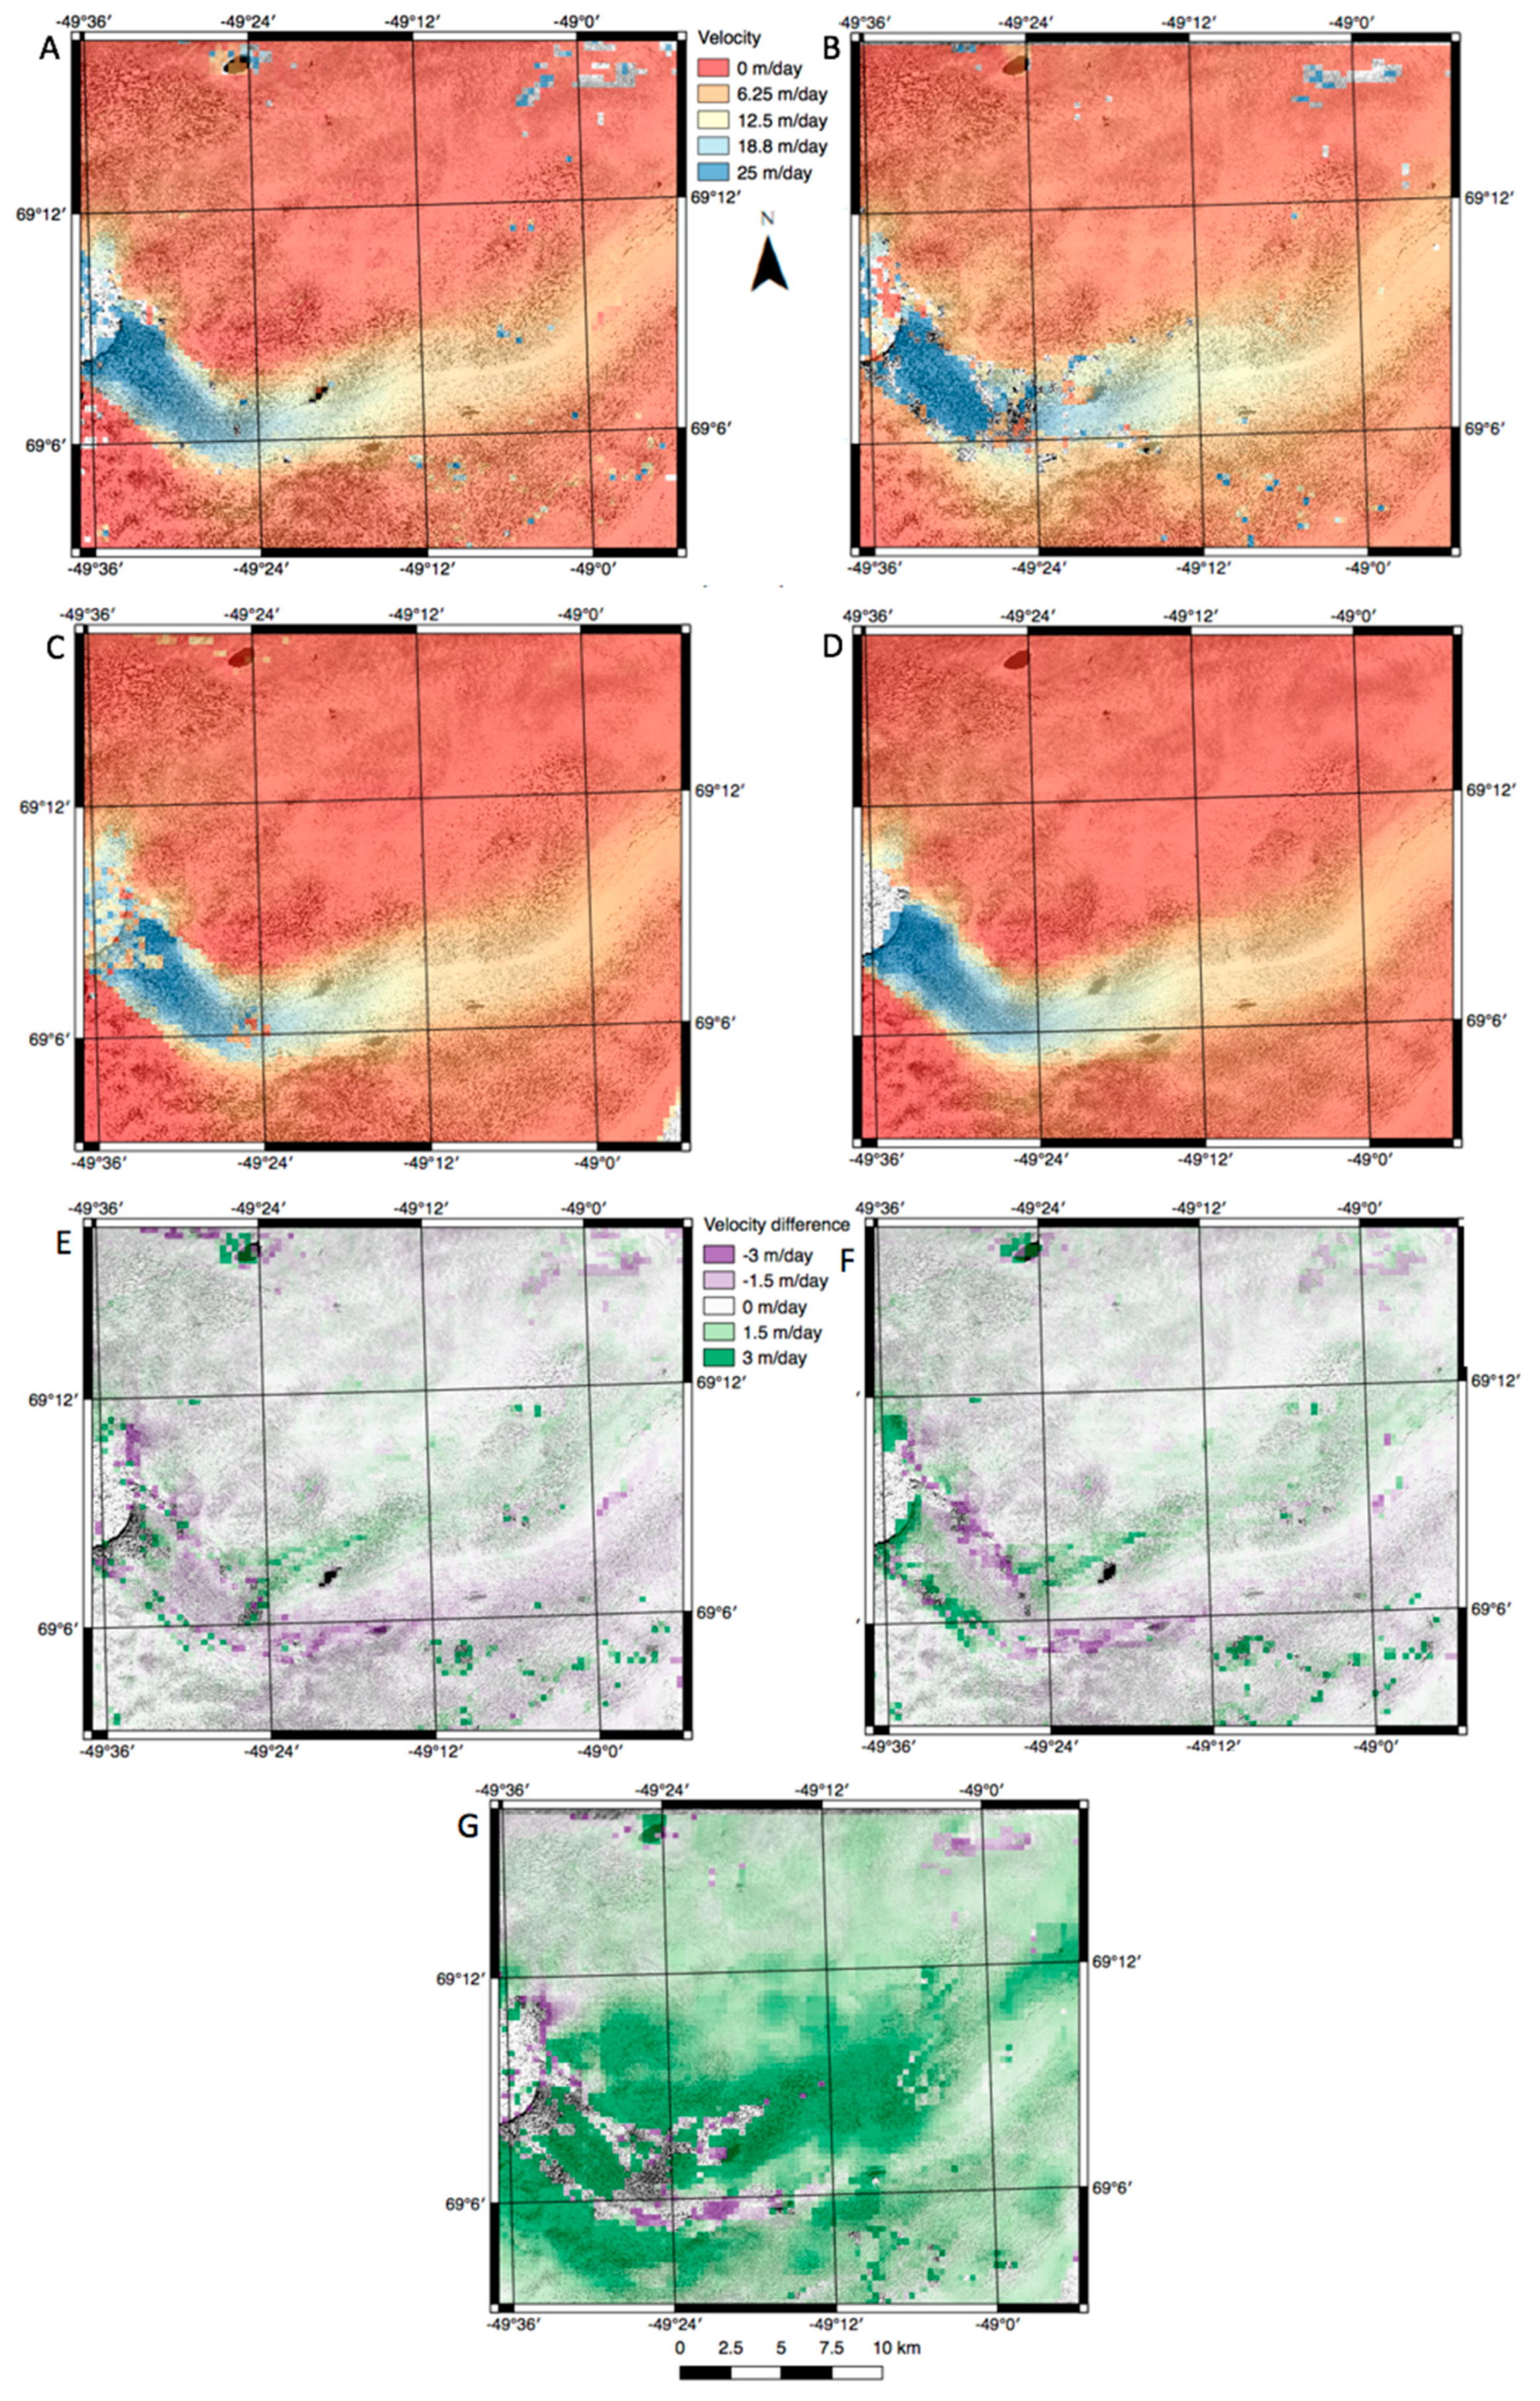
To address the comparison of GoLIVE, MEaSURE, and SenDiT performance over a single site, further analysis was conducted over Jakobshaven Isbræ. When acquiring the velocity maps, close attention was paid to maximization of the temporal overlap among the pairs to provide the best possible results for a comparison. The smoothest velocity fields were provided by the pair J3 derived by SenDiT (
Figure 8A) and J6 from the MEaSURE service (
Figure 8D). Pairs J4 (
Figure 8B) and J5 (
Figure 8C) also provided smooth velocity fields, though decorrelated sections were present, corresponding to less than ca. 5% of the entire study area of Jakobshaven Isbræ. Velocity differences between the SenDiT pair J3 (18.07.2017–28.07.2017) and (1) GoLIVE pair J5 (18.07.2017–03.08.2017) and (2) MEaSURE pair J6 (01.07.2017–31.07.2017) were less than 0.5 m/day for most of the studied area. Larger differences occurred in the areas of a fast ice flow and reached up to ca. 2.5 m/day. The velocity difference analysis between the SenDiT derived pair J4 (18.07.2017–03.08.2017) using imagery from different relative orbits and GoLIVE pair J5 (18.07.2017–03.08.2017) with the same temporal separation and the complete temporal overlap, showed large differences of 2–3.5 m/day for most of the area, reaching up to ca. 5 m/day (
Figure 8G). Considering the fast nature of the movement of Jakobshaven Isbræ and only a partial temporal overlap, SenDiT produced comparable results to both GoLIVE and MEaSURE services, when using a pair, composed of imagery from the same orbit (
Figure 8E,F). Large differences of up to 5 m/day (ca. 80 m displacement) depicted by the
Figure 8G can be attributed to the orthorectification error.


