City-Level Comparison of Urban Land-Cover Configurations from 2000–2015 across 65 Countries within the Global Belt and Road
Abstract
:1. Introduction
2. Materials and Methods
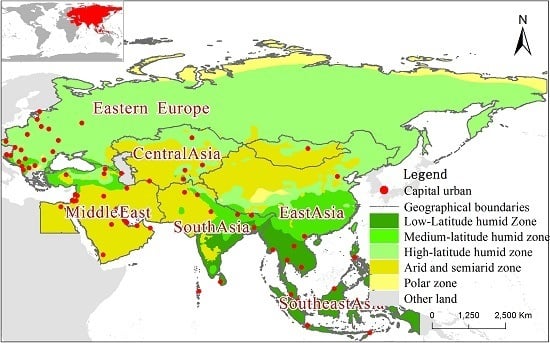
2.1. Study Area and the Divisions of Cities in Different Regions
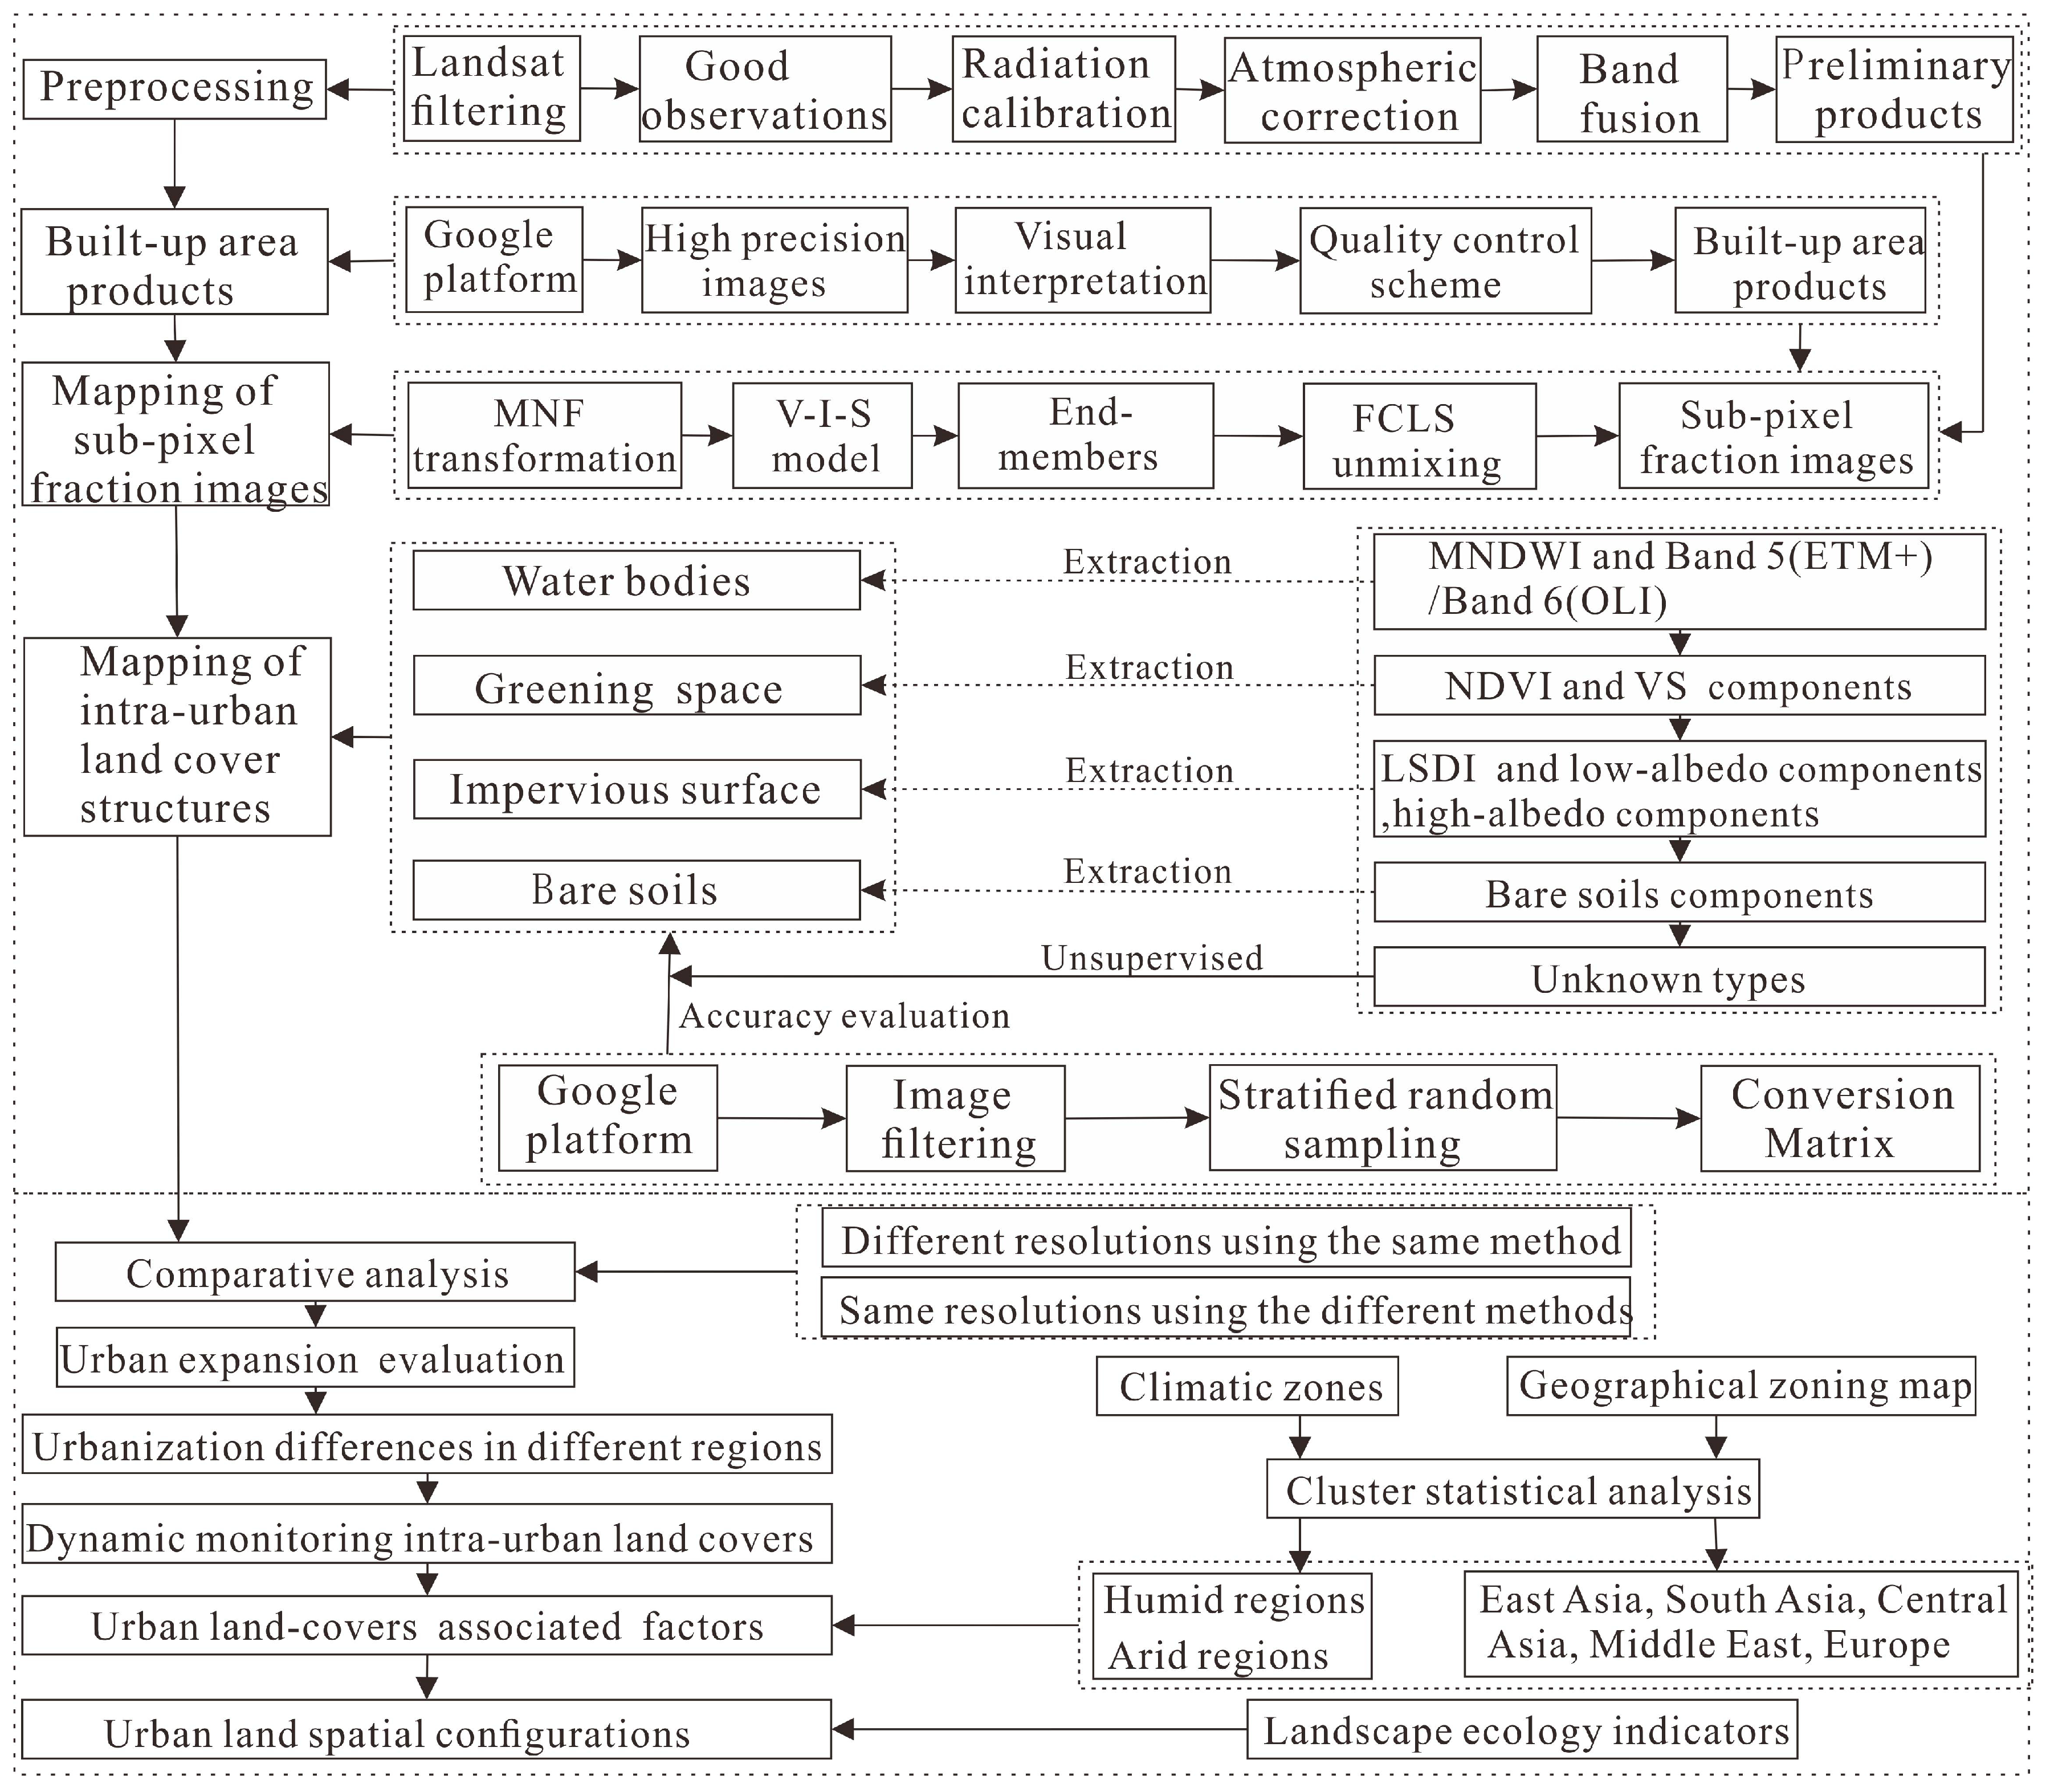
2.2. Methods
2.2.1. Data Collection and Pre-Processing
2.2.2. Built-Up Area Extraction
2.2.3. Mapping of Sub-Pixel Urban Land-Cover Components
2.2.4. Mapping of Intra-Urban Land-Cover Classifications
2.2.5. Accuracy Assessment
2.2.6. The Linking Between Urban Land-Cover Changes and Associated Climatic and Geographical Zones
3. Results
3.1. Accuracy Assessment
3.1.1. Accuracy Assessment for the New Intra-Urban Land Product
3.1.2. Comparison the Accuracies from Different Classification Resolutions and Methods
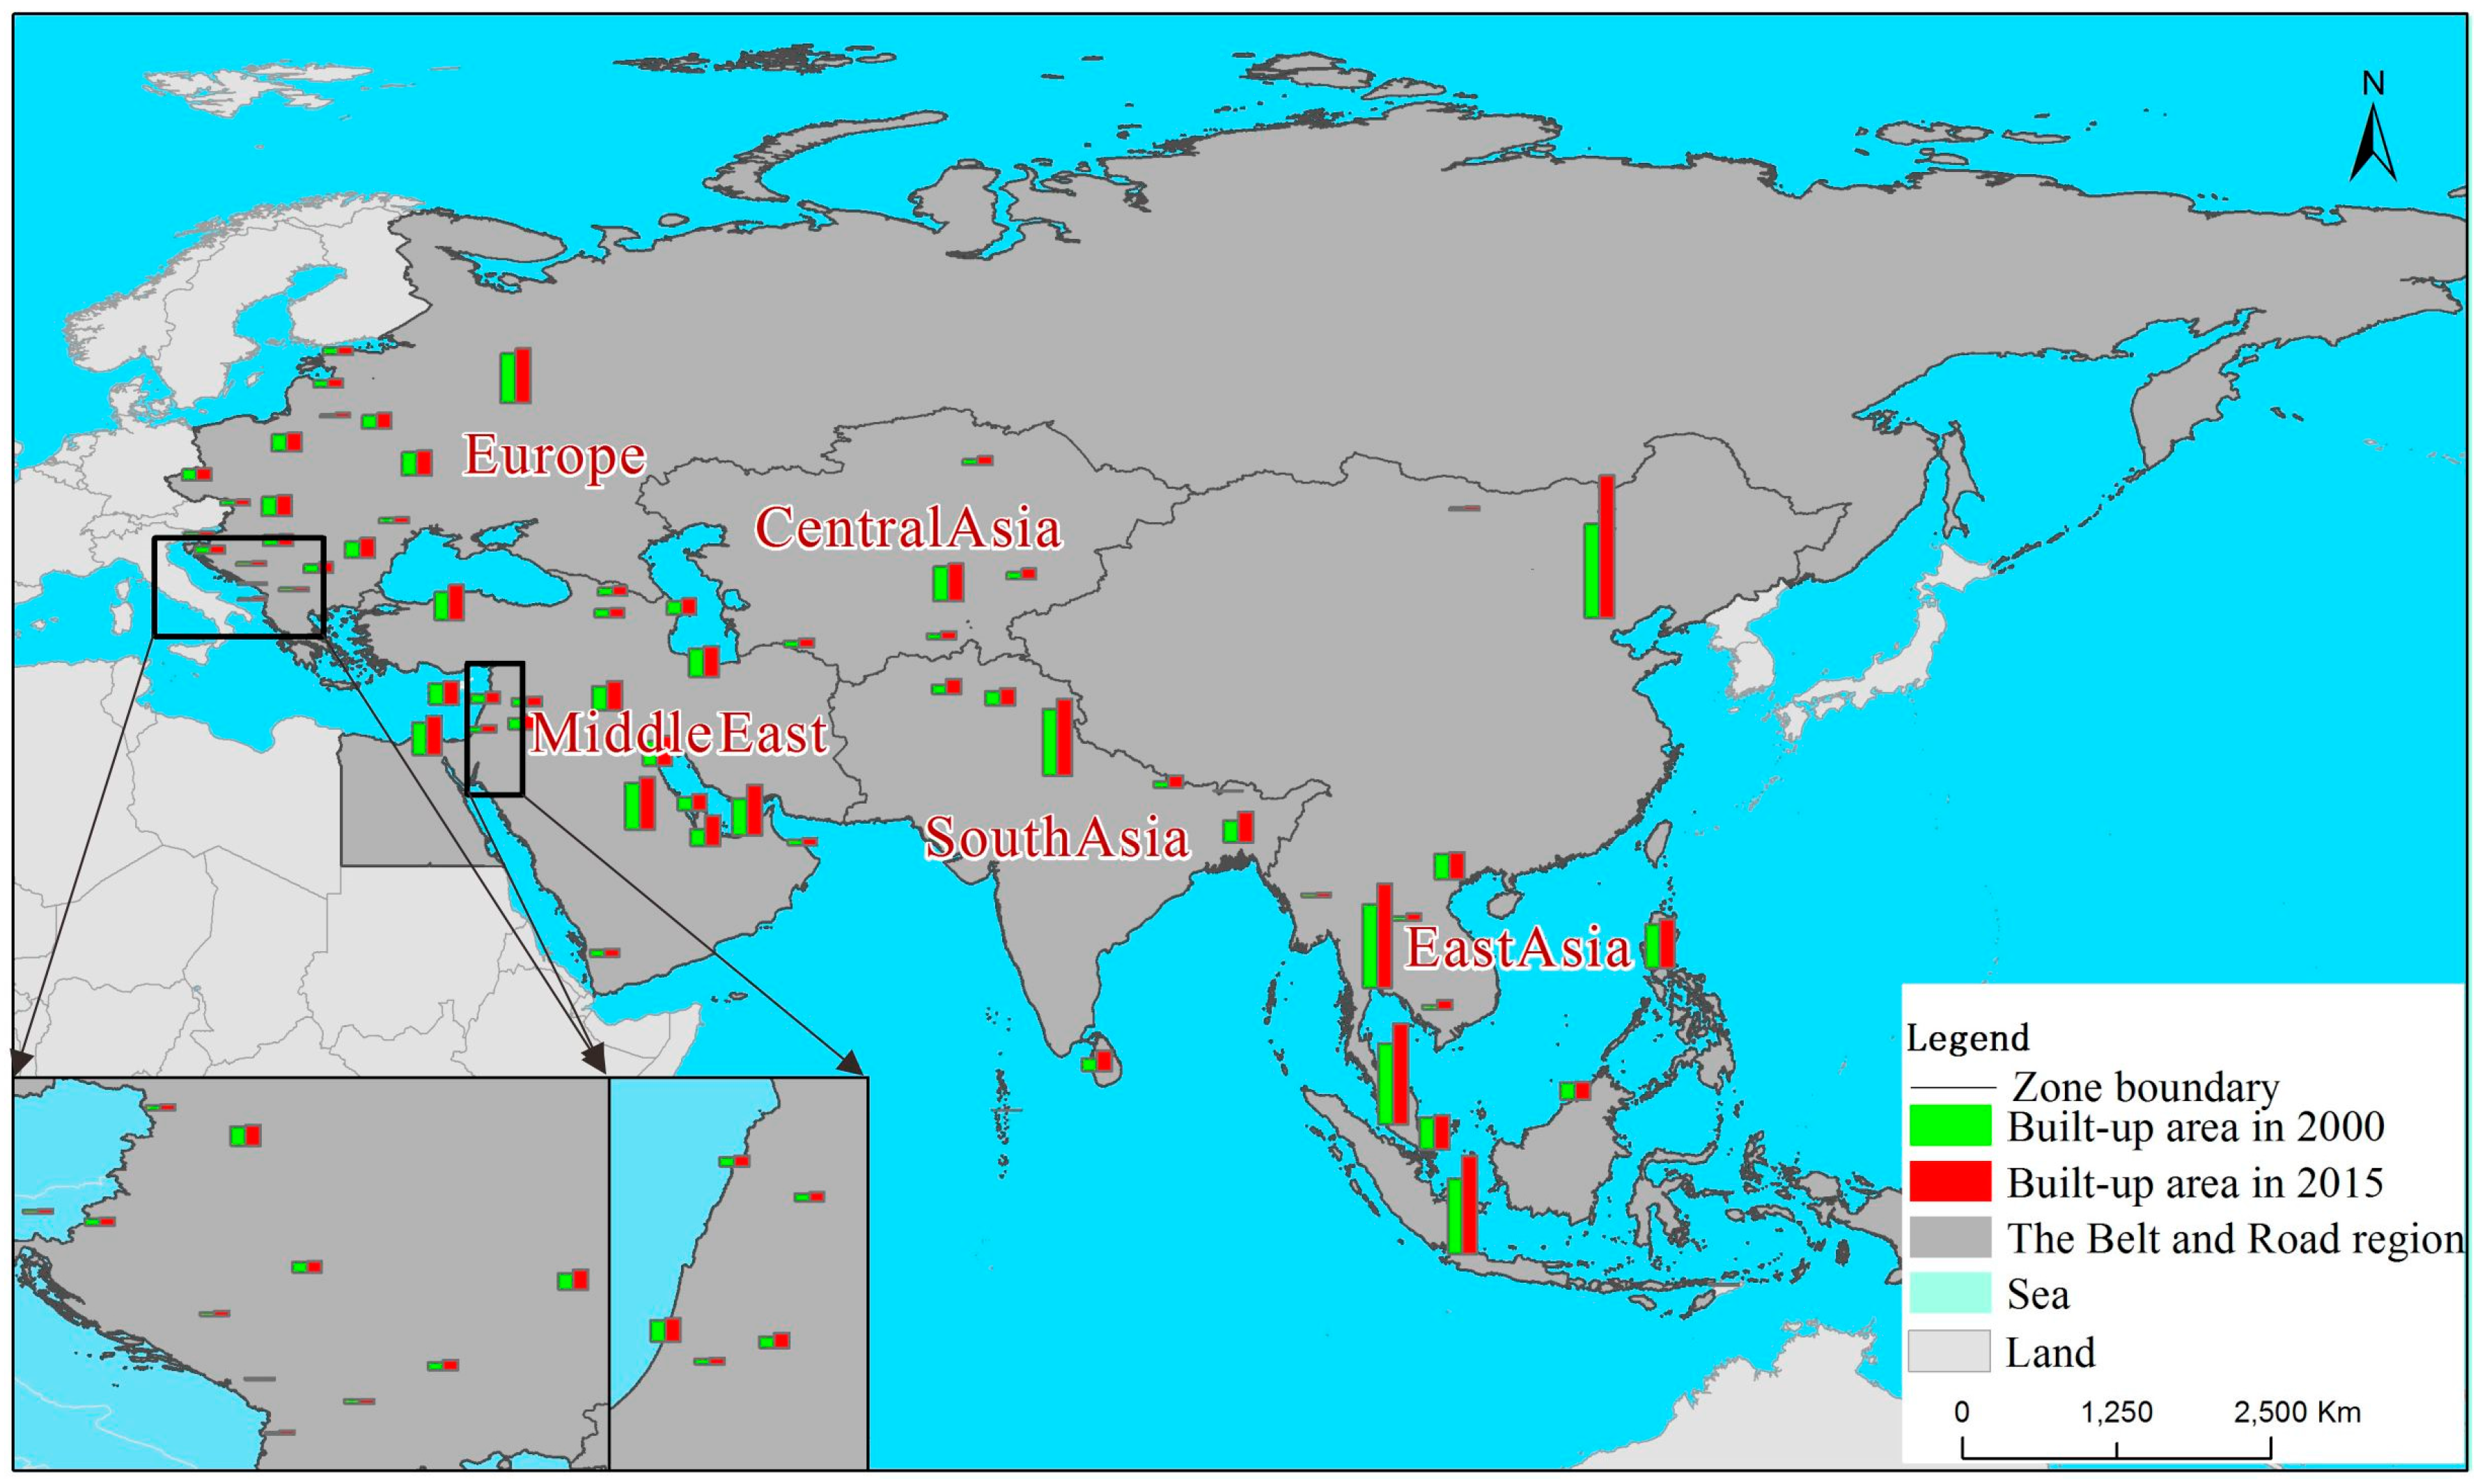
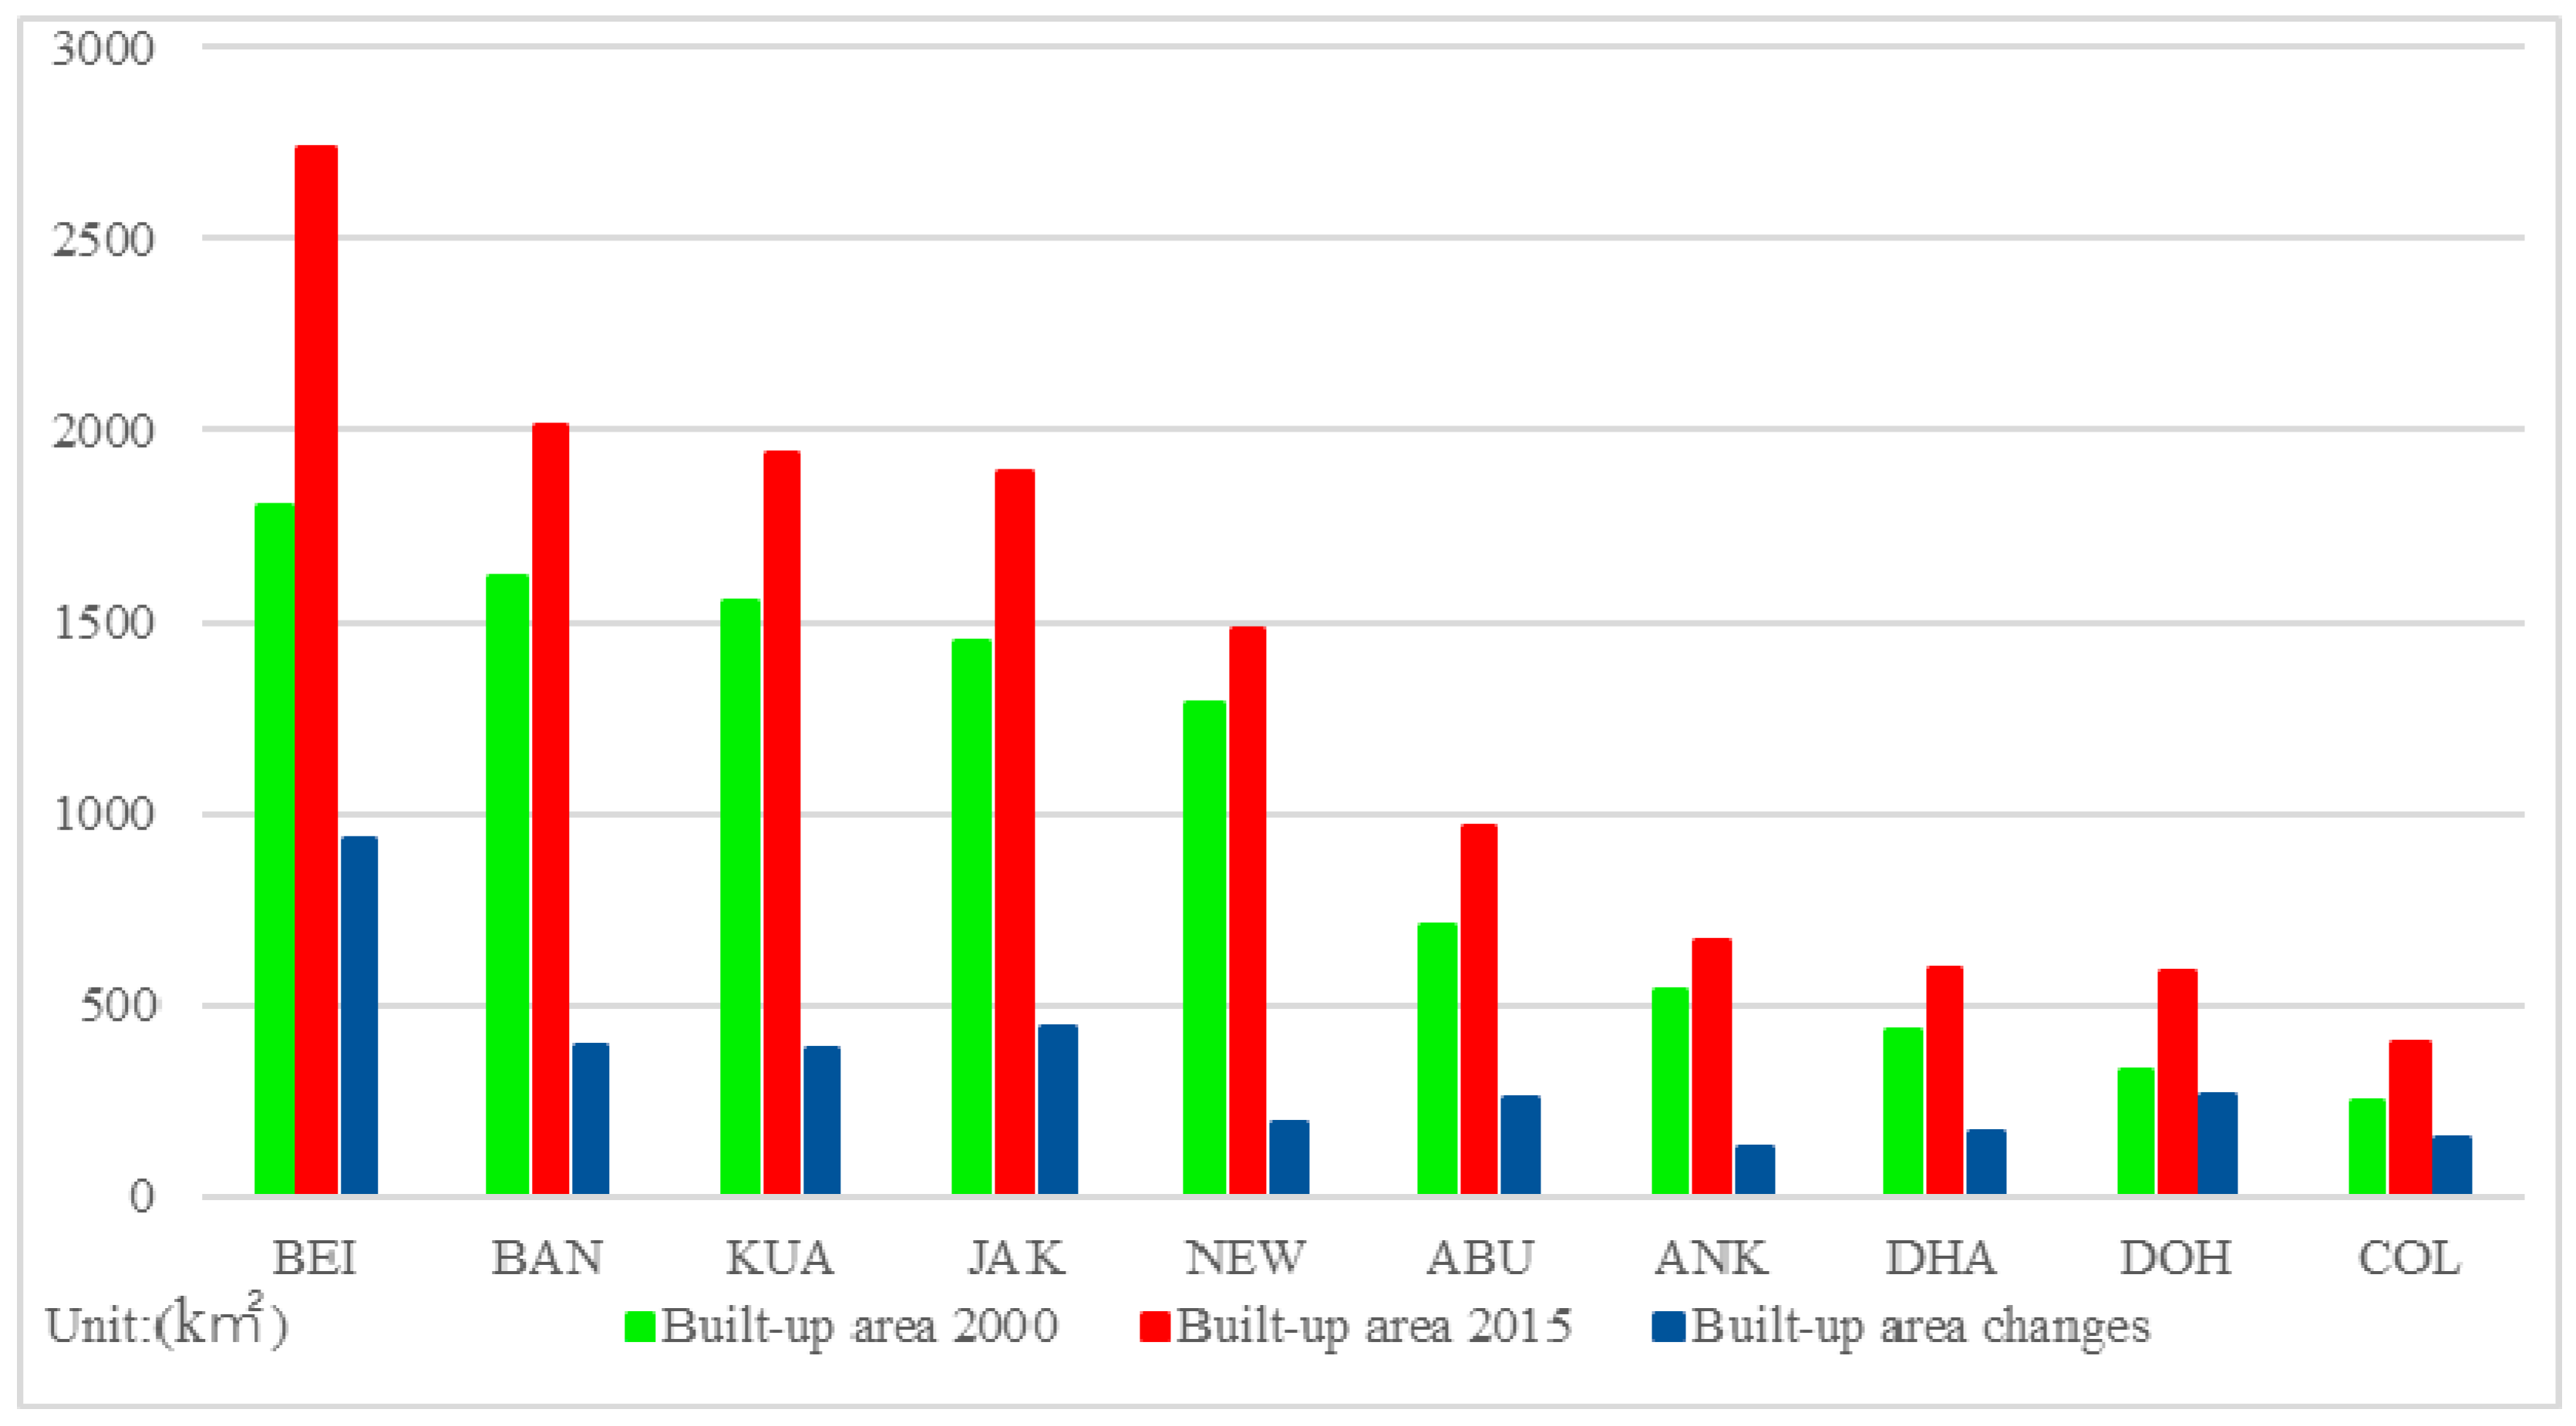
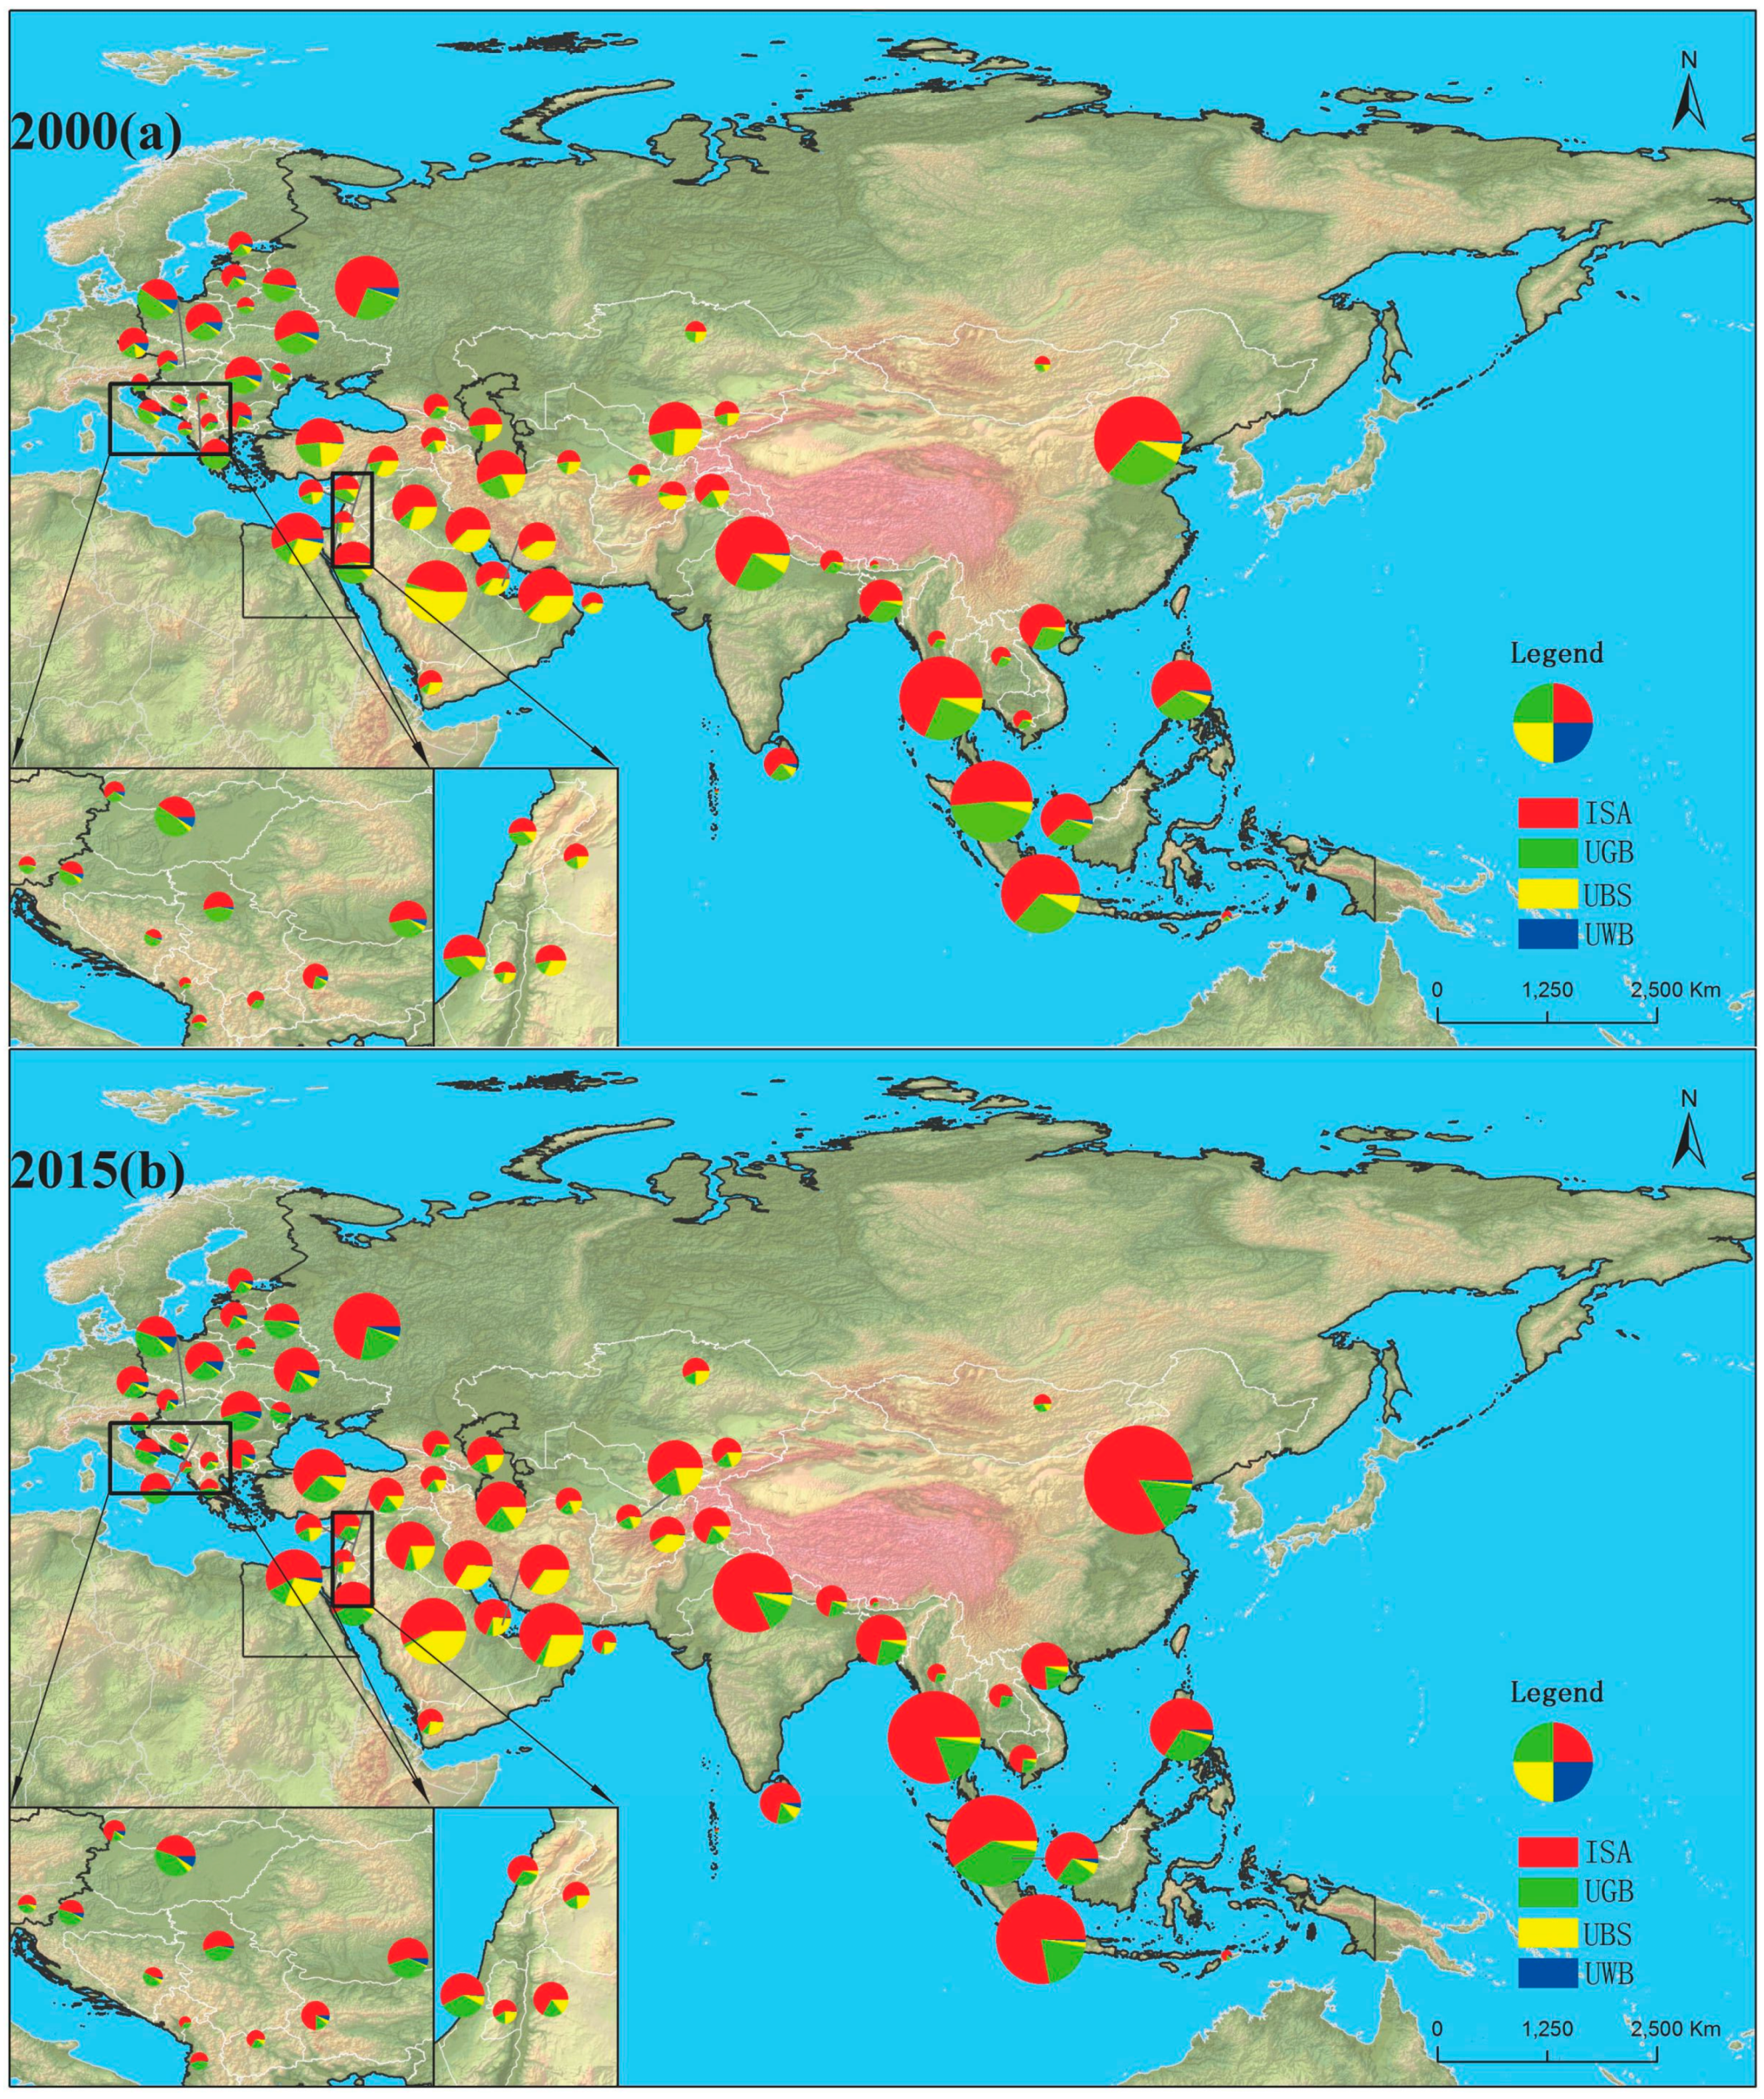
3.2. Urban Spatial Expansion Discrepancy in Different Regions
3.3. Intra-Urban Land-Cover Dynamic Changes
3.4. Analysis of the Linking Between Urban Land-Covers and Associated Climatic and Geographical Regions
3.5. Analysis of the Urban Land Configurations in Central Cities
4. Discussion
4.1. The First High-Resolution Intra-Urban Land-Cover Mapping Product within the Global Belt and Road
4.2. The Impacts of Economic Development and Population Migration on Livable Urban Environments
4.3. Intensified Interactions between Residential Areas and Existing Green Space
4.4. Comparison of Different Environmental Effects in Arid and Humid Regions According to the Intra-Urban Land-Cover Changes
4.5. Study Limitations
5. Conclusions
Author Contributions
Funding
Acknowledgments
Conflicts of Interest
References
- Kamali, M.; Delkash, M.; Tajrishy, M. Evaluation of permeable pavement responses to urban surface runoff. J. Environ. Manag. 2017, 187, 43–53. [Google Scholar] [CrossRef] [PubMed]
- Yin, J.; Xu, S.; Wen, J. Community-based scenario modelling and disaster risk assessment of urban rainstorm waterlogging. J. Geogr. Sci. 2011, 21, 274–284. [Google Scholar] [CrossRef]
- Clinton, N.; Gong, P. MODIS detected surface urban heat islands and sinks: Global locations and controls. Remote Sens. Environ. 2013, 134, 294–304. [Google Scholar] [CrossRef]
- Wang, S.; Fang, C.; Wang, Y.; Huang, Y.; Ma, H. Quantifying the relationship between urban development intensity and carbon dioxide emissions using a panel data analysis. Ecol. Indic. 2015, 49, 121–131. [Google Scholar] [CrossRef]
- Lutz, W.; Sanderson, W.; Scherbov, S. The end of world population growth. Nature 2001, 412, 543–545. [Google Scholar] [CrossRef] [PubMed] [Green Version]
- Glaeser, E.L.; Kerr, S.P.; Kerr, W.R. Entrepreneurship and Urban Growth: An Empirical Assessment with Historical Mines. Rev. Econ. Stat. 2015, 97, 498–520. [Google Scholar] [CrossRef]
- Seto, K.C.; Güneralp, B.; Hutyra, L.R. Global forecasts of urban expansion to 2030 and direct impacts on biodiversity and carbon pools. Proc. Natl. Acad. Sci. USA 2012, 109, 16083–16088. [Google Scholar] [CrossRef] [Green Version]
- Solecki, W.; Seto, K.C.; Marcotullio, P.J. It’s time for an urbanization science. Environ. Sci. Policy Sustain. Dev. 2013, 55, 12–17. [Google Scholar] [CrossRef]
- Dong, J.; Kuang, W.; Liu, J. Continuous land cover change monitoring in the remote sensing big data era. Sci. China Earth Sci. 2017, 60, 2223–2224. [Google Scholar] [CrossRef]
- Ahern, J. From fail-safe to safe-to-fail: Sustainability and resilience in the new urban world. Landsc. Urban Plan. 2011, 100, 341–343. [Google Scholar] [CrossRef] [Green Version]
- Santé, I.; García, A.M.; Miranda, D.; Crecente, R. Cellular automata models for the simulation of real-world urban processes: A review and analysis. Landsc. Urban Plan. 2010, 96, 108–122. [Google Scholar] [CrossRef]
- Kuang, W.; Yang, T.; Yan, F. Examining urban land-cover characteristics and ecological regulation during the construction of Xiong’an New District, Hebei Province, China. J. Geogr. Sci. 2018, 28, 109–123. [Google Scholar] [CrossRef]
- Friedl, M.A.; McIver, D.K.; Hodges, J.C.; Zhang, X.; Muchoney, D.; Strahler, A.H.; Woodcock, C.E.; Gopal, S.; Schneider, A.; Cooper, A.; et al. Global land cover mapping from MODIS: Algorithms and early results. Remote Sens. Environ. 2002, 83, 287–302. [Google Scholar] [CrossRef]
- Hollmann, R.; Merchant, C.J.; Saunders, R.; Downy, C.; Buchwitz, M.; Cazenave, A.; Chuvieco, E.; Defourny, P.; de Leeuw, G.; Forsberg, R.; et al. The ESA climate change initiative: Satellite data records for essential climate variables. Bull. Am. Meteorol. Soc. 2013, 94, 1541–1552. [Google Scholar] [CrossRef]
- Zhang, Z.; Wang, X.; Zhao, X.; Liu, B.; Yi, L.; Zuo, L.; Wen, Q.; Liu, F.; Xu, J.; Hu, S.; et al. A 2010 update of National Land Use/Cover Database of China at 1:100000 scale using medium spatial resolution satellite images. Remote Sens. Environ. 2014, 149, 142–154. [Google Scholar] [CrossRef]
- Ning, J.; Liu, J.; Kuang, W.; Xu, X.; Zhang, S.; Yan, C.; Li, R.; Wu, S.; Hu, Y.; Du, G.; et al. Spatiotemporal patterns and characteristics of land-use change in China during 2010–2015. J. Geogr. Sci. 2018, 28, 547–562. [Google Scholar] [CrossRef]
- Yu, L.; Liu, X.; Zhao, Y.; Yu, C.; Gong, P. Difficult to map regions in 30 m global land cover mapping determined with a common validation dataset. Int. J. Remote Sens. 2018, 39, 4077–4087. [Google Scholar] [CrossRef]
- Chen, J.; Chen, J.; Liao, A.; Cao, X.; Chen, L.; Chen, X.; He, C.; Han, G.; Peng, S.; Lu, M.; et al. Global land cover mapping at 30 m resolution: A POK-based operational approach. ISPRS J. Photogramm. Remote Sens. 2015, 103, 7–27. [Google Scholar] [CrossRef]
- Liu, X.; Hu, G.; Ai, B.; Li, X.; Shi, Q. A normalized urban area composite index (NUACI) based on combination of DMSP-OLS and MODIS for mapping impervious surface area. Remote Sens. 2015, 7, 17168–17189. [Google Scholar] [CrossRef]
- Li, P.; Qian, H.; Howard, K.W.; Wu, J. Building a new and sustainable “Silk Road economic belt”. Environ. Earth Sci. 2015, 74, 7267–7270. [Google Scholar] [CrossRef]
- Szczudlik-Tatar, J. China’s New Silk road diplomacy. Policy Pap. 2013, 34. Available online: https://www.files.ethz.ch/isn/174833/PISM%20Policy%20Paper%20no%2034%20(82).pdf (accessed on 25 June 2019).
- Tracy, E.F.; Shvarts, E.; Simonov, E.; Babenko, M. China’s new Eurasian ambitions: The environmental risks of the Silk Road Economic Belt. Eurasian Geogr. Econ. 2017, 58, 56–88. [Google Scholar] [CrossRef]
- Howard, K.W.; Howard, K.K. The new “Silk Road Economic Belt” as a threat to the sustainable management of Central Asia’s transboundary water resources. Environ. Earth Sci. 2016, 75, 976. [Google Scholar] [CrossRef]
- Li, P.; Qian, H.; Zhou, W. Finding harmony between the environment and humanity: An introduction to the thematic issue of the Silk Road. Environ. Earth Sci. 2017, 76, 105. [Google Scholar] [CrossRef]
- Lin, M.-L.; Chen, C.-W. Application of fuzzy models for the monitoring of ecologically sensitive ecosystems in a dynamic semi-arid landscape from satellite imagery. Eng. Comput. 2010, 27, 5–19. [Google Scholar] [CrossRef]
- Huang, J.; Ji, M.; Xie, Y.; Wang, S.; He, Y.; Ran, J. Global semi-arid climate change over last 60 years. Clim. Dyn. 2016, 46, 1131–1150. [Google Scholar] [CrossRef]
- Ammar, A.; Riksen, M.; Ouessar, M.; Ritsema, C. Identification of suitable sites for rainwater harvesting structures in arid and semi-arid regions: A review. Int. Soil Water Conserv. Res. 2016, 4, 108–120. [Google Scholar] [CrossRef] [Green Version]
- O’Farrell, P.; Reyers, B.; Le Maitre, D.C.; Milton, S.; Egoh, B.; Maherry, A.; Colvin, C.; Atkinson, D.; De Lange, W.; Blignaut, J. Multi-functional landscapes in semi-arid environments: Implications for biodiversity and ecosystem services. Landsc. Ecol. 2010, 25, 1231–1246. [Google Scholar] [CrossRef]
- Huang, J.; Yu, H.; Guan, X.; Wang, G.; Guo, R. Accelerated dryland expansion under climate change. Nat. Clim. Chang. 2016, 6, 166–171. [Google Scholar] [CrossRef]
- Eliasson, J. The rising pressure of global water shortages. Nat. News 2015, 517, 6. [Google Scholar] [CrossRef]
- Ahmad, A.; Quegan, S. Analysis of maximum likelihood classification on multispectral data. Appl. Math. Sci. 2012, 6, 6425–6436. [Google Scholar]
- Okujeni, A.; van der Linden, S.; Hostert, P. Extending the vegetation–impervious–soil model using simulated EnMAP data and machine learning. Remote Sens. Environ. 2015, 158, 69–80. [Google Scholar] [CrossRef]
- Wang, J.; Wu, Z.; Wu, C.; Cao, Z.; Fan, W.; Tarolli, P. Improving impervious surface estimation: An integrated method of classification and regression trees (CART) and linear spectral mixture analysis (LSMA) based on error analysis. GISci. Remote Sens. 2018, 55, 583–603. [Google Scholar] [CrossRef]
- Beck, H.E.; Zimmermann, N.E.; McVicar, T.R.; Vergopolan, N.; Berg, A.; Wood, E.F. Present and future Köppen-Geiger climate classification maps at 1-km resolution. Sci. Data 2018, 5, 180214. [Google Scholar] [CrossRef] [PubMed]
- Kaufmann, D.; Sager, F. How to organize secondary capital city regions: Institutional drivers of locational policy coordination. Governance 2019, 32, 63–81. [Google Scholar] [CrossRef]
- Lu, D.; Moran, E.; Hetrick, S. Detection of impervious surface change with multitemporal Landsat images in an urban-rural frontier. ISPRS J. Photogramm. Remote Sens. 2011, 66, 298–306. [Google Scholar] [CrossRef] [PubMed]
- Lu, D.; Li, G.; Kuang, W.; Moran, E. Methods to extract impervious surface areas from satellite images. Int. J. Digit. Earth 2013, 7, 93–112. [Google Scholar] [CrossRef]
- Feng, Y.; Lu, D.; Moran, E.; Dutra, L.; Calvi, M.; de Oliveira, M. Examining Spatial Distribution and Dynamic Change of Urban Land Covers in the Brazilian Amazon Using Multitemporal Multisensor High Spatial Resolution Satellite Imagery. Remote Sens. 2017, 9, 381. [Google Scholar] [CrossRef]
- Ehlers, M.; Klonus, S.; Johan Åstrand, P.; Rosso, P. Multi-sensor image fusion for pansharpening in remote sensing. Int. J. Image Data Fusion 2010, 1, 25–45. [Google Scholar] [CrossRef]
- Flaash, U.S.G. Atmospheric Correction Module: QUAC and Flaash User Guide v. 4; ITT Visual Information Solutions Inc.: Boulder, CO, USA, 2009. [Google Scholar]
- Bernstein, L.; Adler-Golden, S.; Sundberg, R.; Ratkowski, A. Improved reflectance retrieval from hyper-and multispectral imagery without prior scene or sensor information. In Remote Sensing of Clouds and the Atmosphere XI; International Society for Optics and Photonics: Bellingham, WA, USA, 2006; Volume 63622. [Google Scholar]
- Liu, X.; Hu, G.; Chen, Y.; Li, X.; Xu, X.; Li, S.; Pei, F.; Wang, S. High-resolution multi-temporal mapping of global urban land using Landsat images based on the Google Earth Engine Platform. Remote Sens. Environ. 2018, 209, 227–239. [Google Scholar] [CrossRef]
- Kuang, W.; Chen, L.; Liu, J.; Xiang, W.; Chi, W.; Lu, D.; Yang, T.; Pan, T.; Liu, A. Remote sensing-based artificial surface cover classification in Asia and spatial pattern analysis. Sci. China Earth Sci. 2016, 59, 1720–1737. [Google Scholar] [CrossRef]
- Fan, F.; Fan, W.; Weng, Q. Improving urban impervious surface mapping by linear spectral mixture analysis and using spectral indices. Can. J. Remote Sens. 2015, 41, 577–586. [Google Scholar] [CrossRef]
- Lu, D.; Weng, Q. Use of impervious surface in urban land-use classification. Remote Sens. Environ. 2006, 102, 146–160. [Google Scholar] [CrossRef]
- Wilson, M.; Reynolds, G.; Kauppinen, R.A.; Arvanitis, T.N.; Peet, A.C. A constrained least-squares approach to the automated quantitation of in vivo (1) H magnetic resonance spectroscopy data. Magn. Reson. Med. 2011, 65, 1–12. [Google Scholar] [CrossRef] [PubMed]
- Zhang, C.; Chen, Y.; Lu, D. Mapping the land-cover distribution in arid and semiarid urban landscapes with Landsat Thematic Mapper imagery. Int. J. Remote Sens. 2015, 36, 4483–4500. [Google Scholar] [CrossRef]
- Xu, H. Modification of normalised difference water index (NDWI) to enhance open water features in remotely sensed imagery. Int. J. Remote Sens. 2006, 27, 3025–3033. [Google Scholar] [CrossRef]
- Tucker, C.J. Red and photographic infrared linear combinations for monitoring vegetation. Remote Sens. Environ. 1979, 8, 127–150. [Google Scholar] [CrossRef] [Green Version]
- McGarigal, K.; Cushman, S.A.; Ene, E. FRAGSTATS v4: Spatial Pattern Analysis Program for Categorical and Continuous Maps. Computer Software Program Produced by the Authors at the University of Massachusetts, Amherst. Available online: http://www. umass. edu/landeco/research/fragstats/fragstats (accessed on 26 June 2012).
- Pesaresi, M.; Ehrlich, D.; Ferri, S.; Florczyk, A.; Freire, S.; Halkia, M.; Julea, A.; Kemper, T.; Soille, P.; Syrris, V.; et al. Operating Procedure for the Production of the Global Human Settlement Layer from Landsat Data of the Epochs 1975, 1990, 2000, and 2014; Publications Office of the European Union: Luxembourg, 2016; pp. 1–62. [Google Scholar]
- Tang, K.; Li, Z.; Li, W.; Chen, L. China’s Silk Road and global health. Lancet 2017, 390, 2595–2601. [Google Scholar] [CrossRef]
- Zhang, K. Right to Information about, and Involvement in, Environmental Decision Making along the Silk Road Economic Belt. Chin. J. Comp. Law 2017, 5, 58–78. [Google Scholar] [CrossRef] [Green Version]
- Yan, Y.; Kuang, W.; Zhang, C.; Chen, C. Impacts of impervious surface expansion on soil organic carbon—A spatially explicit study. Sci. Rep. 2015, 5, 17905. [Google Scholar] [CrossRef]
- Chaponnière, J.-R.; Cling, J.-P.; Zhou, B. Vietnam Following in China’S Footsteps: the Third Wave of Emerging Asian Economies; UNU-WIDER: Helsinki, Finland, 2010; p. 26. ISBN 9789292301385. [Google Scholar]
- Peng, I.; Wong, J. East Asia. In The Oxford Handbook of the Welfare State; OUP: Oxford, UK, 2010. [Google Scholar]
- Nagendra, H.; Nagendran, S.; Paul, S.; Pareeth, S. Graying, greening and fragmentation in the rapidly expanding Indian city of Bangalore. Landsc. Urban Plan. 2012, 105, 400–406. [Google Scholar] [CrossRef]
- Rasul, G. Food, water, and energy security in South Asia: A nexus perspective from the Hindu Kush Himalayan region. Environ. Sci. Policy 2014, 39, 35–48. [Google Scholar] [CrossRef]
- Nath, R.; Luan, Y.; Yang, W.; Yang, C.; Chen, W.; Li, Q.; Cui, X. Changes in arable land demand for food in India and China: A potential threat to food security. Sustainability 2015, 7, 5371–5397. [Google Scholar] [CrossRef]
- Thornton, P.K.; Kristjanson, P.; Förch, W.; Barahona, C.; Cramer, L.; Pradhan, S. Is agricultural adaptation to global change in lower-income countries on track to meet the future food production challenge? Glob. Environ. Chang. 2018, 52, 37–48. [Google Scholar] [CrossRef]
- Xu, K.; Yang, D.; Yang, H.; Li, Z.; Qin, Y.; Shen, Y. Spatio-temporal variation of drought in China during 1961–2012: A climatic perspective. J. Hydrol. 2015, 526, 253–264. [Google Scholar] [CrossRef]
- Zhang, W.; Huang, B.; Luo, D. Effects of land use and transportation on carbon sources and carbon sinks: A case study in Shenzhen, China. Landsc. Urban Plan. 2014, 122, 175–185. [Google Scholar] [CrossRef]
- Tan, Z.; Lau, K.K.-L.; Ng, E. Urban tree design approaches for mitigating daytime urban heat island effects in a high-density urban environment. Energy Build. 2016, 114, 265–274. [Google Scholar] [CrossRef]
- Lazzarini, M.; Marpu, P.R.; Ghedira, H. Temperature-land cover interactions: The inversion of urban heat island phenomenon in desert city areas. Remote Sens. Environ. 2013, 130, 136–152. [Google Scholar] [CrossRef]
- Poortinga, W.; Whitmarsh, L.; Steg, L.; Böhm, G.; Fisher, S. Climate change perceptions and their individual-level determinants: A cross-European analysis. Glob. Environ. Chang. 2019, 55, 25–35. [Google Scholar] [CrossRef]



| Divisions | City (abbreviation), Country |
|---|---|
| Central Asia (5 cities) | Ashgabat (ASH), Turkmenistan; Astana (AST), Kazakhstan; Bishkek (BIS), Kyrgyzstan; Dushanbe (DUS), Tajikistan; Toshkent (TOS), Uzbekistan; |
| South Asia (8 cities) | Colombo (COL), Sri Lanka; Dhaka (DHA), Bangladesh; Kabul (KAB), Afghanistan; Kathmandu (KAT), Nepal; Male (MAL), Maldives; New Deli (NEW), India; Islamabad (ISL), Pakistan; Thimphu (THI), Bhutan; |
| East Asia (13 cities) | Bangkok (BAN), Thailand; Beijing (BEI), China; Bandar_Seri_Begawan (BSB), Brunei; Dili (DIL), East Timor; Hanoi (HAN), Vietnam; Jakarta (JAK), Indonesia; Kuala Lumpur (KUA), Malaysia; Manila (MAN), Philippines; Naypyidaw (NAY), Myanmar; Phnom_Penh (PHN), Cambodia; Singapore (SIN), Singapore; Ulaanbaatar (ULA), Mongolia; Vientiane (VIE), Laos; |
| Middle East (19 cities) | Abu_Dhabi (ABU), United Arab Emirates; Amman (AMM), Jordan; Ankara (ANK), Turkey; Baku (BAK), Azerbaijan; Baghdad (BAQ), Iraq; Beirut (BEIR), Lebanon; Cairo (CAR), Egypt; Damascus (DAM), Syria; Doha (DOH), Qatar; Jerusalem (JER), Palestina; Kuwait (KUW), Kuwait; Manama (MAN), Bahrain; Muscat (MUS), Oman; Riyadh (RIY), Saudi Arabia; Sanaa (SAN), Yemen; Tbilisi (TBI), Georgia; Teheran (TEH), Iran; Tel_Aviv (TEL), Israel; Yerevan (YER), Armenia; |
| Europe (20 cities) | Belgrade (BELG), Serbia; Bratislava (BRA), Slovakia; Budapest (BUD), Hungary; Bucharest (BUC), Romania; Chisinau (CHI), Moldova; Kyiv (KYI), Ukraine; Ljubljana (LJU), Slovenia; Minsk (MIN), Belarus; Moscow (MOS), Russia; Podgorica (POD), Montenegro; Prague (PRA), Czech Republic; Riga (RIG), Latvia; Sarajevo (SAR), Bosnia and Herzegovina; Skopje (SKO), Macedonia; Sofia (SOF), Bulgaria; Tallinn (TAL), Estonia; Tirana (TIR), Albania; Vilnius (VIL), Lithuania; Warsaw (WAR), Poland; Zagreb (ZAG), Croatia; |
| Full Name | Abbreviation | Expression | Description of Land-Cover Configurations |
|---|---|---|---|
| Patch Density | PD | : number of patches of type i A = total landscape area (m2) | Indicating the number of patches per unit area and providing comparisons in landscape sizes. It is an indicator of land-cover landscape ecological sensitivity. |
| Largest Patch Index | LPI | = area (m2) of patch ij A = total landscape area (m2) | Largest patch index at the class level quantifies the percentage of total landscape area comprised by the largest patch. The simple measure regarding dominance among all the land covers. |
| Landscape Shape Index | LSI | or = total length (m) of edge A = total landscape area (m2) | Standardized measures of total edge or edge density, which can be adjusted according to the size of the landscape. The expression on the left is for the class level and the right one is for horizontal level. |
| Connectance Index | CON | cijk = joining (or contiguity) between patches j and k (0 = unjoined, 1 = joined) of the corresponding patch type (i). ni = number of patches in the landscape (class) | Indicating the percentage of maximum possible connections among the land patches. It is an indicator of land-cover landscape ecological sensitivity. |
| Shannon’s Diversity Index | SHDI | = proportion of the landscape occupied by patch type (class) i | The measure of diversity in community ecology. Here, it was used in urban landscape. |
| Ground Truth Samples (Pixels) | Reference Samples | Classified Samples | Number Correct | Producer Accuracy | User Accuracy | ||||
|---|---|---|---|---|---|---|---|---|---|
| Land-Cover | ISA | UGB | UBS | UWB | |||||
| ISA | 4676 | 67 | 365 | 39 | 5192 | 5147 | 4676 | 90.06% | 90.85% |
| UGB | 115 | 6573 | 82 | 24 | 6789 | 6794 | 6573 | 96.82% | 96.75% |
| UBS | 383 | 126 | 4237 | 33 | 4732 | 4779 | 4237 | 89.54% | 88.66% |
| UWB | 18 | 23 | 48 | 1791 | 1887 | 1880 | 1791 | 94.91% | 95.27% |
| Year: 2000, Overall Classification Accuracy = 92.88% (i.e., 17, 277/18, 600), Overall Kappa Statistics = 0.842 | |||||||||
| ISA | 6417 | 112 | 316 | 21 | 6986 | 6866 | 6417 | 91.86% | 93.46% |
| UGS | 74 | 4708 | 89 | 16 | 4911 | 4887 | 4708 | 95.87% | 96.34% |
| UBS | 477 | 82 | 4124 | 27 | 4555 | 4710 | 4124 | 90.54% | 87.56% |
| UWB | 18 | 9 | 26 | 2084 | 2148 | 2137 | 2084 | 97.02% | 97.52% |
| Year: 2015, Overall Classification Accuracy = 93.19 % (i.e., 17, 333/18, 600), Overall Kappa Statistics = 0.855 | |||||||||
| Ground Truth Samples (Pixels) | Reference Samples | Classified Samples | Number Correct | Producer Accuracy | User Accuracy | ||||
|---|---|---|---|---|---|---|---|---|---|
| Land-Cover | ISA | UGB | UBS | UWB | |||||
| ISA | 166 | 2 | 5 | 1 | 178 | 174 | 166 | 93.26% | 95.40% |
| UGB | 3 | 112 | 1 | 0 | 115 | 116 | 112 | 97.39% | 96.55% |
| UBS | 9 | 1 | 79 | 0 | 85 | 89 | 79 | 92.94% | 88.76% |
| UWB | 0 | 0 | 0 | 21 | 22 | 21 | 21 | 95.45% | 100.00% |
| (a) SMDU method: Overall Classification Accuracy = 94.50% (i.e., 378/400), Overall Kappa Statistics = 0.852 | |||||||||
| ISA | 163 | 1 | 9 | 0 | 177 | 173 | 163 | 92.09% | 94.22% |
| UGS | 3 | 106 | 1 | 0 | 109 | 110 | 106 | 97.25% | 96.36% |
| UBS | 10 | 2 | 81 | 0 | 91 | 93 | 81 | 89.01% | 87.10% |
| UWB | 1 | 0 | 0 | 23 | 23 | 24 | 23 | 100.00% | 95.83% |
| (b) SMDU method: Overall Classification Accuracy = 93.25% (i.e., 373/400), Overall Kappa Statistics = 0.854 | |||||||||
| ISA | 147 | 1 | 16 | 2 | 169 | 166 | 147 | 86.98% | 88.55% |
| UGS | 2 | 109 | 2 | 0 | 113 | 113 | 109 | 96.46% | 96.46% |
| UBS | 17 | 3 | 75 | 0 | 93 | 95 | 75 | 80.65% | 78.95% |
| UWB | 3 | 0 | 0 | 23 | 25 | 26 | 23 | 92.00% | 88.46% |
| (c) LD method: Overall Classification Accuracy = 88.50% (i.e., 354/400), Overall Kappa Statistics = 0.839 | |||||||||
| Climatic Regions | Humid Region | Arid Region | |||
|---|---|---|---|---|---|
| 2015 ISA (km2) | 15,241.12 | 4775.57 | |||
| 2015 UGS (km2) | 4858.58 | 708.28 | |||
| 2015 UBS (km2) | 1103.82 | 2017.17 | |||
| 2015 UWB (km2) | 469.43 | 83.55 | |||
| △ ISA (%) | +48.43 | +42.60 | |||
| △UGS (%) | −7.37 | +14.61 | |||
| △UBS (%) | −28.09 | −1.02 | |||
| △UWB (%) | −12.85 | +24.68 | |||
| Geographical zones | East Asia | South Asia | Middle East | Central Asia | Europe |
| 2015 ISA (km2) | 8596.26 | 2464.22 | 5169.51 | 876.17 | 2910.53 |
| 2015 UGS (km2) | 2332.98 | 614.20 | 1003.22 | 209.43 | 1407.01 |
| 2015 UBS (km2) | 457.67 | 220.97 | 1970.96 | 305.27 | 166.11 |
| 2015 UWB (km2) | 142.64 | 42.27 | 91.08 | 10.87 | 266.13 |
| △ ISA (%) | +54.34 | +50.09 | +38.93 | +35.83 | +20.74 |
| △UGS (%) | −13.93 | −7.28 | +12.61 | +15.36 | +1.57 |
| △UBS (%) | −29.01 | −4.91 | −3.16 | −1.85 | −5.68 |
| △UWB (%) | +22.99 | +38.72 | +22.35 | +11.08 | +7.53 |
© 2019 by the authors. Licensee MDPI, Basel, Switzerland. This article is an open access article distributed under the terms and conditions of the Creative Commons Attribution (CC BY) license (http://creativecommons.org/licenses/by/4.0/).
Share and Cite
Pan, T.; Kuang, W.; Hamdi, R.; Zhang, C.; Zhang, S.; Li, Z.; Chen, X. City-Level Comparison of Urban Land-Cover Configurations from 2000–2015 across 65 Countries within the Global Belt and Road. Remote Sens. 2019, 11, 1515. https://doi.org/10.3390/rs11131515
Pan T, Kuang W, Hamdi R, Zhang C, Zhang S, Li Z, Chen X. City-Level Comparison of Urban Land-Cover Configurations from 2000–2015 across 65 Countries within the Global Belt and Road. Remote Sensing. 2019; 11(13):1515. https://doi.org/10.3390/rs11131515
Chicago/Turabian StylePan, Tao, Wenhui Kuang, Rafiq Hamdi, Chi Zhang, Shu Zhang, Zhili Li, and Xin Chen. 2019. "City-Level Comparison of Urban Land-Cover Configurations from 2000–2015 across 65 Countries within the Global Belt and Road" Remote Sensing 11, no. 13: 1515. https://doi.org/10.3390/rs11131515
APA StylePan, T., Kuang, W., Hamdi, R., Zhang, C., Zhang, S., Li, Z., & Chen, X. (2019). City-Level Comparison of Urban Land-Cover Configurations from 2000–2015 across 65 Countries within the Global Belt and Road. Remote Sensing, 11(13), 1515. https://doi.org/10.3390/rs11131515


