Article

Investigating the Norse Harbour of Igaliku (Southern Greenland) Using an Integrated System of Side-Scan Sonar and High-Resolution Reflection Seismics

1
Institute of Geosciences, Christian-Albrechts-University of Kiel, Otto-Hahn-Platz 1, 24118 Kiel, Germany
2
Leibniz-Institute for Baltic Sea Research Warnemünde, Seestraße 15, 18119 Rostock, Germany
3
Landschaftsverband Westfalen-Lippe (LWL)-Archaeology, 48147 Münster, Germany
4
School of Geosciences, The University of Edinburgh, Drummond Street, Edinburgh EH8 9XP, UK
5
Department of Prehistory and Historical Archaeology, University of Vienna, Franz-Klein-Gasse 1, 1190 Vienna, Austria
*
Author to whom correspondence should be addressed.
Remote Sens. 2019, 11(16), 1889; https://doi.org/10.3390/rs11161889
Submission received: 12 July 2019 / Revised: 5 August 2019 / Accepted: 8 August 2019 / Published: 13 August 2019

Abstract

:
This study presents the results of a marine geophysical survey performed in the Igaliku fjord in southern Greenland in order to understand the harbour setting of the former Norse settlement Garðar (modern Igaliku). The aims of the survey were (a) to reconstruct the former coastline during the first centuries of the Norse settlement period (c. 11/12th centuries) and (b) to search for archaeological remains on the seabed connected to maritime traffic and trade. In order to approach these goals, we used an integrated marine survey system consisting of a side-scan sonar and a reflection seismic system. The system was designed for lightweight transport, allowing measurements in areas that are logistically difficult to access. The side-scan sonar data revealed no remains of clear archaeological origin. Bathymetric data from seismic seabed reflection and additional Differential GPS height measurements yielded a high-resolution bathymetric map. Based on estimates of Holocene relative sea level change, our bathymetry model was used to reconstruct the shift of the high and low-water line since the early Norse period. The reconstructed coastline shows that a small island, which hosts the ruins of a tentative Norse warehouse at the mouth of the present harbour, was connected to the shore at low tide during the early Norse period. In addition, reflection seismics and side-scan sonar images reveal a sheltered inlet with steep slopes on one side of the island, which may have functioned as a landing bridge used to load ships. We also show that the loss of fertile land due to sea level rise until the end of the Norse settlement was insignificant compared to the available fertile land in the Igaliku fjord and is thus not the reason for the collapse of the colony.

Graphical Abstract

1. Introduction

Harbours and landing places were key components of the ocean voyages of the Norse during the process of their westward expansion. The peoples that left their homes in order to settle new territories in Shetland, the Faroes, Iceland and Greenland had to traverse the Atlantic and depended on safe anchorages and suitable landing places. These harbours were also vital to maintaining contact with Scandinavia and the British Isles. The North Atlantic islands played an important role in the economic history of northern Europe. Greenland, for instance, supplied Europe with walrus ivory and furs, while Icelanders traded in wool, stockfish and gyrfalcons [1,2]. These commodities were transported across the Atlantic Ocean by boat, which determined the importance of many harbours and landing sites.
The harbours in the Norse colonies of the North Atlantic were generally simple landing places or anchorages that provided natural protection from the wind and waves. Besides the harbours of larger settlements such as Garðar in southern Greenland (modern name Igaliku), there were also coastal trading sites that were only temporarily used during the summer months, such as Gásir in the north of Iceland. However, a solid harbour infrastructure was rare, as neither written sources nor the archaeological record provide indications for structures such as permanently built jetties or wharves [3].
The Norse settlements in Greenland were strongly impacted by the climate change that marked the transition from the Medieval Climatic Anomaly (MCA, AD ~ 950–1250) to the Little Ice Age (LIA, AD ~ 1300–1850). Multiple studies have argued that the change in climate was one of the main reasons why the Norse abandoned their settlements, but perhaps not to the extent previously suggested (e.g., [4,5]). In addition, it has been suggested that the loss of fertile land due to a relative sea level rise in the Late Holocene also contributed to the downfall of the Norse settlement in Greenland [6]. The magnitude of the local sea level change, causing changes in the morphology of the coastline and the resulting loss of fertile land until AD 1450 in Garðar, is poorly understood. However, it is a critical component in understanding the magnitude of fertile land loss in the area until the end of the Eastern Settlement, around 1450 AD.
To understand the role and setup of a harbour site or landing place, the terrestrial topography, seascape and bathymetry and the wider surroundings of the settlement including boat shelters, graves, churches, cairns, etc. need to be taken into account. This approach to the understanding of the maritime cultural landscape, initiated by Christer Westerdahl [7,8], is the driving force for the international research project Harbours in the North Atlantic AD 800–1300 (HaNoA). The aims of HaNoA are to understand harbours and landing places in the Norse settlement areas across the North Atlantic. It is part of a research programme into harbours from the Roman period to the Middle Ages across Europe, funded by the German Research Foundation [9].
In this study, we focus on the settlement of Garðar (modern name Igaliku) in the former Eastern Settlement of the Norse in south Greenland (Figure 1). Garðar was the main centre of the Norse settlement and the seat of the Greenlandic bishopric which was installed in 1124. The cathedral, of which remains can still be seen today, was dedicated to St Nicholas, the patron saint of sailors. The site was repeatedly excavated, with the most extensive work being done by Poul Nørlund in 1926 (Figure 2). The episcopal see consisted of the cathedral and a churchyard, storage buildings and dwellings, a smithy, byres with barns and a stone wall around the infields. The remains of some of these buildings can still be seen today and attest to the impressive character of the site. Nearer the shore are smaller buildings which were probably used to store equipment, or goods. A sophisticated irrigation system provided for the watering and drainage of the settlement [10]. Although the harbour of Igaliku was a central node in the connection between Greenland, Iceland and Norway, it was never archaeologically investigated. The northern end of the bay contains three islands: one smaller island in the west, near the Norse and modern settlement area, and two larger islands further east, more or less in the centre of the bay (Figure 1). On the islands, the remains of large stone buildings, most likely dating to the Norse period, are preserved (Figure 2). They were interpreted to be the remains of storage buildings or warehouses, which are a common feature of Norse coastal settlements in Greenland [10], and are evidence for the use of the islands as part of the ship traffic in the bay.
In the summer of 2015, a geophysical survey using marine reflection seismics and side-scan sonar measurements was performed at the head of Igaliku fjord. The objectives of this study include the following:
  • The identification of potential landing and mooring places used by the Norse until the early 15th century and a discussion concerning the accessibility of the coastal areas of Garðar for ships of the Norse period;
  • An assessment of the impact of local sea level rise on the area of fertile land and homefields available in the inner Igaliku fjord based on a new bathymetric map.
The general Holocene sea level trend in Greenland is controlled by the postglacial rebound, causing a local regression of more than 100 m in northern Greenland and approximately 40 m in southern Greenland [6,11,12], with the glacial rebound generally slowing down towards the present day. In the Igaliku fjord, the Holocene regression is likely preserved by elevated beach ridges [13]. The regression in western Greenland transitioned into a local transgression and thus a rising sea level [6] due to isostatic subsidence caused by a glacial re-advance. The timing of the transition depends on the location in Greenland, with the lowest level in southern Greenland at 8 ka (kilo annum) to 6 ka BP [14]. During the following sea level rise, transgression rates in western Greenland were at a maximum between AD 1400 to AD 1500 [15], and potentially in southern Greenland [6] as well, where even faster rates of sea level rise could be expected. The Late Holocene sea level at the transition of the MCA and LIA, corresponding to the demise of the Norse colonies, was reconstructed in [6] in the nearby Igaliku Kujalleq. A sediment core taken 5 m from the present mean high-water coastline in a tidal flat showed beach sands and remains of vegetation at a depth of 80 cm, dated to AD 1451 beneath the present-day tidal flat deposits. Based on this core, a minimum sub-recent subsidence rate of 130 cm/ka is estimated [6]. Measurements of 137Cs and 210Pb in nearby lakes give recent sedimentation subsidence rates of 200 cm/ka [6,16]. Other studies calculate a mean Late Holocene subsidence rate of 300 cm/ka based on the 14C dating of marine shells deposited directly above desiccation horizons near Narsaq, approximately 30 km south-west of Igaliku [17]. Further documentation of the local, Late Holocene sea level change includes the remains of Norse settlements and graveyards that are partly or completely drowned today, which indicate a sea level rise exceeding 1 m since ~ AD 1430 [6,18].
While an increase in transgression rate occurred at the end of the Norse period, the long-term sea level change since the early settlement period of Garðar (circa 11th century) is estimated with the mean of the subsidence rates found in [16], [17] and [6] as well as the archaeological evidence provided by [18]. This equates to an increase of sea level of approximately 2 m since the early settlement period of Garðar.

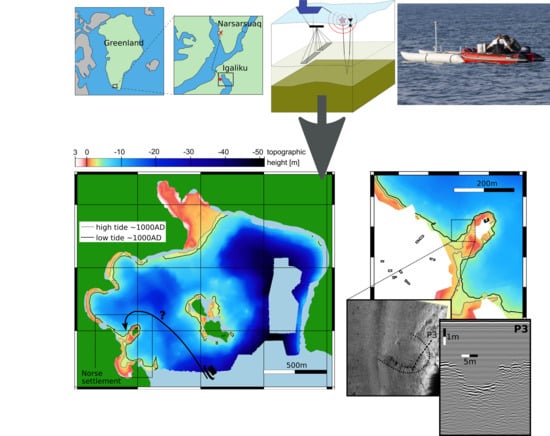
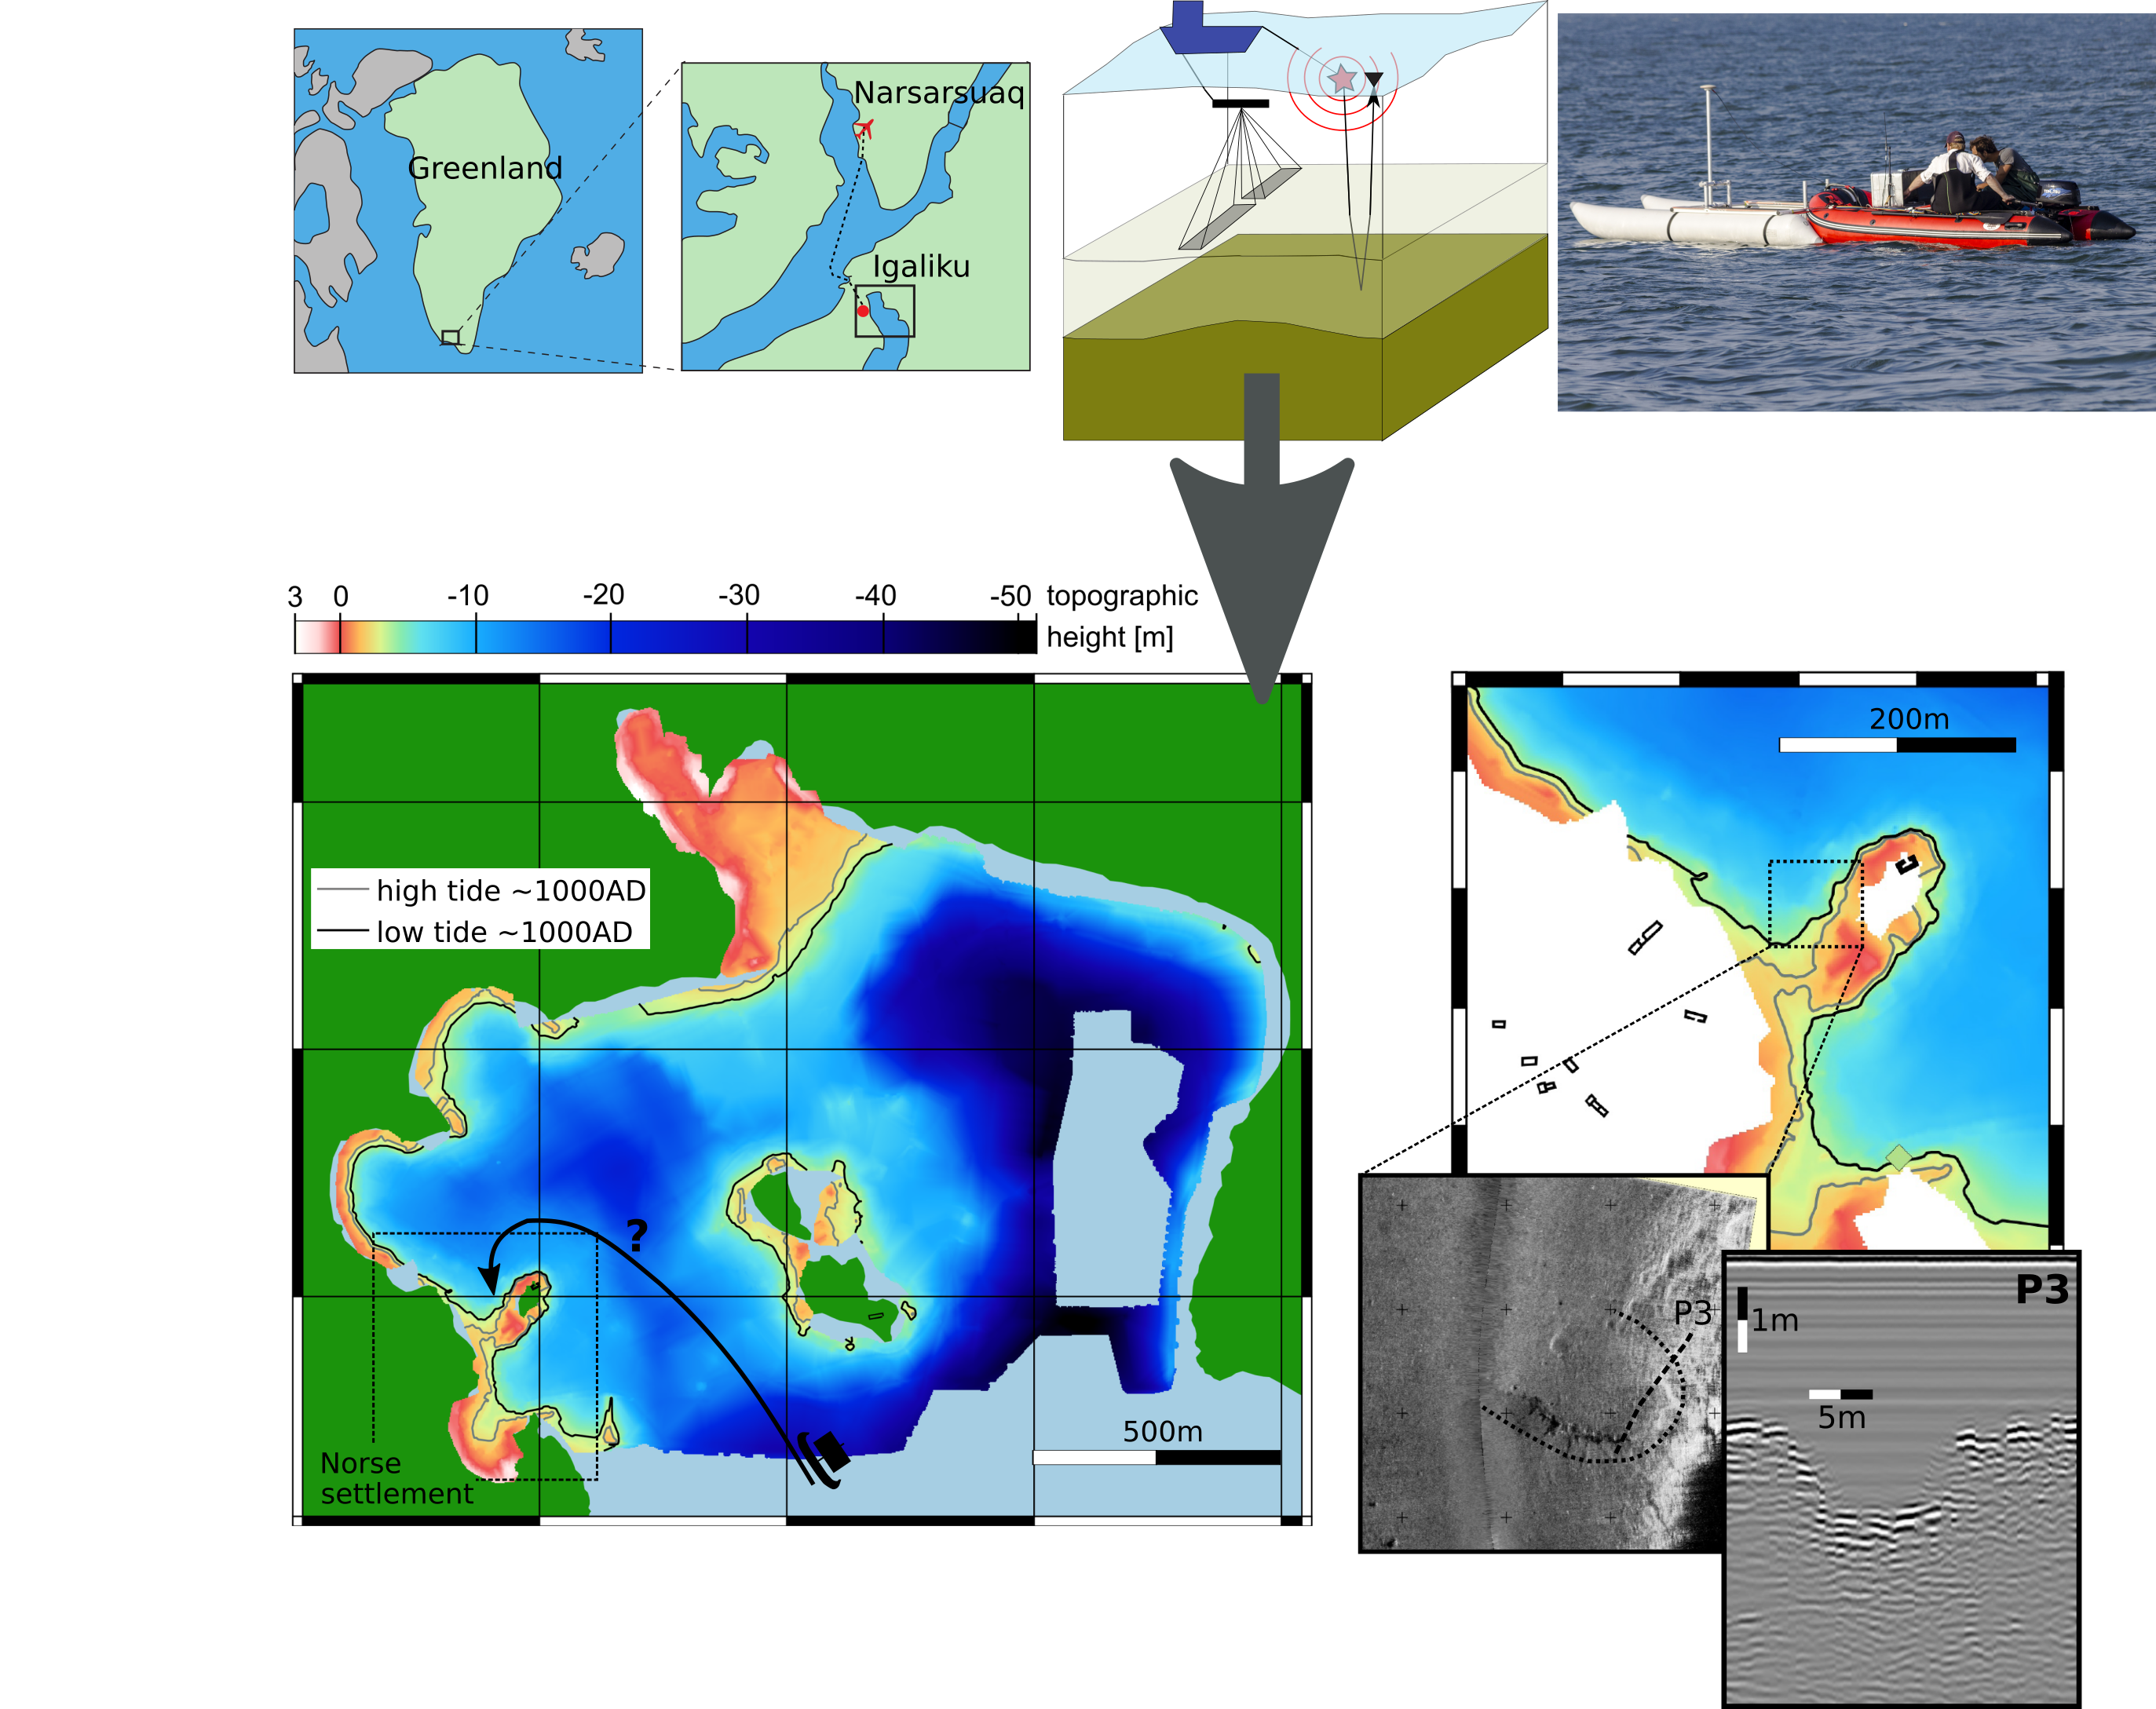
2. Materials and Methods

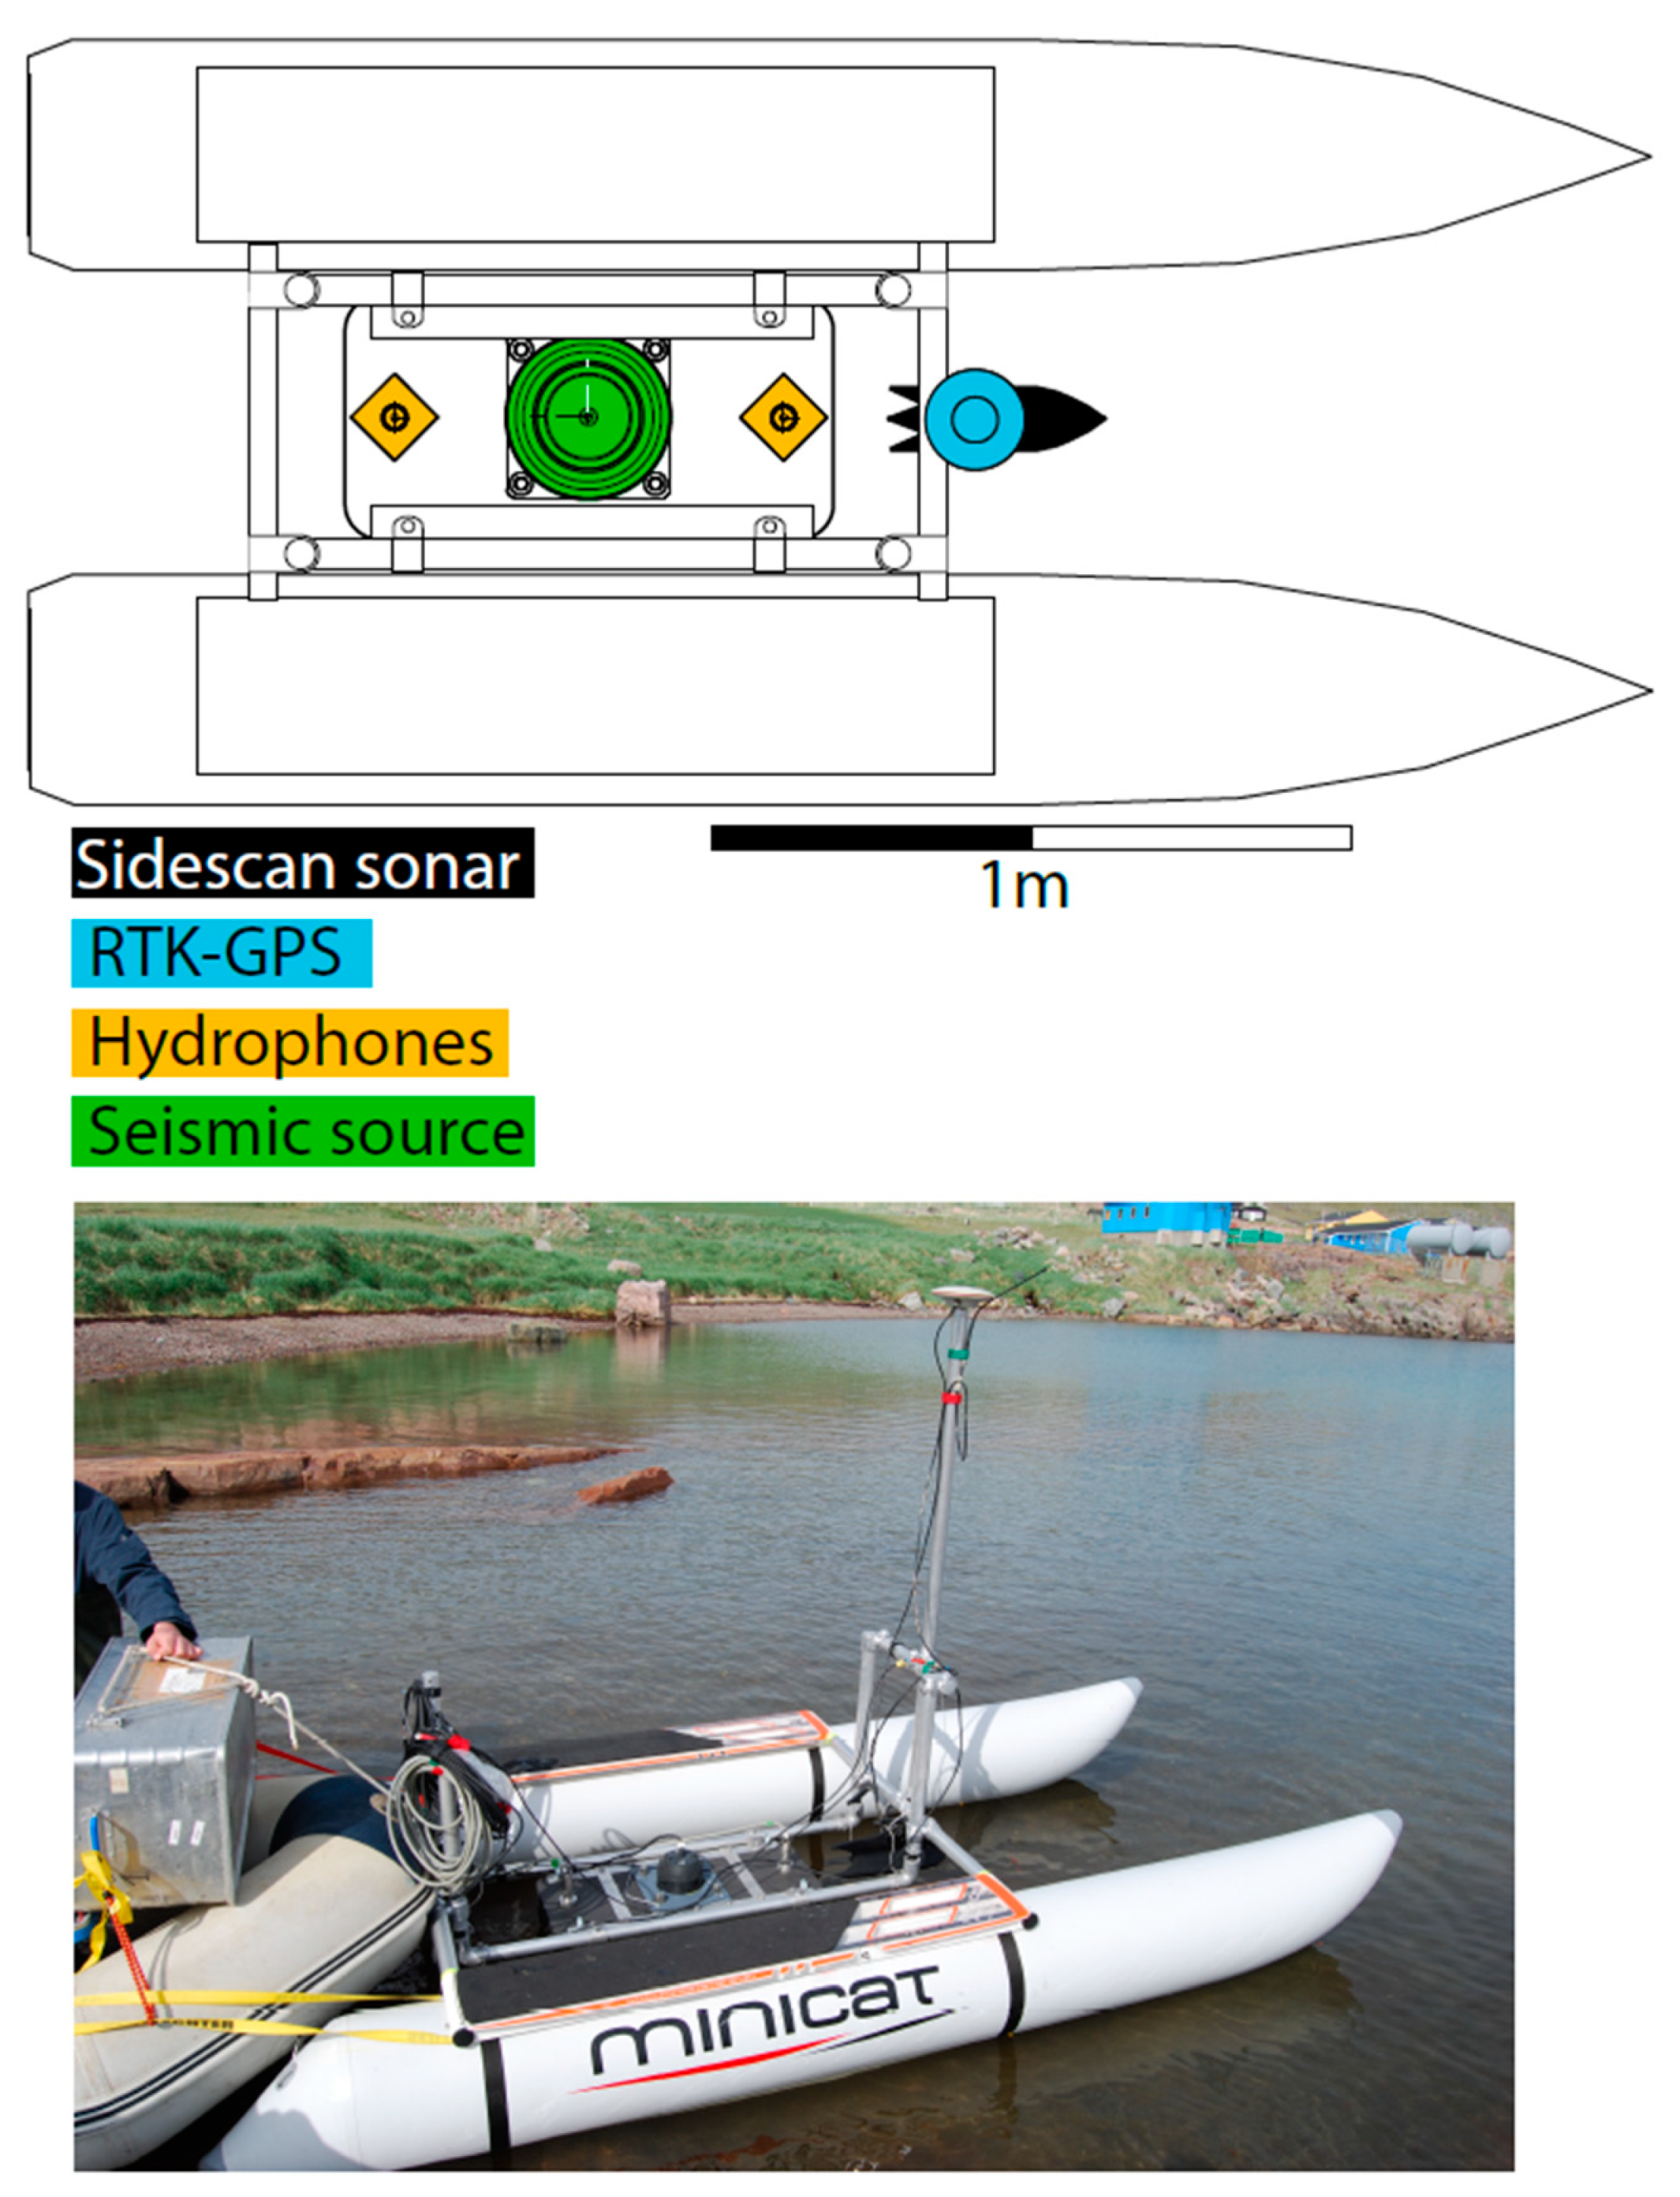
2.1. The Marine Acquisition System

Typical 3D seismic acquisition for archaeological prospection (e.g., [19,20] or [21]) or portable multibeam-systems to create bathymetric maps of high resolution were not feasible at the time of the survey due to the requirement of easily transporting equipment to the relatively inaccessible Igaliku in southern Greenland (both planes and small boats are required to access it; no conventional vehicular access is possible). We therefore used a combination of a small-sized side-scan sonar, a high-resolution two-channel seismic reflection/sediment echo sounder system, and (Real-Time-Kinematic) RTK-GPS positioning mounted on an inflatable catamaran (Figure 3). Comparable prospection setups were used in [22,23,24]. The whole system fits into two 80-litre boxes and a storage bag for the catamaran with a total weight of 120 kg. The side-scan sonar system that we used was a Starfish 450F with a nominal operating frequency of 450 kHz.
The seismic acquisition system consisted of a piezoelectric transducer (ELAC Nautik TL-444, 4 kHz resonance frequency) that acts as a seismic source and two hydrophones. The transducer is driven with a Fuchs–Müller wavelet with a 4 kHz centre frequency. After passing the transfer functions of the source and hydrophone transducer, the system creates a signal with a bandwidth from 2 kHz to 6 kHz and a peak frequency of 3.5 kHz. Taking 3.5 kHz as the final peak frequency and 1480 m/s as the wave velocity in water, the theoretical vertical resolution of one-quarter of the wavelength is about 0.1 m. For unmigrated data, the horizontal resolution is defined by the first Fresnel zone, which depends on the depth of the reflector and ranges from 0.45 m (0.5 m depth) to 3.5 m (30 m depth). However, as we were not aiming to image small-scale objects but to image the bathymetry and stratigraphy, the horizontal resolution is not as important as the vertical in this case. Nevertheless, the horizontal resolution along a profile (inline) was improved to the value of the vertical resolution by migrating the data. The horizontal data sampling depends on the signal repetition rate and travel speed of the boat, which led to an average spacing of about 0.16 m between data points along the boat track. The time data sampling frequency was set to 35.7 kHz with a record length of 57 ms. The positioning was performed by RTK-GPS with an about 5 cm nominal accuracy. The RTK-GPS also served to obtain elevation measurements by walking in the nearshore shallow areas of the fjord that were inaccessible by boat.
Data processing included the following steps:
  • Bandpass filtering using a Butterworth filter with a low cut at 2 kHz to 3 kHz and high cut from 6 kHz to 7 kHz;
  • Deconvolution using a fixed filter operator, derived from the Wiener predictive error deconvolution of the complete direct wave signal in deeper water, which is convolved with the full seismic trace;
  • Trace normalization by the first quantile of each trace;
  • Migration of the data using a post-stack Fresnel-volume migration approach after [25] using a water velocity of 1480 m/s;
  • Geometrical spreading correction using a linear time-gain function;
  • Skeletonising of traces by leaving only the local amplitude maxima, giving each sample as the maximum in a window of 7 samples.
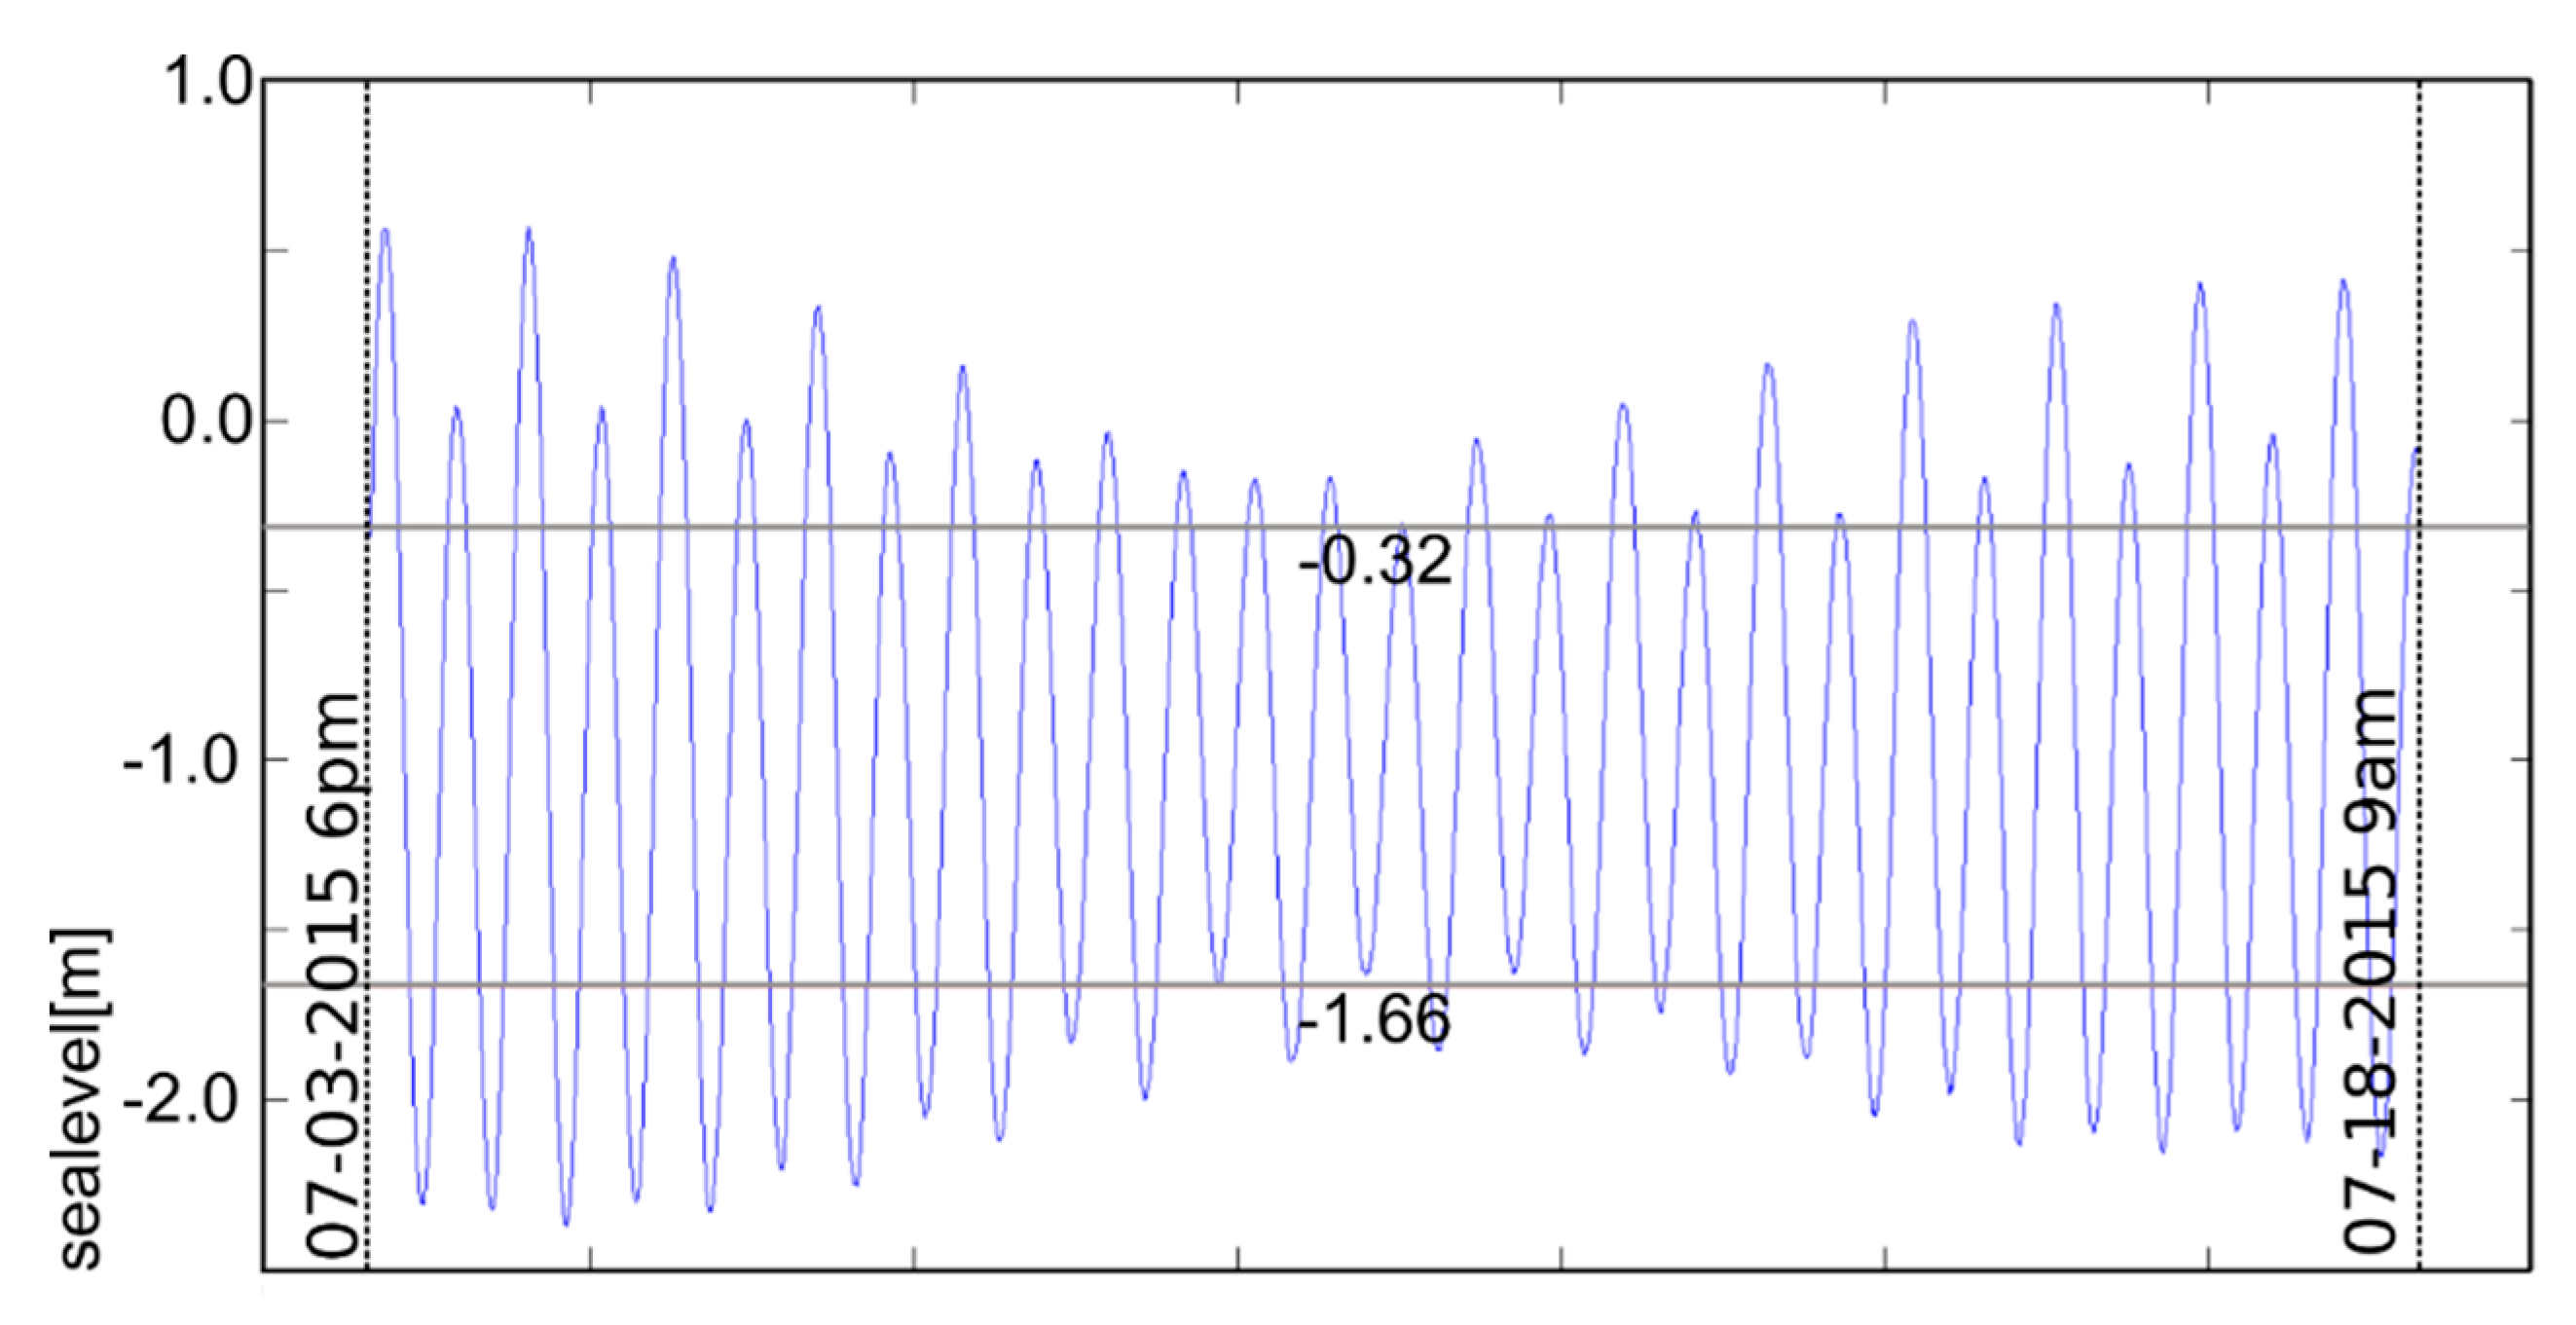
A threshold criterion was then used to pick the travel times of these maximum amplitudes at the seafloor. Furthermore, the picks of each 5 neighbouring traces were compared and checked for outliers. If an outlier was detected (with a variation of more than 1 ms), the local maximum with the lowest travel time difference to the neighbouring traces was chosen, even if it exceeded the threshold criterion. In this way, it was guaranteed that the same phase of the seafloor reflection would be picked in each trace. Depth was calculated from seafloor travel times of 1480 m/s. To correct the derived depth data to absolute height, we used the RTK-GPS-heights based on the following scheme: height values were smoothed with a moving average window of 8 min to obtain the long-wavelength tide variations for each day of measurements, Ztide(t). Then, the absolute heights, ZA, were calculated by ZA = −Zi(t) − Zp + Ztide, with Zi(t) being the pick-depth derived from seismics and Zp being the depth of the seismic source below the GPS antenna.
The depth (seafloor absolute elevation) information derived from this procedure were then interpolated in a three-step scheme. The first step was a 2D inverse distance weighting interpolation with an exponent of 1 and a radius of 4 m. In this way, all gaps of less than 4 m diameter were interpolated. The result of this interpolation was again interpolated with 2D inverse distance weighting, this time with a radius of 20 m, filling in the larger bathymetry gaps. In a final step, this result was interpolated linearly on a 2 m grid.

2.2. Tide Gauge

A tide gauge was installed at the modern pier of Igaliku to record the sea-level heights during the campaign. A sea-level height was measured every 10 min for 15 days (the duration of the field campaign). This tide gauge was composed of a data logger and a pressure transducer. Data from even a relatively short time period can significantly constrain tide levels to an acceptable accuracy [26]. The data logger fortuitously recorded both spring and neap tides, thus allowing the full tidal range in the fjord head to be observed (Figure 4).

2.3. Side-Scan Sonar Data Processing

Side scan sonar systems utilise the dependence of acoustic scatter strength on sea floor composition and morphology [27], allowing the creation of acoustic images of the sea floor that are of widespread use in archaeology and geosciences [28]. The data were not recorded with the aim of creating a mosaic but with the aim of crossing ‘interesting’ spots several times and inspecting each file individually. The radiometric and geometric correction of the side-scan sonar raw data followed a standard pattern [29]. This included a correction against the beam angle pattern and the application of an empirical gain normalization to remove angular effects on backscatter strength. Geometric corrections included a manual bottom-tracking and a slant range correction to reduce distortion in the across-track direction. The side-scan sonar image shown here was gridded to a resolution of 1 m (overview image) to 0.25 m (detailed view). High backscatter intensities are displayed in brighter colours in this study, while low backscatter intensities appear in darker colours.

3. Results

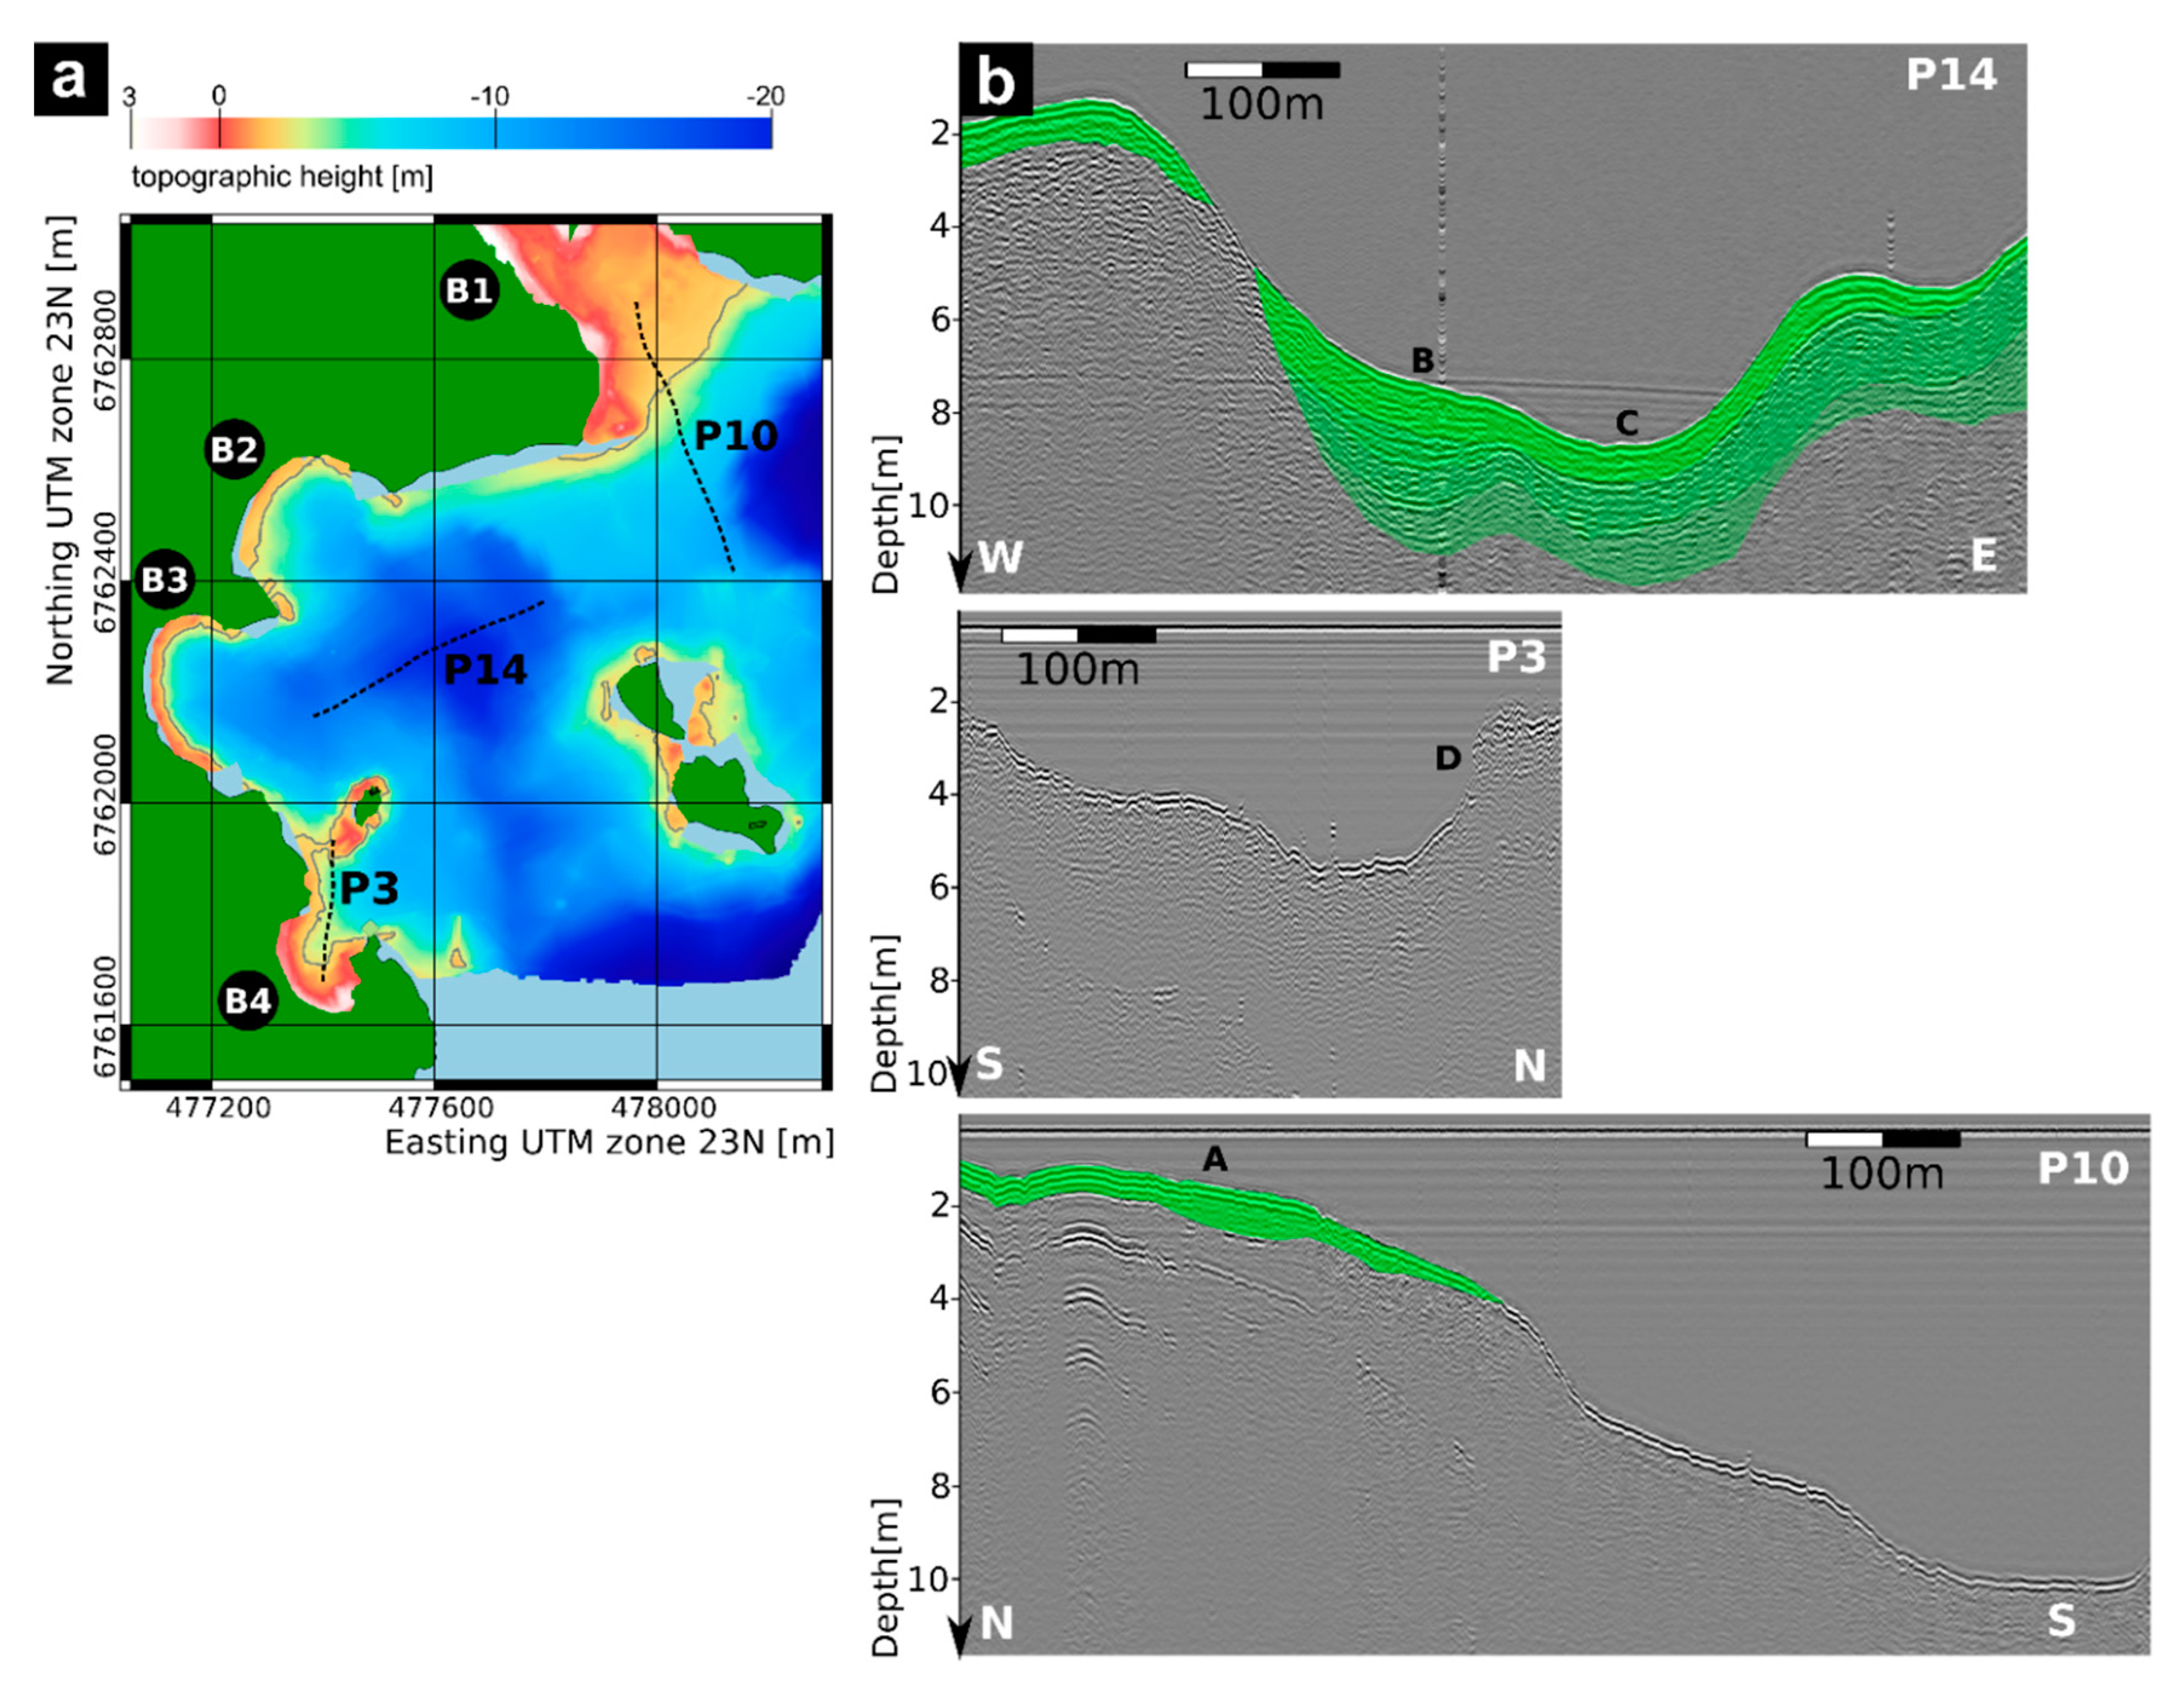
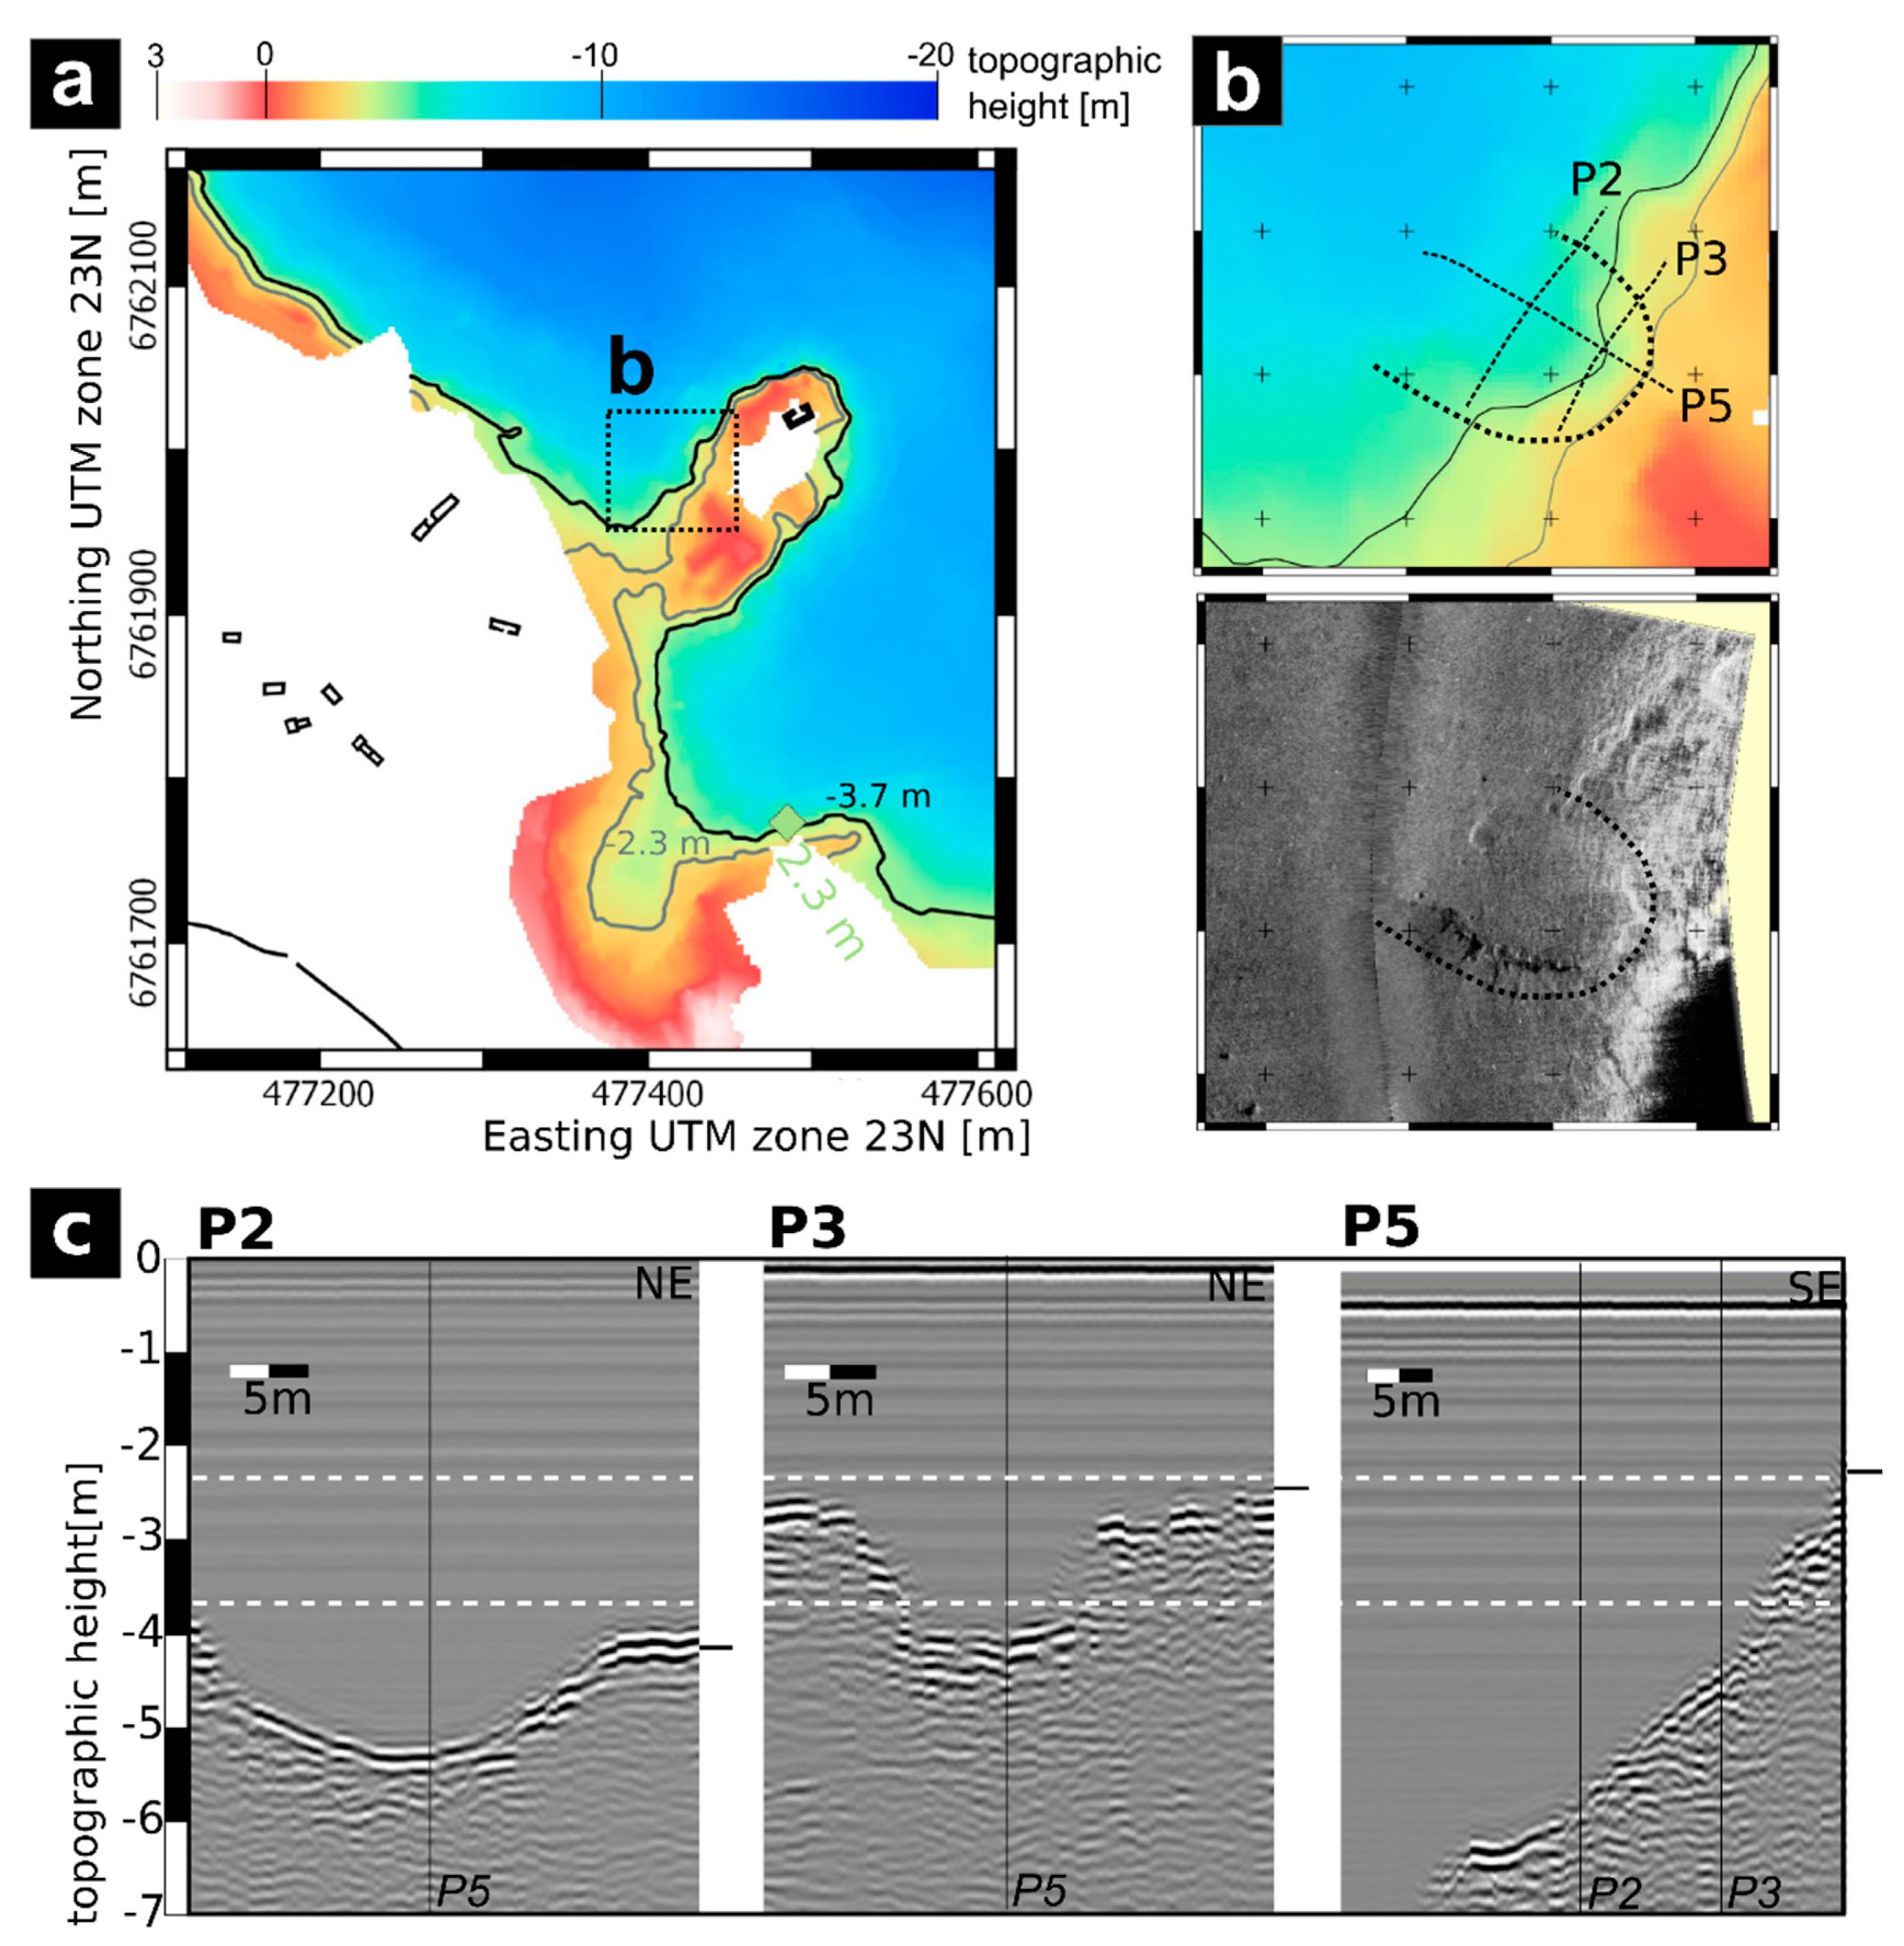
3.1. Bathymetric Map

The bathymetric map derived from the reflection seismic survey shows the presence of two basins in the inner Igaliku fjord. Water depths reach to approximately 40 m in the north-eastern basin and to approximately 20 m in the north-western basin (Figure 5). The sill between the two basins of the inner ford reaches maximum water depths of 10 m below sea level (bsl). The two central islands in the fjord, with remains of stone buildings from the Norse period, are part of the sill. Slope angles vary between 3° and 7° in the north-west and 10° to 15° in the north-east. Exceptions to the steep drop-off are observed in the four embayments of the survey area (Figure 5a) that cover 14 ha in the 0–2 m depth interval.

3.2. Seismics

Seismic lines provide information on the sedimentary environments of the deeper basins and near coastal areas. Inside the deeper basins (>12 m water depth), the observed thickness of the sedimentary cover above the acoustic basement increases to approximately 3 m at its maximum depth in different sediment facies (green areas of different intensities in Figure 6b). The acoustic basement corresponds to the presence of a rock surface. Outcrops of the rock surface can be visually observed, e.g., on the two islands. Sedimentary deposits are characterized by the presence of continuous reflectors in the seismic images. Within the sediment cover in the basins, the presence of erosional unconformities (marked with B and C in Figure 6, profile P14) approximately 1 m below the seafloor point towards a hiatus in sedimentation. In shallow waters close to the coastline, the rocky basement frequently crops out at the seafloor, corresponding to high backscatter intensities in the side-scan sonar images (Figure 6, profile P3, marked with D). Within the large embayment B1, seismic data show the presence of a thin sedimentary layer, up to a thickness of 0.5 m at maximum, that is indicated by the presence of multiple seafloor reflections (marked with A in Figure 6, profile P10). No sedimentary deposits can be observed in the smaller embayments B2–B4 (Figure 6, P3).

3.3. Side Scan Sonar

A complete side-scan sonar mosaic of the inner Igaliku fjord head was acquired, including a detailed survey around the fjord head’s islands (Figure 5b). No artefacts, ship remains or ballast could be identified in the survey area. However, the side-scan sonar data shows a shadow zone indicative of a steep slope within the bedrock of the seabed west of the small island near the modern settlement (Figure 7). Based on the geometry of the acoustic shadow in the side-scan sonar profiles parallel to the feature and crossings of seismic data, the height of the slope is about 1 m. The feature length is 22 m, and it is situated in a water depth of 2.5 m (at modern high tide). The depth difference between the landward and the seaward side is up to 2 m. The distance to the present shoreline is ~15 m, and the landward boundary of the feature corresponds to the estimated low-tide water level at around AD 1000. A side ^-scan sonar line perpendicular to the feature shows that the eastern crestline of the feature follows an E–W directed straight line for approximately 15 m (Figure 7b), while the remaining 5 m towards the west are slightly curved towards the north-west. A number of high-backscatter targets approximately 0.5 m to 0.8 m in size are observed directly at the base of the slope and are interpreted as stones and boulders. The archaeological interpretation of this feature will be discussed below.

4. Discussion

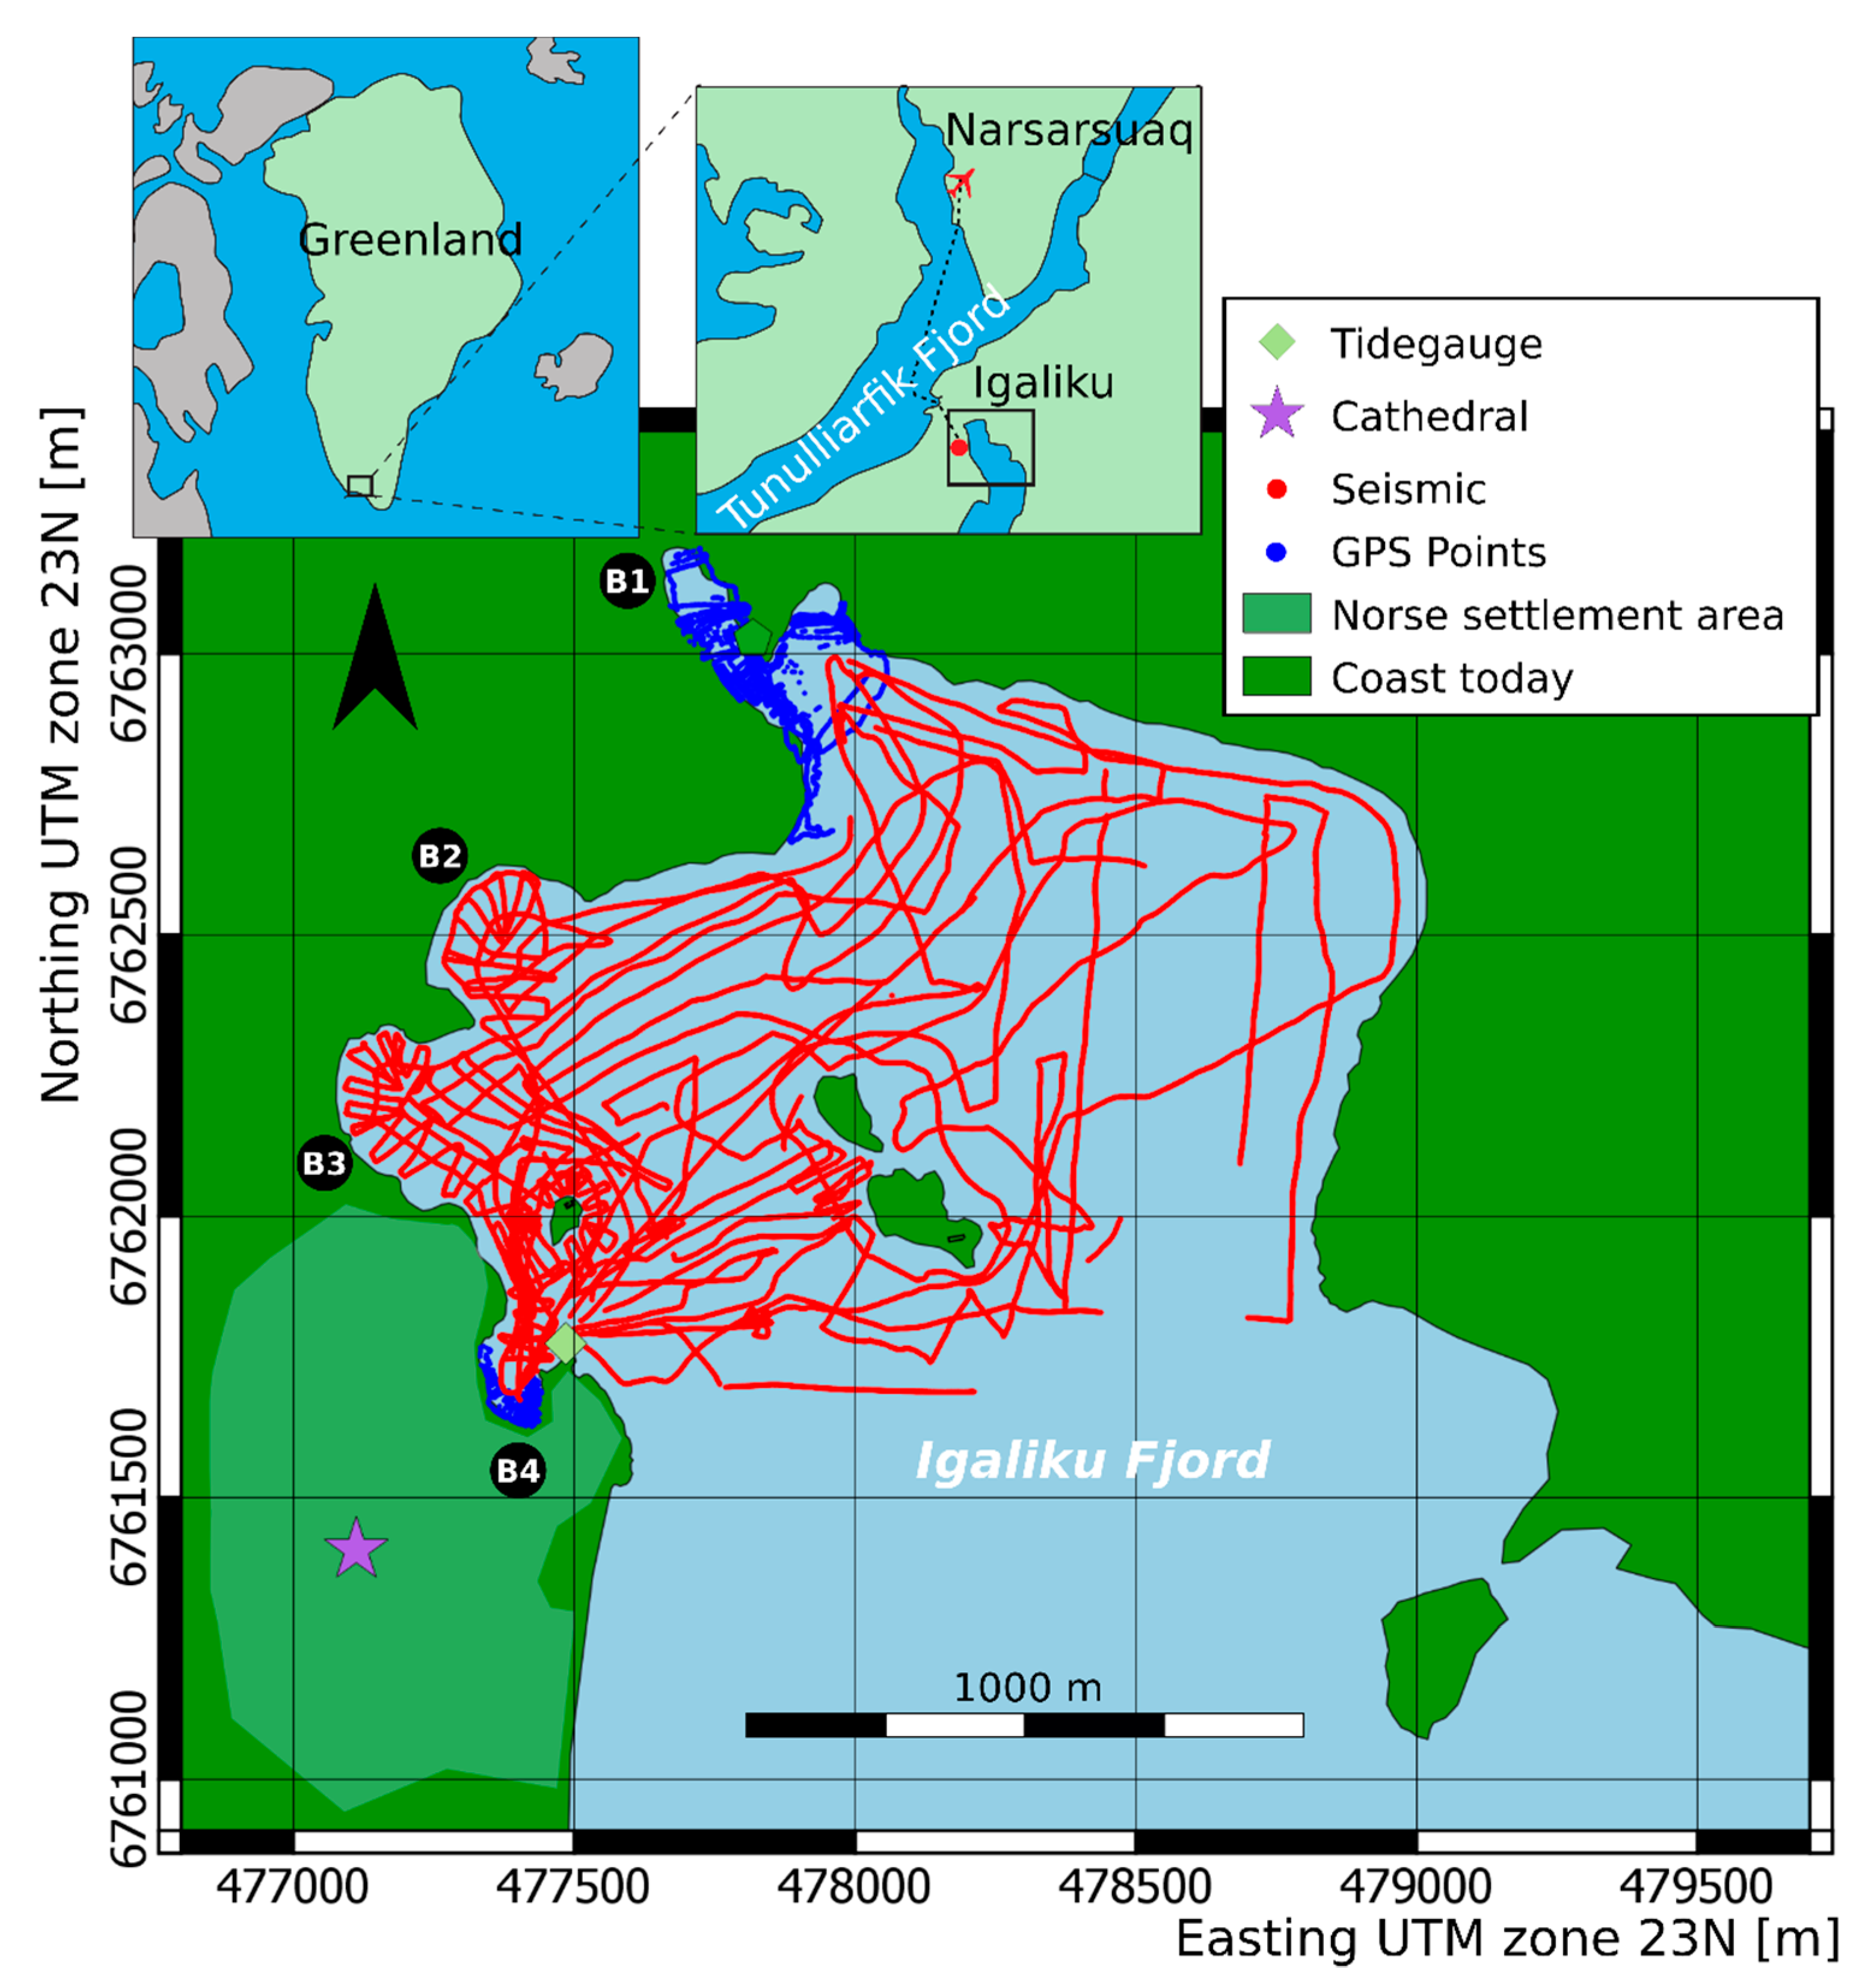
4.1. Implications of the Local Bathymetry and Sea Level Rise on the Norse Settlement Area

The demise of the Norse settlements in Greenland has been a constant topic of debate since Hans Egede’s rediscovery of the abandoned colony in 1721. The apparent collapse of Norse Greenland in the early 15th century coincides with the transition between the Medieval Warm period (MCA) and the Little Ice Age (LIA). It is generally assumed that a complex interplay of changing environmental conditions, poor adaptation of the subsistence system and social structure of the Norse society in Greenland as well as long-term and large-scale historical developments outside Greenland all contributed to the decline of the Norse colony (e.g., [4,30,31,32]). Based on their reconstruction of the Late Holocene sea level curve in Igaliku fjord, in [6], the authors suggested that the gradual loss of fertile grassland due to relative sea level change may have played an important role in this process of collapse.
Based on our bathymetry model of Igaliku fjord (Figure 5), the loss of homefield area due to a relative sea level rise of approximately 1 m (assumed for the period between 1000 AD and 1450 AD) amounted to about 6 ha. It is dominated by a loss of land in embayment B1, at the northern end of the fjord. The latter is fed by a stream, which drains a small mountain lake on the hillside north of the fjord. The western embayment B4 now constitutes the modern harbour of Igaliku. The different sedimentary settings of the two embayments are apparent in the seismic data, with a higher sedimentary thickness in embayment B1. The interpretation of the seismic data is supported by the effects of the rising sea level that are preserved in the sediment core retrieved from the tidal flat in Igaliku Kujalleq [6]. Here, tidal deposits overlay a drowned beach at a depth of 80 cm. Given that the sea level rise between AD 1451 and today was at least 1 m in Igaliku Kujalleq, the core suggests that this area of the embayment was available to the Norse for use when they first settled in the area during the 11th century and was subsequently drowned in the course of the Norse settlement period. However, the stream that runs into the embayment B1 probably did not cause any considerable sedimentation and subsequent loss of fertile land [33]. In any case, the loss of land in Igaliku due to relative sea level rise seems to have been rather limited. This may be different to the situation in the neighbouring Tunulliarfik fjord, where a massive loss of land has been proposed, as a result of which it became increasingly difficult to obtain enough hay for the animals [6].
In his Farmpact model, Thomas McGovern [34] estimates an average annual yield of 1200 kg/ha for rich infields, especially if they were improved by manuring or irrigation, as has been suggested for Garðar [35,36]: 300 kg/ha for average outfields and 200 kg/ha for poor outfields. He also assumes an annual fodder demand of 4400 kg for cattle. Applying these values, between 3.7 (good infield) and 22 ha (poor outfield) would have been required to feed one cow. Thus, the total area that was gradually submerged during the Norse period at the head of Igaliku fjord would not even have supported two cows. It seems unlikely that this had a major impact on the episcopal farm at Garðar. The byres of the episcopal farm were the largest in Greenland and may have hosted around 100 cattle [10] (p. 53). Indeed, it is questionable whether a sufficient amount of hay could be produced in the vicinity of Garðar to support such a large number of animals at all, suggesting either that at least part of the fodder was produced elsewhere, or that the suggested amount of cattle is incorrect. While the local loss of land in Garðar may not have been of much concern in itself, the gradual flooding of fertile coastal strips may still have been a problem on a regional scale.

4.2. Harbour Infrastructure and Function

Garðar was the most important harbour in Greenland during the Norse period besides Sandhavn near Herjolfsnes, Southern Greenland [37]. The settlement at Garðar was of high social status, especially after it had become the see of the bishops of Greenland in the early 12th century [10] (pp. 42–43). Annals, letters and sagas report of regular ship traffic between Greenland, Iceland and Norway. Norwegian merchants visited to trade, bishops arrived and departed, the payment of the episcopal tithe in commodities to the archbishop in Trondheim was shipped from here, and even a voyage to Vinland set out from here ([38] (p. 403); [39] (pp. 276–278); [40]; [41] (p. 17); [42]).
The Norse harbour was located on the shoreline just north-east of the modern (and Norse) settlement. The embayment with the modern marina (B4 in Figure 1) is now a relatively protected harbour, but during the Norse period, the inlet was a much smaller embayment and hence provided less shelter (see Figure 7). The reconstruction of the shoreline of the early settlement period (Figure 7) clearly shows that the small island near the modern harbour played a central role in the former Norse harbour area. What today appears to be an island was not an island at the beginning of the Norse settlement around a thousand years ago, but rather a peninsula, protruding eastwards from the coast into the head of the fjord. Our data show the outline of the peninsula at low tide and high tide during the early years of the settlement. They also show that, during the course of the Norse settlement of Igaliku, from around 1000 AD to approximately 1450 AD, the peninsula gradually became an island as the sea level rose approximately 1 m in this period. The island features the remains of a solid building made of stone, measuring approximately 16 m × 10 m, with an entrance in the northern wall. The most likely explanation of the function of this building is that of a warehouse or storage to store equipment and goods needed for ship traffic ([10] (p. 54); [43]). The northern edge of the island is steep and clearly suited to allow the mooring of ships (Figure 7c, seismic line P5). The location of the stone building is an ideal spot to fasten a ship, to load and unload goods and people, and to store equipment in the building. Both during low tide and high tide, it would have been possible to walk over the peninsula to the settlement, at least in the early period of the settlement at Garðar.
Near the steep slope, side-scan sonar and seismic data show a groove in the seabed adjacent to and below the northern shore (Figure 7c, seismic line P3) with a depth of approximately 1 m. The length of the groove is 22 m, and it is situated in a water depth of 2 m to 3 m (at Norse high tide). The groove lies within a concave bank on the northern edge of the peninsula, perpendicular to the shore line. A previous harbour survey included a dive in the waters around this island, undertaken by Endre Elvestad as part of the HaNoA project. However, this dive was inconclusive in determining whether this groove is anthropogenic or natural. Nevertheless, in the sidescan sonar image, no slump deposits from the groove are visible adjacent to the groove. Its right-angled position in relation to the island and distinct edges could indicate that the groove once held or supported a substruction for a possible landing bridge, likely made of wood, which would have protruded away from the island to allow the landing of ships along its sides. Although such substructions are not yet known from any Norse settlement and harbour in the North Atlantic, such wooden landing bridges are known to have existed in larger Viking or medieval settlements in Scandinavia, especially from episcopal settlements. The bishop’s quarter in Oslo, for example, was accessible from the sea through landing bridges, varying in length between 6 and 10 m [44]. The most common construction method for such substructions was to build a series of stringed rectangular wooden frames or boxes which were then filled with rocks or garbage. The upper part of such substructions was above water level and covered with wooden planks, creating a platform and walking level. The width of the framework construction could range from 3 to 4.5 m as in Bergen [45] (p. 73) or 4.7 m as in Agdenes near Trondheim [46] (p. 62). With a width of c. 5.5 m, the groove could have held a wooden frame construction of similar size.

5. Conclusions

The morphology of the northern end of the Igaliku fjord has altered considerably over the past 1000 years. The rise in sea level of approximately 2 m since the beginning of the Norse settlement of Greenland has resulted in a changed coastline, including the transformation of a peninsula into an island. The sea level changes, however, also affected the surroundings of a possible Norse harbour. We suggest that during the Norse settlement period from around 1000 AD to approximately 1450 AD, the small island just east of the mainland, formerly a peninsula, played a central role in the harbour. It had a stone building at its eastern end to allow the storage of shipping equipment and goods, and it provided a mooring place for ships and boats and a walkway to the settlement area. As the sea level rose, this peninsula began to be inundated at high tide, and the use of it as part of harbour operations would have become less viable. The loss of fertile land due to sea level rise until the end of the Norse settlement was limited to about 6 ha. This loss was insignificant compared to the assumed available fertile land of more than 350 ha in the Igaliku fjord. Future work at the site could include the usage of high-resolution light-weight multibeam systems, which would improve the resolution of the bathymetric data and thus the details of the reconstructed coastline but would not affect the general conclusions of this study. Nevertheless, detailed coring data at the Igaliku fjord would improve the temporal resolution and interpretation of the Norse-period sea-level reconstruction.

Author Contributions

Conceptualization, D.W., T.W. and P.F.; methodology, D.W., T.W., P.F.; software, D.W., T.W.; investigation, D.W., T.W., P.F., J.P., N.M.; resources, N.M., J.C.; writing—original draft preparation, D.W., T.W., P.F., J.C., J.P., N.M.; writing—D.W., T.W., P.F., N.M., J.C., J.P.; visualization, D.W., T.W., P.F.; project administration, T.W., N.M.; funding acquisition, N.M., T.W.

Funding

This research received funding from the German Research Foundation (DFG) in two projects (RA 496/26-2 and CA 146/17-1) which are part of the Priority Program 1630 “Harbours from the Roman Period to the Middle Ages” (von Carnap-Bornheim & Kalmring 2011).

Acknowledgments

We would also like to thank Christian Koch Madsen, Nuuk museum; Jette Arneborg, Danish National museum; Endre Elvestad, Stavanger Maritime museum; and Mark Gardiner, Lincoln University for their kind help and discussion. We would like to thank Clemens Mohr and Detlef Schulte-Kortnack for their technical support. Finally, our thanks go to the town of Igaliku and the team of the Igaliku Country Hotel for their great support.

Conflicts of Interest

The authors declare no conflict of interest. The funders had no role in the design of the study; in the collection, analyses, or interpretation of data; in the writing of the manuscript, or in the decision to publish the results.

References

  1. Frei, K.M.; Coutu, A.N.; Smiarowski, K.; Harrison, R.; Madsen, C.K.; Arneborg, J.; Frei, R.; Guðmundsson, G.; Sindbæk, S.; Woollett, J.; et al. Was it for walrus? Viking Age settlement and medieval walrus ivory trade in Iceland and Greenland. World Archaeol. 2015, 47, 439–466. [Google Scholar] [CrossRef]
  2. Þorláksson, H.; Gunnarsson, G.; Agnarsdóttir, A.; Bjarnarson, H.; Kjartanson, H.S. Líftaug Landsins–Saga Íslenskrar Utanlandsverslunar; Forlagið bókabuð: Reykjavík, Iceland, 2017; pp. 900–2010. [Google Scholar]
  3. Mehler, N.; Gardiner, M.; Dugmore, A.; Coolen, J. The elusive Norse harbours of the North Atlantic: Why they were abandoned, and why they are so hard to find. In Häfen im 1. Millennium AD. Bauliche Konzepte, Herrschaftliche Und Religiöse Einflüsse. RGZM Tagungen 22 (Interdisziplinäre Forschungen Zu den Häfen von Der Römischen Kaiserzeit Bis Zum Mittelalter in Europa 1); Schmidts, T.H., Vučetić, M., Eds.; Verlag des Römisch-Germanischen Zentralmuseums: Mainz, Germany, 2015; pp. 313–321. [Google Scholar]
  4. Arneborg, J. Norse Greenland—research into abandonment, in Medieval Archaeology in Scandinavia and Beyond. In History, Trends and Tomorrow, Proceedings of Conference to Celebrate 40 Years of Medieval Archaeology at Aarhus University; Kristiansen, M.S., Roesdahl, E., Eds.; Aarhus University Press: Aarhus, Denmark, 2015; pp. 257–273. [Google Scholar]
  5. Dugmore, A.; Keller, C.; McGovern, T.H. Norse Greenland Settlement: Reflections on Climate Change, Trade, and the Contrasting Fates of Human Settlements in the North Atlantic Islands. Arct. Anthropol. 2007, 44, 12–36. [Google Scholar] [CrossRef]
  6. Mikkelsen, N.; Kuijpers, A. The Norse in Greenland and late Holocene sea-level change. Polar Rec. 2008, 44, 45–50. [Google Scholar] [CrossRef] [Green Version]
  7. Westerdahl, C. Die Maritime Kulturlandschaft. Schiffe, Schiffahrtswege, Häfen-Überlegungen zu einem Forschungsansatz. In Deutsches Schiffahrtsarchiv; Ernst Kabel Verlag: Hamburg, Germany, 1986; Volume 9, pp. 7–58. [Google Scholar]
  8. Westerdahl, C. The maritime cultural landscape. In The Oxford Handbook of Maritime Archaeology; Ford, B., Catsambis, A., Eds.; Oxford University Press: Oxford, UK, 2011; pp. 733–762. [Google Scholar]
  9. von Carnap-Bornheim, C.; Kalmring, S. DFG-Schwerpunktprogramm 1630 “Häfen von der Römischen Kaiserzeit bis zum Mittelalter. Zur Archäologie und Geschichte regionaler und überregionaler Verkehrssysteme”. In Jahresbericht Zentrum für Baltische und Skandinavische Archäologie; Eriksen, B.V., Sonnenschein, I., Eds.; Stiftung Schleswig-Holsteinische Landesmuseen Schloss Gottorf: Schleswig, Germany, 2011; pp. 28–31. [Google Scholar]
  10. Arneborg, J. Saga Trails; National Museum of Denmark: Copenhagen, Denmark, 2006. [Google Scholar]
  11. Funder, S.; Hansen, L. The Greenland ice sheet—A model for its culmination and decay during and after the last glacial maximum. Bull. Geol. Soc. Den. 1996, 42, 137–152. [Google Scholar]
  12. Rasch, M.; Nielsen, N. Coastal morpho-stratigraphy and Holocene relative sea level changes at Tuapaat, southeastern Disko Island, central West Greenland. Polar Res. 1995, 14, 277–290. [Google Scholar] [CrossRef]
  13. Nielsen, L.; Bendixen, M.; Kroon, A.; Hede, M.U.; Clemmensen, L.B.; Weβling, R.; Elberling, B. Sea-level proxies in Holocene raised beach ridge deposits (Greenland) revealed by ground-penetrating radar. Sci. Rep. 2017, 7, 46460. [Google Scholar] [CrossRef] [Green Version]
  14. Weidick, A. Neoglacial change of ice cover and the related response of the Earth’s crust in West Greenland. Rapp. Grønlands Geol. Undersøgelse 1993, 159, 121–126. [Google Scholar]
  15. Rasch, M.; Jensen, J.F. Ancient Eskimo dwelling sites and Holocene relative sea-level changes in southern Disko Bugt, central West Greenland. Polar Res. 1997, 16, 101–115. [Google Scholar] [CrossRef]
  16. Sandgren, P.; Fredskild, B. Magnetic measurements recording Late Holocene man-induced erosion in S. Greenland. Boreas 1991, 20, 315–331. [Google Scholar] [CrossRef]
  17. Kuijpers, A.; Abrahamsen, N.; Hoffmann, G.; Hühnerbach, V.; Konradi, P.; Kunzendorf, H.; Mikkelsen, N.; Thiede, J.; Weinrebe, W.; Rv Poseidon, S.S.P. Climate change and the Viking-age fjord environment of the Eastern Settlement, South Greenland. Geol. Greenl. Surv. Bull. 1999, 183, 61–67. [Google Scholar]
  18. Arneborg, J.; Heinemeier, J.; Lynnerup, N.; Nielsen, H.L.; Rud, N.; Sveinbjörnsdóttir, Á. C-14 dating and the disappearance of Norsemen from Greenland. Europhys. News 2002, 33, 77–80. [Google Scholar] [CrossRef]
  19. Wilken, D.; Wunderlich, T.; Hollmann, H.; Schwardt, M.; Rabbel, W.; Mohr, C.; Schulte-Kortnack, D.; Nakoinz, O.; Enzmann, J.; Jürgens, F.; et al. Imaging a medieval shipwreck with the new PingPong 3D marine reflection seismic system. Archaeol. Prospect. 2019. [Google Scholar] [CrossRef]
  20. Mueller, C.; Woelz, S.; Kalmring, S. High-Resolution 3D Marine Seismic Investigation of HedebyHarbour, Germany. Naut. Archaeol. 2013, 42, 326–336. [Google Scholar] [CrossRef]
  21. Plets, R.M.K.; Dix, J.K.; Adams, J.R.; Bull, J.M.; Henstock, T.J.; Gutowski, M.; Best, A.I. The use of a high-resolution 3D Chirp sub-bottom profiler for the reconstruction of the shallow water archaeological site of the Grace Dieu (1439), River Hamble, UK. J. Archaeol. Sci. 2009, 36, 408–418. [Google Scholar] [CrossRef]
  22. Westley, K.; Mcneary, R. Archaeological Applications of Low-Cost Integrated Sidescan Sonar/Single-Beam Echosounder Systems in Irish Inland Waterways. J. Archaeol. Prospect. 2017, 24, 37–57. [Google Scholar] [CrossRef]
  23. Quinn, R.; Breen, C.; Forsythe, W. Integrated Geophysical Surveys of the French Frigate La Surveillante (1797), Bantry Bay, Co. Cork, Ireland. J. Archaeol. Sci. 2002, 29, 413–422. [Google Scholar] [CrossRef]
  24. Grøn, O.; Boldreel, L.O. Sub-bottom profiling for large-scale maritime archaeological survey. In Proceedings of the 2013 MTS/IEEE OCEANS, Bergen, Norway, 10–14 June 2013. [Google Scholar]
  25. Buske, S.; Gutjahr, S.; Sick, C. Fresnel volume migration of single-component seismic data. Geophysics 2009, 74, WCA47–WCA55. [Google Scholar] [CrossRef]
  26. Sparrenbom, C.J.; Bennike, O.; Björck, S.; Lambeck, K. Holocene relative sea-level changes in the Qaqortoq area, southern Greenland. Boreas 2006, 35, 171–187. [Google Scholar] [CrossRef]
  27. Blondel, P. The Handbook of Sidescan Sonar; Springer: Berlin/Heidelberg, Germany, 2009; p. 319. [Google Scholar]
  28. Quinn, R.; Dean, M.; Lawrence, M.; Liscoe, S.; Boland, D. Backscatter responses and resolution considerations in archaeological side-scan sonar surveys: A control experiment. J. Archaeol. Sci. 2005, 32, 1252–1264. [Google Scholar] [CrossRef]
  29. Wilken, D.; Feldens, P.; Wunderlich, T.; Heinrich, C. Application of 2D Fourier filtering for elimination of stripe noise in side-scan sonar mosaics. Geo-Mar. Lett. 2012, 32, 337–347. [Google Scholar] [CrossRef]
  30. McGovern, T.H. Cows, Harp Seals, and Churchbells: Adaptation and Extinction in Norse Greenland. Hum. Ecol. 1980, 8, 245–275. [Google Scholar] [CrossRef]
  31. Berglund, J. The Decline of the Norse Settlements in Greenland. Arct. Anthropol. 1986, 23, 109–135. [Google Scholar]
  32. Dugmore, A.J.; McGovern, T.H.; Vésteinsson, O.; Arneborg, J.; Streeter, R.; Keller, C. Cultural adaptation, compounding vulnerabilities and conjunctures in Norse Greenland. Proc. Natl. Acad. Sci. USA 2012, 109, 3658–3663. [Google Scholar] [CrossRef] [Green Version]
  33. Milliman, J.D.; Syvitski, J.P.M. Geomorphic/Tectonic Control of Sediment Discharge to the Ocean: The Importance of Small Mountaineous Rivers. J. Geol. 1991, 100, 525–544. [Google Scholar] [CrossRef]
  34. McGovern, T.H. Farmpact 06, Computer Program in Excel. Available from Hunter Bioarchaeology Lab 695 Park Ave. NYC. 2012. Available online: http://www.nabohome.org/products/models/farmpact/farmpact.html (accessed on 7 January 2019).
  35. Buckland, P.C.; Edwards, K.J.; Panagiotakopulu, E.; Edward Schofield, J. Palaeoecological and historical evidence for manuring and irrigation at Garðar (Igaliku), Norse Eastern Settlement, Greenland. Holocene 2009, 19, 105–116. [Google Scholar] [CrossRef]
  36. Edwards, K.J.; Schofield, J.E. Investigation of proposed Norse irrigation channels and dams at Garðar/Igaliku, Greenland. Water Hist. 2013, 5, 71–92. [Google Scholar] [CrossRef]
  37. Chritiansen, D. Veien Handel og kommunikation i Nordatlanten. In Rapport om Prøveundersøgelser på den Formodede Atlanthavn, Sandhavn ved Maakkarneq, Nanortalik kommune, Sommeren 2001; SILA Feltrapport 3: Copenhagen, Denmark, 2002. [Google Scholar]
  38. Halldórsson, Ó. Grænland í Miðaldaritum; Sögufélag: Reykjavík, Iceland, 1978. [Google Scholar]
  39. Keller, C. The Eastern Settlement Reconsidered. Some Analyses of Norse Medieval Greenland. Ph.D. Thesis, Oslo university, Oslo, Norway, 1989. [Google Scholar]
  40. Guðmundsson, G. Greenland and the Wider World. J. North Atl. Spec. 2009, 2, 66–73. [Google Scholar] [CrossRef]
  41. Kunz, K., Translator; The Vinland Sagas; Penguin books: London, UK, 2008.
  42. Richter, M. Die Diözese am Ende der Welt. Die Geschichte des Grönlandbistums Garðar; Münchner Nordistische Studien 28 (München 2017); Herbert Utz Verlag: Munich, Germany, 2017. [Google Scholar]
  43. Nørlund, P. Norse ruins at Garðar. The episcopal seat of mediaeval Greenland. Medd. om Grønland 1929, 76, 1–171. [Google Scholar]
  44. Molaug, P.B. Oslo havn før 1624. Viking 75; Norwegian Archaeological Society: Oslo, Norway, 2012; pp. 211–237. [Google Scholar]
  45. Herteig, A. Details from the Bergen medieval waterfront. In Proceedings of the Conference on Waterfront Archaeology in Northern European Towns; Herteig, A., Ed.; Historisk museum Bergen: Bergen, Norway, 1985; pp. 69–78. [Google Scholar]
  46. Sognnes, K. King Øystein´s harbour at Agdenes, Norway. In Proceedings of the Conference on Waterfront Archaeology in Northern European Towns; Herteig, A., Ed.; Historisk museum Bergen: Bergen, Norway, 1985; pp. 59–65. [Google Scholar]
Figure 1. Map of the investigation area including the area of the former Norse settlement, the positions of the cathedral and former bishop’s seat, and the stone buildings that were possibly connected with trading activities. Seismic and side-scan lines are marked red, and GPS height measurements are marked blue. B1–B4 mark the four embayments of the survey area.
Remotesensing 11 01889 g001
Figure 2. Site plan of Igaliku with the Norse ruins (plan after Knud J. Krogh, from [10], Figure 24). The images show the ruins of one of the coastal warehouses.
Remotesensing 11 01889 g002
Figure 3. Sketch and picture of the seismic and sonar acquisition system that was attached to the front of a rubber dinghy.
Remotesensing 11 01889 g003
Figure 4. Sea level heights measured by the tide gauge in June 2015. Black lines show the mean high- and low tide values that were used as a reference for the 2 m lower high and low tide around the year 1000.
Remotesensing 11 01889 g004
Figure 5. (a) Interpolated bathymetry of the Igaliku fjord end. The black and grey lines indicate the estimated low tide and high tide around the year 1000. At the northern end of the fjord, an extended embayment with depths of less than 2 m is recognized. (b) Complete side-scan mosaic of the whole Igaliku fjord end.
Remotesensing 11 01889 g005
Figure 6. Seismic example profiles illustrating the two seismic patterns visible in the data. (a) shows the position of the profiles; (b) shows the seismic sections. P14 shows laminated sedimentary deposits (green areas) with high seismic penetration. P3 however shows the overall rocky surface close to the coast with less seismic penetration. The letters A, B, C, and D highlight sedimentary layers close to the coast in bay B1, sedimentary deposits in the deeper bays and the bedrock surface in the smaller bays. The vertical axis shown is the depth below sea level, not corrected for tide.
Remotesensing 11 01889 g006
Figure 7. (a) Zoomed image of the peninsula (which today is an island) with remains of a stone building and the most probable harbour/landing site areas of the settlement. The black and grey lines indicate the estimated low tide and high tide around the year 1000. (b) Side-scan sonar image and bathymetry of a peculiar notch (dashed lines show sections of seismic profiles). The high scatter intensities to the right represent the slope to the present coastline. A peculiar feature interpreted as a potential protected anchorage or mooring place is the E–W directed narrow stripe of low backscatter intensity in the lower half of the image (indicated by the dotted line). (c) Seismic cross-sections of the highlighted feature.
Remotesensing 11 01889 g007

