Analysis of Ship Detection Performance with Full-, Compact- and Dual-Polarimetric SAR


Abstract
:
1. Introduction
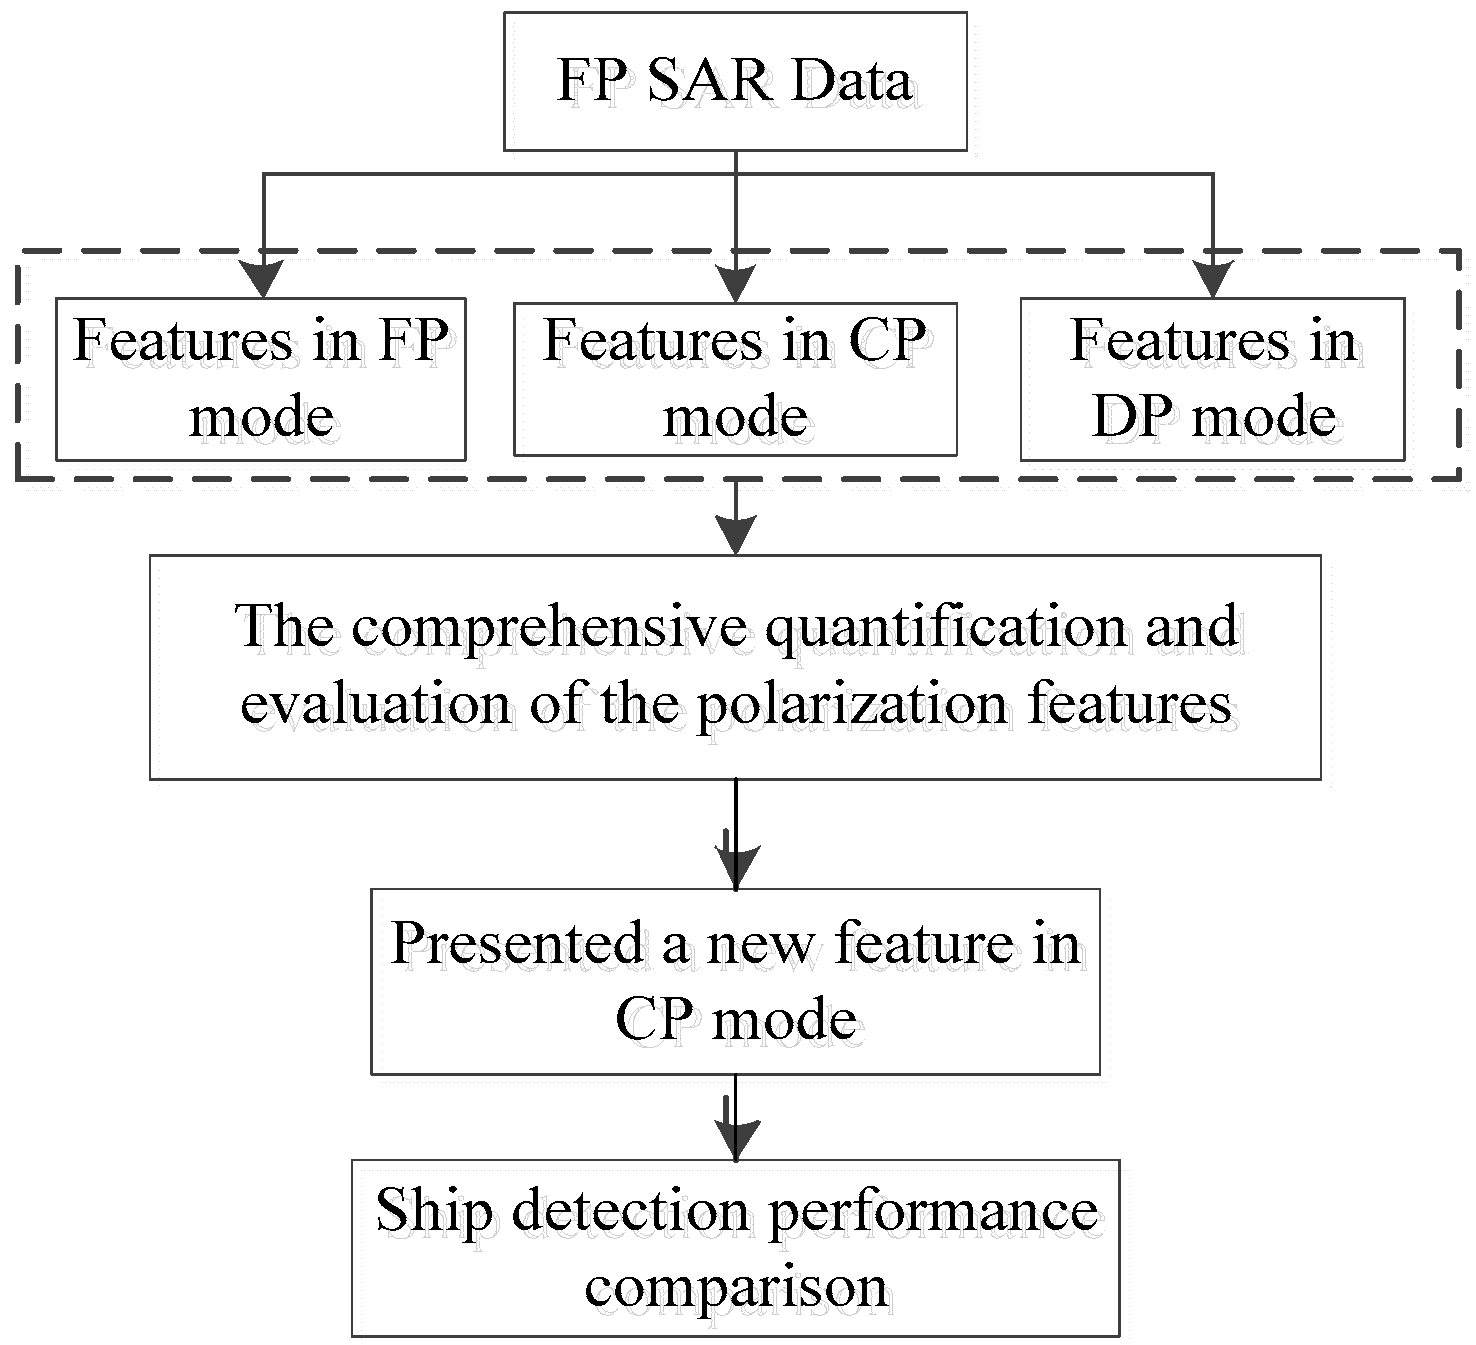
2. Data and Polarization Features
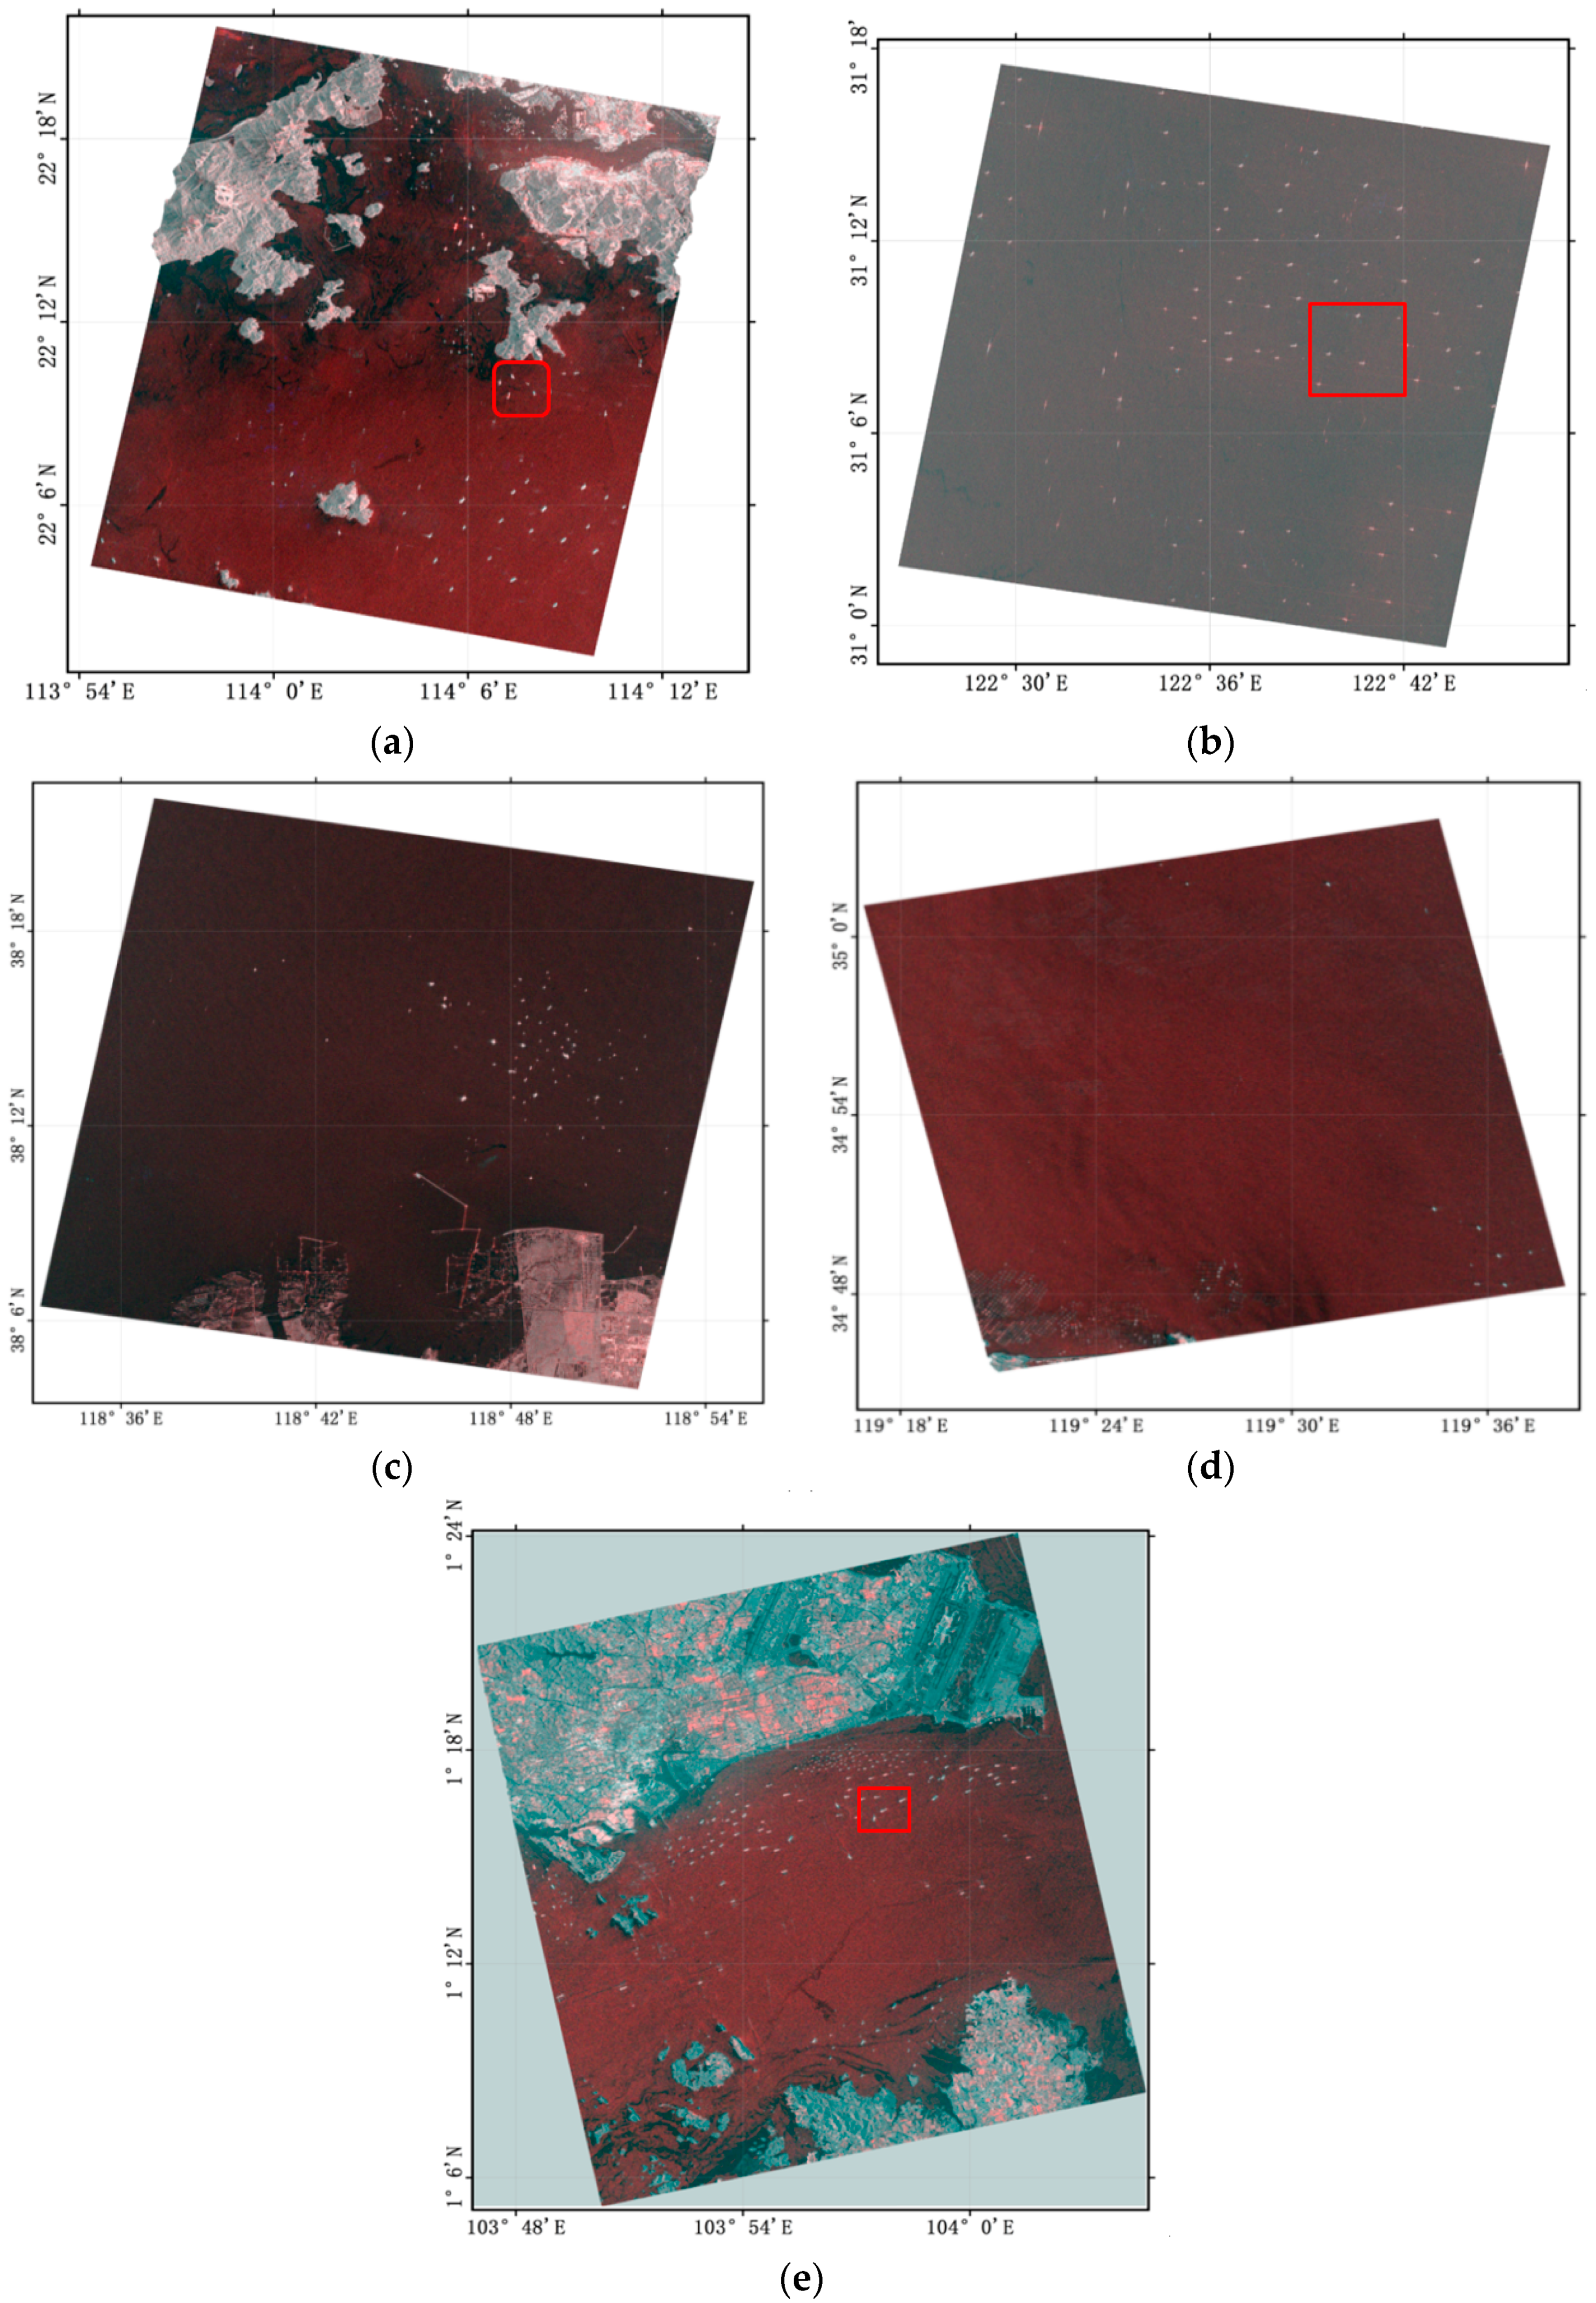
2.1. Data
2.2. Extraction of Features from FP, CP and DP Data
2.2.1. Features from FP Data
2.2.2. Features from CP and DP Data
2.3. Sample Selection
3. Comprehensive Quantification and Evaluation of Features for Ship Detection
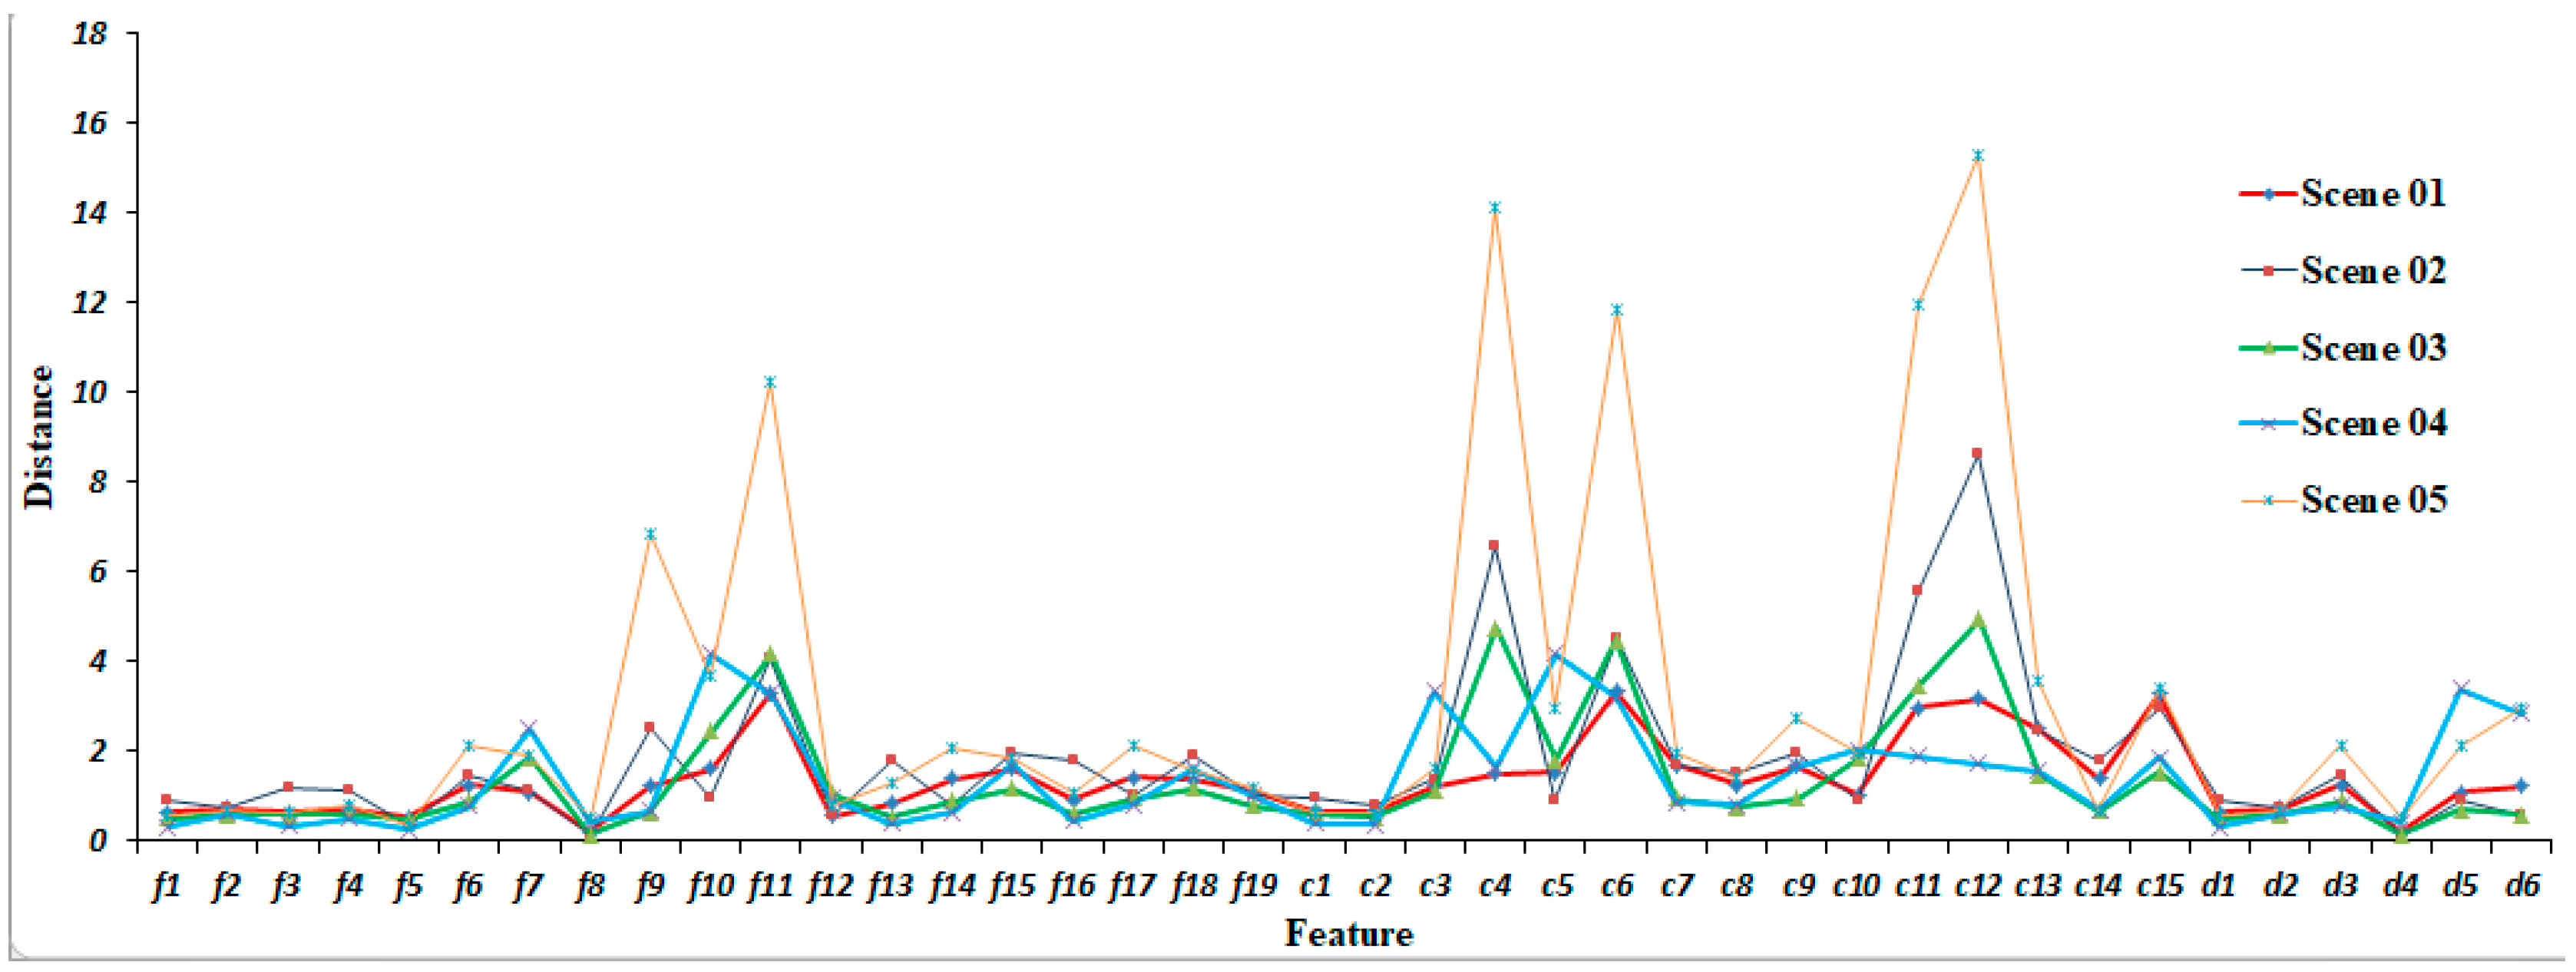
3.1. Evaluation of Different Features by Euclidean Distance
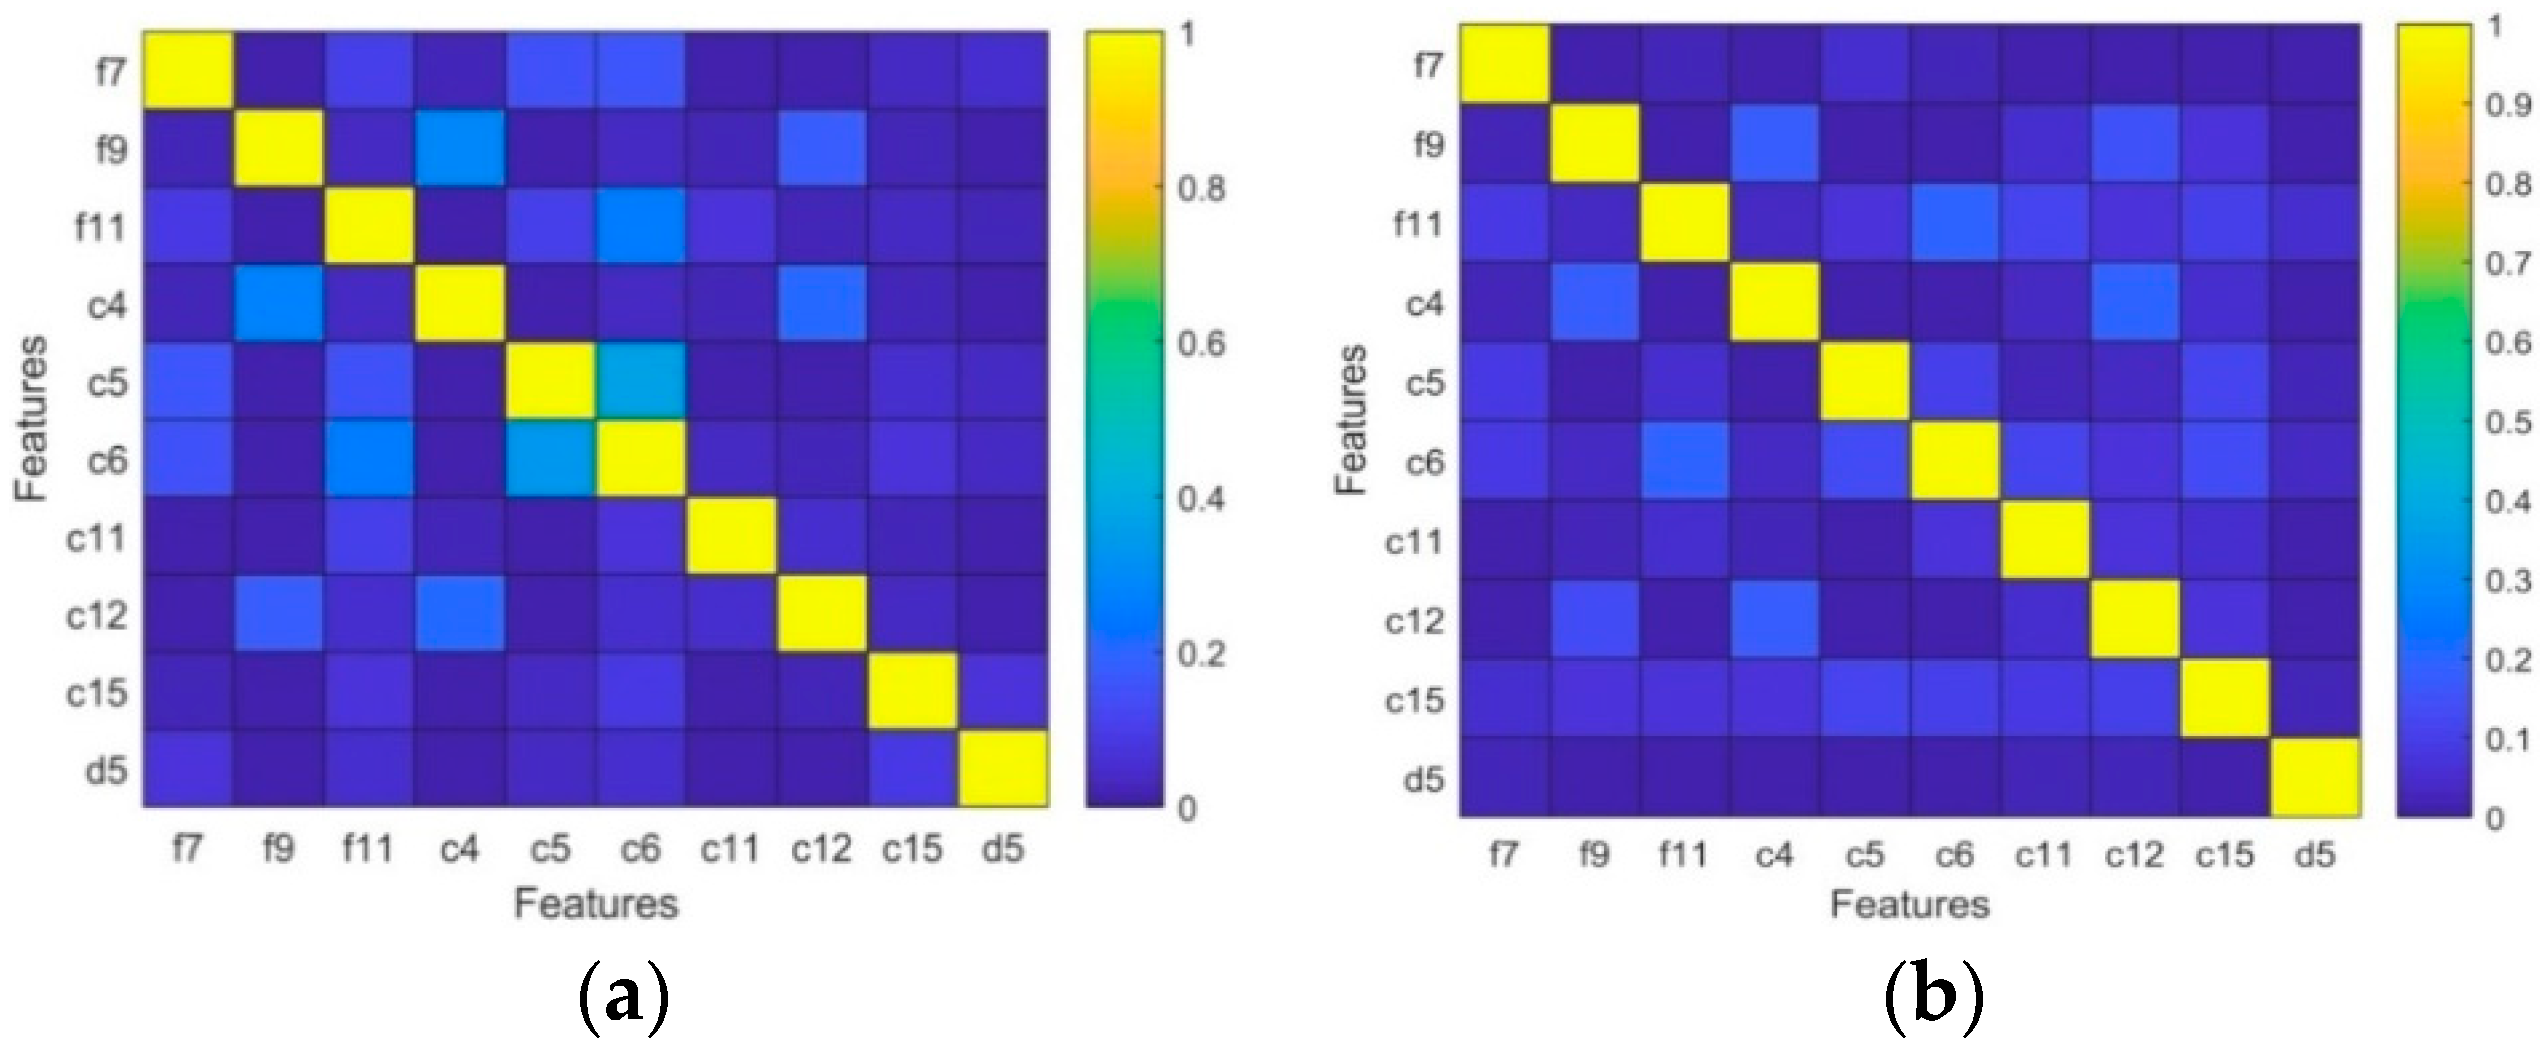
3.2. Mutual Information Analysis
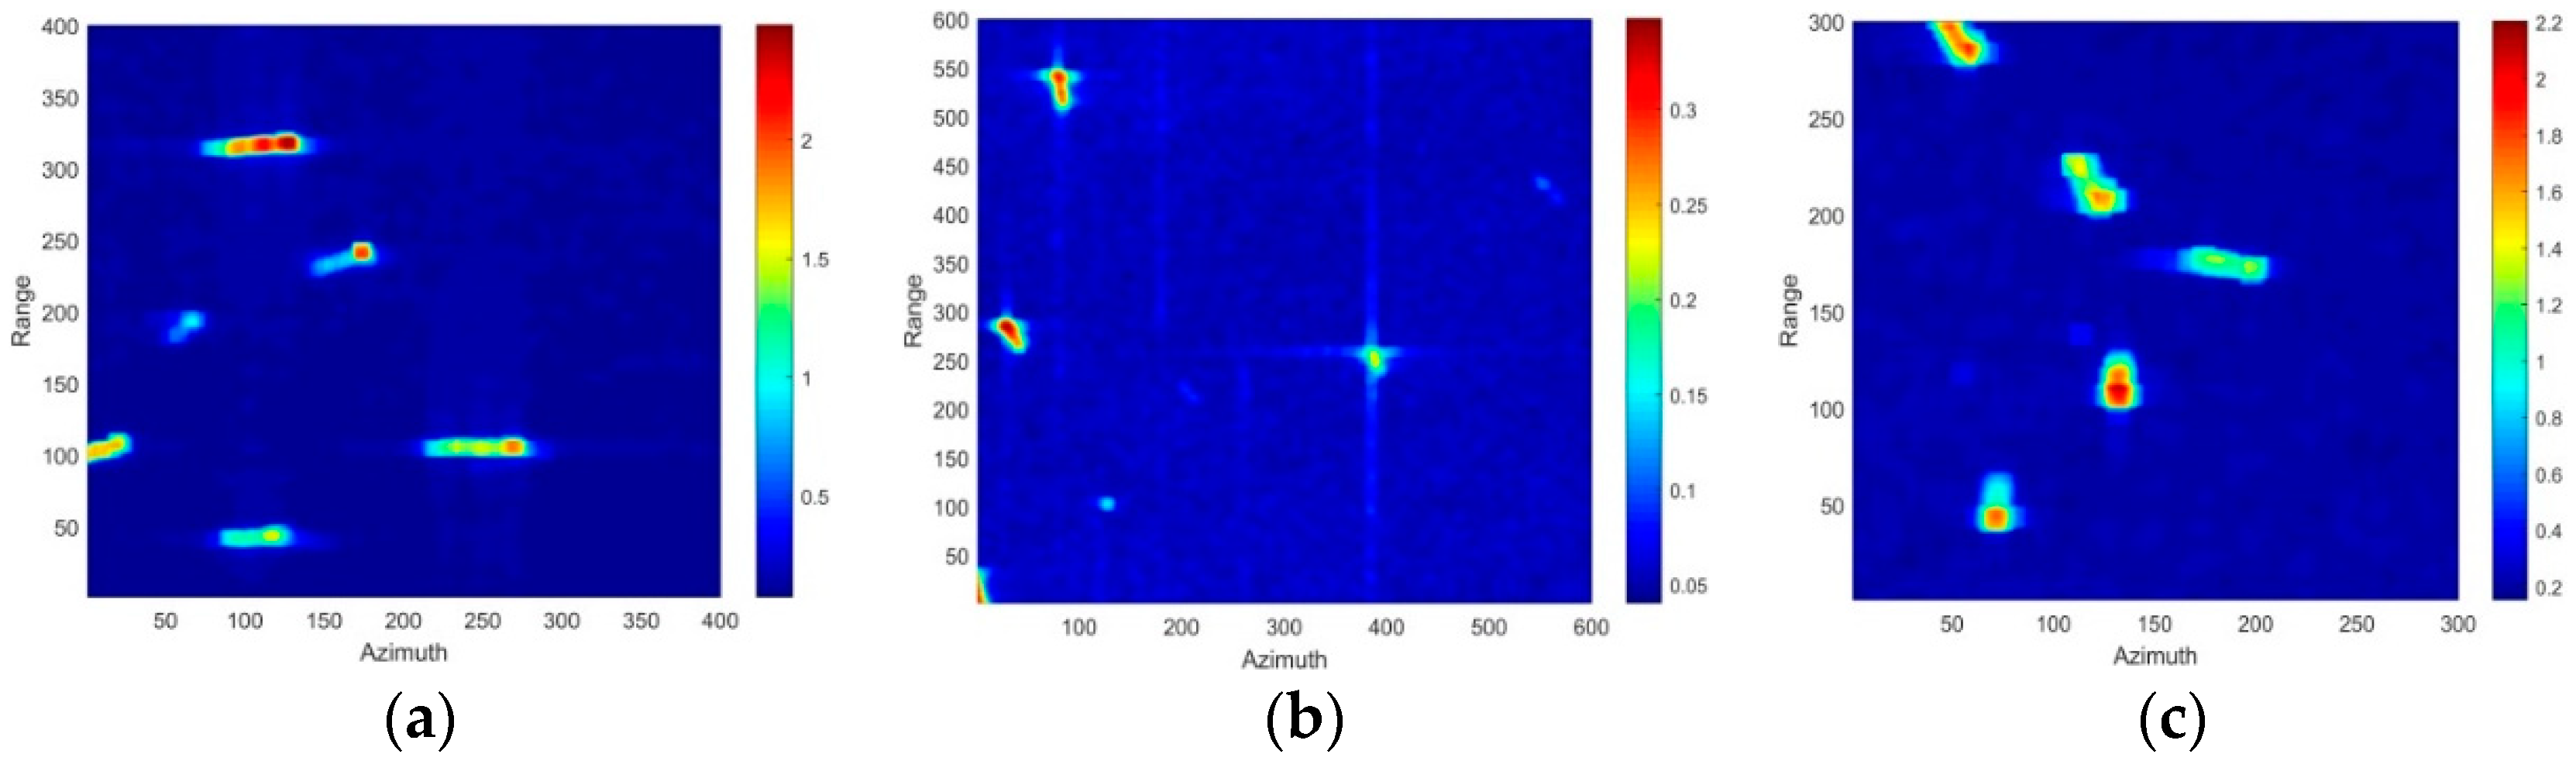
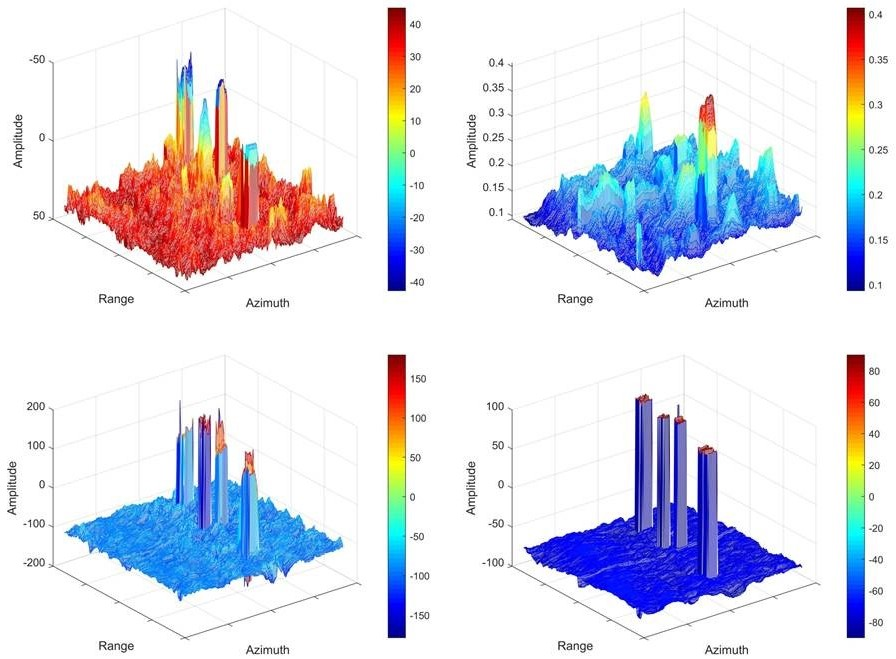
4. A New Feature: Phase Factor
4.1. Roundness
4.2. Delta
4.3. HESA
4.4. Phase Factor
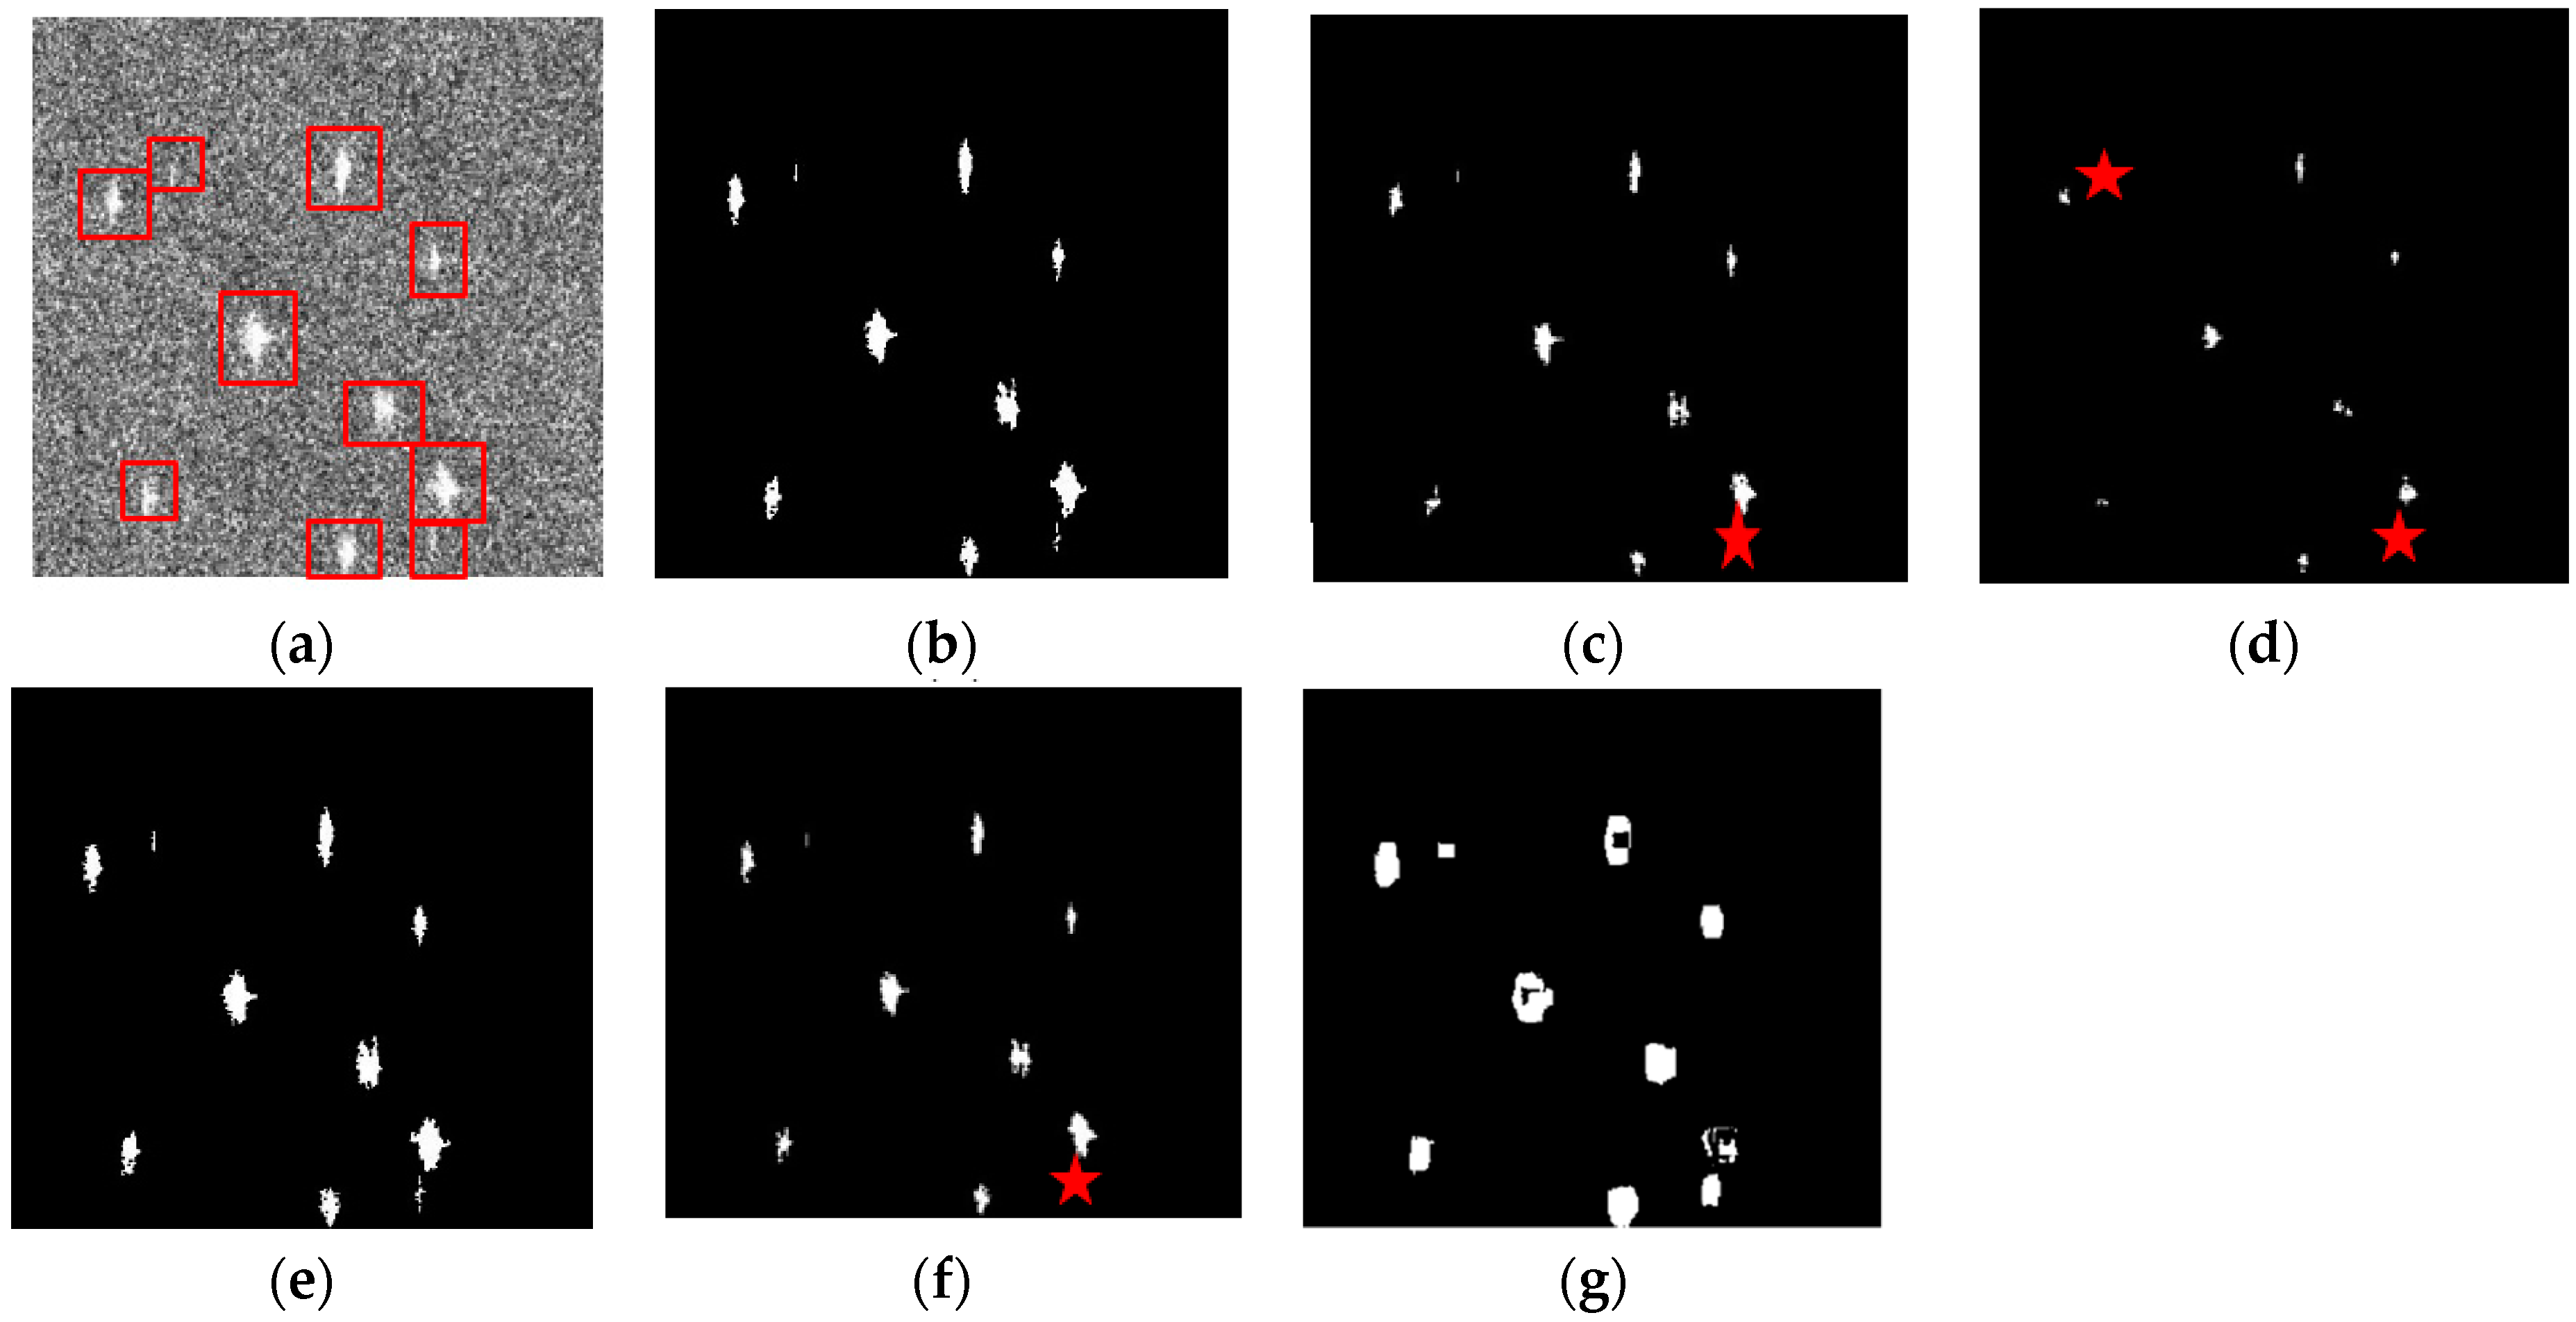
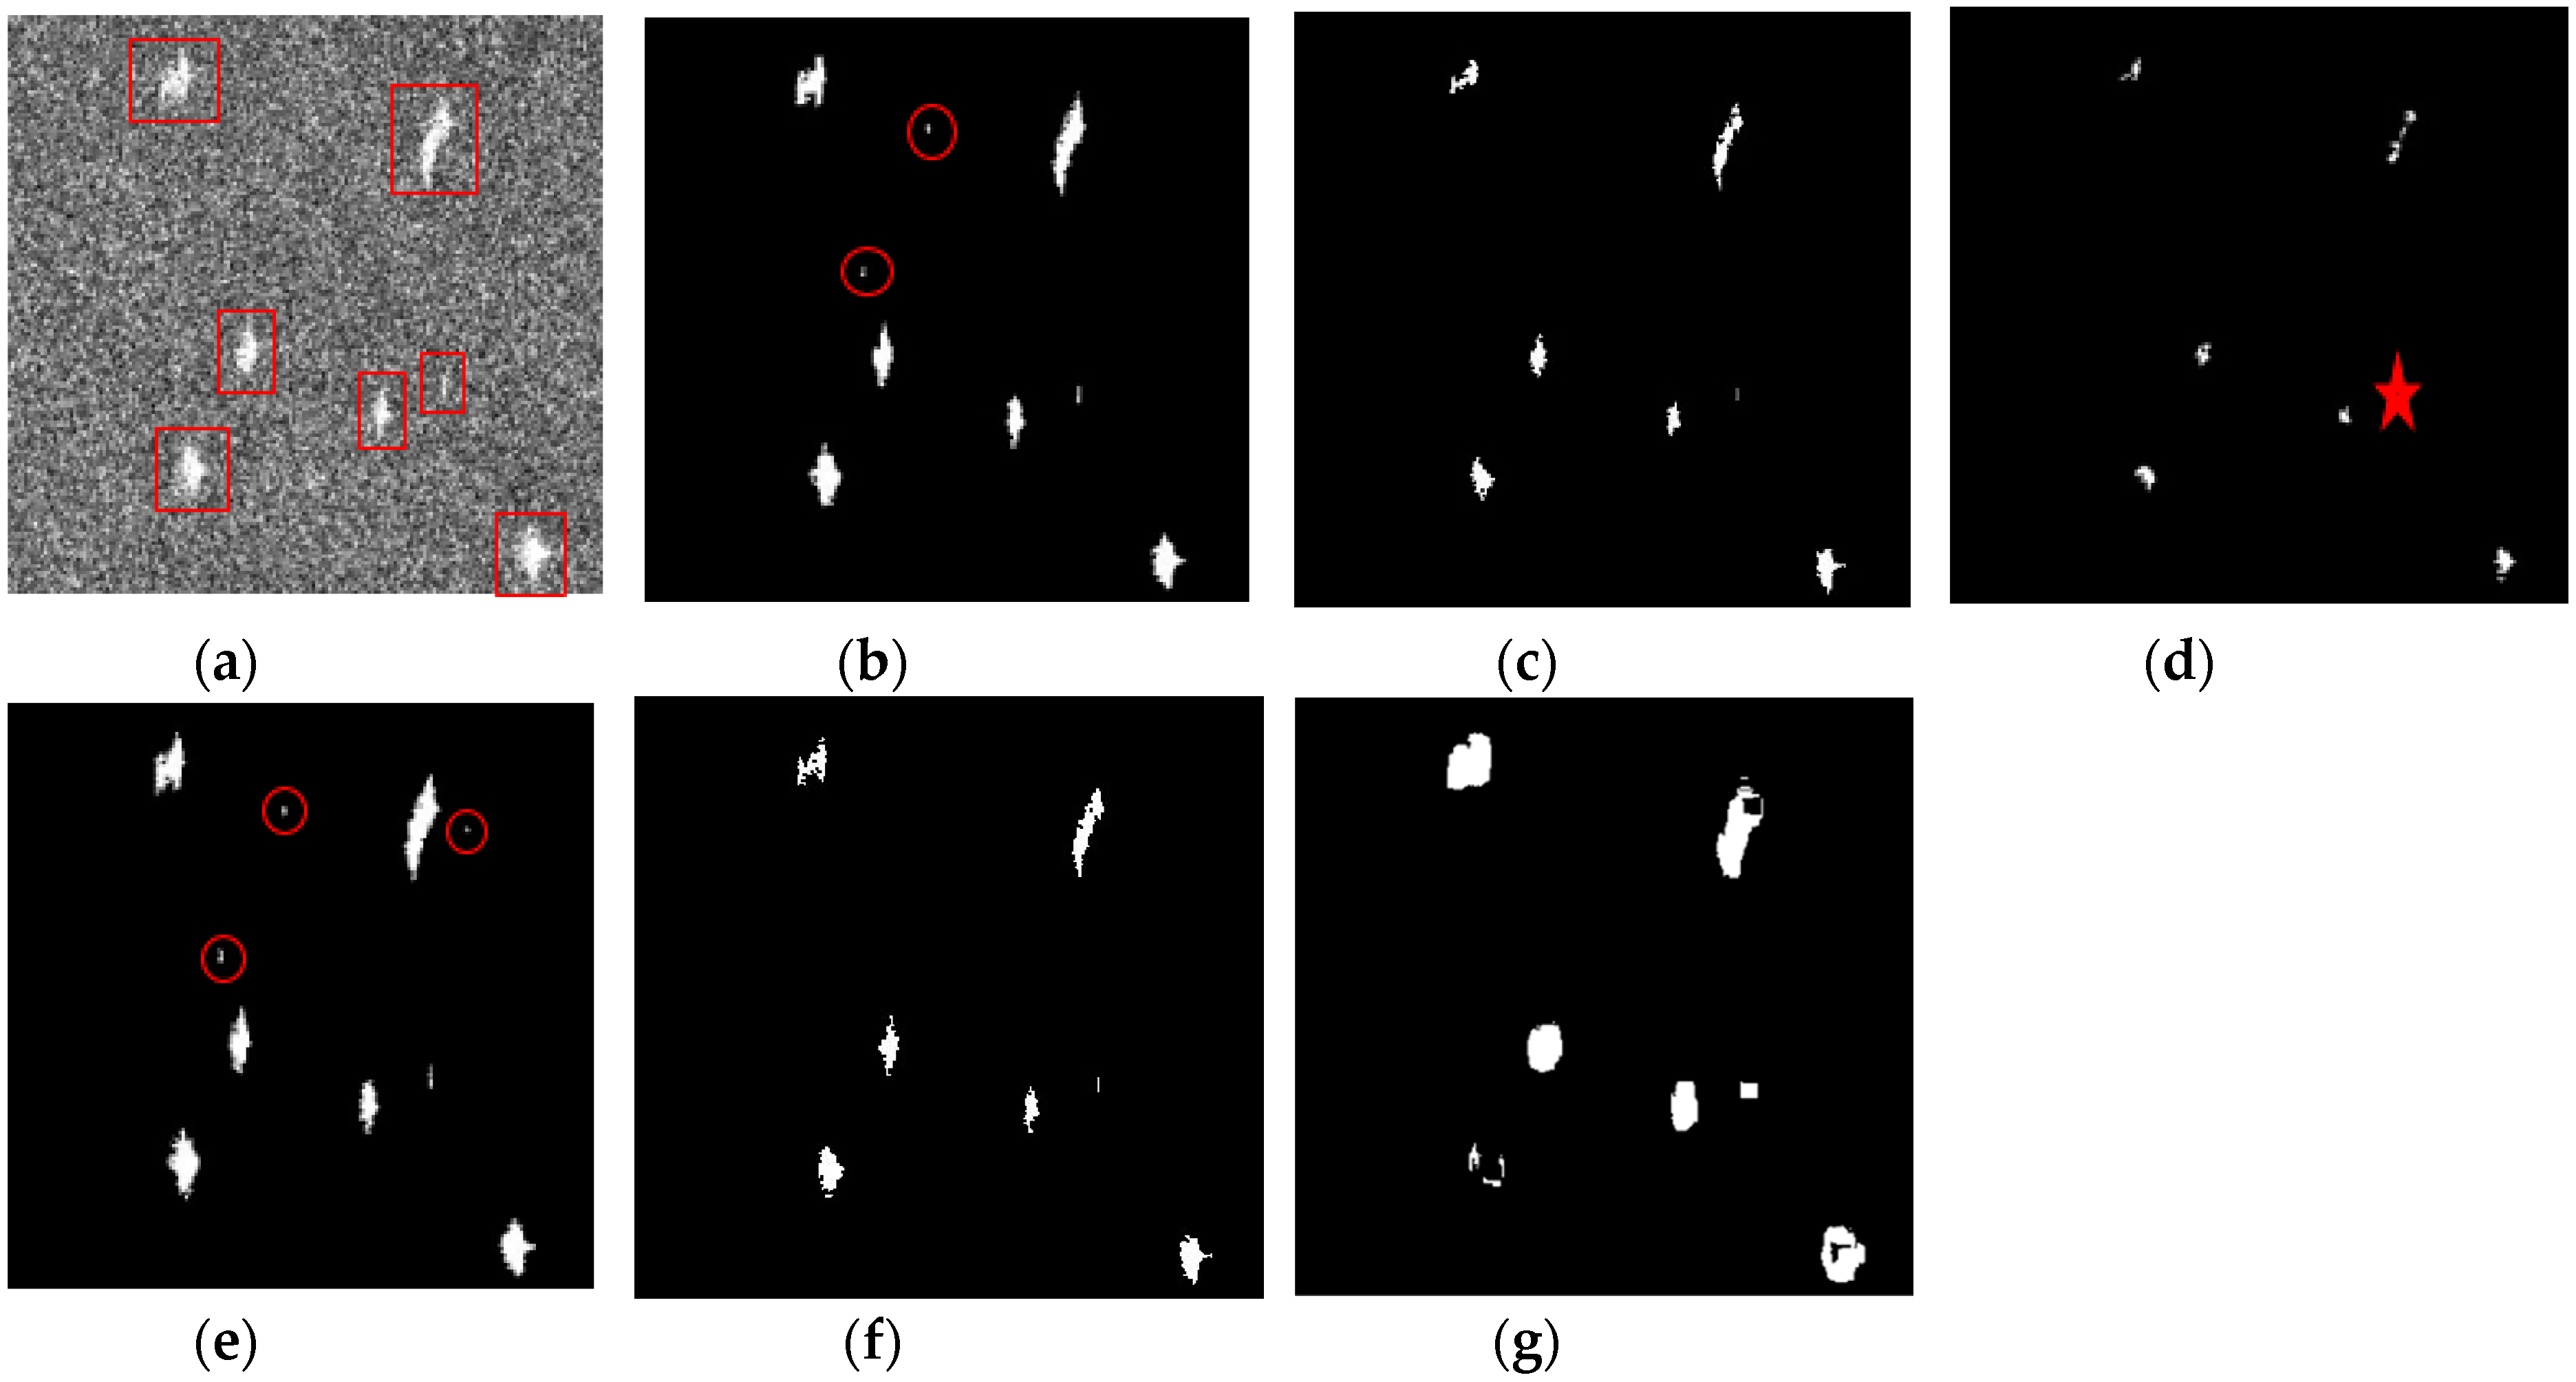
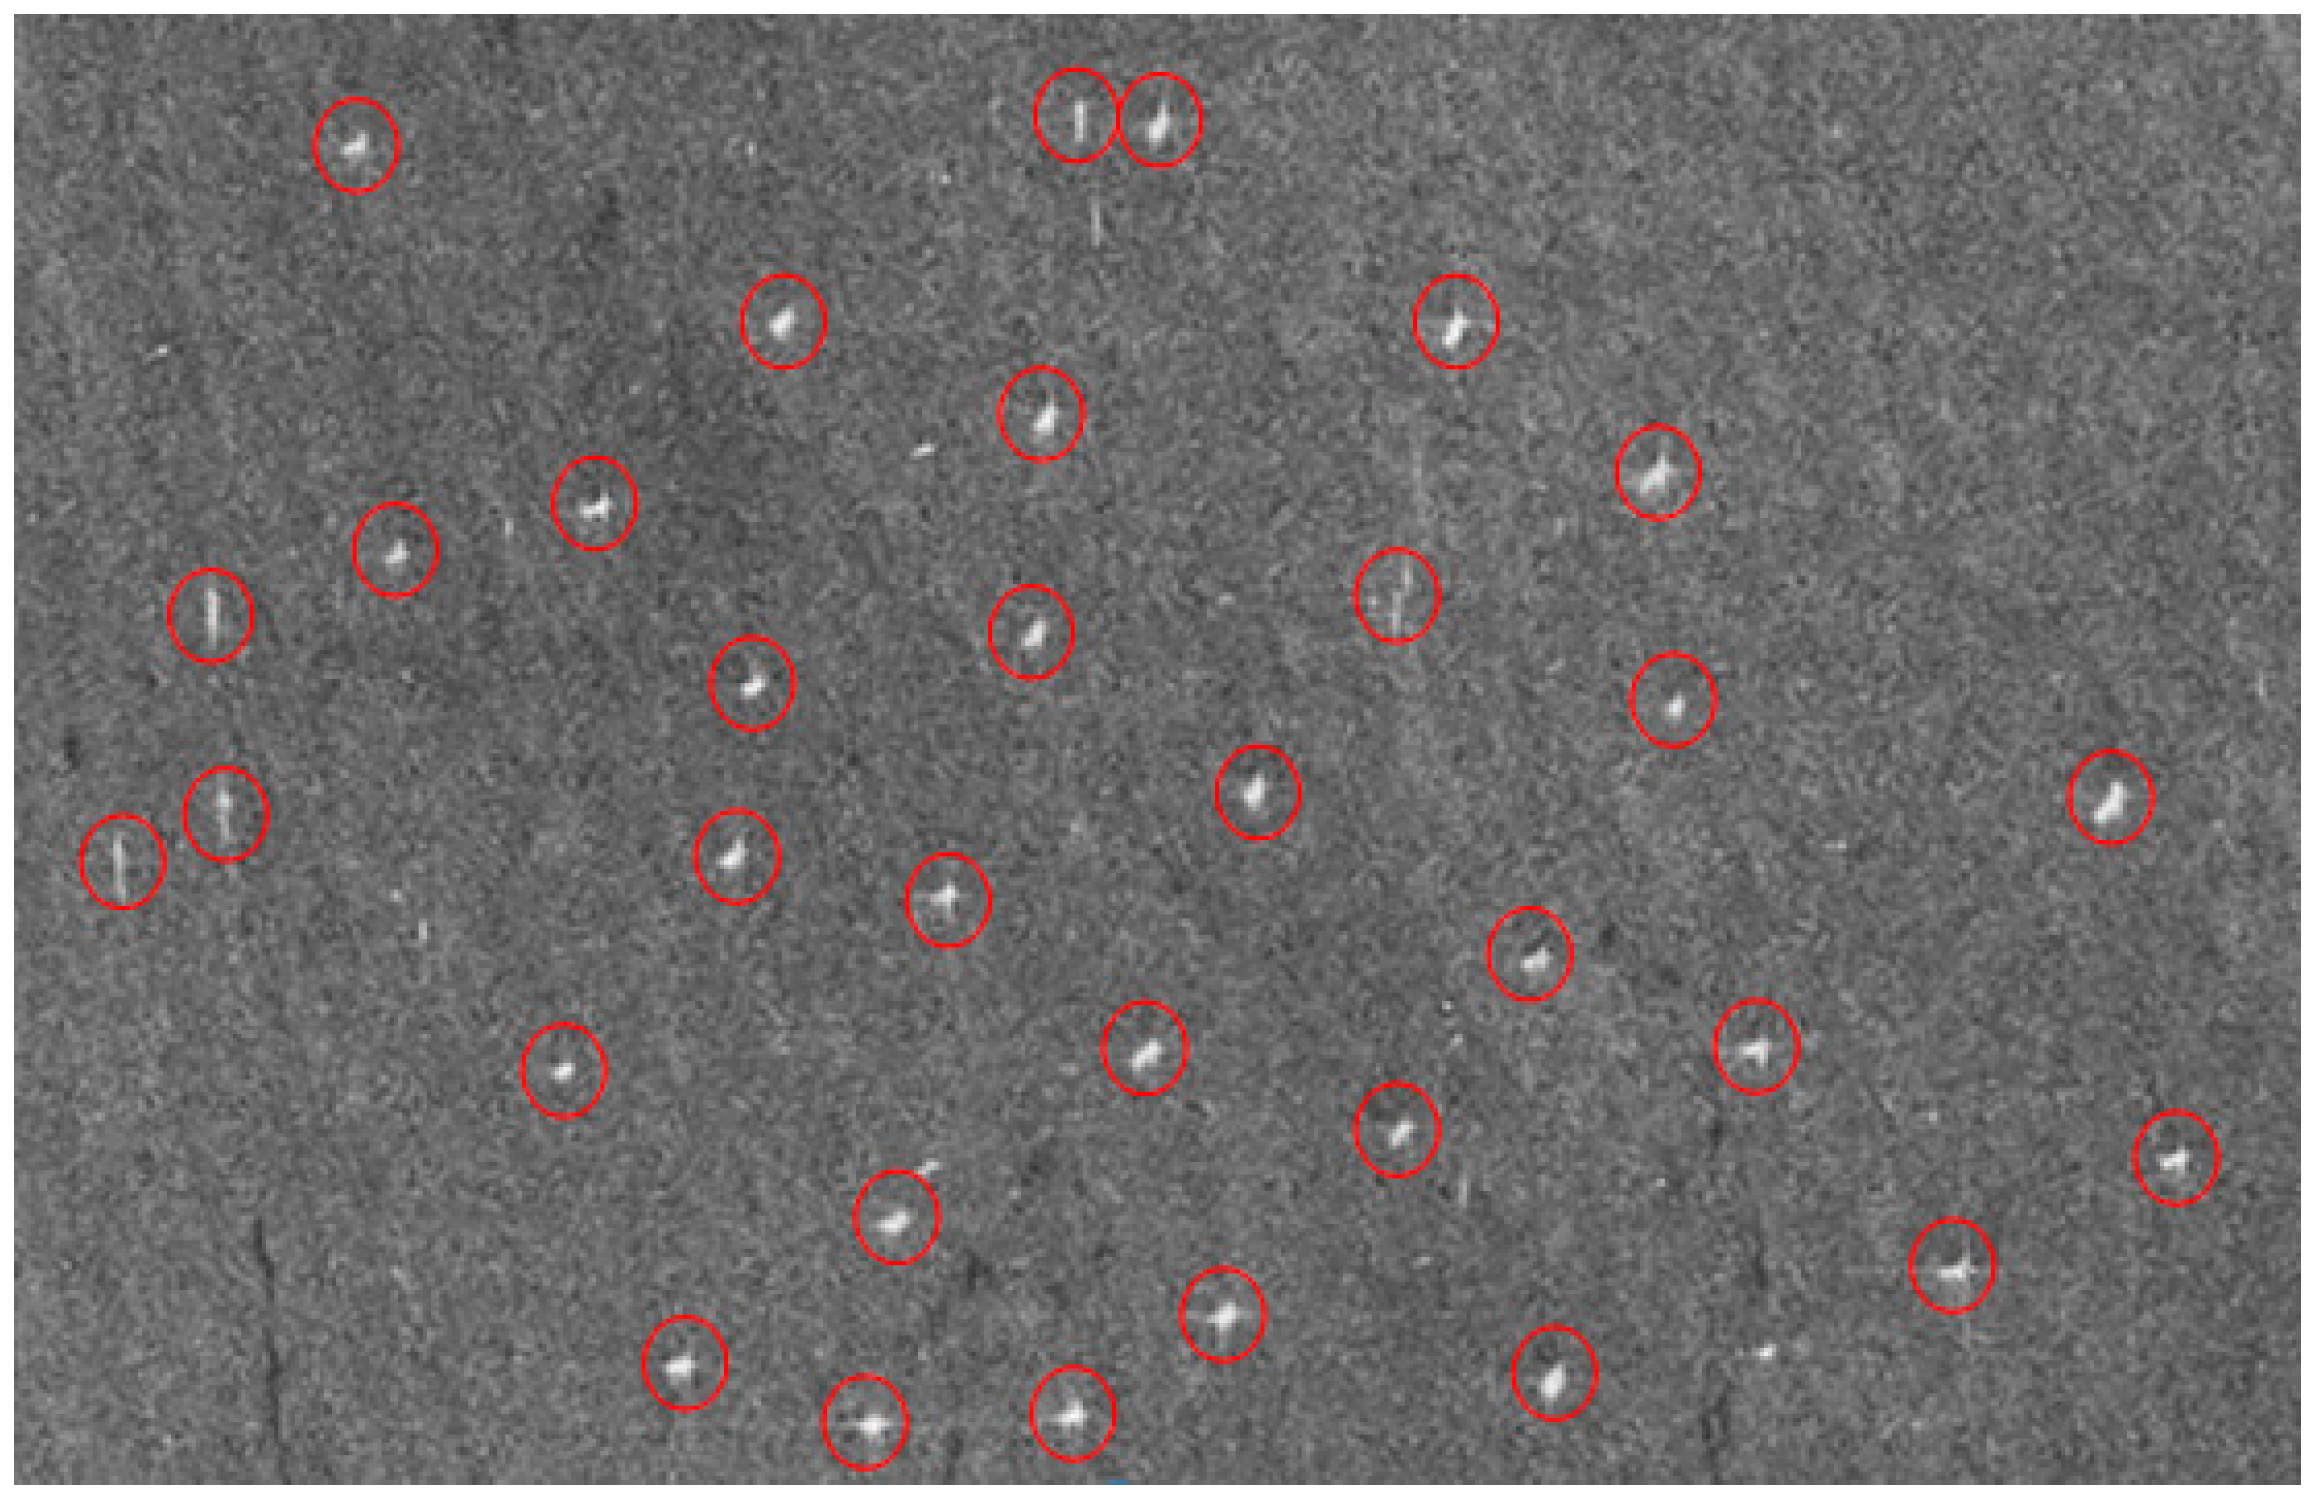
5. Detection Results and Discussion
5.1. Comparisons Between Phase Factor and Roundness, Delta, HESA Detectors
5.2. Comparisons Between Phase Factor and CFAR Detectors
6. Conclusions
Author Contributions
Funding
Acknowledgments
Conflicts of Interest
References
- Nicolas, J.M.; Anfinsen, S.N. Introduction to second kind statistics: Application of log-moments and log-cumulants to the analysis of radar image distributions. Trait. Signal 2002, 19, 139–167. [Google Scholar]
- Ai, J.; Qi, X.; Yu, W.; Yu, W.; Deng, Y.; Liu, F.; Shi, L. A new CFAR ship detection algorithm based on 2-D joint log-normal distribution in SAR images. IEEE Geosci. Remote Sens. Lett. 2010, 7, 806–810. [Google Scholar] [CrossRef]
- Qin, X.; Zhou, S.; Zou, H.; Gao, G. A CFAR detection algorithm for generalized gamma distributed background in high-resolution SAR images. IEEE Geosci. Remote Sens. Lett. 2012, 10, 806–810. [Google Scholar]
- Angelliaume, S.; Rosenberg, L.; Ritchie, M. Modeling the Amplitude Distribution of Radar Sea Clutter. Remote Sens. 2019, 11, 319. [Google Scholar] [CrossRef]
- He, Z.; Zhou, X.G.; Lu, J.; Kuang, G.Y. A fast CFAR detection algorithm based on the G0 distribution for SAR images. J. Natl. Univ. Def. Technol. 2009, 31, 47–51. [Google Scholar]
- Mahdianpari, M.; Salehi, B.; Mohammadimanesh, F.; Brisco, B. An assessment of simulated compact polarimetric SAR data for wetland classification using random forest algorithm. Can. J. Remote Sens. 2017, 43, 468–484. [Google Scholar] [CrossRef]
- Ouchi, K. Recent Trend and Advance of Synthetic Aperture Radar with Selected Topics. Remote Sens. 2013, 5, 716–807. [Google Scholar] [CrossRef] [Green Version]
- Mazzarella, F.; Vespe, M.; Santamaria, C. SAR ship detection and self-reporting data fusion based on traffic knowledge. IEEE Geosci. Remote Sens. Lett. 2015, 12, 1685–1689. [Google Scholar] [CrossRef]
- Sun, Y.; Wang, C.; Zhang, H.; Wu, F.; Zhang, B. A new PolSAR ship detector on RADARSAT-2 data. Proc. SPIE 2012, 8525. [Google Scholar] [CrossRef]
- Sugimoto, M.; Ouchi, K.; Nakamura, Y. On the novel use of model-based decomposition in SAR polarimetry for target detection on the sea. Remote Sens. Lett. 2013, 4, 843–852. [Google Scholar] [CrossRef]
- Shirvany, R.; Chabert, M.; Tourneret, J.Y. Ship and oil-spill detection using the degree of polarization in linear and hybrid/compact dual-pol SAR. IEEE J. Sel. Top. Appl. Earth Observ. Remote Sens. 2012, 5, 885–892. [Google Scholar] [CrossRef]
- Touzi, R.; Vachon, P.W. RCM polarimetric SAR for enhanced ship detection and classification. Can. J. Remote Sens. 2015, 41, 473–484. [Google Scholar] [CrossRef]
- Yin, J.; Yang, J. Ship detection by using the M-Chi and M-Delta decomposition. In Proceedings of the 2014 IEEE Geoscience and Remote Sensing Symposium, Quebec City, QC, Canada, 13–18 July 2014. [Google Scholar]
- Yin, J.; Yang, J.; Zhou, Z.S.; Song, J. The Extended Bragg Scattering Model-Based Method for Ship and Oil-Spill Observation Using Compact Polarimetric SAR. IEEE J. Sel. Top. Appl. Earth Observ. 2015, 8, 3760–3772. [Google Scholar] [CrossRef]
- Paes, R.L.; Nunziata, F.; Migliaccio, M. On the capability of hybrid-polarity features to observe metallic targets at sea. IEEE J. Ocean. Eng. 2016, 41, 346–361. [Google Scholar] [CrossRef]
- Gao, G.; Gao, S.; He, J.; Li, G. Adaptive Ship Detection in Hybrid-Polarimetric SAR Images Based on the Power-Entropy Decomposition. IEEE Trans. Geosci. Remote Sens. 2018, 56, 5394–5407. [Google Scholar] [CrossRef]
- Buono, A.; Nunziata, F.; Migliaccio, M. Analysis of full and compact polarimetric SAR features over the sea surface. IEEE Geosci. Remote Sens. Lett. 2016, 13, 1527–1531. [Google Scholar] [CrossRef]
- Charbonneau, F.J.; Brisco, B.; Raney, R.K.; McNairn, H.; Liu, C.; Vachon, P.W.; Geldsetzer, T. Compact polarimetry overview and applications assessment. Can. J. Remote Sens. 2010, 36, S298–S315. [Google Scholar] [CrossRef]
- Buono, A.; Nunziata, F.; Migliaccio, M. Polarimetric analysis of compact-polarimetry SAR architectures for sea oil slick observation. IEEE Trans. Geosci. Remote Sens. 2016, 54, 5862–5874. [Google Scholar] [CrossRef]
- Souyris, J.C.; Imbo, P.; Fjortoft, R. Compact polarimetry based on symmetry properties of geophysical media: The/spl pi//4 mode. IEEE Trans. Geosci. Remote Sens. 2005, 43, 634–646. [Google Scholar] [CrossRef]
- Raney, R.K. Comparing compact and quadrature polarimetric SAR performance. IEEE Geosci. Remote Sens. Lett. 2016, 13, 861–864. [Google Scholar] [CrossRef]
- Gao, G.; Gao, S.; He, J. Ship Detection Using Compact Polarimetric SAR Based on the Notch Filter. IEEE Trans. Geosci. Remote Sens. 2018, 56, 5380–5393. [Google Scholar] [CrossRef]
- Hajnsek, I.; Pottier, E.; Cloude, S.R. Inversion of surface parameters from polarimetric SAR. IEEE Trans. Geosci. Remote Sens. 2003, 41, 727–744. [Google Scholar] [CrossRef]
- Hersbach, H. CMOD5: An Improved Geophysical Model Function for ERS C-Band Scatterometry; European Centre for Medium-Range Weather Forecasts: Reading, UK, 2003. [Google Scholar]
- Hersbach, H.; Stoffelen, A.; deHaan, S. An improved C-band scatterometer ocean geophysical model function: CMOD5. J. Geophys. Res. Oceans 2007, 112. [Google Scholar] [CrossRef]
- Beaufort_Scale. Available online: https://en.wikipedia.org/wiki/Beaufort_scale (accessed on 20 May 2018).
- Harati-Mokhtari, A.; Wall, A.; Brooks, P.; Wang, J. Automatic Identification System (AIS): Data reliability and human error implications. J. Navig. 2007, 60, 373–389. [Google Scholar] [CrossRef]
- Tetreault, B.J. Use of the Automatic Identification System (AIS) for maritime domain awareness (MDA). In Proceedings of the OCEANS 2005 MTS/IEEE, Washington, DC, USA, 18–23 Septmber 2005. [Google Scholar]
- Cloude, S.R.; Pottier, E. An entropy based classification scheme for land applications of polarimetric SAR. IEEE Trans. Geosci. Remote Sens. 1997, 35, 68–78. [Google Scholar] [CrossRef]
- Sabry, R.; Ainsworth, T.L. SAR Compact Polarimetry for Change Detection and Characterization. IEEE J. Sel. Top. Appl. Earth Observ. Remote Sens. 2019, 12, 898–909. [Google Scholar] [CrossRef]
- Freeman, A.; Durden, S.L. A three-component scattering model for polarimetric SAR data. IEEE Trans. Geosci. Remote Sens. 1998, 36, 963–973. [Google Scholar] [CrossRef] [Green Version]
- Yamaguchi, Y.; Sato, A.; Boerner, W.M.; Sato, R.; Yamada, H. Four-component scattering power decomposition with rotation of coherency matrix. IEEE Trans. Geosci. Remote Sens. 2011, 49, 2251–2258. [Google Scholar] [CrossRef]
- Yamaguchi, Y.; Moriyama, T.; Ishido, M.; Yamada, H. Four-component scattering model for polarimetric SAR image decomposition. IEEE Trans. Geosci. Remote Sens. 2005, 43, 1699–1706. [Google Scholar] [CrossRef]
- Raney, R.K. Hybrid-polarity SAR architecture. IEEE Trans. Geosci. Remote Sens. 2007, 45, 3397–3404. [Google Scholar] [CrossRef]
- Espeseth, M.M.; Skrunes, S.; Jones, C.E.; Brekke, C.; Holt, B.; Doulgeris, A.P. Analysis of evolving oil spills in full-polarimetric and hybrid-polarity SAR. IEEE Trans. Geosci. Remote Sens. 2017, 55, 4190–4210. [Google Scholar] [CrossRef]
- Nord, M.E.; Ainsworth, T.L.; Lee, J.S.; Stacy, N.J. Comparison of compact polarimetric synthetic aperture radar modes. IEEE Trans. Geosci. Remote Sens. 2009, 47, 174–188. [Google Scholar] [CrossRef]
- Cloude, S.R.; Goodenough, D.G.; Chen, H. Compact decomposition theory. IEEE Geosci. Remote Sens. Lett. 2011, 9, 28–32. [Google Scholar] [CrossRef]
- Raney, R.K.; Cahill, J.T.; Patterson, G.W.; Bussey, D.B.J. The m-chi decomposition of hybrid dual-polarimetric radar data with application to lunar craters. J. Geophys. Res. Planets 2012, 117, E12. [Google Scholar] [CrossRef]
- Shan, Z.; Wang, C.; Zhang, H.; Chen, J. H-Alpha Decomposition and Alternative Parameters for Dual Polarization SAR Data. In Proceedings of the PIERS, SuZhou, China, 12–16 September 2011. [Google Scholar]
- Cloude, S.R. Dual-versus quad-pol: A new test statistic for radar polarimetry. In Proceedings of the PolInSAR Conference—ESAESRIN, Frascati, Italy, 28 January–1 February 2009. [Google Scholar]
- Cao, C.H.; Zhang, J.; Zhang, X. The analysis of ship target detection performance with C band compact polarimetric SAR. Period. Ocean Univ. China 2017, 47, 85–93. [Google Scholar]
- Peng, H.; Long, F.; Ding, C. Feature selection based on mutual information: Criteria of max-dependency, max-relevance, and min-redundancy. IEEE Trans. Pattern Anal. Mach. Intell. 2005, 27, 1226–1238. [Google Scholar] [CrossRef]
- Estévez, P.A.; Tesmer, M.; Perez, C.A.; Zurada, J.M. Normalized mutual information feature selection. IEEE Trans. Neural Netw. 2009, 20, 189–201. [Google Scholar] [CrossRef]
- Bi, N.; Tan, J.; Lai, J.H.; Suen, C.Y. High-dimensional supervised feature selection via optimized kernel mutual information. Expert Syst. Appl. 2018, 108, 81–95. [Google Scholar] [CrossRef]
- Dabboor, M.; Geldsetzer, T. Towards sea ice classification using simulated RADARSAT Constellation Mission compact polarimetric SAR imagery. Remote Sens. Environ. 2014, 140, 189–195. [Google Scholar] [CrossRef]
- Wang, H.; Zhou, Z.; Turnbull, J. Three-Component Decomposition Based on Stokes Vector for Compact Polarimetric SAR. Sensors 2015, 15, 24087–24108. [Google Scholar] [CrossRef]
- Van Zyl, J.J. Unsupervised classification of scattering behavior using radar polarimetry data. IEEE Trans. Geosci. Remote Sens. 1989, 27, 36–45. [Google Scholar] [CrossRef]
- Zhang, X.; Zhang, J.; Meng, J.M.; Chen, L.M. A novel polarimetric SAR ship detection filter. In Proceedings of the IET International Radar Conference 2013, Xi’an, China, 14–16 April 2013. [Google Scholar]


| Scene ID | Imaging Time | Polarization Mode | Incident Angle | Resolution |
|---|---|---|---|---|
| 01 | 16 December, 2008 | HH/HV/VH/VV | 28° | 8/m |
| 02 | 22 January, 2014 | HH/HV/VH/VV | 44° | 8/m |
| 03 | 25 September, 2014 | HH/HV/VH/VV | 40° | 8/m |
| 04 | 29 March, 2015 | HH/HV/VH/VV | 27° | 8/m |
| 05 | 21 November, 2015 | HH/HV/VH/VV | 20° | 8/m |
| Scene ID | 01 | 02 | 03 | 04 | 05 |
|---|---|---|---|---|---|
| Average wind speed (m/s) | 3.8 | 2.6 | 9.1 | 10.9 | 4.7 |
| Sea state | 3 | 2 | 5 | 6 | 3 |
| FP SAR | CP SAR | DP SAR |
|---|---|---|
| Amplitudes: f1: |HH| f2: |HV| f3: |VV| f4: |HH-VV| f5: |HH+VV| | c1: |RH| c2: |RV| | d1: |HH| d2: |HV| |
| Polarimetric coherences: f6: HH/HV f7: HH/VV | c3: RH/RV | d3: HH/HV |
| Polarimetric phase differences: | ||
| f8: HH/HV f9: HH/VV | c4: RH/RV | d4: HH/HV |
| Eigenvalue parameters: f10: Entropy f11: Alpha f12: Anisotropy | c5: Entropy c6: Alpha | d5: Entropy d6: Alpha |
| Freeman decomposition: f13: Surface f14: Double f15: Volume Yamaguchi decomposition: f16: Surface f17: Double f18: Volume f19: Helix | Cloude decomposition: c7: Surface c8: Double c9: Random Raney decomposition: c10: DoP c11: Roundness c12: Delta c13: Surface c14: Double c15: Random | |
| Feature | f7 | f9 | f11 | c4 | c5 | c6 | c11 | c12 | c15 | d5 |
|---|---|---|---|---|---|---|---|---|---|---|
| I(x|y) | 0.383 | 0.522 | 0.603 | 0.610 | 0.519 | 0.625 | 0.658 | 0.631 | 0.315 | 0.359 |
| Feature | Experiment no. | Amplitude | Roundness | Delta | HESA | Phase Factor |
|---|---|---|---|---|---|---|
| P | #1 | 0.02 | 1.07 | 0.82 | 0.18 | 1.29 |
| #2 | 0.05 | 1.37 | 1.19 | 0.32 | 1.83 | |
| Multiples | #1 | 1 | 54 | 41 | 9 | 65 |
| #2 | 1 | 27 | 24 | 7 | 37 |
| Model | Sea State | False Alarms | Correct Detections | FOM |
|---|---|---|---|---|
| Weibull-CFAR | Low | 22 | 89 | 0.75 |
| medium | 4 | 40 | 0.9 | |
| high | 16 | 28 | 0.64 | |
| Log-normal-CFAR | Low | 1 | 83 | 0.85 |
| medium | 1 | 36 | 0.88 | |
| high | 0 | 16 | 0.57 | |
| G0-CFAR | Low | 0 | 58 | 0.59 |
| medium | 2 | 32 | 0.76 | |
| high | 0 | 12 | 0.43 | |
| K-CFAR | Low | 74 | 94 | 0.55 |
| medium | 14 | 40 | 0.74 | |
| high | 40 | 28 | 0.41 | |
| GFD-CFAR | Low | 6 | 74 | 0.72 |
| medium | 1 | 36 | 0.88 | |
| high | 8 | 28 | 0.78 | |
| Phase factor | Low | 5 | 96 | 0.94 |
| medium | 0 | 40 | 1 | |
| high | 0 | 24 | 0.86 |
© 2019 by the authors. Licensee MDPI, Basel, Switzerland. This article is an open access article distributed under the terms and conditions of the Creative Commons Attribution (CC BY) license (http://creativecommons.org/licenses/by/4.0/).
Share and Cite
Cao, C.; Zhang, J.; Meng, J.; Zhang, X.; Mao, X. Analysis of Ship Detection Performance with Full-, Compact- and Dual-Polarimetric SAR. Remote Sens. 2019, 11, 2160. https://doi.org/10.3390/rs11182160
Cao C, Zhang J, Meng J, Zhang X, Mao X. Analysis of Ship Detection Performance with Full-, Compact- and Dual-Polarimetric SAR. Remote Sensing. 2019; 11(18):2160. https://doi.org/10.3390/rs11182160
Chicago/Turabian StyleCao, Chenghui, Jie Zhang, Junmin Meng, Xi Zhang, and Xingpeng Mao. 2019. "Analysis of Ship Detection Performance with Full-, Compact- and Dual-Polarimetric SAR" Remote Sensing 11, no. 18: 2160. https://doi.org/10.3390/rs11182160
APA StyleCao, C., Zhang, J., Meng, J., Zhang, X., & Mao, X. (2019). Analysis of Ship Detection Performance with Full-, Compact- and Dual-Polarimetric SAR. Remote Sensing, 11(18), 2160. https://doi.org/10.3390/rs11182160