Abstract
High temperatures in urban areas cause a significant negative impact on the residents’ health. In a megacity such as Beijing, where both the land cover and social composition of residents are highly spatially heterogeneous, understanding heat vulnerability at a relatively fine scale is a prerequisite for place-based heat intervention actions. Both principal component analysis (PCA) and equal-weighted index (EWI) are commonly used in heat vulnerability studies. However, the extent to which the choice of these approaches may impact the results remains unclear. Our study aimed to fill this gap by estimating heat vulnerability at the jiedao scale (the smallest census unit) in Beijing based on socioeconomic characteristics, heat exposure, and the use of air conditioners. Our results show that the choice of methods had a considerable impact on the spatial patterns of estimated heat vulnerability. PCA resulted in a ring-like pattern (high in the central and low in the suburb), whereas EWI revealed a north–south discrepancy (low in the north and high in the south). Such a difference is caused by the weighting scheme used in the PCA. Our findings indicate that heat vulnerability pattern revealed by a single measure needs to be interpreted with caution because different measures may produce disparate results.
1. Introduction
When high temperatures occur, they induce the onset of death due to certain types of diseases. For instance, the heat wave in Beijing in 2010 caused an increase in total population mortality [1] and an increase in emergency cases [2]. In the same year, the heatwave also caused massive loss of life and economic costs to Russia [3]. The heat wave in France in August 2003 caused more than 15,000 deaths [4]. A study in the US showed higher mortality risk from heat waves that were more intense or longer, or heat waves occurring earlier in summer [5]. The urban heat island effect aggravates the adverse effects of high temperatures on the health of urban residents [6,7].
China has experienced rapid urbanization [8] and aging; its urban population exceeded 50% in 2010 and will reach 77.5% by 2050 [9]. For example, the population of Beijing has increased by 58% since 2000 (Website of Beijing Municipal Bureau of Statistics); the percentage of elderly people aged 65 and over in China who live in urban areas rose from 33.38% in 2000 to 43.94% in 2010 (United Nations Demographic Yearbook System—Population Census Datasets). This means that the urban population affected by high temperatures is increasing. In addition, anthropogenic heat release has been shown to be an important factor enhancing the urban heat island effect [10].
Studies have found that the heterogeneity of temperature and the heterogeneity of socioeconomically vulnerable people are largely correlated, leading to the most vulnerable people being exposed to the most severe heat or heat waves, which exacerbates the health costs for vulnerable people [11]. Therefore, it is especially important to locate vulnerable populations and to provide more accurate resource allocation schemes to reduce the adverse health effects of high temperatures. The heat vulnerability assessment is aimed at solving this problem. Heat vulnerability studies estimate the health risks to vulnerable residents during high-temperature periods, which helps decision-makers locate vulnerable areas and populations and optimize resources to reduce health consequences due to high temperatures.
Regarding how the heat vulnerability index is built, the current research approaches can be summarized into two main paradigms: one is by directly giving the weight of each indicator, and the other is by calculating weights for indicators through statistical analysis. The essence of the first approach is that the weights of the variables are preset (usually, variables’ weights are equal); these variables are added to or superimposed onto a map; and areas exceeding a certain value, or variables that are above average or exceed a certain number [11,12] will be recognized as a heat vulnerability area. The second approach for assessing heat vulnerability is the comprehensive index approach [13,14,15,16,17], which uses a combination of large numbers of known risk factors to represent the heat vulnerability of the community. Researchers often use principal component analysis (PCA) [13,14,16,18,19] to aggregate selected risk predictors into fewer factors to simulate population vulnerability. This allows for a comparison of the heat vulnerability of different communities and the classification of communities based on vulnerability (e.g., low and high). In general, researchers tend to use PCA when the variables are abundant. The calculated component score coefficient matrix can be used to derive the final factor score equation. The weight of each variable can be obtained from the table so that the influence of different variables on the result can be obtained.
In terms of indicators, the current research is mainly based on statistical data in databases such as censuses. Scholars from all over the world have evaluated the heat vulnerability of populations based on existing epidemiological and expert opinions, combined with the actual availability of data (see Table 1). Indicator selection needs to consider the heterogeneity of the region, the objectivity and the availability of data, and the actual situations in different countries. Therefore, the selection of evaluation indicators has not yet formed a unified standard, but there is a great similarity in the categories. The categories of variables are age, income, education, poverty, ethnicity, health status, and air conditioner ownership [11,13,14,15,18,20]. The most common indicator for assessing exposure is land surface temperature (LST), followed by normalized difference vegetation index (NDVI), non-vegetation coverage (area), impervious ratio, and normalized difference built-up index (NDBI) [11,13,14,15,16,21]. Many studies are based on local situations and the availability of data using local characteristics, such as tribes and caste conditions [20]. From the research scale, foreign studies often use census tract or block group [13,14] and neighborhood [21] as the basic research units, and domestic studies are usually based on cities [22,23], districts, and counties [16,24].

Table 1.
Summary of indices and variables for heat vulnerability assessment.
PCA is a dimensionality reduction approach that identifies a few integrated variables from multiple variables (indicators) to achieve data reduction. However, PCA extracts factors based on the statistical characteristics of the data. The variables that make up a factor are sometimes derived from variables of different categories. Sometimes, the variables of the same category are fitted into different factors, which makes the interpretation of the results more difficult. The calculation process of the equal weight index (EWI) approach is divided into two steps. One is to measure the distribution of variables by dividing the distance between the data points of the variables and the mean by the standard deviation (STD). The second is to distinguish the direction of influence of the variable—positive or negative—and then add the variables up with equal weights to get the index. Its calculation process is concise, and it is easy to operate and understand the results. However, to what extent the choice of these approaches may impact the resulted estimation of heat vulnerability remains unclear. Therefore, in this study, we aimed to compare the performance of two commonly used approaches, PCA and EWI, in assessing the urban heat vulnerability in Beijing in 2010.
2. Materials and Methods
2.1. Study Area
Beijing is an international metropolis and a political and cultural center of China. To address our research questions, we focused on the urban area of Beijing, which is in the center of the Beijing metropolitan area (Figure 1), where both land cover and social composition of residents are highly spatially heterogeneous. The study site is approximately 1384 km2, which is 8.4% of the total area of Beijing. It includes six districts and 130 subdistrict units (i.e., neighborhoods, referred to as jiedao in China). We used jiedao as our analysis unit in this study and used the term “jiedao” in the following text for the convenience of discussion. The total population of the urban area was approximately 1.25 million in 2016, which is 57.4% of the total population. Therefore, based on the actual situation in Beijing, it is urgent to carry out research on the fine-scale heat vulnerability pattern and coping strategies in Beijing.

Figure 1.
Study area, composed of six districts and 130 jiedao (i.e., a city block, which is the smallest census unit).
Beijing has a continental monsoon climate with four distinct seasons. The annual precipitation was 669.1 millimeters in 2016. The average monthly temperature ranged from −3.1 °C in January to 26.7 °C in July. Heat waves were common in the summer (June to August), which not only caused discomfort for the residents but also posed a severe health burden to people vulnerable to excess heat.
2.2. Data Sources
2.2.1. Land Surface Temperature and Normalized Difference Vegetation Index
We used the mean land surface temperature (LST) and normalized difference vegetation index (NDVI) to describe the heat environment for each jiedao. LST has been widely used in human health [27] and heat vulnerability studies [13,14,15,18,20], since it is easily available and adequately represents local temperature variability, showing a higher spatial heterogeneity. NDVI is considered to be a good indicator of soil moisture, rainfall, vegetation biomass and productivity, and neighborhood greenness [28], which is widely used in the field of heat vulnerability to describe the vegetation of the environment [13,14,15,18].
The LST data were derived from the MOD11A2 8-day product with 1 km resolution. We used the images from July 4, 12, and 20, 2010. The image from July 28 was excluded because of errors and null values. We calculated the mean LST for each pixel based on the three images and the arithmetic mean for each jiedao.
The NDVI measures green vegetation abundance [29] for each 1 km pixel. We derived the NDVI data from the MOD13A2 16-day product taken on July 12 and 28, and calculated their mean value. Then, we calculated the arithmetic mean for each jiedao.
2.2.2. Jiedao Socioeconomic Conditions
Table 2 lists the heat vulnerability variables (and abbreviations) in this analysis, as well as the data sources, time attributes, mean, and standard deviation of the data. We selected widely recognized variables that characterized heat vulnerability from the literature. The demographic and socioeconomic variables investigated included age, income, education, living alone, physical condition, and air conditioners. We used average household income, literacy, number of high school graduates, college graduates, people younger than 5 or older than 65 years old, people who live alone, and unhealthy elderly people (older than 60) to describe the jiedao socioeconomic conditions. Unhealthy elderly people were defined as people over 60 years old who considered themselves unhealthy during the past month. We obtained data for all the indicators except for average household income from the 2010 national census, which was not surveyed during the census at the jiedao scale. The average household income was only available at the district level, which is a scale larger than the jiedao. To describe income variation among the jiedao, we estimated average household income for the jiedao by combining district income with average rent for the jiedao. More details about the estimation can be found in the study by Tu et al. [30].
Table 2.
Categories, variables, sources, means, and standard deviations (STDs) of heat vulnerability data at the jiedao scale (n = 130).
From the perspective of residents, the most effective means of reducing the heat vulnerability of residents is the use of air conditioners [31,32]. We included air conditioner ownership to represent an adaptation to excess heat. We obtained the proportion of households with air conditioners for each district and assigned that value to all the jiedao located within the district (Beijing Area Statistical Yearbook 2011).
2.3. Heat Vulnerability Index
Although most of the current heat vulnerability studies used the PCA method, this paper hopes to try to use the EWI method to evaluate the heat vulnerability and compare the results with the former. There are two reasons for this: First, this method is convenient for evaluating different aspects of heat vulnerability, and the meaning is easy to understand. Second, the calculation method is simple and clear, it is easy to quickly know which aspect of the socioeconomic environment system is vulnerable, and it is convenient for decision-making.
To remove the effect of the unit and reduce the impact from outliers, we calculated the Z scores of the 11 heat vulnerability variables.
We adjusted the positive/negative signs of the indicators. According to the previous literature, we assumed that the trend of average income, percentage of population with a college education or above, NDVI, and number of air conditioners per 100 households were opposite to the trend of heat vulnerability, so the data normalized by these four variables were reversed.
We considered a value within ± 0.25 STD of the mean value as the “average level” and assigned it a score of 0. For each 0.5 STD away from the “average level”, the score increased/decreased by 1 depending on the direction. As a result, we generated the 11 variables into 11 indicators ranging from −3 to 3 (Table 3). The higher the absolute value, the further it deviated from the average level.
Table 3.
Rules for assigning values when calculating the heat vulnerability index (HVI).
Then, we calculated the mean of the percentage of illiterate population, the percentage of the population with below high school education, and the percentage of population with a college education or above as one education indicator. The calculation used the following formula:
Z education = 1/3 Z Illiteracy + 1/3 Z Less than HS + 1/3 Z College or above
Finally, we calculated the heat vulnerability index (HVI) as the mean value of the nine indicators, including the education indicator and others. We denoted this HVI as the HVI-EWI in the following text. The HVI-EWI ranges from −3 to 3, with a score of −3 indicating the lowest heat vulnerability and 3 indicating the highest heat vulnerability.
2.4. Analytic Methods
PCA is frequently used in heat vulnerability studies for its capacity to convert correlated variables into linearly uncorrelated principal components and to reduce dimensions [13,15,18]. To rule out the effects of the different units, before conducting the PCA we standardized all the variables. Then, we used principal component analysis to reduce the number of variables and create independent components in SPSSTM 23. Next, we use a varimax rotation to minimize the number of original variables that loaded highly on any one factor and increase the variation among factors. For each factor resulting from PCA, we assigned scores from −3 to 3 according to their distance from the average level, in a similar way as described above. Finally, we calculated the mean value of all the factors of the HVI, named the HVI-PCA. The HVI-PCA has the same range as the HVI-EWI, with −3 indicating the lowest heat vulnerability and 3 indicating the highest heat vulnerability. We visualized the two indices in ArcGISTM 10.0.
3. Results
3.1. Spatial Pattern of Heat Vulnerability in Beijing
In the overall spatial pattern, both approaches indicated that the central area had higher heat vulnerability than the surrounding areas (Figure 2). We visualized the heat vulnerability patterns obtained by the two approaches, using natural breakpoints to classify heat vulnerability into five levels. While both approaches indicated that the central area had higher heat vulnerability than the surrounding areas, PCA resulted in a ring-like pattern (high in the central and low in the suburb), whereas EWI revealed a north–south discrepancy (low in the north and high in the south) (see Figure 2). Figure 2a shows the HVI-PCA pattern for the main urban area of Beijing. Using the natural breaks method to classify these jiedao, we found that 14 of these had the highest HVI values (1.25–1.75). The overall trend of HVI-PCA is higher at the center and lower at the periphery, and higher in the east and lower in the west. The highest vulnerability jiedao can be found in Dongcheng, Xicheng, Chaoyang, and Fengtai districts. The lowest vulnerability jiedao can be found in Haidian and Chaoyang districts. Figure 2b shows the HVI-EWI pattern of heat vulnerability in the main urban area across different jiedao. In general, the trend of HVI-EWI is higher in the center and lower in the periphery, and higher in the south and lower in the north. Using the natural breaks method to classify these jiedao, we found that 13 of these had the highest HVI values (0.86–1.37). The higher vulnerability mainly can be found in Xicheng, Shijingshan, and Fengtai districts. The jiedao with the lowest HVI values are all located in the Haidian district.
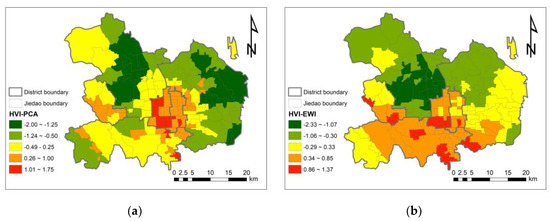
Figure 2.
Spatial pattern of heat vulnerability in Beijing assessed by principal component analysis (PCA) approach (a) and equal-weighted index (EWI) approach (b).
Using the PCA evaluation results minus the EWI evaluation results, we obtained a difference map between the two, as shown in Figure 3. Compared with the results estimated by the EWI approach, the PCA results tended to overestimate the vulnerability of the central area and to underestimate the vulnerability of the surrounding areas in the north, east, and south (Figure 3). The jiedao where the PCA approach is more inclined to estimate higher results are concentrated in the southern part of Haidian district and the northern part of Xicheng district, and those more inclined to estimate lower results are concentrated in the eastern part of Chaoyang district.
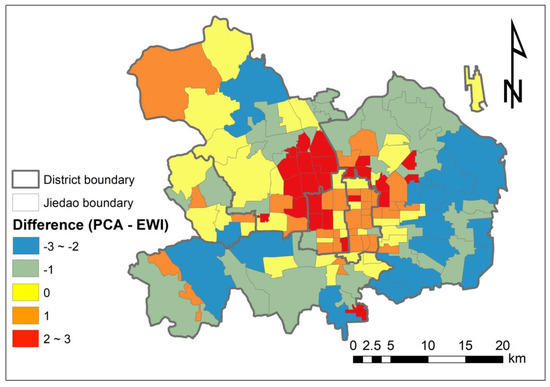
Figure 3.
Spatial pattern of the difference between the heat vulnerability index (HVI) calculated using the principal component analysis (PCA) and using the equal-weighted index (EWI) approach.
3.2. Comparing PCA and EWI
A principal component analysis and a varimax rotation yielded a list of factors. We included the factors with initial eigenvalues larger than 1: the first factor included illiteracy, unhealthy seniors, air conditioners, and income variables; the second factor included LST and NDVI; the third factor included living alone and education; and the fourth factor included age. (Table 4).
Table 4.
Variable weights and factor loadings for heat vulnerability variables for various factors based on data from 130 jiedao.
The cumulative contribution of the four component eigenvalues was 77.50%; that is, the 77.5% variance of the original indicators can be explained by these four common factors (see Table 5). Among them, the first factor explained 32.80% of variance, followed by 22.70%, 12.57%, and 9.44% for the second, third and fourth factors, respectively.
Table 5.
The number of extracted factors, eigenvalues, and percentages of variance explained.
We explored the spatial distribution characteristics of each factor (Figure 4). The dominant variables of the first factor are illiteracy, unhealthy seniors, air conditioners, and income. Figure 4a shows the spatial pattern of the first factor at the jiedao scale. The jiedao with the highest score range from 2 to 3, and are mainly distributed in the western part of our study area and the southern part of the urban core area—the original Chongwen district and Xuanwu district. The lower scoring jiedao are concentrated in the southeastern part of Haidian district and the northwestern part of Chaoyang district. The dominant variables of the second factor are LST and NDVI. Figure 4b shows the spatial pattern of the second factor on the jiedao scale. The jiedao with the highest scores range between 2 and 3, and are mainly distributed in the Haidian and Chaoyang districts. The jiedao with the lowest scores range between –3 and –2, and are mainly concentrated in the Haidian and Chaoyang districts. The dominant variables of the third factor are living alone, having less than high school education, and having college education or above. Figure 4c shows the spatial pattern of the third factor on the jiedao scale. The highest and lowest values for this factor are mainly concentrated in Haidian district and Chaoyang district. The dominant variables of the fourth factor are age < 5 and ≥ 65. Figure 4d shows the distribution of the fourth factor on the jiedao scale. Regarding this aspect, the most vulnerable jiedao are mainly concentrated in the central part of the Chaoyang district, while the lower scoring areas, which are less vulnerable regarding this aspect, are mainly distributed on the edges of urban areas.
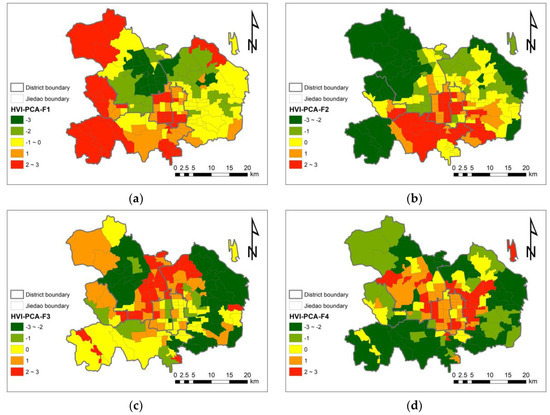
Figure 4.
Spatial pattern of four factors for heat vulnerability using the PCA approach. Factor 1: illiteracy/unhealthy/air conditioners/income (a); Factor 2: LST/NDVI (b); Factor 3: living alone/below high school education/college education or above (c); Factor 4: population < 5/population ≥ 65 (d).
The actual value of the heat vulnerability index (HVI-PCA) synthesized by the above four heat vulnerability factors ranged from −2 to 1.75; the average value was 0.094, and the STD was 0.87. Correspondingly, the values for the HVI-EWI ranged from −2.33 to 1.37; the average was 0.0048, and the STD was 0.78.
We also visualized the spatial patterns of indicators used in the EWI approach (Figure 5). Indicators describing income, education, and unhealthy elderly population are characterized by high values in the center of the city and low values in the periphery of the city. In contrast, the percentage of population < 5 years of age presents a high value in the surrounding areas of the city and a low value in the city center. The spatial pattern of the percentage of the population who live alone has a strong spatial heterogeneity but does not reflect an obvious discrepancy in areas surrounding the center. The number of air conditioners per 100 households varies from north to south, with more in the north and less in the south. The pattern of population ≥ 65 years of age presents a ring-shaped, high-value area at the edges of Dongcheng district and Xicheng district. The LST is higher in the center and the south of the study area, and lower in the north of Haidian district. As expected, we found that income and education had a similar distribution, and LST and NDVI had an opposite spatial pattern.
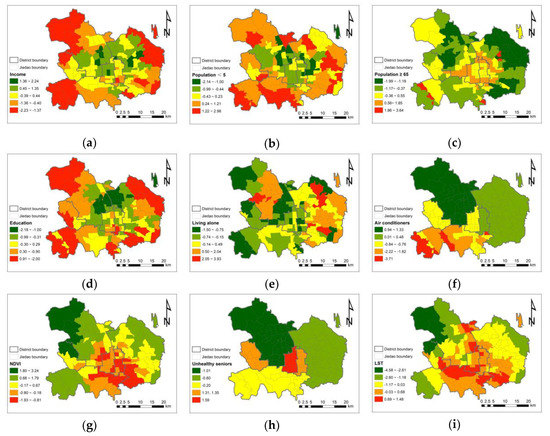
Figure 5.
Spatial pattern of heat vulnerability variables in Beijing: (a) income; (b) percentage of the population under the age of five; (c) percentage of the population aged 65 and over; (d) education status; (e) percentage of persons living alone; (f) number of air conditioners per 100 households; (g) NDVI; (h) unhealthy elderly people over 60 years of age; (i) LST. Among them, education factor is composed of the percentage of the population that is illiterate (positive indicator), the percentage of the population with high school education (positive indicator), and the percentage of the population with college education and above (negative indicator).
The main difference between the two approaches is that the weights of the indicators are different. The coefficients for the EWI approach are equal, while the PCA approach assigns different weights to each indicator during the generation of the factors (see Table 6). To present the difference between the two approaches more clearly, we compared the absolute values of the coefficients of the two approaches and normalized the absolute values of the coefficients of the PCA approach. The weights for education, the percentage of elderly people over 65 years old, and the percentage of unhealthy elderly people over 60 years old increased greatly.
Table 6.
Comparison of coefficients between principal component analysis (PCA) and equal-weighted index (EWI) approaches.
Comparatively, with the coefficients for the EWI approach, the weights for the above factors increased to 100.0%, 59.5%, and 37.3%, respectively; the weight of percentage of children under 5 years old was nearly unchanged, decreasing by 2.7%; the weights for income, air conditioners, and LST significantly decreased by 82.0%, 45.2%, and 38.7%, respectively; and the weights for solitary living and NDVI variables decreased slightly by 17.7% and 10.5%, respectively (see Table 6).
4. Discussion
4.1. Spatial Patterns, Similarities, and Divergence of Heat Vulnerability in Beijing
According to our study, the spatial heterogeneity of heat vulnerability in Beijing is very strong (Figure 3), which is consistent with many studies on urban heat vulnerability [11,13,14,15,17,18]. This study used two approaches to assess the spatial pattern of heat vulnerability in Beijing. The results show that the central part of the city is a region with high heat vulnerability, which is consistent with most of the existing studies on urban heat vulnerability [13,14,18]. Among the six main urban areas in Beijing, Dongcheng district and Xicheng district have higher heat vulnerability, and Chaoyang district and Haidian district have lower heat vulnerability. These results are similar to those of Zhan and Wang [33]. In the center jiedao of Beijing, LST values are higher, NDVI values are lower, and the proportion of elderly and unhealthy older people are higher. This shows that these streets are indeed worthy of more attention from policymakers, who should formulate strategies that consider the actual situation of the jiedao to improve the well-being of residents.
4.2. Reasons for Differences between the PCA Approach and the EWI Approach
Evaluating heat vulnerability using the PCA and EWI approaches, we found that the choice of approach had a considerable impact on the spatial patterns of estimated heat vulnerability. According to our results, weighting caused significant differences in the results, which is in contrast with the results obtained by Räsänen [34], but consistent with those of Wiréhn et al. [35] and Reckien [36]. PCA produced higher heat vulnerability in the central city and lower heat vulnerability in the outskirts compared with EWI. PCA produced a pronounced ring-like gradient from the center to the edges, and more spatial heterogeneities.
The resulting patterns of heat vulnerability varied among different studies, because the weights of the variables were different when being included in the model. The reason for the differences in weights is that the PCA approach forms a linear combination of some variables to reflect the information for most of the variables by reducing the dimensionality of the data. Variables are added with different weights in the process of forming a common factor. Based on the hypothetical variable selection, we can see in Table 6 that the weight of education in the PCA approach is relatively large; in addition, the percentage of the elderly population over 65 years old and the percentage of unhealthy elderly population over 60 years old are also larger, and the two partially overlap in the connotation, so under the premise that both variables are included in the calculation, the weight of the elderly population is also increased. That is, using the PCA calculation approach, if the number of indices expressing the same aspect increases, the variable of this aspect will inevitably occupy a larger weight in the later factor synthesis (Table 6). In the EWI approach, we assumed that different variables represented different aspects of heat vulnerability, and variables were treated equally during evaluation. The absolute values of the coefficients of the two approaches are compared in Table 6. This means that for many scholars performing heat vulnerability assessment, the practice of incorporating many variables into the model for dimensionality reduction will have an impact on the results. This reminds us that in future research on heat vulnerability assessment, in the selection of indicators, in addition to the availability of data, we also need to analyze the number of indicators for each category based on actual local conditions and epidemiology. It is important to study the extraction of fewer heat vulnerability variables that are more representative.
4.3. Limitations of This Study
First, limited by the availability of data, two of the 11 heat vulnerability variables selected in this study (number of air conditioners per 100 households and unhealthy elderly people over 60 years old) were district scale variables; the remaining nine were jiedao scale variables. In this study, we assigned the district scale values of these two variables to the jiedao scale. The difference in the data scales may have had an impact on our results because these two variables lack spatial heterogeneity in urban areas.
Second, the overall indicators of this study are not particularly rich, which may limit the results of the PCA to some extent. For instance, in terms of economic status, this study only used average income data but did not include poverty data. In terms of health, it is difficult to obtain data such as mortality or prevalence during high temperature events on a jiedao scale. Therefore, this study used the percentage of unhealthy seniors over the age of 60 to replace health indicators.
4.4. The Implications for Future Research and Urban Planning
There are some commonalities in the jiedao with high heat vulnerability that deserve our attention. At the same time, the dominant variables of the jiedao with the highest heat vulnerability are not the same. For instance, Tianqiao jiedao in the south of Xicheng district has the highest heat vulnerability using the PCA approach because the social vulnerability factor has the highest score, specifically because the percentage of unhealthy elderly people and the percentage of illiterate people are the highest. For this type of jiedao with high heat vulnerability, policymakers should focus on the adaptability to high temperatures and heat waves, and access to high-temperature information for unhealthy elderly people. As another example, the Dashilan jiedao in Xicheng district has the highest heat vulnerability when assessed using the EWI approach. The surface temperature is the highest in the jiedao, and the proportion of unhealthy elderly people and illiterate people is the highest. For this type of jiedao with high heat vulnerability, in addition to focusing on high temperature warning channels, it is also necessary to optimize the living environment. Specifically, the supply of green space should be increased or optimized so that public green space can better play the role of lowering the temperature and regulating the microclimate. This study measures the spatial pattern of heat vulnerability on the jiedao scale and provides decision makers with a scientific basis for targeted policy design for effective heat mitigation and intervention on a certain scale.
The spatial heterogeneity of heat vulnerability within the city is also worthy of our attention, for example in the Chaoyang district in the southern part of the study area (see Figure 3a). The jiedao in Chaoyang district are spatially adjacent to each other, but the heat vulnerability is distributed across four different levels, indicating that the difference in heat vulnerability is not only reflected in the gradient differences between urban and suburban areas. Within urban areas, heat vulnerability also has large spatial heterogeneity, so the corresponding operational policy recommendations should not only be made at the district scale but should also extend to the jiedao scale.
The current research on heat vulnerability was limited by the availability of health data, as only a few studies have verified the effectiveness of heat vulnerability assessment [15,37,38]. Similarly, our current work does not have appropriate health data at the jiedao scale, so the comparison of the two approaches could also help to adjust the weight of the heat vulnerability assessment in the future by comparing it with the corresponding health data. In the future, individual health data should be collected or obtained to verify the assessment of heat vulnerability, which will in turn help in optimizing heat vulnerability assessments and early warning systems to reduce health risks for vulnerable populations in certain regions, and subsequently to improve human well-being.
5. Conclusions
According to our study, both approaches indicated that the central area had higher heat vulnerability than the surrounding areas because of higher levels of heat exposure and more elderly residents. PCA resulted in a ring-like pattern (high in the central and low in the suburb) and EWI revealed a north–south discrepancy (low in the north and high in the south).
This study reveals the weight changes of variables and their impact on the PCA and EWI approaches when assessing heat vulnerability. The PCA approach determines different weights to the variables in the process of forming the common factors by reducing the dimensionality of the data. This study suggests that when the index is evaluated, if the value of a certain category indicator increases, the PCA approach will inevitably increase the total weight for certain indicators. Therefore, in future studies, scholars should optimize the representativeness of indicators and the number and proportion of different types of indicators. We argue that although PCA provided a useful tool to combine a large number of indicators into a few indices, the process was based solely on the statistical characteristics of the data. Our study suggests that results from a single measure of HVI need to be interpreted with caution, as different HVI indicators can lead to quite different results that may reflect distinct aspects of the complex phenomenon of heat vulnerability.
Author Contributions
Conceptualization, G.H. and J.W.; data curation, X.G.; formal analysis, X.G.; funding acquisition, G.H.; investigation, X.G.; methodology, X.G., G.H., and J.W.; project administration, G.H.; resources, G.H.; supervision, J.W.; visualization, X.G.; writing—original draft, X.G.; writing—review and editing, G.H., P.J., and J.W.
Funding
This work was supported by the National Natural Science Foundation of China (31670702).
Acknowledgments
We thank Xingyue Tu (Ph.D. student from the School of Natural Resources, Faculty of Geographical Science) and Jiajia Liu (master’s student from the School of Natural Resources, Faculty of Geographical Science) for providing information on various sources of socioeconomic datasets. We appreciate constructive suggestions from both anonymous reviewers and academic editors.
Conflicts of Interest
The authors declare no conflict of interest.
References
- Guijie, L. Heat Wave Impact on Mortality in Beijing in 2010. J. Environ. Hyg. 2015, 5, 525–529. [Google Scholar]
- Ya, L. Impacts of heat waves on emergency department visits in Beijing, 2010. South. China J. Prev. Med. 2014, 40, 322–326. [Google Scholar]
- Simmonds, I. What causes extreme hot days in Europe? Environ. Res. Lett. 2018, 13, 071001. [Google Scholar] [CrossRef]
- Fouillet, A. Excess mortality related to the August 2003 heat wave in France. Int. Arch. Occup. Environ. Health 2006, 80, 16–24. [Google Scholar] [CrossRef] [PubMed]
- Anderson, G.B.; Bell, M.L. Heat waves in the United States: Mortality risk during heat waves and effect modification by heat wave characteristics in 43 US communities. Environ. Health Perspect. 2010, 119, 210–218. [Google Scholar] [CrossRef]
- Rosenthal, K. Evaluating the Impact of the Urban Heat Island on Public Health: Spatial and Social Determinants of Heat-Related Mortality in New York City. Ph.D. Thesis, Columbia University, New York, NY, USA, 2010. [Google Scholar]
- Tan, J. The urban heat island and its impact on heat waves and human health in Shanghai. Int. J. Biometeorol. 2010, 54, 75–84. [Google Scholar] [CrossRef]
- Ma, Q. Quantifying spatiotemporal patterns of urban impervious surfaces in China: An improved assessment using nighttime light data. Landsc. Urban. Plan. 2014, 130, 36–49. [Google Scholar] [CrossRef]
- Wu, J.; Xiang, W.-N.; Zhao, J. Urban ecology in China: Historical developments and future directions. Landsc. Urban. Plan. 2014, 125, 222–233. [Google Scholar] [CrossRef]
- Simmonds, I.; Keay, K. Weekly cycle of meteorological variations in Melbourne and the role of pollution and anthropogenic heat release. Atmos. Environ. 1997, 31, 1589–1603. [Google Scholar] [CrossRef]
- Huang, G.; Zhou, W.; Cadenasso, M.L. Is everyone hot in the city? Spatial pattern of land surface temperatures, land cover and neighborhood socioeconomic characteristics in Baltimore, MD. J. Environ. Manag. 2011, 92, 1753–1759. [Google Scholar] [CrossRef]
- Aminipouri, M.; Knudby, A.; Ho, H.C. Using multiple disparate data sources to map heat vulnerability: Vancouver case study. Can. Geogr. Geogr. Can. 2016, 60, 356–368. [Google Scholar] [CrossRef]
- Reid, C.E. Mapping community determinants of heat vulnerability. Environ. Health Perspect. 2009, 117, 1730–1736. [Google Scholar] [CrossRef] [PubMed]
- Johnson, D.P. Developing an applied extreme heat vulnerability index utilizing socioeconomic and environmental data. Appl. Geogr. 2012, 35, 23–31. [Google Scholar] [CrossRef]
- Reid, C.E. Evaluation of a heat vulnerability index on abnormally hot days: An environmental public health tracking study. Environ. Health Perspect. 2012, 120, 715–720. [Google Scholar] [CrossRef] [PubMed]
- Bai, L.; Woodward, A. ; Cirendunzhu; Liu, Q.Y. County-level heat vulnerability of urban and rural residents in Tibet, China. Environ. Health 2016, 15, 3. [Google Scholar] [CrossRef] [PubMed]
- Harlan, S.L. Neighborhood microclimates and vulnerability to heat stress. Soc. Sci. Med. 2006, 63, 2847–2863. [Google Scholar] [CrossRef] [PubMed]
- Harlan, S.L. Neighborhood effects on heat deaths: Social and environmental predictors of vulnerability in Maricopa County, Arizona. Environ. Health Perspect. 2013, 121, 197–204. [Google Scholar] [CrossRef]
- Inostroza, L.; Palme, M.; de la Barrera, F. A Heat Vulnerability Index: Spatial Patterns of Exposure, Sensitivity and Adaptive Capacity for Santiago de Chile. PLoS ONE 2016, 11, 26. [Google Scholar] [CrossRef]
- Azhar, G. Heat Wave Vulnerability Mapping for India. Int. J. Environ. Res. Public Health 2017, 14, 10. [Google Scholar] [CrossRef]
- Jenerette, G.D. Micro-scale urban surface temperatures are related to land-cover features and residential heat related health impacts in Phoenix, AZ USA. Landsc. Ecol. 2016, 31, 745–760. [Google Scholar] [CrossRef]
- Yichen, W. Research on Urban Heat Wave Vulnerability Assessment under Climate Change; Beijing University of Civil Engineering and Architecture: Beijing, China, 2015. [Google Scholar]
- Xuemei, Z. Comparison of heat wave vulnerability between coastal and inland cities of Fujian Province in the past 20 years. Prog. Geogr. 2016, 35, 1197–1205. [Google Scholar]
- Pan, X. Incorporating social vulnerability to assess population health risk due to heat stress in China. Acta Geogr. Sin. 2015, 70, 1041–1051. [Google Scholar]
- Zhang, W.; Zheng, C.; Chen, F. Mapping heat-related health risks of elderly citizens in mountainous area: A case study of Chongqing, China. Sci. Total Environ. 2019, 663, 852–866. [Google Scholar] [CrossRef] [PubMed]
- Hu, L.; Wilhelmi, O.V.; Uejio, C. Assessment of heat exposure in cities: Combining the dynamics of temperature and population. Sci. Total Environ. 2019, 655, 1–12. [Google Scholar] [CrossRef] [PubMed]
- Jia, P.; Sankoh, O.; Tatem, A.J. Mapping the environmental and socioeconomic coverage of the INDEPTH international health and demographic surveillance system network. Health Place 2015, 36, 88–96. [Google Scholar] [CrossRef] [PubMed]
- Rhew, I.C. Validation of the normalized difference vegetation index as a measure of neighborhood greenness. Ann. Epidemiol. 2011, 21, 946–952. [Google Scholar] [CrossRef] [PubMed]
- Tucker, C.J. Red and photographic infrared linear combinations for monitoring vegetation. Remote. Sens. Environ. 1979, 8, 127–150. [Google Scholar] [CrossRef]
- Tu, X.; Huang, G.; Wu, J. Contrary to common observations in the west, urban park access is only weakly related to neighborhood socioeconomic conditions in Beijing, China. Sustainability 2018, 10, 1115. [Google Scholar] [CrossRef]
- Balbus, J.M.; Malina, C. Identifying vulnerable subpopulations for climate change health effects in the United States. J. Occup. Environ. Med. 2009, 51, 33–37. [Google Scholar] [CrossRef]
- Jenerette, G.D. Ecosystem services and urban heat riskscape moderation: Water, green spaces, and social inequality in Phoenix, USA. Ecol. Appl. 2011, 21, 2637–2651. [Google Scholar] [CrossRef] [PubMed]
- Ming-shun, Z.; Yi-chen, W. Research on Evaluation System of Heat Wave Vulnerability in Beijing City. Urban. Environ. Stud. 2015, 1, 16–33. [Google Scholar]
- Räsänen, A. Zoning and weighting in urban heat island vulnerability and risk mapping in Helsinki, Finland. Reg. Environ. Chang. 2019, 19, 1481–1493. [Google Scholar] [CrossRef]
- Wiréhn, L.; Danielsson, Å.; Neset, T.-S.S. Assessment of composite index methods for agricultural vulnerability to climate change. J. Environ. Manag. 2015, 156, 70–80. [Google Scholar] [CrossRef] [PubMed]
- Reckien, D. What is in an index? Construction method, data metric, and weighting scheme determine the outcome of composite social vulnerability indices in New York City. Reg. Environ. Chang. 2018, 18, 1–13. [Google Scholar] [CrossRef] [PubMed]
- Wolf, T.; McGregor, G.; Analitis, A. Performance Assessment of a Heat Wave Vulnerability Index for Greater London, United Kingdom. Weather. Clim. Soc. 2014, 6, 32–46. [Google Scholar] [CrossRef]
- Maier, G. Assessing the Performance of a Vulnerability Index during Oppressive Heat across Georgia, United States. Weather. Clim. Soc. 2014, 6, 253–263. [Google Scholar] [CrossRef]


© 2019 by the authors. Licensee MDPI, Basel, Switzerland. This article is an open access article distributed under the terms and conditions of the Creative Commons Attribution (CC BY) license (http://creativecommons.org/licenses/by/4.0/).