Article

Using Neural Network to Identify the Severity of Wheat Fusarium Head Blight in the Field Environment

1
National Engineering Research Center for Agro-Ecological Big Data Analysis & Application, Anhui University, Hefei 230601, China
2
Institute of Plant Protection and Agro-products Safety, Anhui Academy of Agricultural Sciences, Hefei 230031, China
3
Department of Resources and Environment, Shanxi Institute of Energy, Jinzhong 030600, China
4
Key Laboratory of Geospatial Technology for Middle and Lower Yellow River Regions (Henan University), Ministry of Education, Kaifeng 475004, China
*
Author to whom correspondence should be addressed.
These authors contributed equally to this work.
Remote Sens. 2019, 11(20), 2375; https://doi.org/10.3390/rs11202375
Submission received: 11 September 2019 / Revised: 8 October 2019 / Accepted: 9 October 2019 / Published: 13 October 2019
(This article belongs to the Section Remote Sensing in Agriculture and Vegetation)

Abstract

:
Fusarium head blight (FHB), one of the most important diseases of wheat, mainly occurs in the ear. Given that the severity of the disease cannot be accurately identified, the cost of pesticide application increases every year, and the agricultural ecological environment is also polluted. In this study, a neural network (NN) method was proposed based on the red-green-blue (RGB) image to segment wheat ear and disease spot in the field environment, and then to determine the disease grade. Firstly, a segmentation dataset of single wheat ear was constructed to provide a benchmark for the segmentation of the wheat ear. Secondly, a segmentation model of single wheat ear based on the fully convolutional network (FCN) was established to effectively realize the segmentation of the wheat ear in the field environment. An FHB segmentation algorithm was proposed based on a pulse-coupled neural network (PCNN) with K-means clustering of the improved artificial bee colony (IABC) to segment the diseased spot of wheat ear by automatic optimization of PCNN parameters. Finally, the disease grade was calculated using the ratio of the disease spot to the whole wheat ear. The experimental results show that: (1) the accuracy of the segmentation model for single wheat ear constructed in this study is 0.981. The segmentation time is less than 1 s, indicating that the model can quickly and accurately segment wheat ear in the field environment; (2) the segmentation method of the disease spot performed under each evaluation indicator is improved compared with the traditional segmentation methods, and the accuracy is 0.925 in the disease severity identification. These research results can provide important reference value for grading wheat FHB in the field environment, which also can be beneficial for real-time monitoring of other crops’ diseases under near-Earth remote sensing.

Graphical Abstract

1. Introduction

Fusarium head blight (FHB) caused by Fusarium graminearum Sehw, is a worldwide epidemic disease in global wheat production [1]. The disease is particularly serious in China’s Yangtze and Huai Rivers basin [2]. In addition, the toxin secreted by Fusarium is deoxynivalenol (DON), which can cause human and animal poisoning, seriously endangering human and animal food safety and health [3]. Since the severity of the disease cannot be accurately judged, it results in the use of excessive pesticides, greatly damaging the agricultural ecological environment [4]. Those methods currently employed for identifying wheat FHB are as follows. Firstly, the plant condition is visually inspected by personnel in the field. This method involves a large subjective influence and is time-consuming and laborious. Furthermore, the disease severity cannot be judged in a timely and accurate manner, greatly affecting its prevention and treatment. Secondly, FHB can be identified by hyperspectral imaging technology. The spectral reflectance of diseased plant tissues can effectively reflect the changes of plant chlorophyll content, water, morphology, and structure during the process of disease occurrence [5]. However, the technology consumes large amounts of memory and transmission bandwidth, which leads to a large increase in computational costs [6]. Moreover, the field environment has a greater impact on hyperspectral imagery acquisition [7]. Compared with traditional artificial inspection and hyperspectral technology, image processing technology based on RGB image is highly effective in disease identification, low in computational costs, and has a strong universality [8,9]. Currently, digital image processing technology based on RGB image has been widely used in wheat crops [10,11]. It provides an important reference for the study of wheat FHB identification based on RGB image. In this study, the segmentation accuracy of wheat ear in complex backgrounds is the key to solve the problem. The accurate segmentation of the disease spot is an important step to grade the disease severity precisely.
In recent years, researchers have proposed a large number of segmentation methods. Joulin et al. [12] used clustering to segment an image into foreground and background. The process could only segment images with a large difference between the foreground and background and leads to large segmentation noise. Aslam et al. [13] extracted a tumor from an image by an edge detection method, which exhibits satisfactory segmentation performance. However, this method has poor segmentation results when the contour was not obvious. These methods are overly dependent on color information and cannot effectively segment images in complex backgrounds [14]. With the development of deep learning network, a semantic segmentation network based on a fully convolutional network (FCN) was proposed and widely used for the segmentation problem in complex backgrounds [15,16]. Cui et al. [17] proposed an FCN-based end-to-end raft aquaculture area extraction model (UPS-Net), which can adaptively integrate boundary and context information to capture the boundary and background information of aquaculture areas from remote sensing images. Du et al. [18] used semantic segmentation networks to mine deep farmland background features. This method provides a thorough understanding of the background to achieve the segmentation of various crop types in crop plant areas. Wang et al. [19] solved the segmentation problem of crop leaf disease images in complex field environments by improved FCN and a higher extraction accuracy was obtained. Given that the FCN-based semantic segmentation network has strong self-learning ability, it can extract complex feature hierarchies from images [20]. Therefore, the FCN-based semantic segmentation network effectively mines the image features in complex backgrounds, however, semantic segmentation network is time-consuming for marking data [21]. Unsupervised methods do not require a lot of time on marking data and training, it is more effective than an FCN-based semantic segmentation network when dealing with plant images of healthy and diseased parts with certain differences. The unsupervised segmentation method of neural network (NN)-based pulse-coupled neural network (PCNN) was widely used in the segmentation of crop disease. For example, Wang et al. [22] proposed an unsupervised segmentation method based on a parallel-triggered PCNN algorithm to better segment corn disease spot with higher fitness and lower complexity parameters. Guo et al. [23] used the weighted sum of cross-entropy and image segmentation compactness degree as the fitness function of a shuffled frog leap algorithm to optimize the PCNN parameters. The lesion area from the plant disease image was accurately extracted. In a simple background, a PCNN-based segmentation method is more effective when segmenting the disease spot and the healthy part with some differences. In this study, the semantic segmentation network was used to accurately segment the wheat ear in a complex background and the PCNN-based segmentation method was used to segment lesions in a simple background.
The PCNN model was proposed by Johnson et al. [24] in 1999, which has been widely used in image processing to segment images [25,26]. The PCNN achieves image segmentation by igniting a neuron in the image and capturing the characteristics of the neurons of the same region and its similar properties. However, the parameters of the network require initialization and are difficult to set, greatly affecting the results. Therefore, an intelligent optimization algorithm must be used to automatically optimize the initialization settings of the parameters. For intelligent optimization algorithms, Kennedy [27] proposed a particle swarm optimization (PSO) algorithm based on the principle of social psychology. The particles move around the space where new parameter values are tested and clustered together in the best areas of the search space. Holland [28] proposed a genetic algorithm (GA) based on the idea of evolution to search for optimal solutions by simulating natural evolutionary processes. Karaboga et al. [29] proposed an artificial bee colony (ABC) algorithm by imitating the foraging behavior of bee colonies. The algorithm has a few parameter settings, fast convergence, high precision, and local and global bidirectional search functions for each iterative process. This strategy has become a research hotspot in the field of intelligent optimization algorithms. Cong et al. [30] enhanced an ABC algorithm by mutation operation using the global optimal solution as a guide. They then clustered the data with K-means in each iteration to obtain the best solution, which improved the ABC, and K-means enhanced the cluster solution. Bose et al. [31] used the fuzzy membership function to search for the optimal clustering center of the ABC algorithm and realize efficient optimization ability. Therefore, in this study, we optimize the PCNN parameter settings by improving the ABC algorithm to achieve the efficient segmentation of FHB.
The aim of the study mainly is to investigate a method for grading the severity of wheat FHB in the field environment. Firstly, a segmentation model of single wheat ear was established based on the FCN to accurately segment a wheat ear in the field environment. Based on the segmentation results, the PCNN with K-means clustering of the improved artificial bee colony (IABC) (IABC-K-PCNN) segmentation method was proposed to explore the possibility of the PCNN on the segmentation of disease spot after parameter optimization. The disease severity of single wheat ear under different methods was evaluated and analyzed through a series of evaluation indicators. The rest of this study was arranged as follows. Section 2 introduces the experimental method for data collection of wheat FHB based on RGB image in detail. Section 3 shows the experimental results of the proposed and other methods. Section 4 provides an in-depth analysis of the advantages and disadvantages of the developed method. Finally, Section 5 concludes this paper.

2. Materials and Methods

2.1. Study Area and Data Collection

Wheat was planted in the experimental base of the Anhui Academy of Agricultural Sciences (117°14′ E, 31°53′ N). The experimental period was from 26 April 2019 (flowering period) to 13 May 2019 (filling period). Two wheat areas included were inoculated with FHB and exposed to natural growth conditions. Using a Nikon D3200 SLR camera (effective pixels 6016 × 4000, focal length: 4 mm, aperture: f/2.2, exposure time: 1/2000 s) to collect image data under conditions of fine weather and few clouds, the possibility of image distortion due to weather conditions was eliminated (Figure 1). Among them, 1720 RGB images of wheat FHB in the field were collected. Since the semantic segmentation network based on the FCN requires a large amount of annotation data, 1600 images were selected for constructing a segmentation dataset of single wheat ear. The remaining 120 images were used to test the disease grading results of the proposed method. At the same time, the true disease grade of 120 images was manually identified. Among them, includes 60 disease images of the flowering period and 60 disease images of the filling period.
To provide an optimal model for wheat ear segmentation in the complex background and to ensure the accuracy of the training model, we designed an image acquisition experiment of single wheat ear in a targeted manner. In the field environment, only one wheat ear exists in the camera angle, and the shooting angle is 90°. To analyze the disease grade of FHB, we employed the GBT 15796-2011 Rules for Monitoring and Forecast of the Wheat Head Blight. We divided the disease severity into six grades based on the ratio of the disease spot to the whole wheat ear area. Grade 0: 0% ≤ R ≤ 1%, Grade 1: 1% < R ≤ 10%, Grade 2: 10% < R ≤ 20%, Grade 3: 20% < R ≤ 30%, Grade 4: 30% < R ≤ 40%, Grade 5: R > 40%, where R is the ratio of the disease spot to single wheat ear (Figure 1).

2.2. Image Preprocessing of Single Wheat Ear

In this study, 1600 images of single wheat ear were used to construct the segmentation dataset, which was manually marked in Windows drawing software. The dataset was provided as a benchmark for wheat ear segmentation. First, the outline of single wheat ear was marked with red (R: 225, G: 0, B: 0), and the binary image was obtained by filling the outline of the wheat ear with the morphological area fill [32] to mark the entire wheat ear. The edge of the binary image was padded with 0 to have an aspect ratio of 1 and finally resampled to 256 × 256 by bilinear interpolation [33]. And then, the preprocessing image was grayscaled [34] for network training (Figure 2).
In this study, all test images via the input image processing and were determined. First of all, the edge of the input image was padded with 0 to have an aspect ratio of 1. Moreover, the image was resampled to 256 × 256 pixels by the bilinear interpolation method, and finally was grayscaled as the test images.

2.3. Methods

In this study, an FCN-based segmentation model of single wheat ear was established to segment the test image. The segmentation image was binarized [35] to generate a binary image. The pseudo color image of wheat ear was synthesized by the multiplication of a binary image with the input image. IABC-K-PCNN was used to segment the disease spot of single wheat ear for the pseudo color image, and disease grade was calculated on the basis of the ratio of disease spot to the whole wheat ear. The workflow of the study was shown in the Figure 3.

2.3.1. Construction of Single Wheat Ear Segmentation Model

The single wheat ear segmentation network is established by a fine-tuned U-Net [36] network, which can effectively realize the semantic segmentation of wheat ears in the field. U-Net was built on the architecture of the FCN. The U-Net function is more powerful and suitable for multi-scale and large image segmentation in complex background. The output result is an image to facilitate the segmentation process in the latter part of this study. Therefore, the single wheat ear segmentation network based on U-Net was established in this study (Figure 4). Building a segmentation model of single wheat ear based on the single wheat ear segmentation network using the segmentation dataset of single wheat ear. The dataset was divided into 1120 training sets and 480 validation sets. The specific parameters were set to: learning rate = 0.001, batch size = 20, epochs = 30, steps_per_epoch = 500. Among them, learning rate determines how fast the parameter moves to the optimal value; batch size indicates the number of samples taken in the training set for each training batch; epochs indicates the total number of rounds of training; steps_per_epoch indicates the number of batches sent to the training in an epoch. The training time is 2.62 h, the test time is less than 1 s, and segmentation accuracy is 0.981. The result showed that the model can be used for the wheat ear segmentation in the field. In this model, the input image size was 256 × 256, and the output was a 256 × 256 grayscale image of single wheat ear. The black area represents the background area and the rest is single wheat ear. The edge of the image needs to be filled with 0 to make the aspect ratio 1. Furthermore, the image size was adjusted into 256 × 256 by bilinear interpolation.
The left side of the training network consists of nine 3 × 3 convolution layers and four 2 × 2 maximum pooling layers. The right side contains nine 3 × 3 convolution layers, one 1 × 1 convolution layer, and four 2 × 2 deconvolution layers. The convolution result of each convolution layer was filled with 0 to ensure that the input and output sizes remain unchanged, and rectified linear unit nonlinearity (ReLU) as the activation function. We employed Python 3.5.4, IDE: PyCharm 2017, OS: Ubuntu 18.04 64-bit, CPU: Intel i7-6800K 3.40GHz, GPU: NVIDIA GeForce GTX 1080 Ti, RAM: 16 GB as the working environment of the single wheat ear segmentation model.
On the basis of the segmentation result, the resulting image was binarized and restored to a pseudo color image of single wheat ear (Equations (1)–(3)), which was used as the target image for the segmentation of the disease spot.
R = R × I B W
G = G × I B W
B = B × I B W  
where R’ is a pseudo color red channel, G’ is a pseudo color green channel, B’ is a pseudo color blue channel, R is the red channel of the input image, G is the green channel of the input image, B is the blue channel of the input image, and IBW is a binary image of single wheat ear.

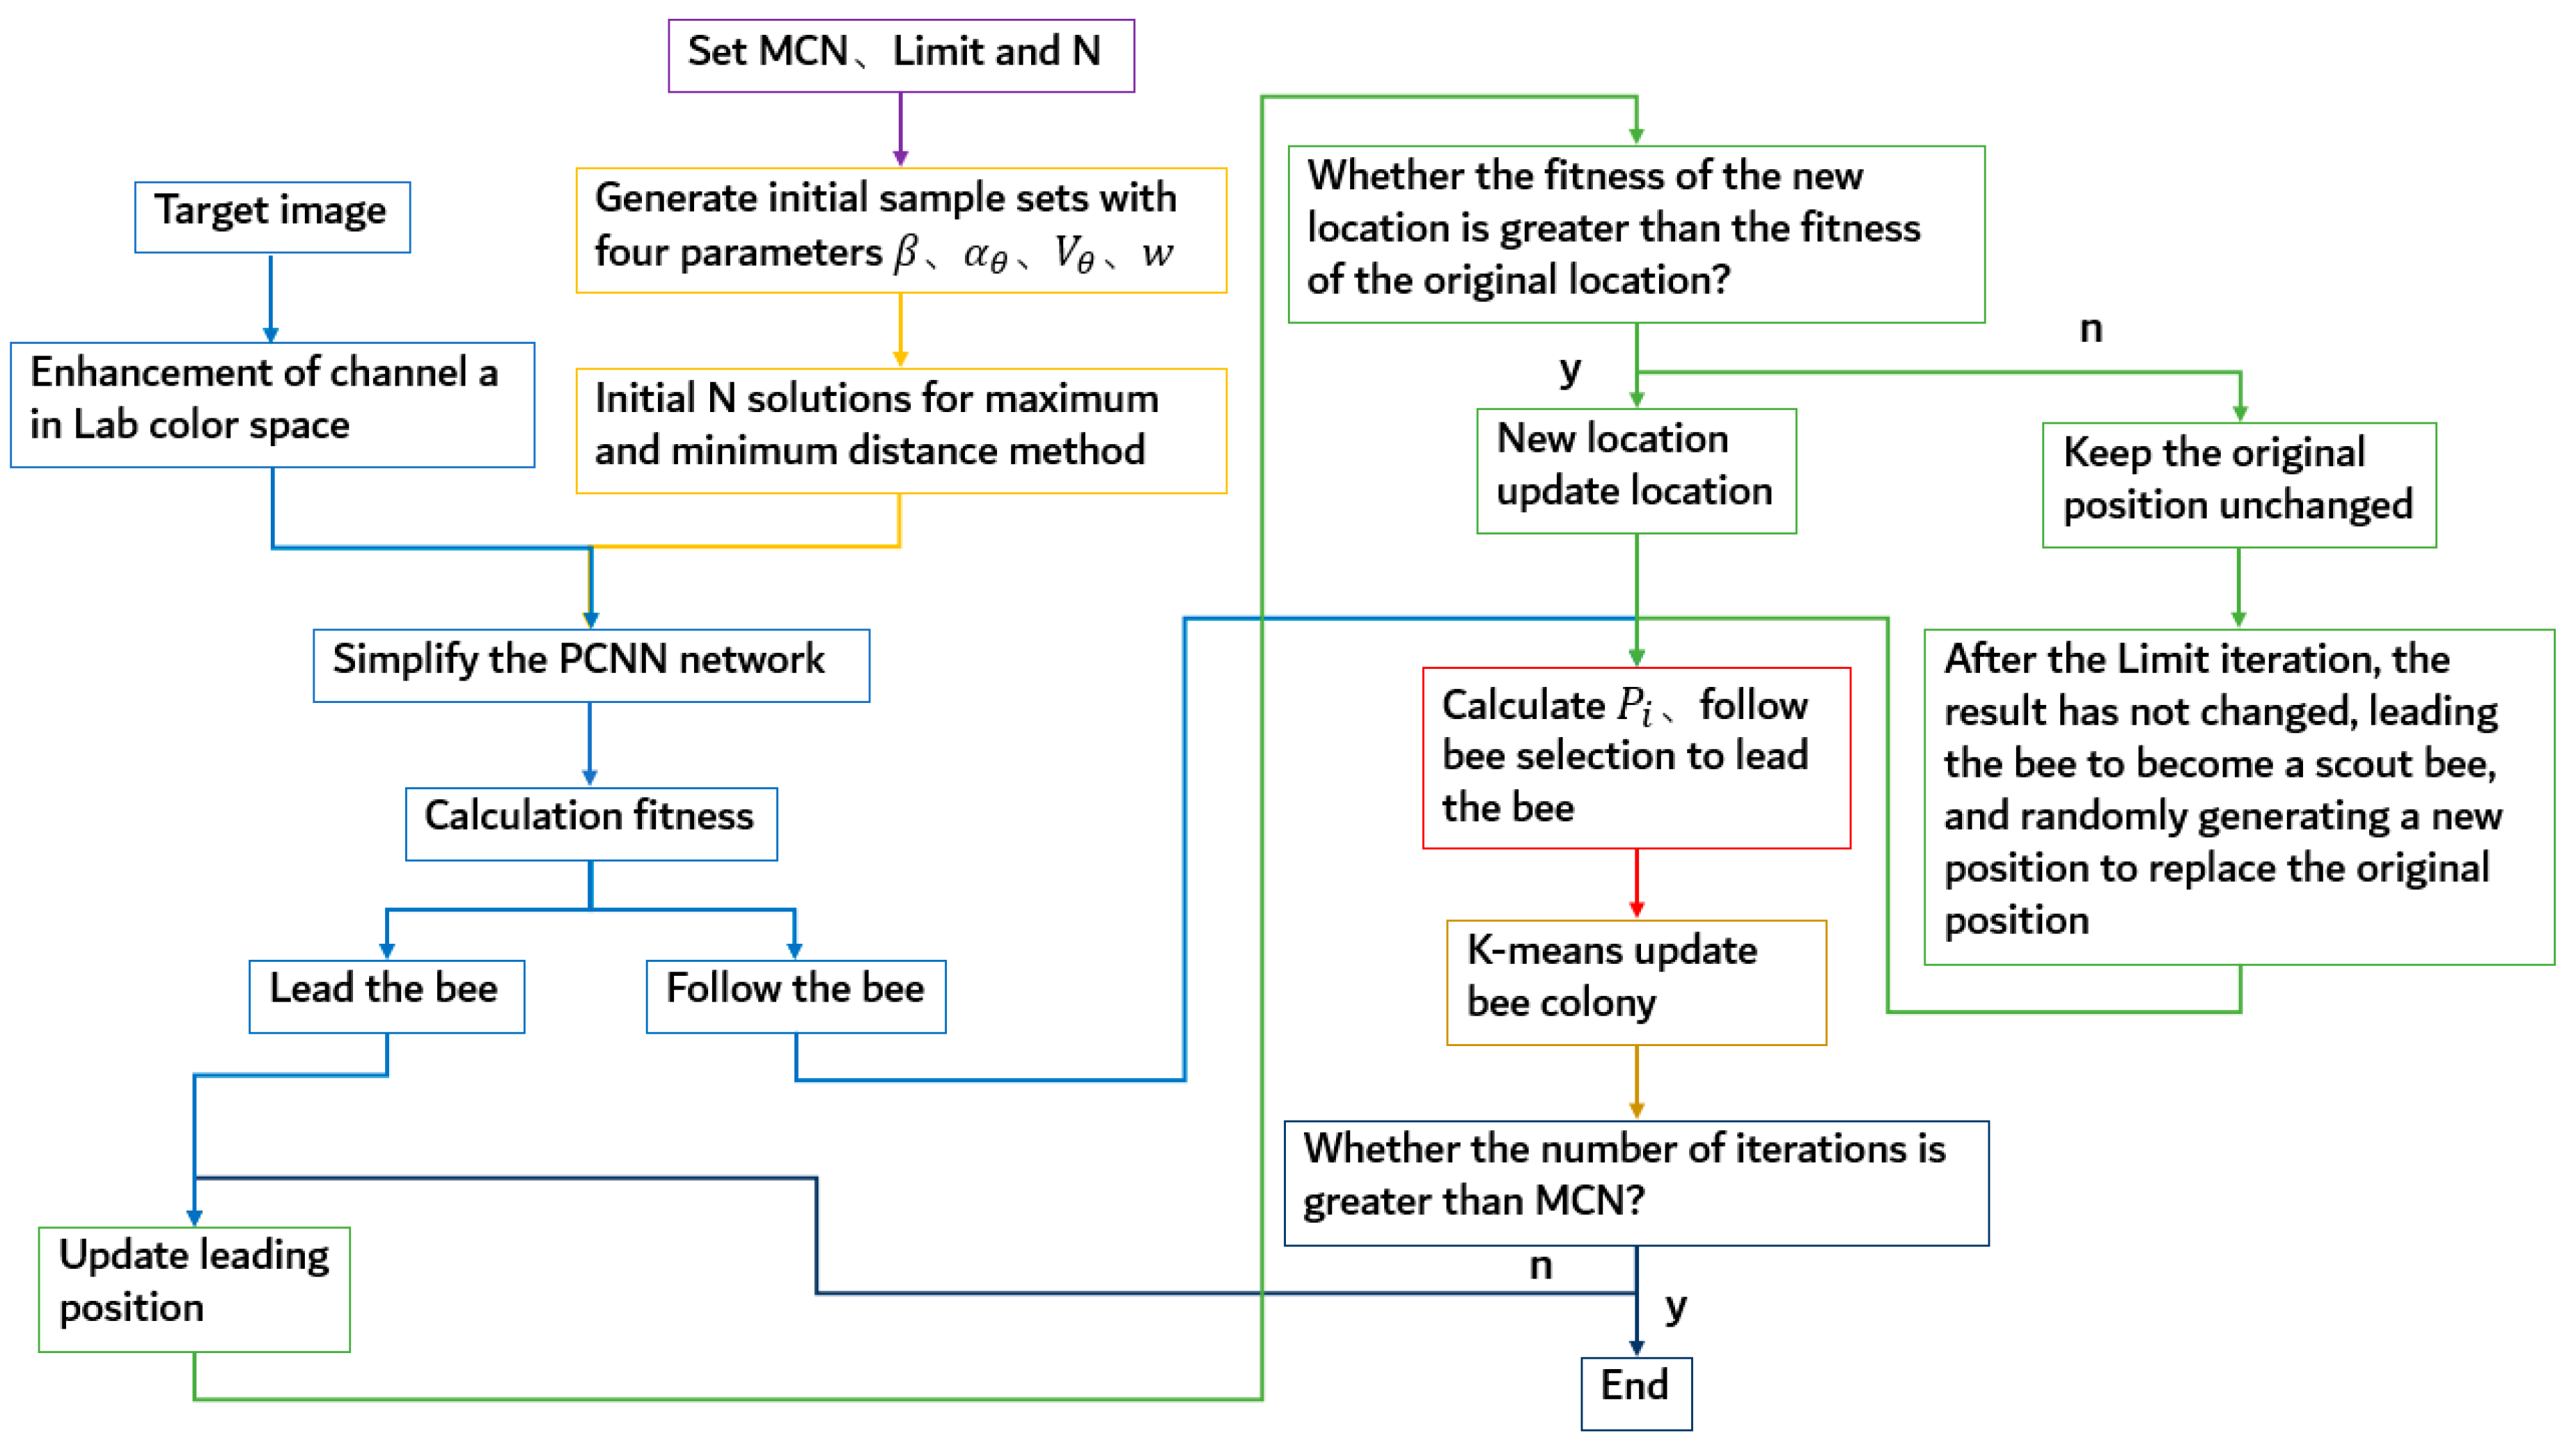
2.3.2. Segmentation Method of IABC-K-PCNN

Based on the above target image, we proposed the IABC-K-PCNN segmentation method to segment the disease spot of single wheat ear. PCNN is a simplified neural network model based on cat’s visual principle [37]. PCNN greatly affects the image segmentation results due to a large number of standard PCNN model parameters [38] and the difficulty in setting each parameter. Numerous parameters also increase the amount of computation, and real-time processing is not applicable. Therefore, this study used the simplified PCNN model [39] (Equations (4)–(8)).
F i j ( n ) = S i j
L i j ( n ) = k , l W i j , k l Y k l ( n 1 )
U i j ( n ) = F i j ( n ) ( 1 + β L i j ( n ) )
Y i j ( n ) = { 1                 U i j ( n ) > θ i j ( n 1 ) 0                                                               o t h e r s    
θ i j ( n ) = e α θ θ i j ( n 1 ) + V θ Y i j ( n )
where F i j ( n ) is the feedback input; S i j is the external input excitation; L i j ( n ) is the connect input; U i j ( n ) is the internal activity term; Y i j ( n ) is the pulse output value; θ i j ( n ) is the dynamic threshold; W i j , k l is the connection weight matrix; β is the connection coefficient; a n d   V θ and Y i j are the amplitude constants and time decay constants of the dynamic threshold, respectively.
Only four parameters, namely, β ,   α θ ,   V θ , and W i j , k l are difficult to set. For improvement, these parameters should be automatically set. In this study, the K-means clustering of the IABC (IABC-K) algorithm was used to optimize the parameters. Compared with the ABC algorithm, IABC-K can better initialize the bee colony, optimizes the fitness function for improved image segmentation, and introduces the global factor position to update equation for increased accuracy. When the honey source is updated, the K-means clustering algorithm [40] is further optimized to find the optimal solution. The principle of IABC-K-PCNN is shown in the Figure 5.
The specific process is as follows:
(a) The maximum number of iterations (MCN), control parameter Limit, initial solution number M, and the feasible solution N are set.
(b) The initial sample set is generated by four parameters, namely, β , α θ , V θ , and w . The initial sample set has a total of M solutions, and the Equation is:
X i , j ( β , α θ , V θ , w ) = φ · rand ( 0 , 1 )
where:   X i , j ( β , α θ , V θ , w ) is the sample set corresponding to the four parameters β , α θ , V θ ,   w respectively, = 1, 2,…, 50, j = 1, 2,…, N; φ is the product coefficient, where β [0,1], V θ [0,255], α θ [0,1], W i j , k l = [ w   1   w ; 1   0   1 ; w   1   w ] ,   w [ 0 , 1 ] .
The sample set was initialized by the maximum and minimum distance method [41], and N initial feasible solutions are generated.
(c) To obtain improved image segmentation results, we used the linear weighting function of minimum cross-entropy [42] and maximum entropy [43] as the fitness function. The Equations are as follows:
    H 1 ( p ) = p 1 l o g 2 p 0 p 1 + p 0 l o g 2 p 1 p 0
H 2 ( p ) = p 1 l o g 2 p 1 p 0 l o g 2 p 0
f i t = ( 1 ρ ) H 1 ( p ) + ρ H 2 ( p )
F i t ( β , α θ , V θ , w ) = { 1 1 + f i t                                           f i t 0 1 + | f i t |                           f i t < 0
where H 1 ( p ) and H 2 ( p ) represent the minimum cross-entropy and maximum entropy in the fitness function, respectively. p 1 and p 0 indicate the probability that the output value of the simplified PCNN network is 1 and 0, respectively. p 0 is the simplified PCNN output. Considering that the number of pixels of 0 minus the number of pixels in the background and the ratio of the number of pixels in the whole wheat ear,   p 1 is the probability of subtracting 0 from 1. ρ is the weighting coefficient of the fitness function, and ρ ∈ [0,1], where ρ is 0 or 1, respectively. The minimum cross-entropy and maximum entropy are used; f i t is the evaluation function, and F i t is the fitness function based on IABC-K.
The channel grayscale image of the target image in the lab color space [44] is substituted into the simplified PCNN. The feasible solution is considered as a parameter in the simplified PCNN. The corresponding result was then calculated according to Equation (13). The fitness of each bee is sorted according to fitness size, with the first half as the lead bee and the second half as the follower.
(d) The location update equation determines whether the bee can quickly and accurately find new sources of honey. The position update equation of the ABC algorithm has a strong searching ability, but its exploration ability is lacking. The algorithm has the disadvantages of iterative randomness and can easily fall into a local optimal solution and slow update speed when searching for its neighborhood. Therefore, for this problem, this study introduces the following location update Equation of the global factor:
V i , j = x i , j + r i , j ( x m , j x k . j ) + φ ( x max , j x i , j )
where V i , j represents a new position generated near x i , j ; k, m, and j are random numbers; r i , j [−1,1], φ [−1,1] is a random number; and x m a x , j represents the honey source with the largest fitness value.
The bee searches for its neighborhood are conducted using Equation (14) to obtain a new location. According to the greedy selection principle, if the fitness of the new location is greater than the fitness of the original location, then the original location is updated with the new location; otherwise, the original location is maintained. The original position is unchanged. If a lead bee does not change after the Limit iteration, then the lead bee becomes a scout bee and a new position is randomly generated to replace the original position. When all lead bees complete the neighborhood search, the probability P i [45] is calculated according to Equation (15).
P i = F i t i i = 1 N F i t i
where P i is the probability that the bee chooses to lead the bee, i = 1 ,   2 , , N .
(e) The bee is followed using the calculated probability P i to choose to lead the bee. In principle, the larger the P i is, the greater the fitness value of the lead bee I, and the greater the probability of being followed by the bee will be. After following the bee to complete the lead selection, we use equation (14) to search for the neighborhood and select the location with high adaptability according to the principle of greedy selection.
(f) After all of the followers complete the search, the obtained position is considered as the cluster center. K-means iterative clustering is then performed on the dataset. According to the cluster division, the bee colony is updated with each new cluster center.
(g) If the current number of iterations is greater than the maximum number of times of MCN, then the iteration ends and the algorithm ends; otherwise, it turns to (d).

2.3.3. Evaluation Method

The performance of the segmentation was evaluated by four indicators, namely, quality rate (QR), over-segmentation rate (OR), under-segmentation rate (UR), and comprehensive measurement rate (D) [46] (Equations (16)–(19)). Time was efficiently evaluated using the segmentation time. QR indicates the accuracy of the segmentation algorithm, and D is used to comprehensively evaluate OR and UR. The larger the values of QR, OR, UR, and D, the better the segmentation performance is. The accuracy evaluation algorithm was used to grade performance. The closer the value is to 1, the better the performance is (Equation (20)).
Q R = C s O s + U s + C s
O R = C s O s + C s
U R = C s U s + C s
D = O R 2 + U R 2 2
A c c u r a c y = | z n | z × 100 %
where C s represents the overlapping part of the segmentation result pixel and the real result pixel in the image, O s represents that the real result in the image is the pixel position of the background, but these positions are segmented into the parts of the wheat ear pixel, U s represents that the real result in the image is the pixel position of the wheat ear, but these positions are segmented into the background pixel. z represents the number of images in the test set, and n represents the number of images that are incorrectly graded.

3. Results

In order to explore the effectiveness of the single wheat ear segmentation model and the disease segmentation method, we conducted experiments on 120 wheat FHB images in the field environment. The evaluation indicators such as QR, OR, UR, D, and accuracy were used to compare the proposed method and other methods.

3.1. Results of Single Wheat Ear Segmentation

The test image was segmented by the model, and the segmentation result was binarized. Finally, the pseudo color image of single wheat ear was synthesized, and the result was shown in the Figure 6.
As shown in the Figure 6, the dataset was trained through the FCN to segment the wheat ear in the field and achieved good segmentation result. The wheat ear in the field environment can be accurately segmented. To illustrate the effectiveness of the single wheat ear segmentation method proposed in this study, which was compared with the traditional K-means [40] and edge detection [13] methods. The segmentation results were shown in the Figure 7.
Based on the actual annotation results, 120 wheat ear images were collected as samples, and the segmentation performance of the QR, OR, UR, and D evaluation indicators for different segmentation algorithms was analyzed. The results were shown in the Figure 8.
Figure 7 and Figure 8 shows that the single wheat ear segmentation model proposed in this study is more accurate than the traditional methods, with more rounded edges and less noise. The segmentation model has some improvement in the QR, OR, and D indicators compared to the others. However, the segmentation model is slightly lower on UR than traditional methods. Among them, the mean values of QR, OR, UR, and D for the segmentation method in this study are 0.821, 0.982, 0.823, and 0.907, respectively. The upper and lower deviations are small and with certain stability and accuracy.

3.2. Results of Disease Spot Segmentation

Based on the results of the segmentation model, the IABC-K-PCNN algorithm was used to segment the disease spot of wheat ear. The parameters are MCN = 10, Limit = 50, M = 50, and N = 20. To compare the advantages, disadvantages, and effectiveness of the disease spot segmentation algorithm, we compared it with the largest inter-class variance method (Otsu) [35], genetic algorithm (GA) [47], super green feature (SG) [48], and pulse coupled neural network based on the ABC (ABC-PCNN) [49] algorithm. The segmentation results of the above methods were presented in the Figure 9.
Figure 9 demonstrates that in combination with the manually labeling disease spot, the segmentation method in this study has certain accuracy in classifying the FHB disease spot. To analyze the results objectively, based on the segmentation results of plant protection experts, we used 120 diseased images as samples. The segmentation performance of each algorithm was further analyzed by QR, OR, UR, and D. The results were shown in the Figure 10.
Figure 10 shows that the average values of ABC-PCNN and IABC-K-PCNN in QR, OR, and D are better than those obtained by traditional methods. It can be seen that PCNN can be well applied to the segmentation of wheat FHB, and the parameter optimization method of this study has a certain improvement compared with the ABC method. The methods of ABC-PCNN and IABC-K-PCNN perform better on the UR but are worse than the other methods. This may be because other methods have more over-segmentation, so they perform better than ABC-PCNN and IABC-K-PCNN on under-segmentation. Analysis of the error graph indicates that the upper and lower errors of each method are large. In the method of this study, it may be due to the problem of parameter initialization or position update formula, which leads to a large fluctuation of the segmentation error, this can make a certain reference for our further research.

3.3. Results of Disease Grading

To evaluate the influence of different segmentation algorithms on the identification of the final disease grade, we tested 120 disease images with different algorithms. The disease grade was obtained from the ratio of the disease spot to the whole wheat ear. The efficiency of the algorithm was evaluated by classification accuracy and time. The results were shown in the Figure 11.
Figure 11 indicates that the classification accuracy of the proposed method is higher than that of other methods. Among them, the classification accuracy of this method is 0.925. The grading time is about 5 s, which is longer than Otsu and SG, but because of the disease grade of wheat FHB in the field can be effectively identified, so the proposed method in the study could be used for wheat FHB detection in the actual wheat production.

4. Discussion

4.1. Analysis of the Shadow and Soil Effects on Wheat Ear Segmentation

Generally speaking, when the image of crop organs such as ear, leaf, and stem is collected in the field environment, the effect factors like illumination, shadow, wind speed/direction, and soil background usually affect the image quality. The aim of this study is to propose a stable recognition model of wheat FHB for a single wheat ear, which can overcome the effects of common environmental factors. The shadow-affected and soil-affected 30 images, were respectively selected to analyze the effects of shadow and soil background on the disease segmentation. The segmentation results were shown in Figure 12, and the segmentation performance was also analyzed by QR, OR, UR, and D, as shown in Figure 13.
From Figure 12, we can see that the background parts are basically segmented correctly for those shadow-affected and soil-affected samples, and the segmentation error only occurs at the edge of the wheat ear, as shown in the Figure 12a3,b3. Here an ideal segmentation result was obtained. In Figure 13, the model performs well for the evaluation indicator OR. In this study, deep learning method was used because it can deeply mine the characteristics of the target, enrich the performance of the target in the network, and accurately segment the target in the image [50]. Although the proposed model performed slightly worse on the other evaluation indicators such as QR, UR, and D, the basic segmentation of wheat ears is correct. Here the edge information of wheat ears is poorly divided, resulting in lower QR, UR, and D index values, which may be due to the fact that the data set does not adequately reflect wheat ears under the influence of shadow and soil. Secondly, the input image after the preprocessing greatly reduces the resolution, which may lead to the loss of edge information, thereby causing the reduction of the recognition accuracy [51]. In the study, the final classification can be correctly performed as long as the ratio of the disease spot to the whole wheat ear is divided into the corresponding disease grade. Therefore, the segmentation error of the segmentation model under the effect of shadow and soil only has a limited effect on the final result.

4.2. Analysis of Disease Grading Effect on the Wheat FHB Detection

Rapid and accurate identification of wheat FHB disease grade is of great significance to national food safety. When the disease severity is low, scientific prevention and control means can effectively reduce the spread of the disease. When the disease is extremely serious, effectively eradicating the diseased wheat ears and treating them in a targeted manner can improve food quality. In this study, disease grade was calculated using the ratio of the area of the lesion to the area of the wheat ear, and the disease in the field was effectively identified. Certain errors occur in the segmentation of the wheat ear area and disease spot area in each segmentation. However, when the disease is graded, the influence of the segmentation error is weakened to some extent, and the accuracy of the final classification is 0.925. This result may be due to a certain range among disease levels. Even if the segmentation is incorrect, the ratio of the disease spot to the area of the wheat ear is not, as long as it is between the corresponding disease grade levels, and the classification is successful. The error caused by the method and multiple segmentation does not have a remarkable effect on the identification of disease grades. Meanwhile, the classification time is about 5 s, which can be accepted to apply for rapid disease detection in the field.

4.3. Analysis of the Influence of Different Growth Stages on Grading Results

In this study, we also explored the influence of different growth stages on grading results. To achieve this, 60 images were respectively collected and processed from the flowering period and the filling period. The number of misclassifications for each disease grade is shown in Table 1.
As shown in Table 1, the misclassification numbers at the filling period are less than that at the flowering period. This finding may be due to a large number of small flowers on the wheat ears at the flowering period, it leads to more segmentation errors and final grading failure. In this study, the proposed method obtains different segmentation performance for two key disease occurrence stages, the overall grading result is above 0.9, indicating that the method has strong robustness and to some extent, overcomes the effects of different growth stages.

5. Conclusions

Thinking of the complex environment in the field (wheat straw, leaves, shadow, soil), we constructed a segmentation model of a single wheat ear with a segmentation accuracy of 0.981, which could well segment the wheat ear in the field environment. The IABC-K-PCNN method was proposed based on the correct segmentation of the wheat ear to identify wheat Fusarium head blight. Compared with the traditional segmentation methods, the proposed algorithm shows certain improvements in the recognition accuracy of disease severity. The ratio of disease spot to the whole wheat ear was calculated on the basis of the results of wheat ear and disease spot segmentation, and the disease grade was obtained. The method obtained a classification accuracy of 0.925, which could effectively grade the wheat Fusarium head blight in the field environment. The above results are highly relevant for the rapid detection of wheat FHB based on near-Earth remote sensing observation methods, which is conducive to promote the mechanization of large-scale precision control of wheat FHB in China and ensure national food security.

Author Contributions

Conceptualization, D.Z., D.W., C.G. and D.L.; data curation, D.W. and G.C.; formal analysis, D.W.; investigation, D.Z., D.W., H.Z., G.C. and H.L.; methodology, D.W.; resources, C.G.; writing—original draft, D.Z. and D.W.; writing—review and editing, C.G., N.J. and D.L.

Funding

The study was funded by the National Natural Science Foundation of China (Grant No. 41771463, 41771469) and the Anhui Provincial Major Science and Technology Project (18030701209).

Acknowledgments

We appreciate the help from Zhicun Wang and Junwei Liu during field data collection. The funders had no role in choosing the study design or in the collection, analysis, and interpretation of the data, in the writing of the report, or in the decision to submit the article for publication.

Conflicts of Interest

The authors declare no conflict of interest.

References

  1. Saccon, F.A.M.; Parcey, D.; Paliwal, J.; Sherif, S.S. Assessment of Fusarium and Deoxynivalenol Using Optical Methods. Food Bioprocess Technol. 2016, 10, 1–17. [Google Scholar] [CrossRef]
  2. Mcbeath, J.H.; Mcbeath, J. Plant Diseases, Pests and Food Security. Springer Neth. 2010, 35, 117–156. [Google Scholar]
  3. Miroslava, C.C.; Wang, L.; Lily, F.; Kerry, B.; Nadine, M.; Lan, B.; Pierre, R.F. Metabolic Biomarker Panels of Response to Fusarium Head Blight Infection in Different Wheat Varieties. PLoS ONE 2016, 11, e0153642. [Google Scholar]
  4. Yuan, Z.; Zhang, Y. Pesticide and Environment. Shanghai Chemcai Industry. 2000, 17, 4–5, (In Chinese with English Abstract). [Google Scholar]
  5. Kuenzer, C.; Knauer, K. Remote sensing of rice crop areas. Remote Sens. 2013, 34, 2101–2139. [Google Scholar] [CrossRef]
  6. Jin, X.; Jie, L.; Wang, S.; Qi, H.J.; Li, S.W. Classifying Wheat Hyperspectral Pixels of Healthy Heads and Fusarium Head Blight Disease Using a Deep Neural Network in the Wild Field. Remote Sens. 2018, 10, 395. [Google Scholar] [CrossRef]
  7. Bauriegel, E.; Giebel, A.; Geyer, M.; Schmidt, U.; Herppich, W.B. Early detection of Fusarium infection in wheat using hyper-spectral imaging. Comput. Electron. Agric. 2011, 75, 304–312. [Google Scholar] [CrossRef]
  8. Mohd, S.K.; Sabura, B.U.; Hemalatha, S. Anthracnose disease diagnosis by image processing, support vector machine and correlation with pigments. J. Plant Pathol. 2019. [Google Scholar] [CrossRef]
  9. Pantazi, X.Z.; Moshou, D.; Tamouridou, A.A. Automated leaf disease detection in different crop species through image features analysis and One Class Classifiers. Comput. Electron. Agric. 2019, 156, 96–104. [Google Scholar] [CrossRef]
  10. Jin, X.; Liu, S.; Baret, F.; Hemerlé, M.; Comar, A. Estimates of plant density of wheat crops at emergence from very low altitude UAV imagery. Remote Sens. Environ. 2017, 198, 105–114. [Google Scholar] [CrossRef] [Green Version]
  11. Aarju, D.; Sumit, N. Wheat Leaf Disease Detection Using Machine Learning Method—A Review. Int. J. Comput. Sci. Mob. Comput. 2018, 7, 124–129. [Google Scholar]
  12. Joulin, A.; Bach, F.; Ponce, J. Discriminative clustering for image co-segmentation. In Proceedings of the 2010 Twenty-Third IEEE Conference on Computer Vision and Pattern Recognition, CVPR 2010, San Francisco, CA, USA, 13–18 June 2010. [Google Scholar]
  13. Aslam, A.; Khan, E.; Beg, M.M.S. Improved Edge Detection Algorithm for Brain Tumor Segmentation. Procedia Comput. Sci. 2015, 58, 430–437. [Google Scholar] [CrossRef] [Green Version]
  14. Zhou, C.; Liang, D.; Yang, X.; Yang, H.; Yue, J.; Yang, G. Wheat ears counting in field conditions based on multi-feature optimization and twsvm. Front. Plant Sci. 2018. [Google Scholar] [CrossRef] [PubMed]
  15. Long, J.; Shelhamer, E.; Darrell, T. Fully convolutional networks for semantic segmentation. IEEE Trans. Pattern Anal. Mach. Intell. 2014, 39, 640–651. [Google Scholar]
  16. Yang, Q.; Liu, M.; Zhang, Z.; Yang, S.; Ning, J.; Han, W. Mapping Plastic Mulched Farmland for High Resolution Images of Unmanned Aerial Vehicle Using Deep Semantic Segmentation. Remote Sens. 2019, 11, 2008. [Google Scholar] [CrossRef]
  17. Cui, B.; Fei, D.; Shao, G.; Lu, Y.; Chu, J. Extracting Raft Aquaculture Areas from Remote Sensing Images via an Improved U-Net with a PSE Structure. Remote Sens. 2019, 11, 2053. [Google Scholar] [CrossRef]
  18. Du, Z.; Yang, J.; Ou, C.; Zhang, T. Smallholder Crop Area Mapped with a Semantic Segmentation Deep Learning Method. Remote Sens. 2019, 11, 888. [Google Scholar] [CrossRef]
  19. Wang, X.; Wang, Z.; Zhang, S. Segmenting Crop Disease Leaf Image by Modified Fully-Convolutional Networks. Intell. Comput. Theor. Appl. 2019, 11643, 646–652. [Google Scholar]
  20. Akkus, Z.; Galimzianova, A.; Hoogi, A.; Rubin, D.L.; Erickson, B.J. Deep learning for brain mri segmentation: State of the art and future directions. J. Digit. Imaging 2017, 30, 449–459. [Google Scholar] [CrossRef]
  21. Tsai, Y.H.; Hung, W.C.; Schulter, S.; Sohn, K.; Chandraker, M. Learning to adapt structured output space for semantic segmentation. In Proceedings of the IEEE Conference on Computer Vision and Pattern Recognition (CVPR), Salt Lake City, UT, USA, 18–22 June 2018; pp. 7472–7481. [Google Scholar]
  22. Wang, S.; He, D.; Han, J. Color Image Segmentation Method for Corn Diseases Based on Parallelized Firing PCNN. Trans. Chin. Soc. Agric. Mach. 2011, 42, 148–277. [Google Scholar]
  23. Guo, X.; Zhang, M.; Dai, Y. Image of Plant Disease Segmentation Model Based on Pulse Coupled Neural Network with Shuffle Frog Leap Algorithm. In Proceedings of the 2018 14th International Conference on Computational Intelligence and Security (CIS), Dubai, UAE, 19–20 November 2018. [Google Scholar]
  24. Johnson, J.L.; Padgett, M.L. PCNN models and applications. IEEE Trans. Neural Netw. 1999, 10, 480–498. [Google Scholar] [CrossRef] [PubMed]
  25. Gu, X. Feature Extraction using Unit-linking Pulse Coupled Neural Network and its Applications. Neural Process. Lett. 2008, 27, 25–41. [Google Scholar] [CrossRef]
  26. Broussard, R.P.; Rogers, S.K.; Oxley, M.E.; Tarr, G.L. Physiologically motivated image fusion for object detection using a pulse coupled neural network. IEEE Trans. Neural Netw. 1999, 10, 554–563. [Google Scholar] [CrossRef] [PubMed]
  27. Kennedy, J. Particle Swarm Optimization. Proc. IEEE Int. Conf. Neural Netw. 2011, 4, 1942–1948. [Google Scholar]
  28. Holland, J.H. Genetic Algorithms. Sci. Am. A Div. Nat. Am. Inc. 1992, 267, 66–73. [Google Scholar] [CrossRef]
  29. Karaboga, D.; Akay, B. A survey: Algorithms simulating bee swarm intelligence. Artif. Intell. Rev. 2009, 31, 61–85. [Google Scholar] [CrossRef]
  30. Cong, T.; Wu, Z.; Wang, Z.; Deng, C. A novel hybrid data clustering algorithm based on Artificial Bee Colony algorithm and K-Means. Chin. J. Electron. 2015, 24, 694–701. [Google Scholar]
  31. Bose, A.; Mali, K. Fuzzy-based artificial bee colony optimization for gray image segmentation. Signal Image Video Process. 2016, 10, 1–8. [Google Scholar] [CrossRef]
  32. Dougherty, E.R.; Lotufo, R.A. Hands-on Morphological Image Processing; SPIE-The International Society for Optical Engineering: Bellingham, WA, USA, 2003. [Google Scholar]
  33. Kirkland, E.J. Bilinear Interpolation. Available online: https://doi.org/10.1007/978-1-4419-6533-2_12 (accessed on 20 September 2019).
  34. Sternberg, S.R. Grayscale morphology. Comput. Vision Graph. Image Process. 1986, 35, 333–355. [Google Scholar] [CrossRef]
  35. Ronneberger, O.; Fischer, P.; Brox, T. U-Net: Convolutional Networks for Biomedical Image Segmentation. In Proceedings of the International Conference on Medical Image Computing & Computer-assisted Intervention, Munich, Germany, 5–9 October 2015; pp. 234–241. [Google Scholar]
  36. Ostu, N. A threshold selection method from gray-histogram. IEEE Trans. Syst. Man Cybern. 2007, 9, 62–66. [Google Scholar]
  37. Eckhorn, R. Neural mechanisms of scene segmentation: Recordings from the visual cortex suggest basic circuits for linking field models. IEEE Trans. Neural Netw. 1999, 10, 464–479. [Google Scholar] [CrossRef] [PubMed]
  38. Wei, S.; Hong, Q.; Hou, M. Automatic image segmentation based on PCNN with adaptive threshold time constant. Neurocomputing 2011, 74, 1485–1491. [Google Scholar] [CrossRef]
  39. Bi, Y.W.; Que, T.S. An Adaptive Image Segmentation Method Based on Simplified PCNN. Electron. J. 2005, 33, 647–650, (in Chinese with English Abstract). [Google Scholar]
  40. Wagstaff, K.; Cardie, C.; Rogers, S.; Schrödl, S. Constrained k-means clustering with background knowledge. In Proceedings of the Eighteenth International Conference on Machine Learning, Williamstown, MA, USA, 28 June–1 July 2001; pp. 577–584. [Google Scholar]
  41. Bian, W.; Tao, D.C. Max-Min Distance Analysis by Using Sequential SDP Relaxation for Dimension Reduction. IEEE Trans. Pattern Anal. Mach. Intell. 2011, 33, 1037–1050. [Google Scholar] [CrossRef] [PubMed]
  42. Goudail, F.; Réfrégier, P. Statistical Image Processing Techniques for Noisy Images; Plenum Publishing Co.: New York, NY, USA, 2004. [Google Scholar]
  43. Mayer, J.E.; Mayer, M.G. Statistical mechanics. Philos. Sci. 1990, 1, 29–49. [Google Scholar]
  44. Gauch, J.M.; Chi, W.H. Comparison of three-color image segmentation algorithms in four color spaces. Proc. Spie Vis. Commun. Image Process. 1992, 1818, 1168–1181. [Google Scholar]
  45. Liao, C.Z.; Zhang, D.; Jiang, M.Y. Image Segmentation Based on ABC-PCNN Model. J. Nanjing Univ. Sci. Technol. 2014, 4, 558–565, (in Chinese with English Abstract). [Google Scholar]
  46. Clinton, N.; Holt, A.; Scarborough, J.; Yan, L.; Gong, P. Accuracy Assessment Measures for Object-based Image Segmentation Goodness. Photogramm. Eng. Remote Sens. 2010, 76, 289–299. [Google Scholar] [CrossRef]
  47. Meunkaewjinda, A.; Kumsawat, P.; Attakitmongcol, K.; Srikaew, A. Grape Leaf Disease Detection from Color Imagery System Using Hybrid Intelligent System. In Proceedings of the 5th International Conference on Electrical Engineering/Electronics, Computer, Telecommunications and Information Technology, Krabi, Thailand, 14–17 May 2008. [Google Scholar]
  48. Su, H.Q.; Wen, C.J. A New Algorithm Based on Super-Green Features for Ostu’s Method Using Image Segmentation. In Proceedings of the World Automation Congress 2012, Puerto Vallarta, Mexico, Mexico, 24–28 June 2012. [Google Scholar]
  49. Gao, K.H.; Duan, H.B.; Xu, Y.; Zhang, Y.; Li, Z. Artificial Bee Colony approach to parameters optimization of Pulse Coupled Neural Networks. IEEE Int. Conf. Ind. Inform. 2012, 7203, 128–132. [Google Scholar]
  50. de Souza, D.L.; Neto, A.D.; da Mata, W. Intelligent system for feature extraction of oil slick in sar images: Speckle filter analysis. In Proceedings of the International Conference on Neural Information Processing, Hong Kong, China, 3–6 October 2006; Springer: Berlin/Heidelberg, Germany, 2006; pp. 729–736. [Google Scholar]
  51. Huang, H.; Wu, B.; Fan, J. Analysis to the relationship of classification accuracy, segmentation scale, image resolution. In Proceedings of the IEEE International Geoscience & Remote Sensing Symposium, Toulouse, France, 21–25 July 2003. [Google Scholar]
Figure 1. Experimental field and wheat Fusarium head blight image collection. (a) Experimental site; (b) Vaccination and unvaccinated experimental area; (c) fieldwork situation; (d) individual healthy/infected wheat ear; (1) healthy wheat ear with a disease grade of 0; (2) wheat ear with a disease grade of 1, (3) 2, (4) 3, (5) 4, and (6) 5.
Remotesensing 11 02375 g001
Figure 2. The segmentation dataset of single wheat ear. (a) Original image, (b) outline label image, (c) label binary image, (d) label binary image resampled to 256 × 256 and edge fill 0, (e) the image is grayscaled after original image is padded with 0 and resampled to 256 × 256.
Remotesensing 11 02375 g002
Figure 3. The workflow of the study.
Remotesensing 11 02375 g003
Figure 4. Single wheat ear segmentation network. The input is a filled grayscale image, the output is a grayscale image of single wheat ear. The left side of the network consists of eight 3 × 3 convolution layers and four 2 × 2 maximum pooling layers. The right side of the network contains eight 3 × 3 convolution layers, one 1 × 1 convolution layer, and four 2 × 2 deconvolution layers.
Remotesensing 11 02375 g004
Figure 5. The schematic diagram of improved artificial bee colony (IABC)-K-pulse-coupled neural network (PCNN). The purple frame, light yellow frame, light blue frame, green frame, red frame, dark yellow frame, and dark blue frame correspond to steps (a), (b), (c), (d), (e), (f), and (g), respectively.
Remotesensing 11 02375 g005
Figure 6. Segmentation results of the single wheat ear segmentation model. (a) Original image, (b) test image, (c) segmentation result, (d) binary image, (e) pseudo color image.
Remotesensing 11 02375 g006
Figure 7. Segmentation results of single wheat ear. (a) Original image, (b) ground truth, (c) K-means segmentation result, (d) edge detection segmentation result, (e) proposed model segmentation result.
Remotesensing 11 02375 g007
Figure 8. Evaluation of segmentation results. The color column is the average value, and the black line is the error line. Quality rate (QR), over-segmentation rate (OR), under-segmentation rate (UR), and comprehensive measurement rate (D) represent the evaluation indicators of K-means, edge detection, and proposed model, respectively.
Remotesensing 11 02375 g008
Figure 9. Examples of disease spot segmentation results. (a) Infected wheat ear image, (b) artificially labeled disease spot, (c) IABC-K-PCNN algorithm to segment disease spot, (d) Otsu algorithm to segment disease spot, (e) genetic algorithmto segment disease spot, (f) super green featurealgorithm to segment disease spot, (g) ABC-PCNN algorithm to segment disease spot.
Remotesensing 11 02375 g009
Figure 10. Evaluation of segmentation results. The color column is the average value, and the black line is the error line. QR, OR, UR, and D represent the evaluation indicators of Otsu, GA, SG, ABC-PCNN, and IABC-K-PCNN, respectively.
Remotesensing 11 02375 g010
Figure 11. Disease spot segmentation results. (a) Classification accuracy of each method, (b) classification time of each method.
Remotesensing 11 02375 g011
Figure 12. Segmentation results of single wheat ear under different effect factors. (a1, b1) mean the effects of shadow and soil on the single wheat ear. (a2, b2), (a3, b3) represent the ground truth and model segmentation results, respectively.
Remotesensing 11 02375 g012
Figure 13. Evaluation results of different effect factors. The color column is the average value, and the black line means the error line. The QR, OR, UR, and D represent the evaluation indicators of the segmentation results under the influence of shadow and soil effect, respectively.
Remotesensing 11 02375 g013
Table 1. The number of misclassifications of different disease grades.
Growth PeriodNumber of Misclassifications of Different Disease Grades
Grade 0Grade 1Grade 2Grade 3Grade 4Grade 5
Flowering period121020
Filling period010011

