Abstract
Finding balance between the needs of people and wildlife is an essential component of planning sustainable landscapes. Because mammals make up a diverse and ecologically important taxon with varying responses to human disturbance, we used representative mammal species to examine how alternative land-use policies might affect their habitats and distributions in the near future. We used wildlife detections from camera traps at 1591 locations along a large-scale urban to wild gradient in northern Virginia, to create occupancy models which determined land cover relationships and the drivers of contemporary mammal distributions. From the 15 species detected, we classified five representative species into two groups based on their responses to human development; sensitive species (American black bears and bobcats) and synanthropic species (red foxes, domestic cats, and white-tailed deer). We then used the habitat models for the representative species to predict their distributions under four future planning scenarios based on strategic versus reactive planning and high or low human population growth. The distributions of sensitive species did not shrink drastically under any scenario, whereas the distributions of synanthropic species increased in response to anthropogenic development, but the magnitude of the response varied based on the projected rate of human population growth. This is likely because most sensitive species are dependent on large, protected public lands in the region, and the majority of projected habitat losses should occur in non-protected private lands. These findings illustrate the importance of public protected lands in mitigating range loss due to land use changes, and the potential positive impact of strategic planning in further mitigating mammalian diversity loss in private lands.
1. Introduction
Effective land planning must balance the needs of people and the natural world [1], particularly because land cover change and habitat loss are among the leading causes of biodiversity loss [2]. Mammals are no exception to the global phenomena of range reduction and habitat loss [3]. Mammals across a range of body sizes and trophic guilds change their behaviors in direct response to human-induced changes in land cover and increased human presence [4,5]. Furthermore, there are apparent dichotomies in mammal responses to changes in the Anthropocene, with species such as omnivorous mesopredators, herbivores, and domesticated species exhibiting clear advantages over obligate carnivores, apex predators, and habitat specialists [6,7,8,9]. For example, some species within carnivore guilds avoid urban areas, whereas others increase their abundances in these anthropogenic environments [10,11,12,13].
Mammals are often difficult to detect even when present, but technological advances in non-invasive sampling (e.g., camera traps, genetic tagging, etc.) have helped accumulate global mammal diversity and distribution data [14,15]. Despite the increasing availability of wildlife data, few studies have integrated these data to map the distributions of mammal species in regions undergoing expansive land changes [12,16]. These projected species distribution models can then be used to predict range shifts in response to future landscape scenarios, such as those projected under climate change [17,18]. Contemporary biodiversity data provide valuable snapshots of mammal distributions, but they have not been applied to projections of land cover change to forecast community distributions in the future. These predictions would be informative to stakeholders, as they coordinate and select planning policies to preserve biodiversity and their associated ecosystem services.
We projected changes in a suite of habitat-relevant land cover types for a rapidly changing landscape in northern Virginia under four different scenarios that varied in policy to plan development strategically (e.g., urban centralized) or reactively (e.g., sprawling) over the next 50 years, while accounting for differences in the rate of human population growth [19]. Scenario planning is a strategic planning approach whereby alternate storylines or “scenarios” of the future are generated and their potential impacts are examined. Scenario planning is particularly useful in the conservation realm because of the high degree of uncertainty associated with future changes and the potential for significant impacts resulting from divergent policies [20,21]. This study used scenarios that were developed with regional stakeholders’ inputs to increase their relevance to the projected future landscapes [19].
We used wildlife detections, obtained through deployments of camera traps along a large-scale urban-to-wild gradient in northern Virginia, to create occupancy models to estimate land cover effects on those mammals detected. We predicted that species such as the American black bear (Ursus americanus) and bobcat (Lynx rufus) would respond negatively to human development and be most sensitive to habitat loss, because they are large omnivorous and obligate carnivores, respectively, which require substantial suitable habitats to persist. On the other hand, species such as urban-associated red foxes (Vulpes vulpes), free-roaming domestic cats (Felis catus), and generalist herbivores like white-tailed deer (Odocoileus virginianus) were predicted to respond positively to human-derived habitat fragmentation and land cover change, regardless of planning scenarios. The predictive models can inform planning commissions as to which scenario would be most effective to sustain mammalian assemblages.
2. Materials and Methods
2.1. Study Area
Our study area was a 32,500 km2 region of northern Virginia centered on the Shenandoah National Park. This area included the 15 counties plus a 5 km buffer that formed the core study area of the Changing Landscapes Initiative (CLI), a collaborative program initiated in 2015 to guide regional planning efforts with the goals of long-term preservation of biodiversity and ecosystem services [19,22]. Roughly 55% of the study area is forested. Nearly a third of that forest is under public stewardship in the Shenandoah National Park and George Washington National Forest, both of which are protected from future development but managed for multiple purposes and community benefits. The remaining forest occurs in patches that are largely privately-owned with variation in protection from future development across land owners. Other major land cover types include grasslands, composed of both pasture and herbaceous cover (~33%); urban developments (~7%); and agricultural crops (~5%) [22].
2.2. Mammal Camera Trapping
We used wildlife data from the eMammal database (eMammal.si.edu) to extract information on a suite of mammals present in the region [23]. These species represented five functional guilds that respond to land cover change in two opposite patterns: large carnivores (>100 kg) and native obligate carnivores, which should be negatively associated with land cover change; and generalist herbivores, mesopredators, and exotic carnivores, which should respond positively to anthropogenic land cover.
The eMammal database is a data management platform for camera trap projects with data from both citizen scientists and professionals [24]. We used data from several projects within eMammal in which camera deployments and the data they collected were standardized in camera trap height (~50 cm above ground) and without bait or lures [23,25]. Although these projects differed in their original objectives, all examined wildlife-habitat associations and used passive-infrared motion-activated camera traps (~90% Reconyx RC55, RC800, orc RC900, RECONYX, Inc., Holmen WI, USA or ~10% Bushnell TrophyCam HD, Bushnell, Overland Park, KS, USA) [23,25]. These camera trap data came from sites within the CLI study area, and the greater Washington DC region as well, to capture a fuller range of human development (Figure 1). In total, these data were derived from 1591 camera deployments conducted during the growing seasons from August 2012 through October 2018.
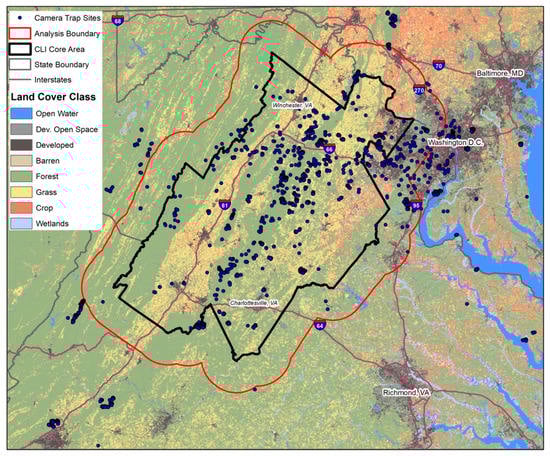
Figure 1.
Camera trapping area with 1591 camera trap sites from 2012 to 2018, and the Changing Landscapes Initiative (CLI) study area from across an urban to rural gradient, northern Virginia.
Following each deployment, we extracted the raw detection data for each species and created daily detection histories for each site with a minimum of one week of sampling and we truncated the detection histories at 30 days to realize closure for the sites. Although the data were collected over several field seasons, we did not resample any sites in a multi-season framework, and we, therefore, refer to ψ as “site use” [26]; however, we did test for annual and seasonal variation in detection, as described later in the methods.
2.3. Covariates and Models
To measure habitat variables, we used ArcGIS 10.7 (Environmental Systems Research Institute [ESRI], Inc., Redlands, CA, USA) to create a land cover map of the camera trapping area based on the reclassification of the 2011 National Land Cover Database (NLCD—Appendix A Table A1) with 30 m resolution land cover data modified on the Anderson Level II classification system, from previous CLI research iterations [22,27]. Reclassification was based on generalized landscape characteristics, and thus we do not expect these simplifications of land cover to dramatically affect inferences for mammal responses. We selected habitat covariates based on the known ecology of potential candidate mammals [7,8,10,11,23,28].
We measured the coverage percentages of the four main land covers: (1) forest, (2) grassland, (3) crops, and (4) urban development in 500 and 1000 m radii around each 30 x 30 m pixel of land in the study area. We further measured linear distances (m) to a variety of anthropogenic or natural edges: (5) distance to development, (6) distance to roads, and (7) distance to crops as indices of human presence and/or disturbance; (8) distance to grassland, (9) distance to core forest (forest greater than 60 m from other land class), and (10) distance to protected lands, which included private and public lands protected from future development. We also used a binary covariate (11) to denote sites as within or outside of those protected areas (i.e., lands managed by the National Park Service, National Forest Service, other state, local, and private entities as derived from the PADUS [Protected Areas Database of the United States] layer [29]); however, this covariate does exclude smaller or private protected lands not reported to the PADUS group. Furthermore, protected lands are not necessarily forested, with private protected lands comprised of more agricultural and utilitarian sites than public protected lands [30]. Finally, we used Fragstats to measure applied landscape covariates, such as (12) contagion, (13) total edge, and (14) landscape division indices within the same 500 and 1000 m scales as the land cover percentage measurements [31]. We standardized all continuous covariates to z scores for analyses and excluded any covariates that were highly correlated (r > 0.7).
Because camera traps were deployed across years and seasons, we developed and compared 7 a priori models, including a constant (null) and global (year + season) set, to estimate and account for the effects of season-specific covariates on detection probabilities of each species. We then used the covariates that contained high model support and strong effects on species detection as a constant covariate in the subsequent occurrence models for each species.
For the occurrence models, we developed and compared 30 a priori hypotheses to predict the distributions of mammals in our study area dependent on land cover and our derived covariates (Supplemental Table S1). The approach was hierarchical in that we compared 14 preliminary models with habitat covariates at local and broader scales and then used model selection to determine which scale (e.g., 500 m or 1000 m) was more appropriate to include in further additive and global models for each specific species. We developed and compared occupancy models in the “unmarked” package in R [32,33].
2.4. Model Selection
We evaluated the best approximating models based on their Akaike information criterion (AIC) and Akaike weights (ωi). We considered covariate effects to be substantial if 95% confidence intervals excluded 0. To make habitat distribution models for the contemporary time-period, we evaluated model predictive power using the area under the ROC (Receiver Operating Characteristics) curve (AUC) and considered models to have strong predictive power if the AUC was greater than 0.7. We further used the false positive rate (fpr) as an index of our predictive power and applied conservative (fpr < 0.1) and more liberal thresholds (fpr < 0.3) to generate predicted core (conservative) habitat and suitable (less conservative and inclusive of all core) habitats for each species, respectively. We implemented these analyses within the “ROCR” package [34].
2.5. Predicting under Land-Planning Scenarios
Using planning scenarios developed for the region via a stakeholder-driven scenario planning process [19], we projected differences in land cover use across the CLI study area. During two regional meetings, local stakeholders defined four scenarios by crossing the poles of two drivers of change: human population growth and the degree of strategic planning. The results are as follows: (HS) high human population growth and strategic planning, (HR) high population growth and reactive planning, (LR) low population growth and reactive planning, and (LS) low population growth and strategic planning (Figure 2). The stakeholders also provided estimates of the amount of difference they expected to see between scenarios that we used in the quantification process described below.
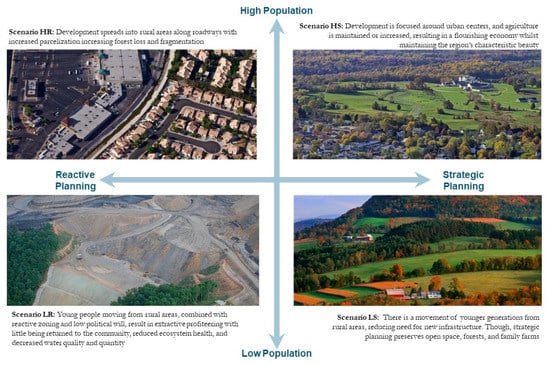
Figure 2.
Schematic of the four quadrants defining our scenario plans along population growth and strategic planning gradients for the CLI study area in northern Virginia.
We simulated these scenarios with the spatially-explicit modeling platform Dinamica EGO (Environment for Geoprocessing Objects) version 3.41 [35]. Dinamica uses a Markov chain/cellular automata framework to project change at one location on a landscape, based on information about the surrounding area. We used that framework to project landscape configurations 50 years into the future, using primary inputs derived from two patterns of land use change observed between our calibration landscapes; NLCD 2001 and NLCD 2011. We parameterized each model by making modifications to the patterns observed.
The first input pattern was the amount of area that changed for each class-to-class transition for each of the four classes (i.e., both forest that becomes grass and grass that becomes forest). This value controls the number of changes Dinamica makes to the initial landscape. We did not track transitions from development to other classes because this was a rare event. We increased the rate of change for development in the HR and HS scenarios to represent the increased need for housing and services created by higher human population density [36]. The amount of change was quantified by first matching observed rates of development growth to observed population growth and then projecting that relationship to decadal population values 24% higher than those projected by the Weldon Cooper Center [37]. For the LR and LS scenarios, we kept the observed rate of development transitions constant to represent low population growth. We then applied a stakeholder-driven, percent-based reduction to both the modified HS rates and unedited LS rates to represent the smaller footprint caused by centralized high density housing expected under strategic planning. We also made modifications for transitions between forest, grass, and crops based on stakeholder input regarding agricultural change [19].
The second input was the “weights of evidence” values calculated for each class-to-class transition in relation to a suite of environmental and socioeconomic variables. These values control where Dinamica makes changes to the initial landscape through maps of the accumulated weights of all variables for each transition type. To distinguish between the centralized growth plans expected in strategic scenarios and the more sprawled growth expected in reactive scenarios, we modified the transition to development weight maps such that the accumulated weights near urban centers were higher for HS and LS scenarios and lower for HR and LR scenarios.
2.6. Species’ Habitat Projections
We used the future landscapes for each scenario to generate scenario-specific versions of each of the model covariates. We then ran the top supported occupancy model on each suite of scenario covariates to generate predicted distributions (suitable and core habitat) for each species. We calculated the predicted change in area for both core and suitable habitats between the present and 2060 for each of the planning scenarios. We further divided those habitats into protected and non-protected areas (e.g., protected from future development), to more broadly evaluate the importance of the protected areas network in the study area.
3. Results
3.1. Camera Trap Summary Statistics
Between 2012 and 2018, we obtained 24,866 independent detections of 15 mammals from 36,443 camera trap days (Supplemental Table S2). We evaluated occupancy models for all 15 species, but excluded 10 species from further analyses beyond the occupancy model comparisons. We excluded three species (woodchucks (Marmota monax), striped skunks (Mephitis mephitis), and gray foxes (Urocyon cinereoargenteus)) due to sparse data and five species (eastern gray squirrels (Sciurus carolinensis), eastern fox squirrels (Sciurus niger), Virginia opossums (Didelphis virginiana), northern raccoons (Procyon lotor), and coyotes (Canis latrans)) due to low predictive power of the model (AUC < 0.70). We excluded two additional species (eastern chipmunks (Tamias semistriatus) and eastern cottontails (Sylvilagus floridanus)) due to incongruence in distribution predictions from likely, subtle site-specific detection biases associated with their small size and fine-grained habitat preferences. This process resulted in five representative species for all further analyses: American black bears, bobcats, red foxes, domestic cats, and white-tailed deer (Supplemental Table S3).
3.2. Occupancy Model Results and Habitat Associations
The global models were most supported for black bear and bobcat occurrence probabilities, each receiving 100% of the Akaike weight. The AUC values for each of these predictive models were also strong with AUC = 0.81 and 0.80 for bears and bobcats, respectively. As predicted, bears and bobcats were positively associated with natural land covers (forest and grasslands) and were positively associated with increasing distances from anthropogenic land covers of development, roads, and crops. However, contrary to our a priori predictions, the binary protected area covariate was not a strong predictor, with a negative, but non-significant, association (Table 1).

Table 1.
Estimated beta coefficients (β) with standard errors (SE), 95% lower and upper confidence intervals (LCI, UCI), p-values, and a priori predictions for covariate effects from the top-ranking occupancy model, explaining variations in occupancy and detection effects of land cover and anthropogenic covariates on the probability of site use by sensitive mammals from 1591 camera trap locations across an urban to rural gradient, northern Virginia, 2012–2018.
The anthropogenic models were most supported for domestic cats and red foxes with 70% and 88% of the Akaike weights, respectively. The AUC values for each of these predictive models were also reliable, with AUC = 0.76 and 0.74 for cats and red foxes, respectively. Habitat associations of these two mesopredators followed our a priori predictions, with both species being positively associated with increasing human development and negatively associated with increasing distances from roads and development and increasing core forest (Table 2). White-tailed deer’s occurrence was most supported by the global model (99% of the Akaike weight) with AUC = 0.73, suggesting the species was negatively associated with increasing forest cover, distances from human development, roads, and crops, and positively associated with grassland habitats and protected area status (Table 2).
Table 2.
Estimated beta coefficients (β) with standard errors (SE), 95% lower and upper confidence intervals (LCI, UCI), p-values, and a priori predictions for covariate effects from the top-ranking occupancy model, explaining variation in occupancy and detection effects of land cover and anthropogenic covariates on the probability of site use by synanthropic mammals from 1591 camera trap locations across an urban to rural gradient, northern Virginia, 2012–2018.
Habitat associations from our occupancy models of the other species detected generally followed our a priori predictions, with species such as eastern chipmunks, eastern fox squirrels, gray foxes, striped skunks, and coyotes responding positively to increasing forest cover, while eastern cottontails and woodchucks responded positively to increasing grassland cover (Supplemental Table S4). The top-ranking occupancy model to predict raccoon occurrence included the derived landscape division index as the only covariate. Additionally, most species (i.e., coyotes, striped skunks, Virginia opossums, eastern gray squirrels, and eastern cottontails) responded positively to increasing distances from development, whereas only eastern fox squirrel models suggested a negative association. Coyotes, opossums, and gray squirrels were negatively associated with increasing distances from crops, while striped skunks, fox squirrels, and cottontails responded positively to increasing distance from crops (Supplemental Table S4).
3.3. Predicted Contemporary Distributions
Contemporary black bear habitat estimates ranged from 4067.7 km2 for core habitat to 10,547.5 km2 for suitable habitat in the study area, with 56.9% and 38.9% of those areas in protected areas, respectively (Figure 3a). The contemporary bobcat habitat was more restricted, with estimates ranging from 2268.9 km2 for core habitat and 5613.3 km2 for suitable habitat, with the majority of habitat in protected areas, to 75.5% core and 58.7% suitable habitat (Figure 3b).
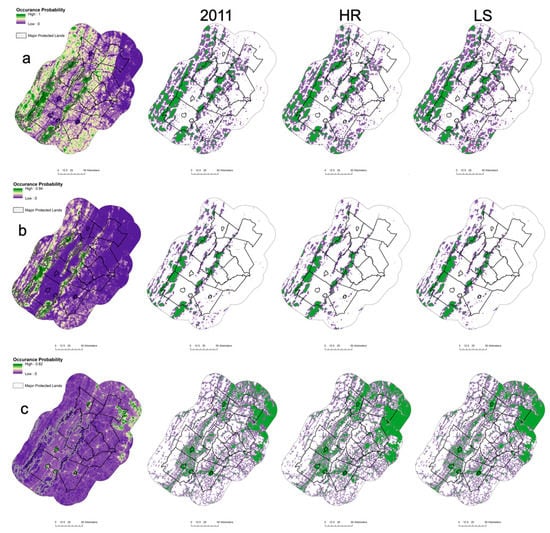
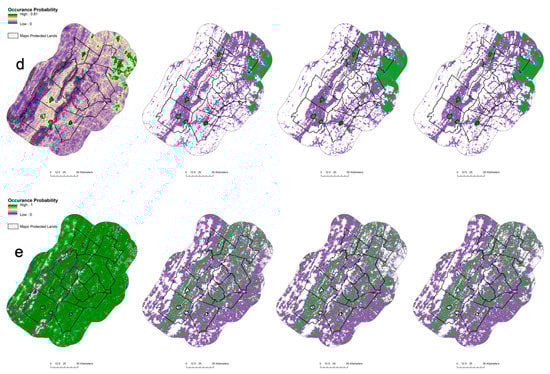
Figure 3.
Predicted occupancy probabilities, core (green) and suitable (purple) habitat areas, and predicted changes over time for five representative mammals [(a) black bear, (b) bobcat, (c) domestic cat, (d) red fox, and (e) white-tailed deer] in protected and non-protected areas during the contemporary period (2011) and under two planning scenarios into 2060. HR represents high human population growth and reactive planning, whereas S represents low population growth and strategic planning. Habitat areas were predicted from the top-ranking occupancy model with the effects of land cover and anthropogenic covariates from 1591 locations across an urban to rural gradient, northern Virginia, 2012–2018.
Contemporary domestic cat and red fox distributions were largely limited in the study area, with > 90% of habitats occurring in unprotected private lands. The distribution for cats ranged from 5660.1 km2 (core) to 14,583.4 km2 (suitable), and the distribution of red foxes ranged from 1927.8 km2 (core) to 11,999.6 km2 (suitable) (Figure 3c,d). White-tailed deer were the most ubiquitous species in the study area with a 6867.9 km2 core and an 23,213.5 km2 suitable contemporary habitat (Figure 3e).
3.4. Projected Land Cover and Suitable Habitat Availability Changes under Different Scenarios
Overall, changes under the four planning scenarios are driven by human population growth, with high human population density models (HS and HR) exhibiting the most urban development expansion (+381.8–445.2 km2) and highest loss of forest (−277.4–325.6 km2), grasslands (−32.5–36.0 km2), and cropland (−71.8−83.6 km2) (Table 3). The LS scenario with low population expansion and strategic planning represents the least expansion of urban development (+251.0 km2) and the lowest reduction in forest cover loss (−227.9 km2), compared to LR with low population and reactive planning competing (288.0 km2 of development gain and 271.4 km2 of forest loss).
Table 3.
Estimated core and suitable habitat area and percent changes over time for five representative mammals in protected and non-protected areas during the contemporary period (2011) and under four land planning scenarios into 2060. HS represents high human population growth and strategic planning, HR represents high human population growth and reactive planning, LR represents low population growth and reactive planning, and LS represents low population growth and strategic planning. Habitat areas were predicted from the top-ranking occupancy models with effects of land cover and anthropogenic covariates from 1591 camera trap locations across an urban to rural gradient, northern Virginia, 2012–2018.
Predicted core habitat losses for bears and bobcats ranged from low under the LS planning scenario with 2.2% and 3.6% losses, respectively, to relatively high under the HR (4.7% loss) and HS (8.6% loss) scenarios, respectively. However, when the study area is stratified by protected status, it becomes apparent that habitat loss occurs mostly in unprotected habitat, with as high as 9.2% and 23.7% losses for bears and bobcats in scenarios HR and HS, respectively.
Predicted core and suitable habitats increased for domestic cats and red foxes under all planning scenarios. Substantial expansion, such as 39.3% for domestic cats’ core habitat and 88.8% core habitat growth for red foxes, was predicted under the HR planning scenario, whereas under the LS planning scenario, habitat expansion was lowest, ranging from 3.0% to 17.4% and 3.2% to 50.6% for suitable versus core habitat expansion for domestic cats and red foxes, respectively. Habitat for white-tailed deer does not vary strongly under any planning scenarios, ranging from a loss of 1.6% under HS to 2.2% gain under the LR planning scenario.
4. Discussion
We were able to model the predicted response of five representative mammal species to four planning scenarios for the study area. Although there was some variation in species-specific responses among the scenarios, we still presented unified patterns for use by land managers and development planners. Future landscapes would be beneficial and useful to both land managers and animal communities if they retained substantial habitat for sensitive species, and minimized expansion by the synanthropic species. Based on those criteria, it is not surprising that our results suggest that LS would be the most useful planning policy, with strategic planning for development and agriculture (and low population growth) retaining the most forest cover and the associated mammal communities.
Although bears and bobcats are sensitive to habitat loss and fragmentation [12,38], our results suggest that future habitat loss in this region is relatively limited, regardless of the planning policies adopted. This result highlights the observation that bears and bobcats are already largely restricted to the two largest forested areas (Shenandoah NP and George Washington NF) and that these areas will not lose significant habitat-appropriate areas in future projections due to their protected status. Counter to our predictions, the β coefficients from the occupancy models suggested a negative but weak association between these species’ distribution and protected areas. However, the relationship reveals that, aside from these two large forested areas, most other protected areas remain small or isolated, particularly among private protected lands [30], and their protected status alone is not enough to support these carnivores. In the case of bobcats, habitat losses are projected to be five times greater in unprotected areas under the high human growth scenarios. Bears exhibit less pronounced habitat losses in unprotected areas, likely due to their adaptability to living in exurban areas [39]. These results highlight the importance of protected areas for biodiversity preservation in developing landscapes [40], and their importance will only increase in the near future, as many small private forest patches are lost to development under each of the scenario models.
Both free-roaming domestic cats and red foxes are predicted to expand their distributions in the study area with the expansion of development and anthropogenic land uses under all scenarios. Those results correspond with other studies that show these mesopredators are highly associated with humans [7,8,10]. The impacts of range expansion by both species could be detrimental to biodiversity (e.g., small mammals, songbirds, and herpetofauna), particularly if high densities of cats and foxes are sustained due to subsidies from humans [41,42,43]. However, our predictive mesopredator models do not include interspecific interactions, which might further influence these predictions [43]. Specifically, coyotes were fairly common in our study area and they are known to influence the site use, abundance and behavior of both domestic cats and foxes [10,44,45]. Yet, our occupancy models did not have strong predictive power to accurately assess coyote distributions, and hence we were unable to directly incorporate these trophic interactions that might continue to limit the future expansion of mesopredators.
While our species are representative of relatively sensitive or synanthropic species, it is important to note that these five species and the additional 10 species detected are only a subset of historical mammal diversity from the study area. Apex predators (i.e., wolves (Canis lupus) and mountain lions (Puma concolor)) were extirpated, and other obligate carnivores, such as mustelids, are rare and were likely extirpated from much of the study area. Mesopredators have ascended to be the de facto top predators in many anthropogenic landscapes, yet we are only now learning the roles of many of these medium-sized predators in the context of trait-mediated cascades and their effectiveness in regulating herbivores and lower trophic taxa [28,46]. As such, our results are applicable for a typical eastern US landscape but might not represent the community dynamics of areas with intact apex predator guilds, such as the upper Midwest or Western US.
Our study was one of the first to pair contemporary camera trap data with occupancy models to predict current species distributions and then explore how those distributions might change under alternative planning scenarios in a rapidly developing area. However, we were unable to accurately predict the distributions of several mammalian species in contemporary times, and hence unable to predict potential changes in the future. Many of those species are common and highly associated with humans; e.g., northern raccoons and eastern gray squirrels. These synanthropes are likely responding to more fine-scale covariates, as exemplified by raccoons, most positively associated with housing densities and the associated human refuse, outdoor pet food, bird feeders, and other resource subsidies in anthropogenic and heterogeneous landscapes [47,48,49]. These unmodeled species will likely interact with other taxa, and therefore, warrant further examination with higher resolution habitat and anthropogenic covariates. Furthermore, our land cover predictions and planning scenarios operated over a short time span and did not incorporate potential climate change. Indeed, contemporary studies have shown that small mammals and plant communities are stratified and shift along elevational gradients, with prey responding variably to these synchronous plant community shifts in response to climate change [50,51]. However, since we cannot account for these changes in medium and large mammals or our land cover predictions, we do not expect these changes to affect medium and large mammals strongly beyond the scope of our predicted models, although we might consider our models conservative with respect to climate uncertainty.
5. Conclusions
Our results, based on contemporary mammal distributions and land cover associations, provide useful generalized patterns of planning scenarios. Those highlight the value of large and contiguous public lands and their continued protection from development and expansion as a buffer to rapidly changing environments. Strategic planning will also benefit mammal communities and multiple stakeholders by retaining habitats for sensitive species and minimizing the expansion of synanthropic species. Moreover, we find that planning and policy decisions will be particularly influential in private landscapes, where there is ample opportunity for increasing protected lands area and targeting landscape features that benefit mammal communities.
Supplementary Materials
The following are available online at https://www.mdpi.com/2072-4292/11/21/2482/s1. Table S1: A priori models comparing the effects of landcover, anthropogenic, and geomorphological covariates on the probability of site use by mammals from 1591 camera trap locations across an urban to rural gradient, northern Virginia, 2010–2018. Models were run with species-specific detection covariates for all models and species-specific scales (500m or 100m) in the additive models. Table S2: Summary statistics, including independent detections, detection rate (per 100 trap days), and naïve occupancy for 15 mammal species detected from 1591 camera trap locations across an urban to rural gradient, northern Virginia, 2010–2018; Table S3: Model selection statistics for top occupancy models comparing the effects of landcover, anthropogenic, and geomorphological covariates on the probability of site use by American black bears, bobcats, domestic cats, red foxes, and white-tailed deer from 1591 camera trap locations across an urban to rural gradient, northern Virginia, 2010–2018. Symbols: Δi is AICc difference, ωi is the Akaike weight, K is the number of model parameters, and AUC is the area under the ROC curve. Table S4: Model selection statistics for top occupancy models comparing the effects of landcover, anthropogenic, and geomorphological covariates on the probability of site use by gray foxes, coyotes, raccoons, striped skunks, Virginia opossums, eastern fox squirrels, eastern gray squirrels, eastern chipmunks, eastern cottontail rabbits, and woodchucks from 1591 camera trap locations across an urban to rural gradient, northern Virginia, 2010–2018. Symbols: Δi is AICc difference, ωi is the Akaike weight, K is the number of model parameters, and AUC is the area under the ROC curve. Bolded entries are significant in that confidence intervals exclude zero. Coefficients are in logit space and relate to standardized covariate values.
Author Contributions
conceptualization, M.C., C.F., I.L., T.A., and W.M.; methodology, M.C., C.F., I.L., T.A., and W.M.; formal analysis, M.C. and C.F.; resources, M.C., C.F., I.L., T.A., and W.M.; data curation, M.C., C.F., and I.L.; writing—original draft preparation, M.C.; writing—review and editing, M.C., C.F., I.L., T.A., and W.M.; project administration, I.L., T.A., and W.M.; funding acquisition, I.L., T.A., and W.M.
Funding
This research was funded and supported by the Changing Landscapes Initiative and Smithsonian Conservation Biology Institute.
Acknowledgments
Thank you to the eMammal citizen scientists, and SCBI interns that ran camera traps in the region. Special thanks to Jen Zhao for all of her efforts managing the eMammal database. Thanks to CLI interns Sarah Halparin and Erin Carroll for all their assistance in developing the metrics for our analyses, and to Brent Pease for his assistance with code, analyses, and comments on a draft.
Conflicts of Interest
The authors declare no conflict of interest.
Appendix A
Table A1.
Reclassification scheme for National Land Cover Database (NLCD) land cover classes to the Changing Landscapes Initiative (CLI) study area classification in norther Virginia.
Table A1.
Reclassification scheme for National Land Cover Database (NLCD) land cover classes to the Changing Landscapes Initiative (CLI) study area classification in norther Virginia.
| CLI Land Cover Class | NLCD Land Cover Class |
|---|---|
| Open Water | Open Water |
| Developed Open Space | Developed Open Space |
| Developed | Developed, Low Intensity |
| Developed, Medium Intensity | |
| Developed, High Intensity | |
| Barren | Barren Land |
| Forest | Deciduous Forest |
| Evergreen Forest | |
| Mixed Forest | |
| Shrub/Scrub | |
| Grass | Grassland/Herbaceous |
| Pasture/Hay | |
| Crop | Cultivated Crops |
| Wetland | Woody Wetlands |
| Emergent Herbaceous Wetlands |
References
- Kareiva, P.; Marvier, M. What is conservation science? Bioscience 2012, 62, 962–969. [Google Scholar] [CrossRef]
- Pimm, S.L.; Jenkins, C.N.; Abell, R.; Brooks, T.M.; Gittleman, J.L.; Joppa, L.N.; Raven, P.H.; Roberts, C.M.; Sexton, J.O. The biodiversity of species and their rates of extinction, distribution, and protection. Science 2014, 344, 1246752. [Google Scholar] [CrossRef] [PubMed]
- Schipper, J.; Chanson, J.S.; Chiozza, F.; Cox, N.A.; Hoffmann, M.; Katariya, V.; Lamoreux, J.; Rodrigues, A.S.L.; Stuart, S.N.; Temple, H.J.; et al. The status of the world’s land and marine mammals: diversity, threat, and knowledge. Science 2008, 322, 225–230. [Google Scholar] [CrossRef] [PubMed]
- Gaynor, K.M.; Hojnowski, C.E.; Carter, N.H.; Brashares, J.S. The influence of human disturbance on wildlife nocturnality. Science 2018, 360, 1232–1235. [Google Scholar] [CrossRef] [PubMed]
- Tucker, M.A.; Bohning-Gaese, K.; Fagan, W.F.; Fryxell, J.M.; Van Moorter, B.; Alberts, S.C.; Ali, A.H.; Allen, A.M.; Attias, N.; Avgar, T.; et al. Moving in the Anthropocene: Global reductions in terrestrial mammalian movements. Science 2018, 359, 466–469. [Google Scholar] [CrossRef] [PubMed]
- Fisher, J.T.; Burton, A.C. Wildlife winners and losers in an oil sands landscape. Front. Ecol. Environ. 2018, 16, 323–328. [Google Scholar] [CrossRef]
- Lesmeister, D.B.; Nielsen, C.K.; Schauber, E.M.; Hellgren, E.C. Spatial and temporal structure of a mesocarnivore guild in Midwestern North America. Wildl. Monograpghs 2015, 191, 1–61. [Google Scholar] [CrossRef]
- Morin, D.J.; Lesmeister, D.B.; Nielsen, C.K.; Schauber, E.M. The truth about cats and dogs: Landscape composition and human occupation mediate the distribution and potential impact of non-native carnivores. Glob. Ecol. Conserv. 2018, 15, e00413. [Google Scholar] [CrossRef]
- Pardo Vargas, L.E.; Cove, M.V.; Spinola, R.M.; de la Cruz, J.C.; Saenz, J.C. Assessing species traits and landscape relationships of the mammalian carnivore community in a neotropical biological corridor. Biodivers. Conserv. 2016, 25, 739–752. [Google Scholar] [CrossRef]
- Cove, M.V.; Jones, B.M.; Bossert, A.J.; Clever Jr, D.R.; Dunwoody, R.K.; White, B.C.; Jackson, V.L. Use of camera traps to examine the mesopredator release hypothesis in a fragmented Midwestern landscape. Am. Midl. Nat. 2012, 168, 456–465. [Google Scholar] [CrossRef]
- Goad, E.H.; Pejchar, L.; Reed, S.E.; Knight, R.L. Habitat use by mammals varies along an exurban development gradient in northern Colorado. Biol. Conserv. 2014, 176, 172–182. [Google Scholar] [CrossRef]
- Long, R.A.; Donovan, T.M.; Mackay, P.; Zielinski, W.J.; Buzas, J.S. Predicting carnivore occurrence with noninvasive surveys and occupancy modeling. Landsc. Ecol. 2011, 26, 327–340. [Google Scholar] [CrossRef]
- Ordeñana, M.A.; Crooks, K.R.; Boydston, E.E.; Lyren, L.M.; Siudyla, S.; Haas, C.D.; Harris, S.; Hathaway, S.A.; Turschak, G.M.; Miles, A.K.; et al. Effects of urbanization on carnivore species distribution and richness. J. Mamm. 2010, 91, 1322–1331. [Google Scholar] [CrossRef]
- Long, R.A.; MacKay, P.; Ray, J.; Zielinski, W. (Eds.) Noninvasive Survey Methods for Carnivores; Island Press: Washington, DC, USA, 2008. [Google Scholar]
- Steenweg, R.; Hebblewhite, M.; Kays, R.; Ahumada, J.; Fisher, J.T.; Burton, C.; Townsend, S.E.; Carbone, C.; Rowcliffe, J.M.; Whittington, J.; et al. Scaling-up camera traps: Monitoring the planet’s biodiversity with networks of remote sensors. Front. Ecol. Environ. 2017, 15, 26–34. [Google Scholar] [CrossRef]
- Ye, X.; Yu, X.; Yu, C.; Tayibazhaer, A.; Xu, F.; Skidmore, A.K.; Wang, T. Impacts of future climate and land cover changes on threatened mammals in the semi-arid Chinese Altai Mountains. Sci. Tot. Environ. 2018, 612, 775–787. [Google Scholar] [CrossRef]
- Lawler, J.J.; Shafer, S.L.; White, D.; Kareiva, P.; Maurer, E.P.; Blaustein, A.R.; Bartlein, P.J. Projected climate-induced faunal change in the Western Hemisphere. Ecology 2009, 90, 588–597. [Google Scholar] [CrossRef]
- Levinsky, I.; Skov, F.; Svenning, J.C.; Rahbek, C. Potential impacts of climate change on the distributions and diversity patterns of European mammals. Biodivers. Conserv. 2007, 16, 3803–3816. [Google Scholar] [CrossRef]
- Lacher, I.; Akre, T.; McShea, W.J.; McBride, M.; Thompson, J.R.; Fergus, C. Engaging regional stakeholders in scenario planning for the long-term preservation of ecosystem services in Northwestern Virginia. Case Stud. Environ. 2019. [Google Scholar] [CrossRef]
- Bennett, E.M.; Carpenter, S.R.; Peterson, G.D.; Cumming, G.S.; Zurek, M.; Pingali, P. Why global scenarios need ecology. Front. Ecol. Environ. 2003, 1, 322–329. [Google Scholar] [CrossRef]
- Peterson, G.D.; Cumming, G.S.; Carpenter, S.R. Scenario planning: a tool for conservation in an uncertain world. Conserv. Biol. 2003, 17, 358–366. [Google Scholar] [CrossRef]
- Lacher, I.L.; Ahmadisharaf, E.; Fergus, C.; Akre, T.; Mcshea, W.J.; Benham, B.L.; Kline, K.S. Scale-dependent impacts of urban and agricultural land use on nutrients, sediment, and runoff. Sci. Tot. Environ. 2019, 652, 611–622. [Google Scholar] [CrossRef] [PubMed]
- Kays, R.; Parsons, A.W.; Baker, M.C.; Kalies, E.L.; Forrester, T.; Costello, R.; Rota, C.T.; Millspaugh, J.J.; Mcshea, W.J. Does hunting or hiking affect wildlife communities in protected areas? J. Appl. Ecol. 2017, 54, 242–252. [Google Scholar] [CrossRef]
- McShea, W.J.; Forrester, T.; Costello, R.; He, Z.; Kays, R. Volunteer-run cameras as distributed sensors for macrosystem mammal research. Landsc. Ecol. 2016, 31, 55–66. [Google Scholar] [CrossRef]
- Parsons, A.W.; Forrester, T.; Baker-Whatton, M.C.; McShea, W.J.; Rota, C.T.; Schuttler, S.G.; Millspaugh, J.J.; Kays, R. Mammal communities are larger and more diverse in moderately developed areas. ELife 2018, 7, e38012. [Google Scholar] [CrossRef]
- Mackenzie, D.I.; Nichols, J.D.; Royle, J.A.; Pollock, K.H.; Bailey, L.L.; Hines, J.E. Occupancy Estimation and Modeling, 2nd ed.; Academic Press: Burlington, MA, USA, 2018. [Google Scholar]
- Homer, C.; Dewitz, J.; Yang, L.; Jin, S.; Danielson, P.; Xian, G. Completion of the 2011 National Land Cover Database for the conterminous United States–representing a decade of land cover change information. Photogramm. Eng. Remote Sens. 2015, 81, 345–354. [Google Scholar]
- Jones, B.M.; Cove, M.V.; Lashley, M.A.; Jackson, V.L. Do coyotes Canis latrans influence occupancy of prey in suburban forest fragments? Curr. Zool. 2016, 62, 1–6. [Google Scholar] [CrossRef]
- U.S. Geological Survey (USGS); Gap Analysis Project (GAP). Protected Areas Database of the United States (PAD-US). 2016. U.S. Geological Survey data release. Available online: https://maps.usgs.gov/padus/ (accessed on 1 April 2019).
- Lacher, I.; Akre, T.; McShea, W.J.; Fergus, C. Spatial and temporal patterns of public and private land protection within the Blue Ridge and Piedmont ecoregions of the eastern US. Landsc. Urban Plan. 2019, 186, 91–102. [Google Scholar] [CrossRef]
- McGarigal, K.; Cushman, S.A.; Ene, E. Fragstats v4: Spatial Pattern Analysis Program for Categorical and Continuous Maps. Computer software program produced by the authors at the University of Massachusetts, Amherst. 2012. Available online: http://www.umass.edu/landeco/research/fragstats/fragstats.html (accessed on 1 April 2019).
- Fiske, I.; Chandler, R.; Miller, D.; Royle, J.A.; Kery, M.; Hostetler, J.; Hutchinson, R.; Smith, A.; Kellner, K. Package ‘Unmarked’. 2019. Available online: https://cran.r-project.org/web/packages/unmarked/unmarked.pdf (accessed on 24 October 2019).
- R Development Core Team. R: A Language and Environment for Statistical Computing. 2011. Available online: https://www.r-project.org/ (accessed on 24 October 2019).
- Sing, T.; Sander, O.; Beerenwinkel, N.; Lengauer, T. ROCR: visualizing classifier performance in R. Bioinformatics 2005, 21, 3940–3941. [Google Scholar] [CrossRef]
- Soares-Filho, B.S.; Cerqueira, G.C.; Pennachin, C.L. DINAMICA—a stochastic cellular automata model designed to simulate the landscape dynamics in an Amazonian colonization frontier. Ecol. Model. 2002, 154, 217–235. [Google Scholar] [CrossRef]
- Bradbury, M.; Peterson, M.N.; Liu, J. Long-term dynamics of household size and their environmental implications. Pop. Environ. 2014, 36, 73–84. [Google Scholar] [CrossRef]
- Available online: https://demographics.coopercenter.org/virginia-population-projections (accessed on 1 April 2019).
- Crooks, K.R. Relative sensitivities of mammalian carnivores to habitat fragmentation. Conserv. Biol. 2002, 16, 488–502. [Google Scholar] [CrossRef]
- Evans, M.J.; Rittenhouse, T.A.; Hawley, J.E.; Rego, P.W. Black bear recolonization patterns in a human-dominated landscape vary based on housing: New insights from spatially explicit density models. Landsc. Urban Plan. 2017, 162, 13–24. [Google Scholar] [CrossRef]
- Gray, C.L.; Hill, S.L.; Newbold, T.; Hudson, L.N.; Börger, L.; Contu, S.; Hoskins, A.J.; Ferrier, S.; Purvis, A.; Scharlemann, J.P.W. Local biodiversity is higher inside than outside terrestrial protected areas worldwide. Nat. Commun. 2016, 7, 12306. [Google Scholar] [CrossRef] [PubMed]
- Cove, M.V.; Gardner, B.; Simons, T.R.; Kays, R.; O’Connell, A.F. Free-ranging cats (Felis catus) on public lands: estimating density, movement, activity and diet. Biol. Invasions. 2018, 20, 333–344. [Google Scholar] [CrossRef]
- Hernandez, S.M.; Loyd, K.A.T.; Newton, A.N.; Carswell, B.L.; Abernathy, K.J. The use of point-of-view cameras (Kittycams) to quantify predation by colony cats (Felis catus) on wildlife. Wildl. Res. 2018, 45, 357–365. [Google Scholar] [CrossRef]
- Loss, S.R.; Will, T.; Marra, P.P. The impact of free-ranging domestic cats on wildlife of the United States. Nat. Commun. 2013, 4, 1396. [Google Scholar] [CrossRef]
- Parsons, A.W.; Rota, C.T.; Forrester, T.; Baker-Whatton, M.C.; McShea, W.J.; Schuttler, S.G.; Millspaugh, J.J.; Kays, R. Urbanization focuses carnivore activity in remaining natural habitats, increasing species interactions. J. Appl. Ecol. 2019. [Google Scholar] [CrossRef]
- Kays, R.; Costello, R.; Forrester, T.; Baker, M.C.; Parsons, A.W.; Kalies, E.L.; Hess, G.; Millspaugh, J.J.; Mcshea, W. Cats are rare where coyotes roam. J. Mamm. 2015, 96, 981–987. [Google Scholar] [CrossRef]
- Bragina, E.V.; Kays, R.; Hody, A.; Moorman, C.E.; Deperno, C.S.; Mills, L.S. Effects on white-tailed deer following eastern coyote colonization. J. Wildl. Manag. 2019. [Google Scholar] [CrossRef]
- Cove, M.V.; Niva, L.M.; Jackson, V.L. Use of probability of detection when conducting analyses of surveys of mesopredators: A Case Study from the Ozark Highlands of Missouri. Southwest Nat. 2012, 57, 257–262. [Google Scholar] [CrossRef]
- Demeny, K.; McLoon, M.; Winesett, B.; Fastner, J.; Hammerer, E.; Pauli, J.N. Food subsidies of Raccoons in anthropogenic landscapes. Can. J. Zool. 2019. [Google Scholar] [CrossRef]
- Kays, R.; Parsons, A.W. Mammals in and around suburban yards, and the attraction of chicken coops. Urban Ecosyst. 2014, 17, 691–705. [Google Scholar] [CrossRef]
- Moritz, C.; Patton, J.L.; Conroy, C.J.; Parra, J.L.; White, G.C.; Beissinger, S.R. Impact of a century of climate change on small-mammal communities in Yosemite National Park, USA. Science 2008, 322, 261–264. [Google Scholar] [CrossRef] [PubMed]
- Santos, M.J.; Thorne, J.H.; Moritz, C. Synchronicity in elevation range shifts among small mammals and vegetation over the last century is stronger for omnivores. Ecography 2015, 38, 556–568. [Google Scholar] [CrossRef]


© 2019 by the authors. Licensee MDPI, Basel, Switzerland. This article is an open access article distributed under the terms and conditions of the Creative Commons Attribution (CC BY) license (http://creativecommons.org/licenses/by/4.0/).