1. Introduction
The level of urbanization went up by almost 80 percent in some parts of the world in 2003 including North America, Europe, and Australia and more than half of the world’s population lives in urban areas today [
1]. This number is expected to increase even more in the coming years. Urbanization is more intense and complex in the coastal areas given that they are more densely populated with higher rate of urban expansion than surrounding areas [
2]. According to United Nations (2018) [
1], about 66% of total population is projected to be living in urban areas by 2050. As the total urban and coastal population is expected to increase at an alarming rate, urban growth and urbanization have become a crucial issue among the city planners, policymakers, and scientific community.
Urbanization or urban expansion mainly characterized by population change from rural to urban areas and conversion of urban lands from non-urban lands [
3] which presents both prospects to the society by enhancing economic development and challenges by bringing different social, cultural, and environmental problems, which may affect the overall living quality of people [
3,
4,
5,
6,
7,
8]. Also, the physical growth of urban land is considered to be one of the most radical and unalterable forms of land alterations on the planet [
9,
10]. Most often, the impacts of urban expansion exceed its boundary [
6,
11] and include landscape change [
12,
13], loss of agricultural land [
9], biodiversity [
14,
15], air and water pollution [
4,
16,
17], biogeochemical cycles [
18,
19], and local and regional climate change [
4,
20,
21] at different scales.
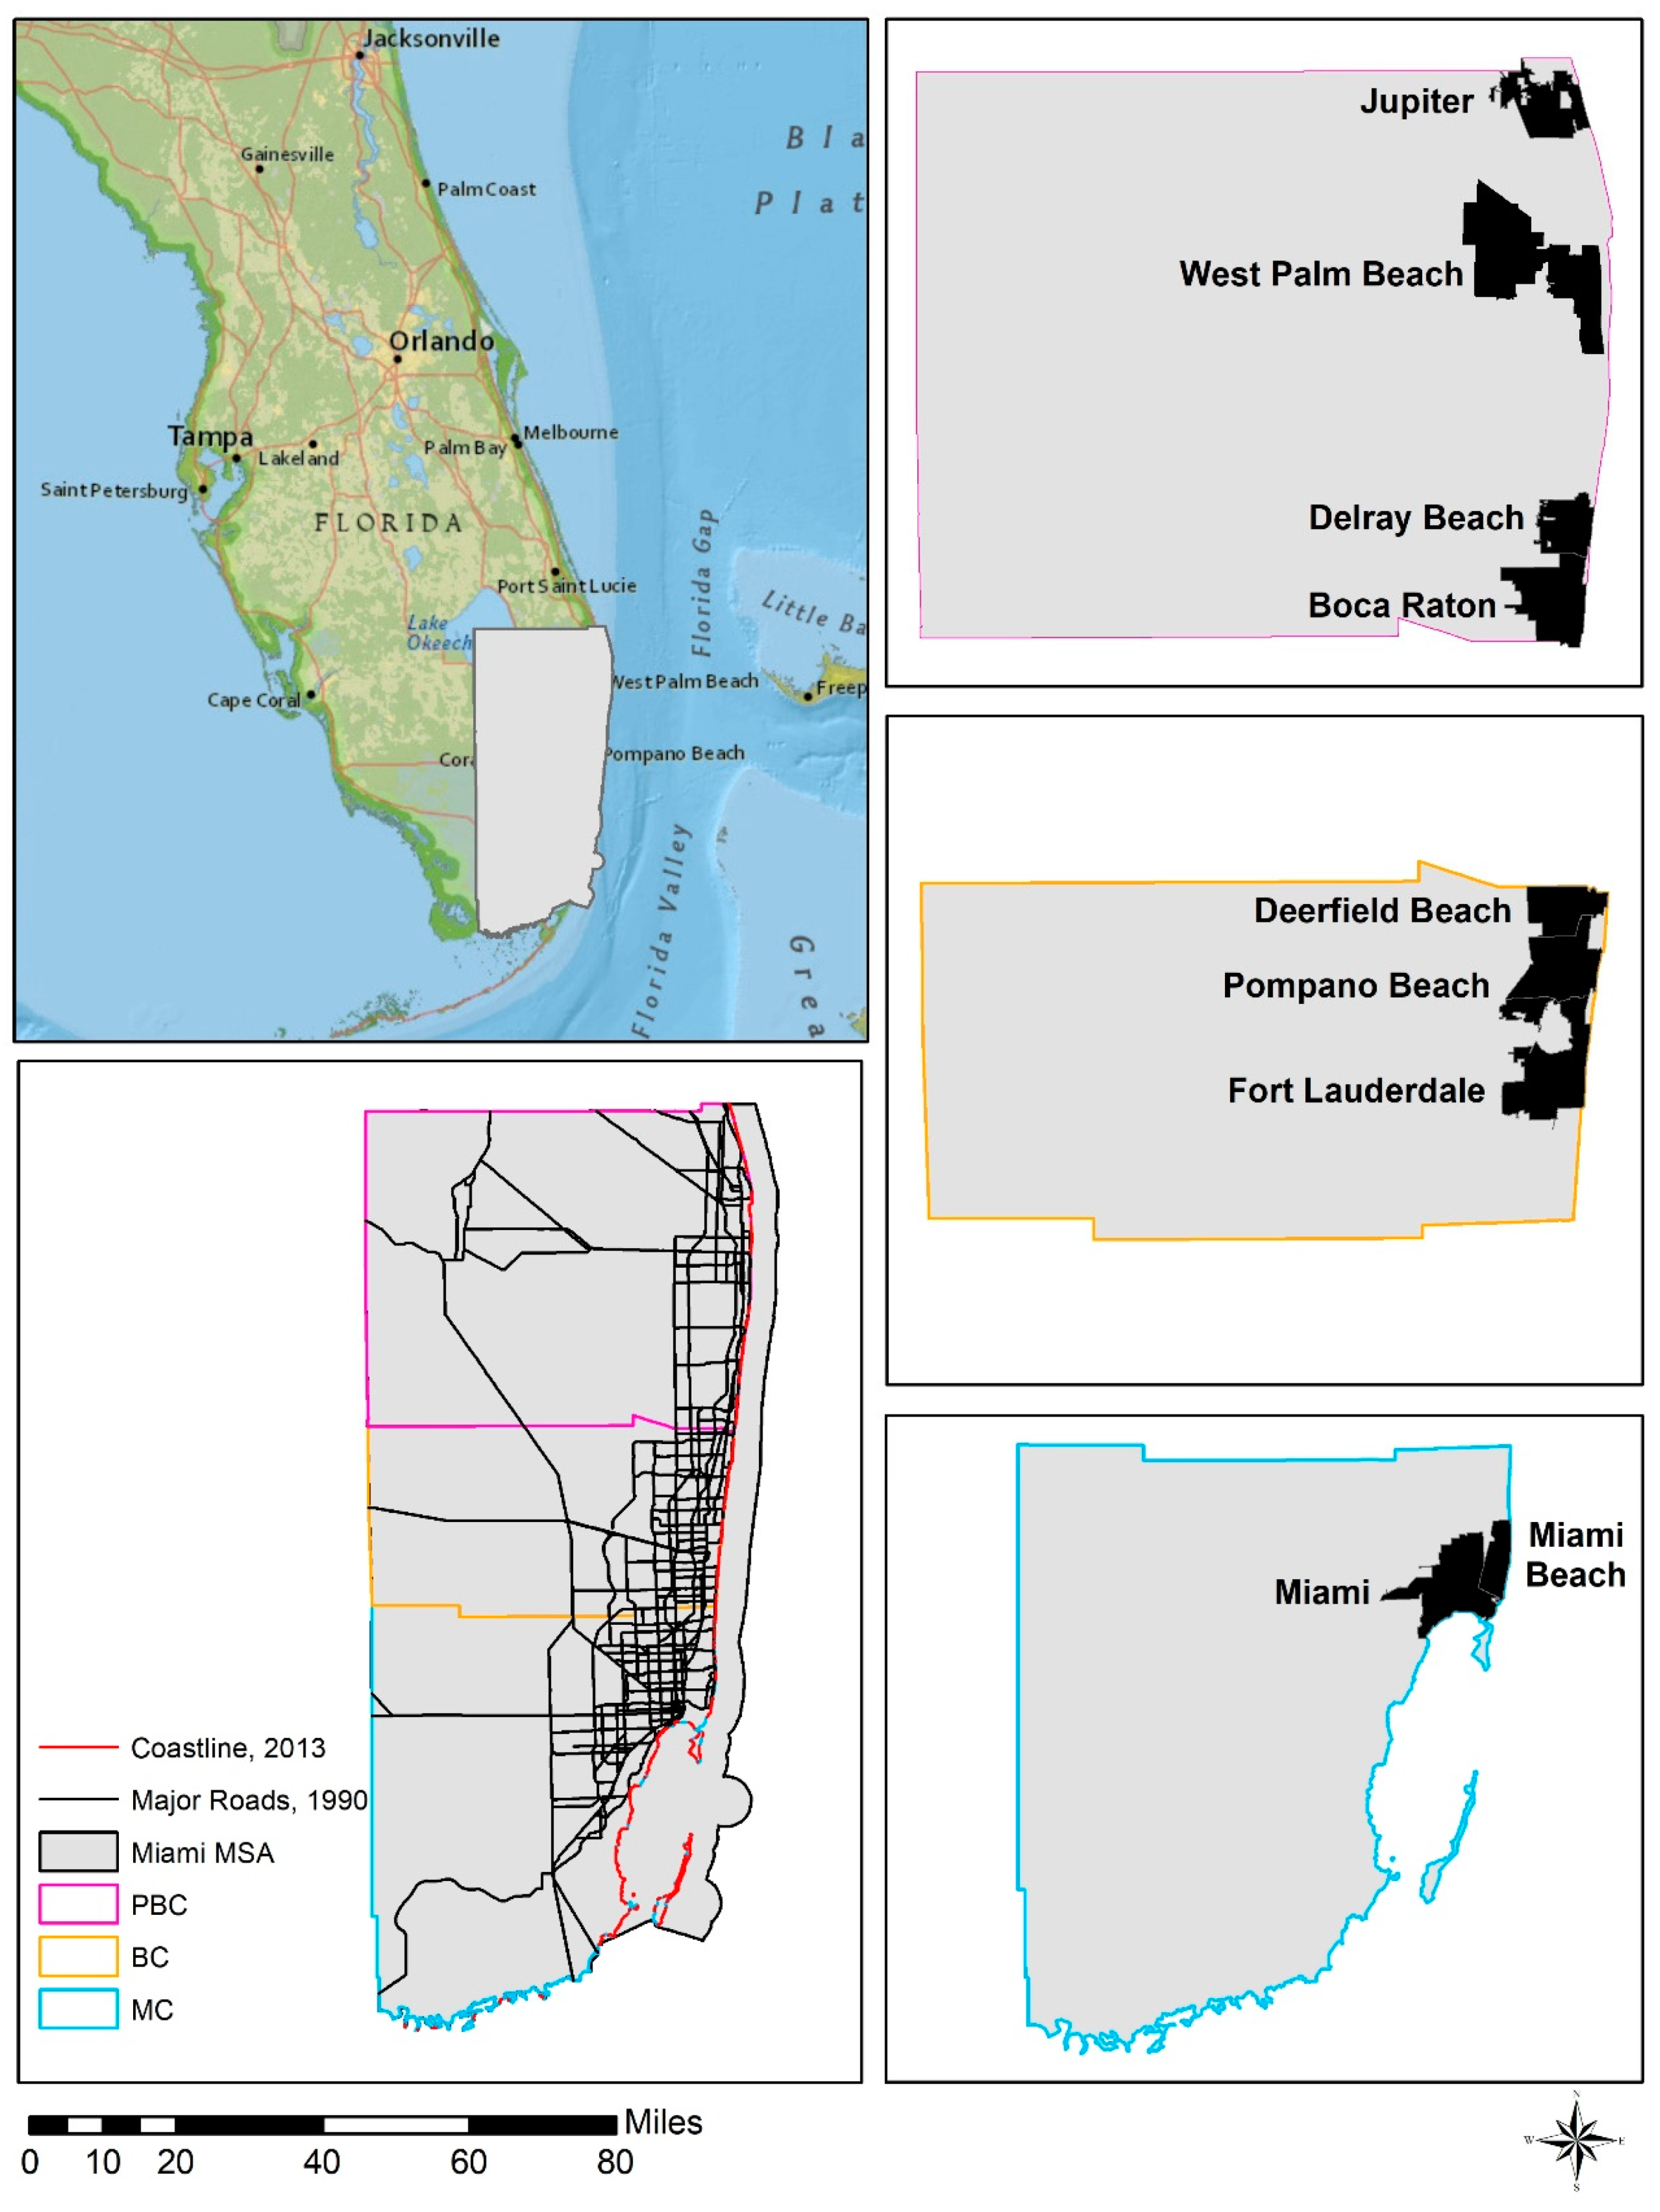
The population in Florida (FL) increased from 12 million in 1990 to almost 21 million in 2018. South Florida is not an exception. During the past two decades, South Florida experienced a moderate but noticeable urban expansion, especially in the urban region. The economic development in this region had a boost-up during the start of the nineteenth century by involving the private-sector induced tourism and urban land conversion from natural land was accounted for more than 50% of the total natural land conversion between the period 1973–1995 [
22]. The south Florida region consists of one of the largest Metropolitan Statistical Area (MSA) in the United States named ‘Miami-Fort Lauderdale-Palm Beach, FL MSA’. This region is our study area of this paper and will be referred to as ‘Miami MSA’ in the rest of the paper.
Remote sensing is an important source of data when it comes to land use land cover (LULC) change analysis with high spatial and temporal accuracy [
23,
24,
25]. With the help of Geographical Information Systems (GIS), remote sensing improved the evaluation and examination of the urban growth process [
26]. Landscape metrics have been widely used to analyze landscape patterns of urban expansion [
24,
27,
28,
29].
Many studies have been conducted utilizing the remote sensing data and landscape metrics combined with GIS techniques to quantify the spatiotemporal dynamics of urban expansion [
3,
13,
26,
30,
31,
32,
33,
34,
35]. Among them, most of the studies concentrated on developing countries like China considering their rapid urbanization over the last few decades. Zhao et al. (2015) [
31] studied urbanization processes in two moderately developed cities in China by quantifying and comparing dynamics of urban expansion between those two cities and analyzing the trend of landscape metrics and growth types. Shi et al. (2018) [
35] examined the dynamics of urban expansion over the 15 years’ period in southeastern China by utilizing Nighttime Light Data from National Oceanic and Atmospheric Administration (NOAA). Sun et al. (2014) [
26] studied spatiotemporal pattern of urban expansion in northeast China over the last three decades by quantifying the urban expansion rates and their spatial extent, different types of urban expansion, urban expansion intensity, and landscape metrics in their study region. Li et al. (2016) [
34] studied the change of urban land areas at regional scale over the last two decades in 15 metropolitan areas in the southeastern United States. Chen et al. (2018) [
36] quantified the urban expansion pattern in northeast China over 25 years using the Landsat imageries and analyzed the influence of socioeconomic factors on urban expansion between that time period. Yu and Zhou (2017) [
37] analyzed spatiotemporal patterns of urban land expansion at regional and city scale and examined how geographical location, city size, and expansion rate influence overall urban expansion at different scales. However, there is still not enough research done that concentrates on the urban expansion process in the moderately growing urban areas in an already developed region like south Florida. Most of the previous research studied areas where rapid urban expansion occurred. Moreover, many of those studies only quantified spatiotemporal patterns of urban expansion in a single administrative boundary (e.g., city, metropolitan area, province, etc.).
Generally, urban expansion patterns are analyzed by examining the explanatory factors of urban growth. Previous studies have found that urban expansion is driven by socioeconomic factors like population and economy [
36,
38,
39]. In most cases, a qualitative approach was taken to describe those guiding factors due to a lack of data where quantitative analysis would be more effective [
36]. Furthermore, it is not only socioeconomic factors that drive urban expansion in an area but physical factors like elevation [
40,
41] and proximity factors like distance to river and water [
42,
43] and distance to major roads [
44,
45] also influence urban expansion. Physical factors influence urban expansion in two ways: they may provide a spatial direction of urban land development (e.g., a mountain) or may serve as limiting factors for urban development such as extreme slope, unsuitable soils for development, etc. However, quantitative analysis of urban expansion patterns that incorporate various explanatory factors (socioeconomic, physical, and proximity factors) has been inadequate. Additionally, the spatial and temporal variation of those factors of urban expansion were hardly studied [
46].
In this study, we quantified and analyzed urban expansion and its spatiotemporal patterns in Miami MSA for the last 25 years (1992–2016) at a 5-year temporal scale using the National Land Cover Datasets (NLCD) and NOAA (under the Coastal Change Analysis Program (C-CAP)) combined with landscape metrics. We then further examined the urban expansion process at the county level and compared and analyzed the spatiotemporal pattern of urban growth in the three counties (Miami-Dade, Broward, and Palm Beach) in Miami MSA. Additionally, to get the local representation of urban expansion in this region for the last 25 years, we further explored the urban expansion scenario at the city level in the study area. We also examined the influence of spatiotemporal variations in guiding factors on urban expansion in the study area. The explanatory/guiding factors were chosen based on the previous literature and local knowledge. The objectives of this study were to (1) analyze and compare the extent of urban expansion at metropolitan, county, and city level, (2) illustrate the spatiotemporal patterns of urban expansion at different administrative levels, (3) analyze and compare the landscape metrics of urban expansion and their types at those administrative levels, and (4) quantify the influence of major explanatory factors on urban expansion.
3. Results
3.1. Urban Expansion Rate
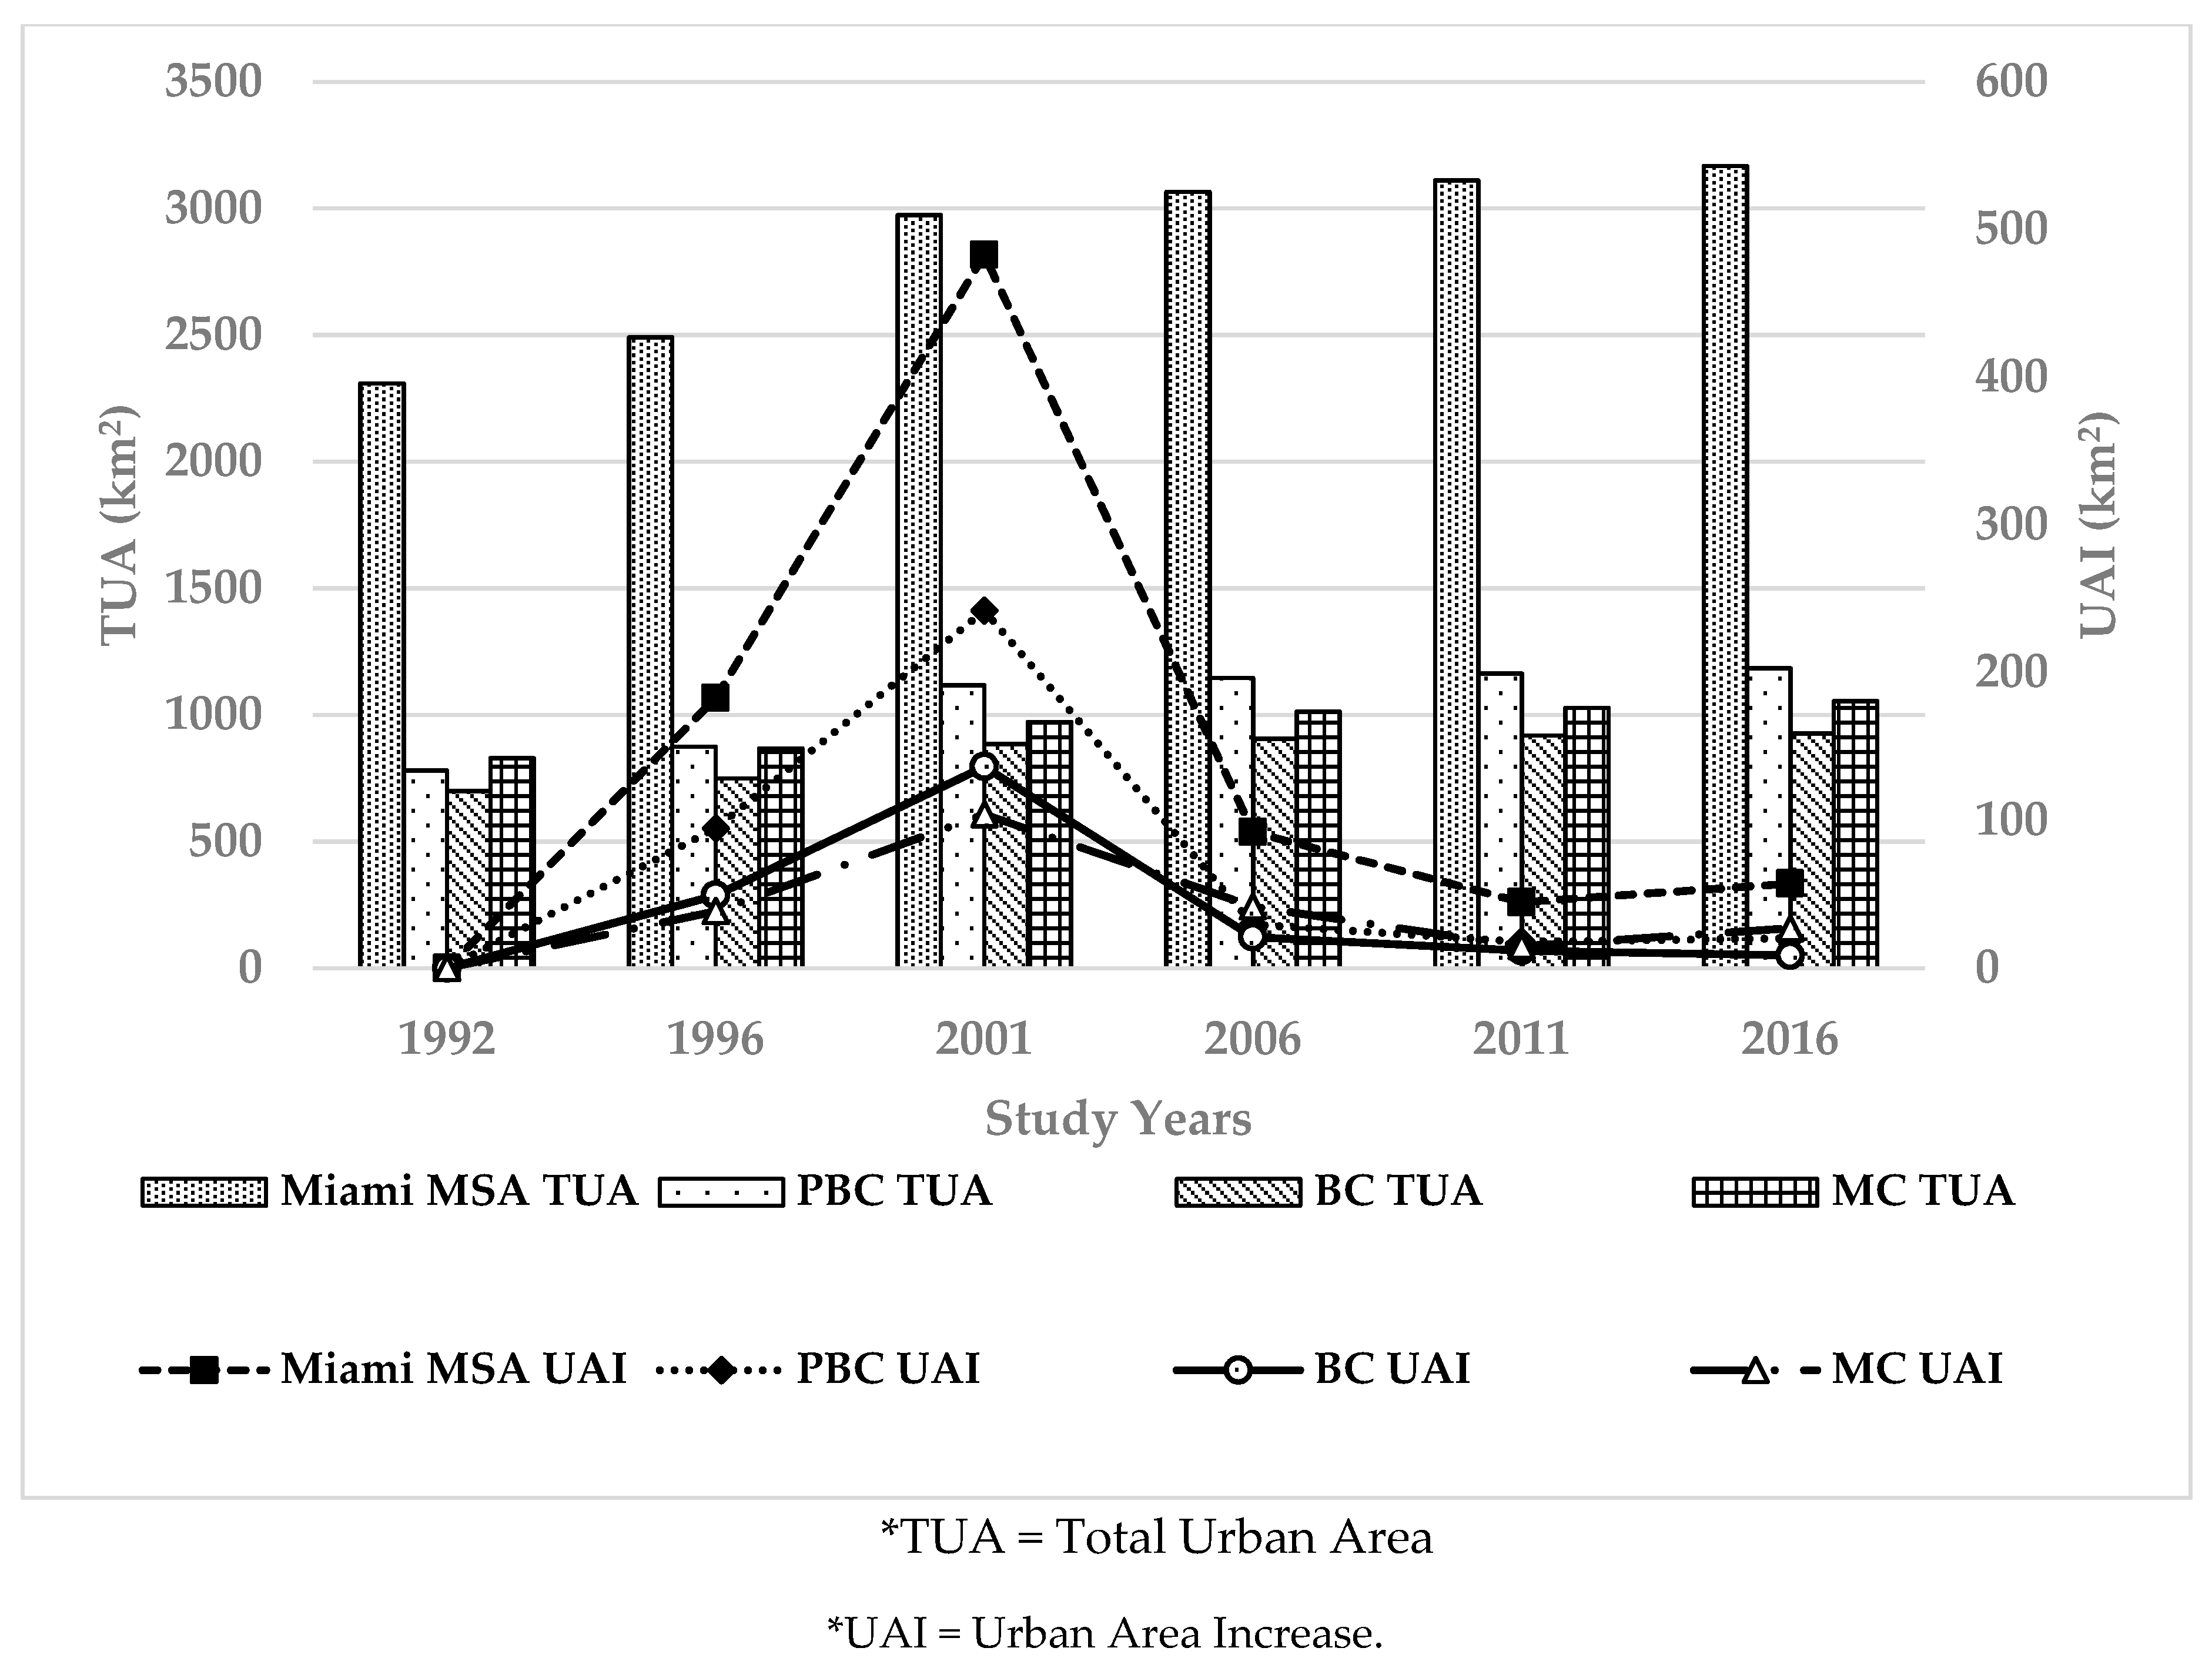
The Miami MSA has gone through a moderate but noticeable urban expansion over the last 25 years (
Figure 3 and
Appendix A) where the proportion of urban land increased and non-urban land decreased. From the period 1992 to 2016, the urban land increased from 2308.28 km
2 to 3167.78 km
2 which is 859.5 km
2 of newly developed urban land in total in the last 25 years. The AUE
a in this period was 34.38 km
2 year
−1. To get the sense of urban expansion in the study area more locally, we then looked into the urban expansion in the last 25 years in the three counties (Palm Beach, Broward, and Miami-Dade) individually. The urban land in Palm Beach County (PBC) increased substantially where the total urban land in 1992 was 780.01 km
2 and it increased to 1183.77 km
2 in 2016 with an average annual growth rate of 16.15 km
2 year
−1. Urban land expanded with an average growth rate of just over 9 km
2 year
−1 in both Broward County (BC) and Miami-Dade County (MC) (
Figure 3).
However, these urban expansions were not the same across different time periods. In Miami MSA, the AUE
a was 45.7 km
2 year
−1 from 1992 to 1996 and 96.57 km
2 year
−1 between 1996 and 2001. After 2001, there was a sharp decrease in urban land growth in this area. The rate decreased to 18.41 km
2 year
−1 from 2001 to 2006 and continued to decrease till 2011 when it was found as 8.91 km
2 year
−1. It then again increased to 11.45 km
2 year
−1 between the period 2011–2016 (
Table 4).
Similarly, PBC experienced rapid urban expansion between the periods 1992–1996 and 1996–2001 where the AUE
a were 23.64 and 48.39 km
2 year
−1. After 2001, it had a steep decrease in AUE
a until 2011 when the rate was 3.56 km
2 year
−1. After 2011, it again had a slight increase with 4.02 km
2 year
−1. AUE
a in MC between 1992 –1996 and 1996 –2001 were the lowest among three counties when the rate was found as 9.63 and 20.82 km
2 year
−1, respectively. After 2001, it experienced a sharp decrease until 2016. However, between the period 2001–2006 and 2011–2016, MC had the highest AUE
a in the tri-county region where the rate was 8.34 and 5.38 km
2 year
−1, respectively. In BC, AUE
a was 12.31 km
2 year
−1 between 1992–1996 and 27.28 km
2 year
−1 between 1996–2001. Following the same pattern as other counties, it then continued to decrease till the end when the rate was only 1.72 km
2 year
−1 in the period 2011–2016 (
Table 4). PBC had the highest rate of overall (1992–2016) AUE
a (16.15 km
2 year
−1) among these three counties and MC and BC had almost same overall AUE
a (9.08 and 9.04 km
2 year
−1, respectively).
The overall AUE
s in Miami MSA between the period 1992–2016 was found as 1.27%. Again, in the beginning, between 1992–1996, the rate was almost 2%. Then it increased to 3.61% between 1996–2001. After 2001, it experienced a sharp decrease till the end (2011–2016) where the AUE
s were below 1% in this area. The AUE
s in PBC were almost 3% between 1992–1996 which accounts for the highest rate of standardized annual urban expansion between the three counties in this period. It then increased to 5% between 1996–2001. After 2001, it had a sharp decrease till 2016 where the AUE
s were below 1% in all the period making the overall average AUE
s in PBC as 1.68%. In BC and MC, the AUE
s were 1.71% and 1.14% respectively between the period 1992–1996. It then increased to 3.4% and 2.29% respectively in the following period (1996–2001). After 2001, BC experienced a steep decrease in AUE
s as it went below 1% for the rest of the periods. MC also experienced a noticeable decrease in AUE
s as it was 0.84% in the period (2001–2006), 0.29% between 2006–2011, and increased to 0.52% again between 2011–2016. Interestingly, both the BC and MC had almost the similar overall average AUE
s including 1.13% and just below 1%, respectively, over the last 25 years considering the AUE
a in MC was substantially lower than that of BC (
Table 4).
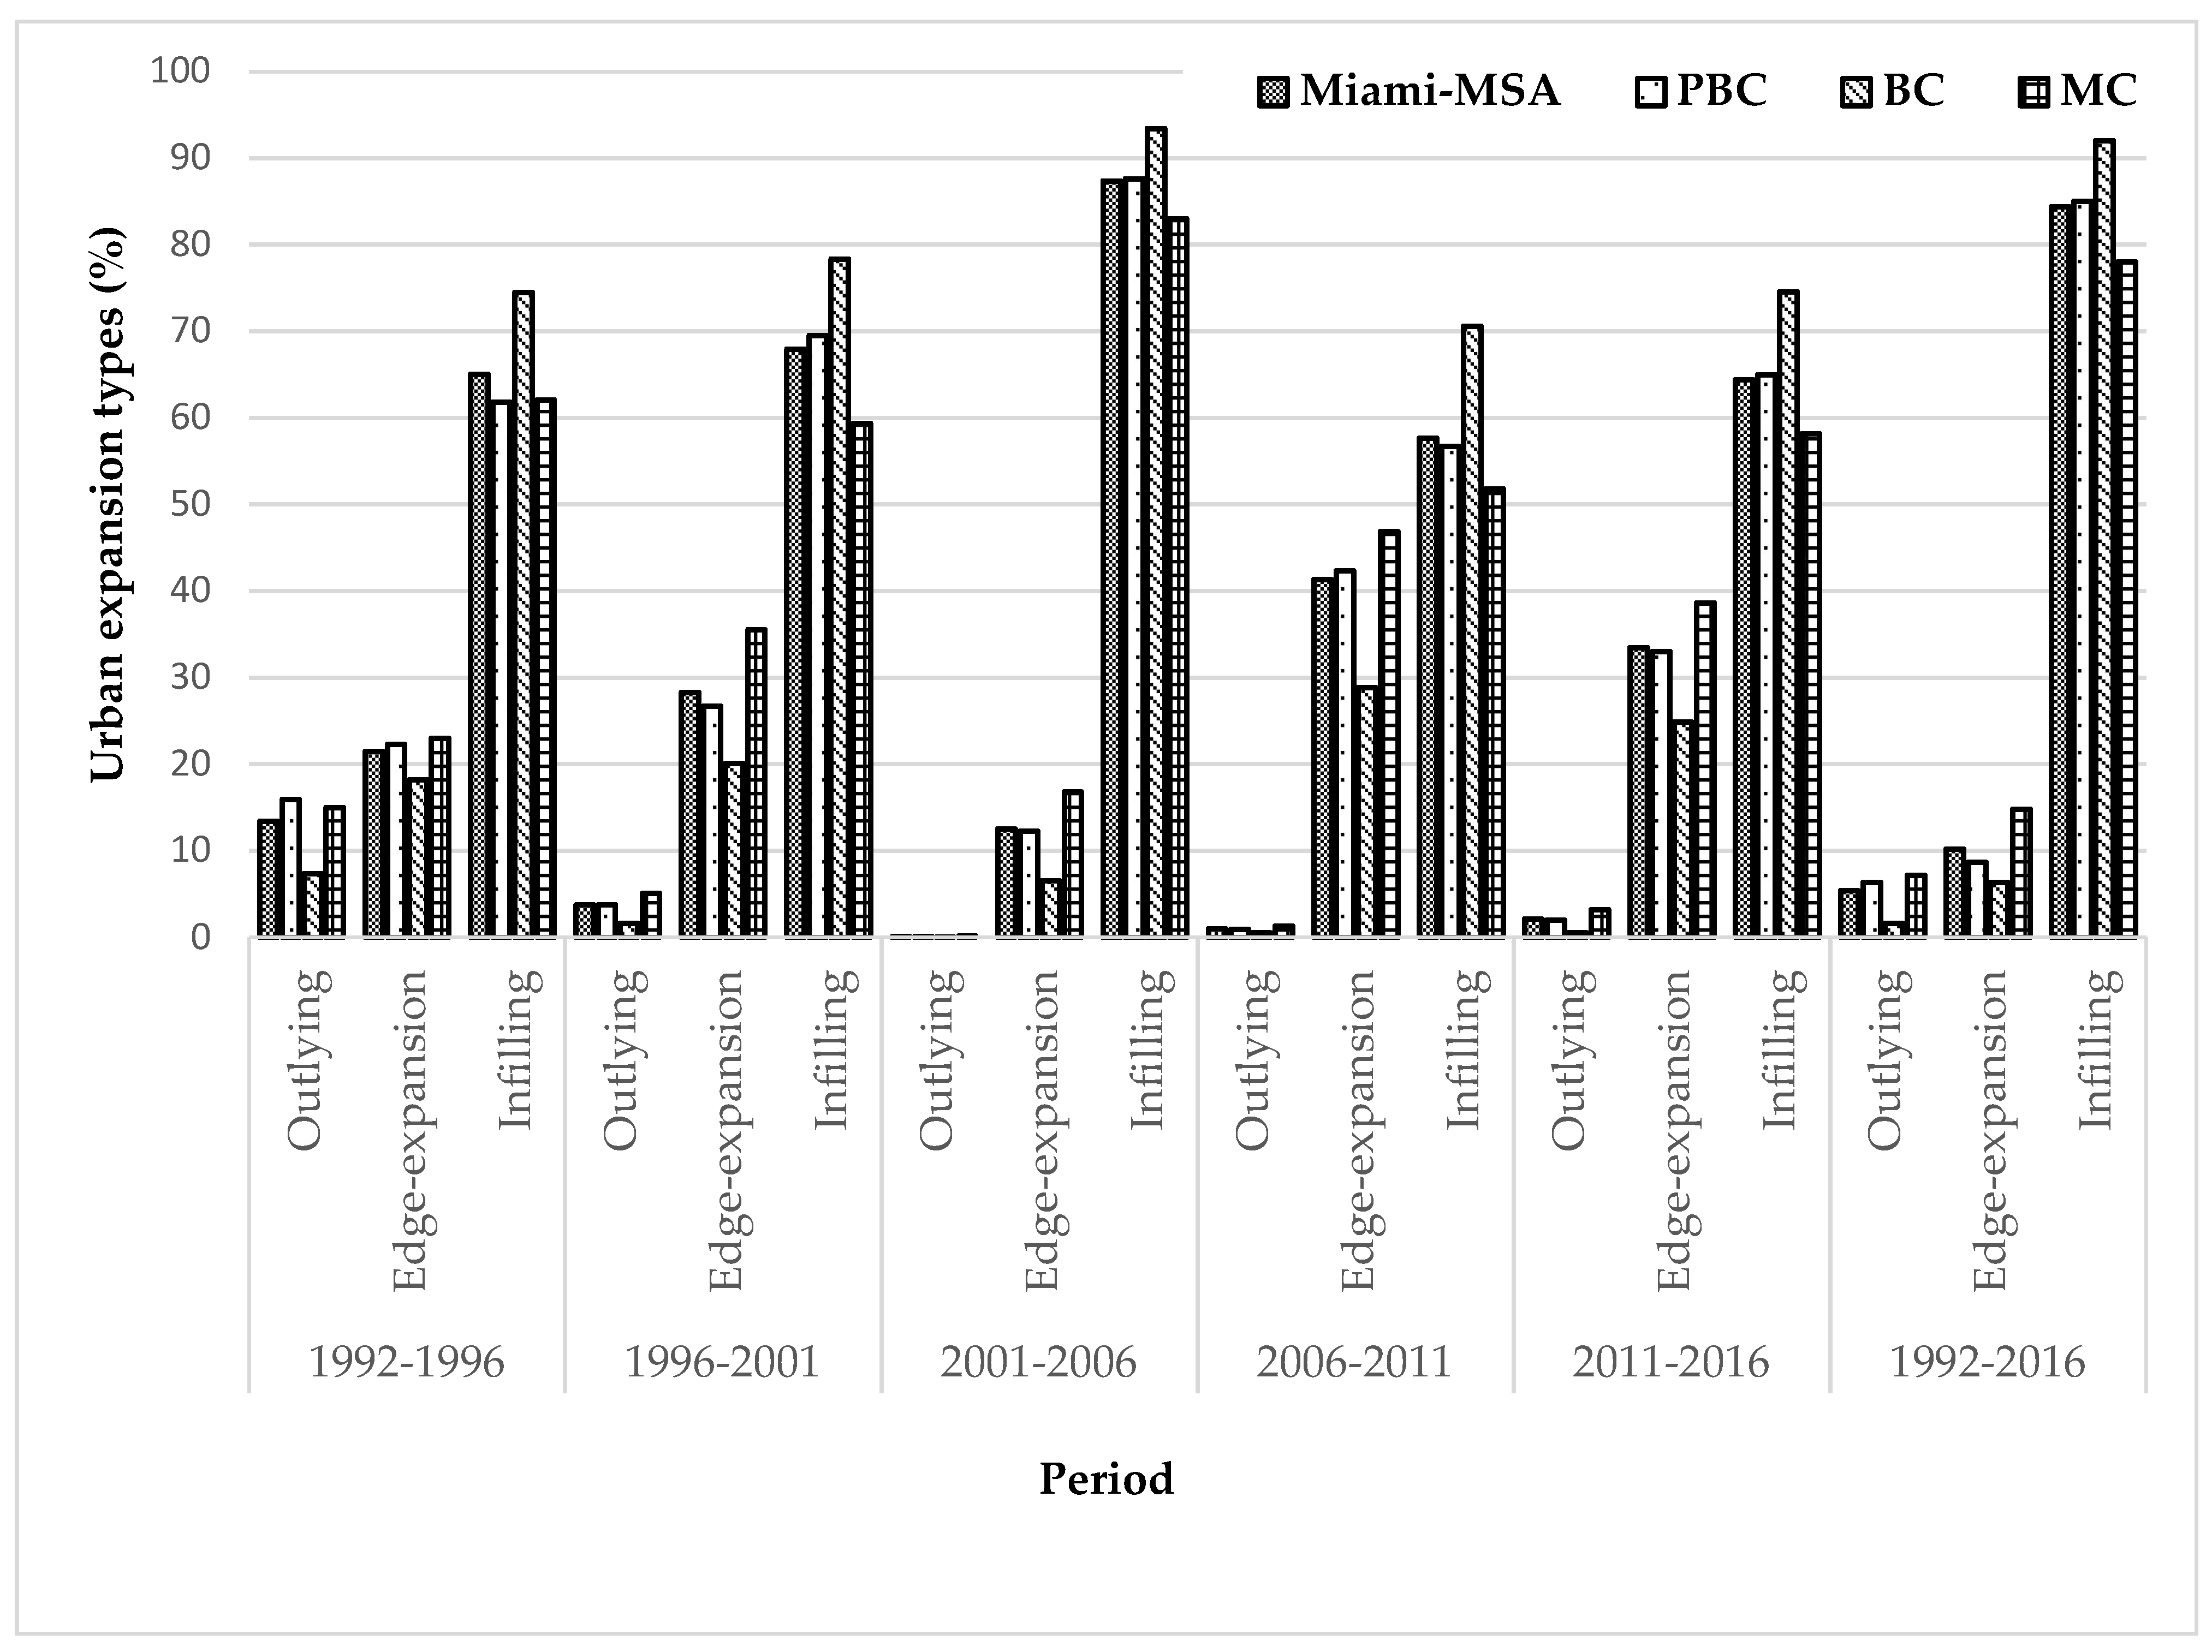
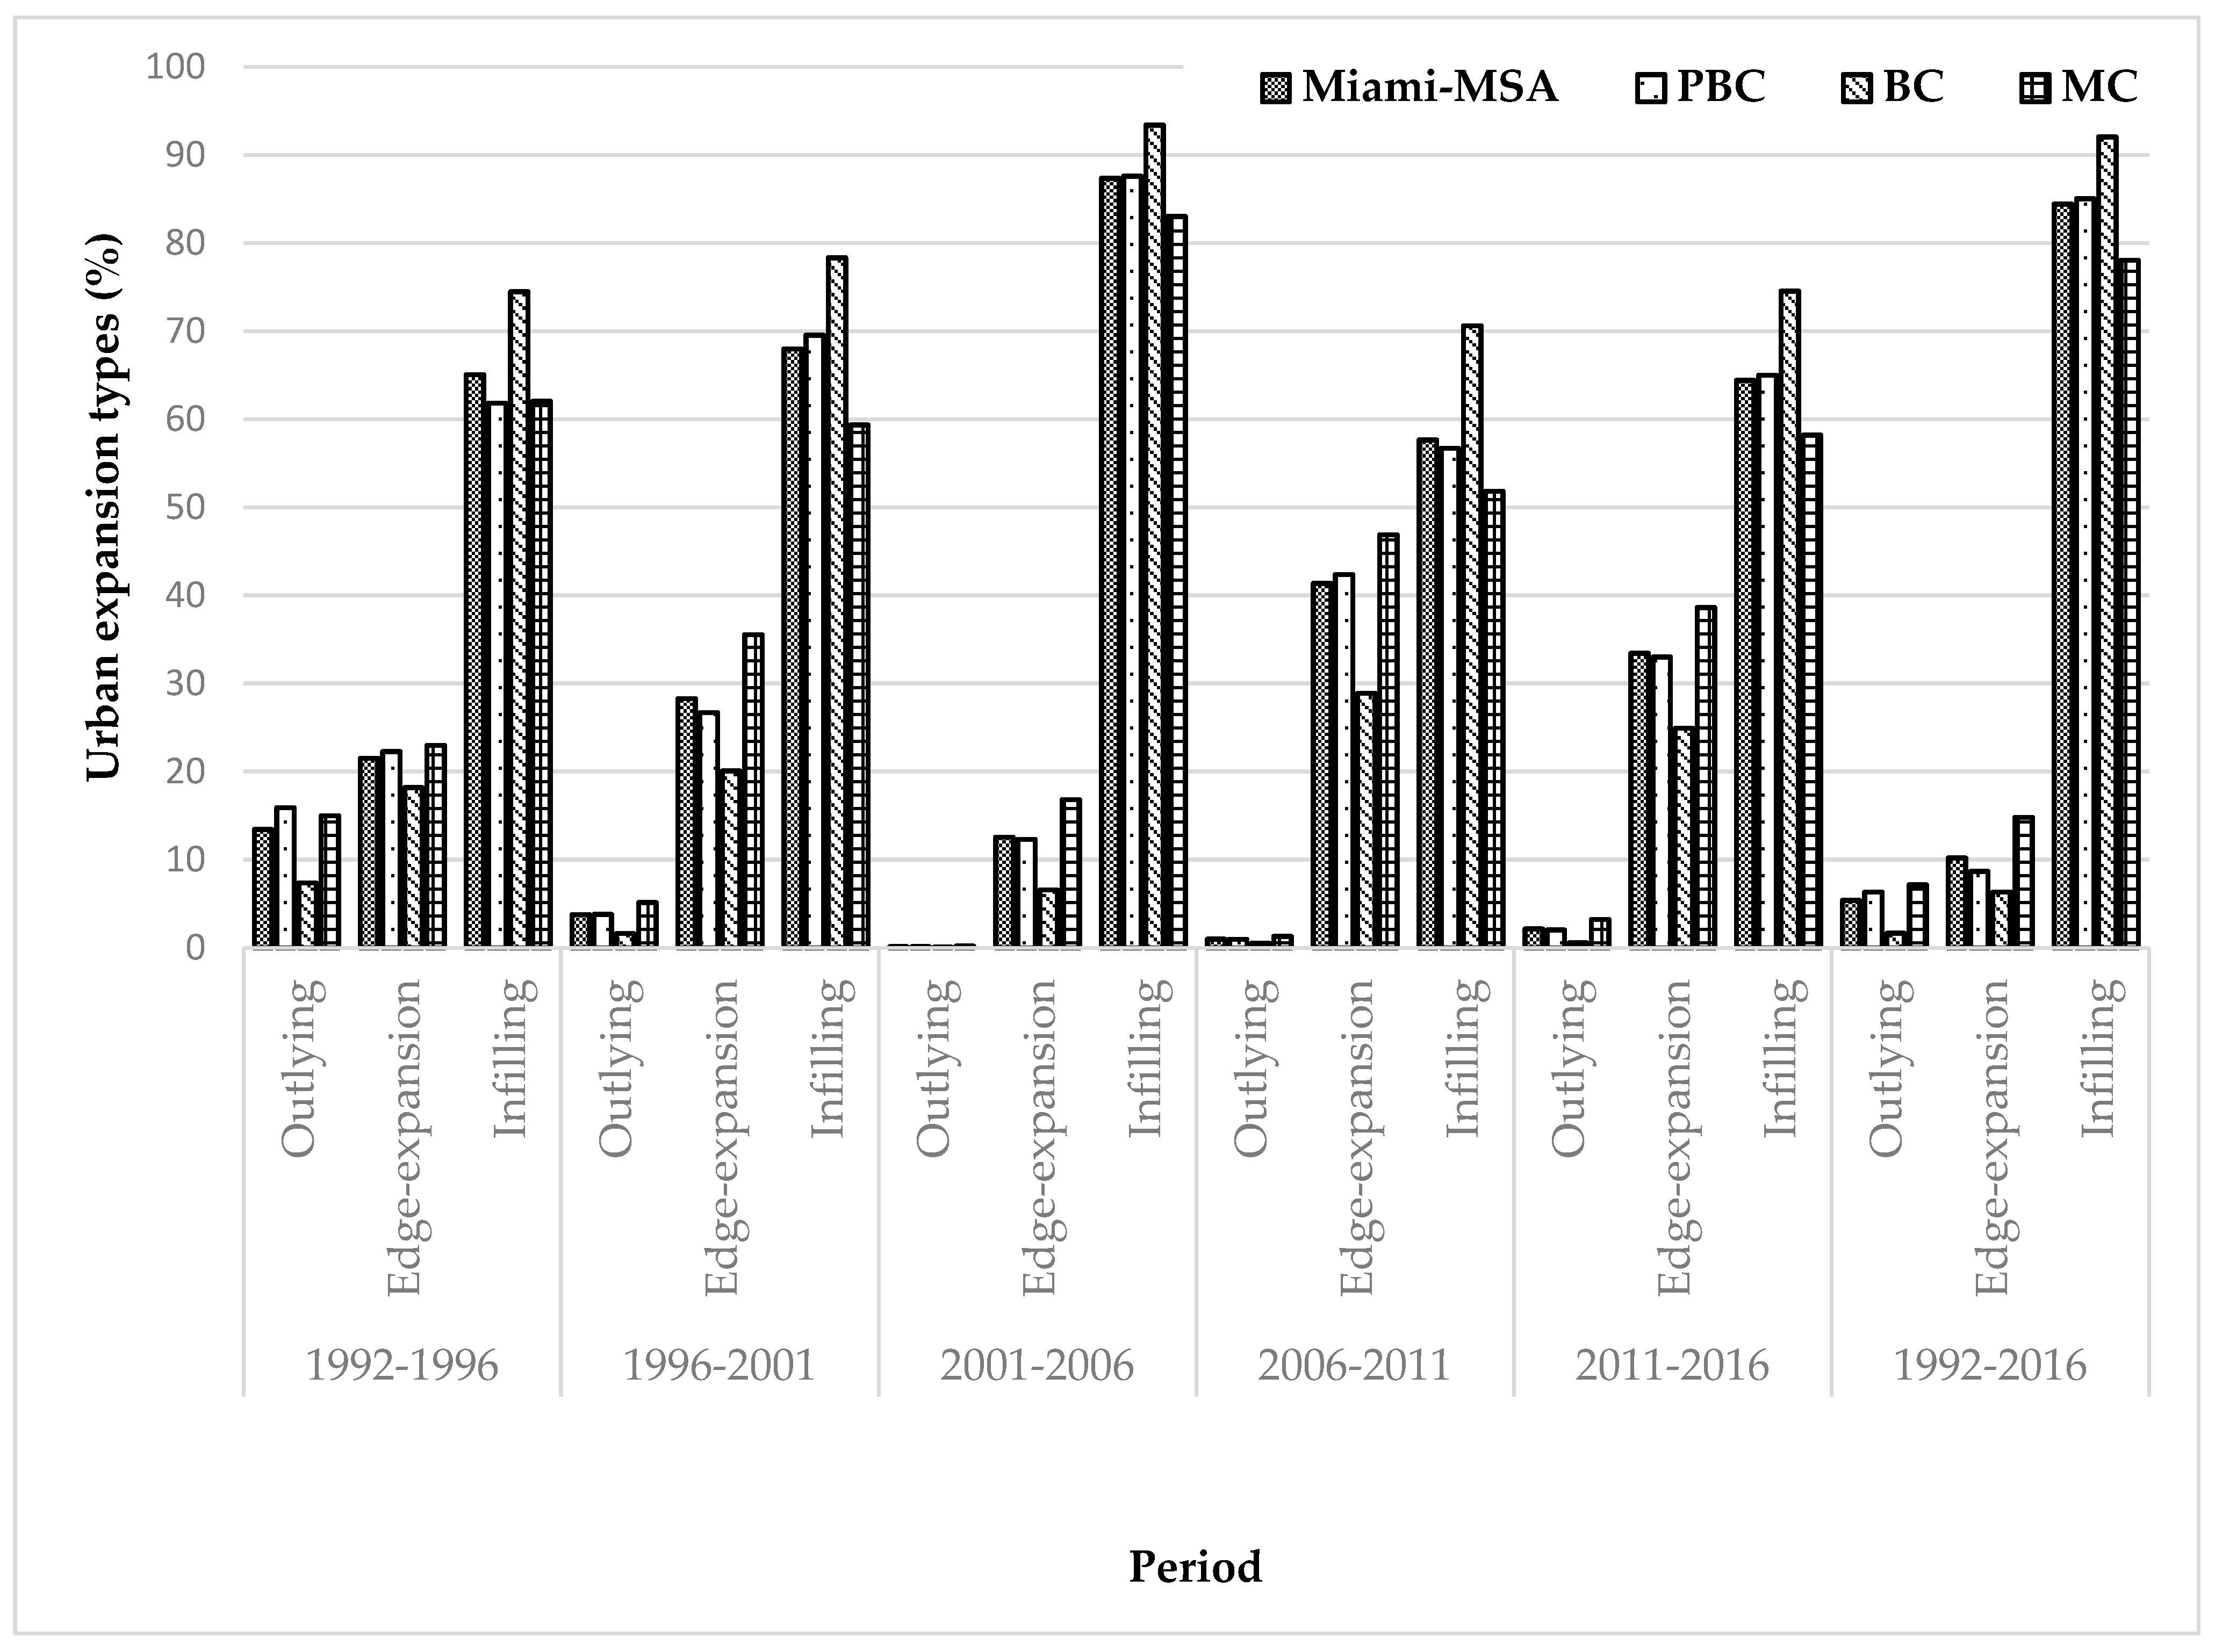
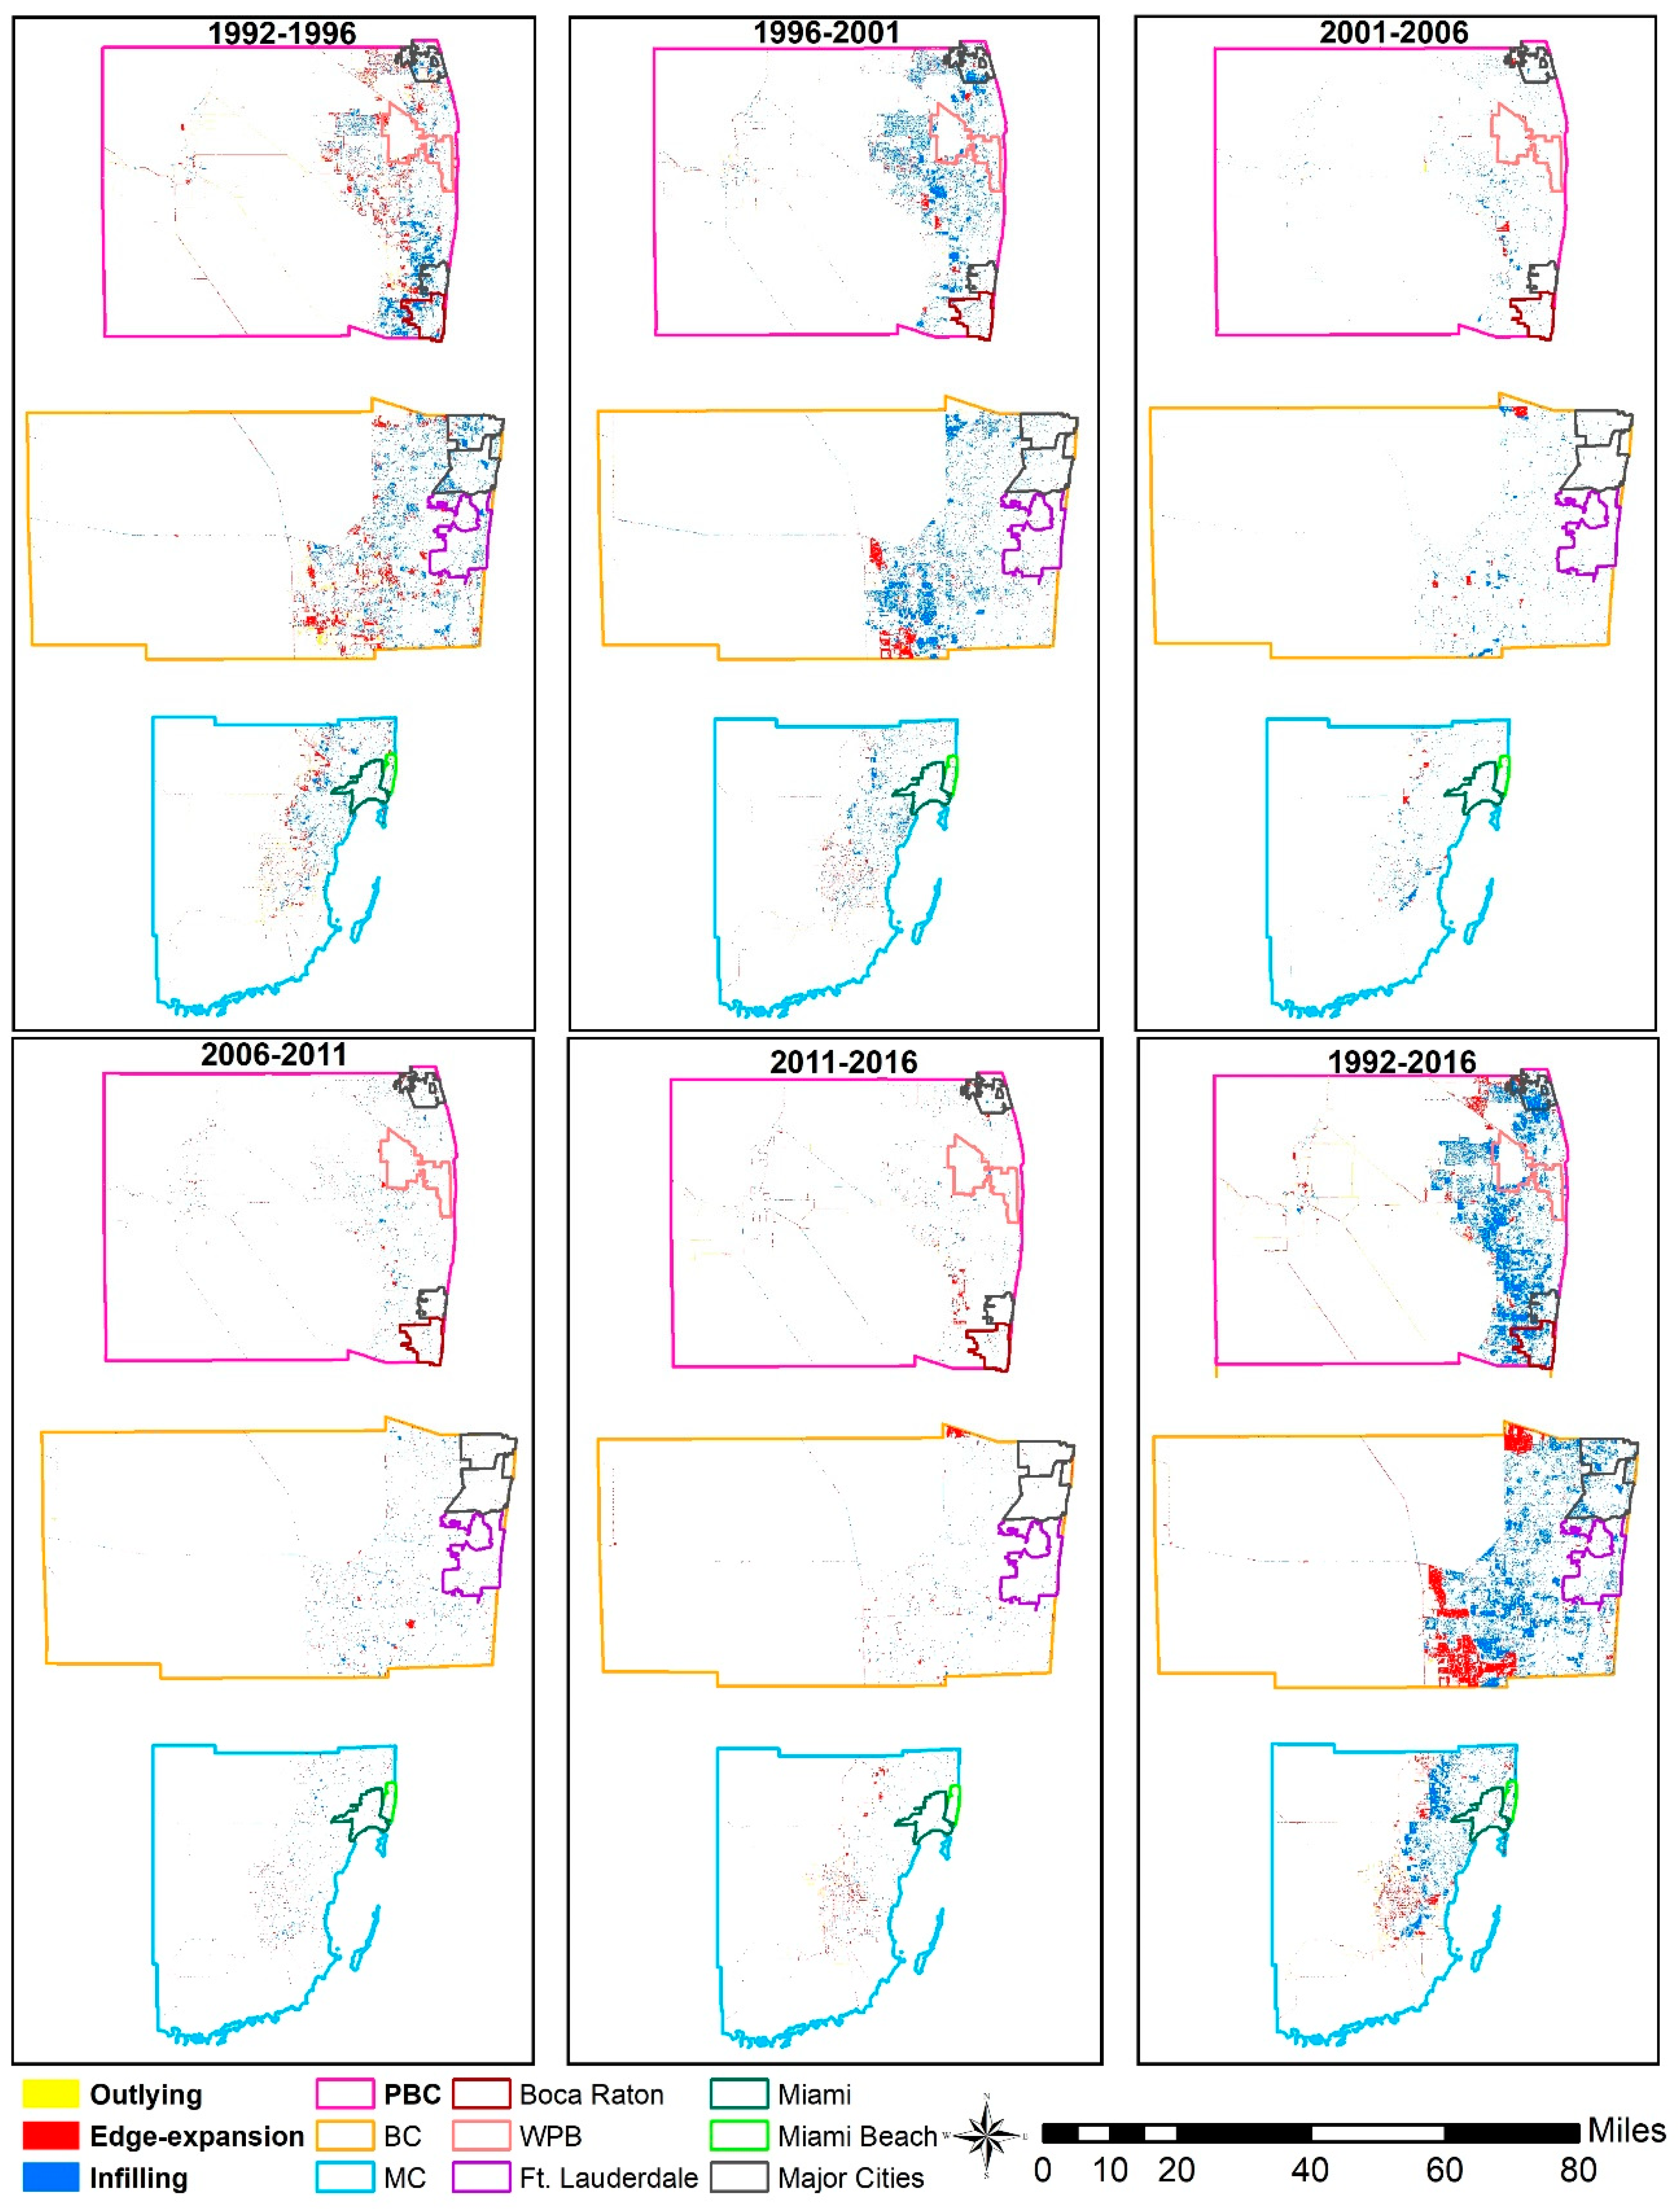
3.2. Urban Expansion Types
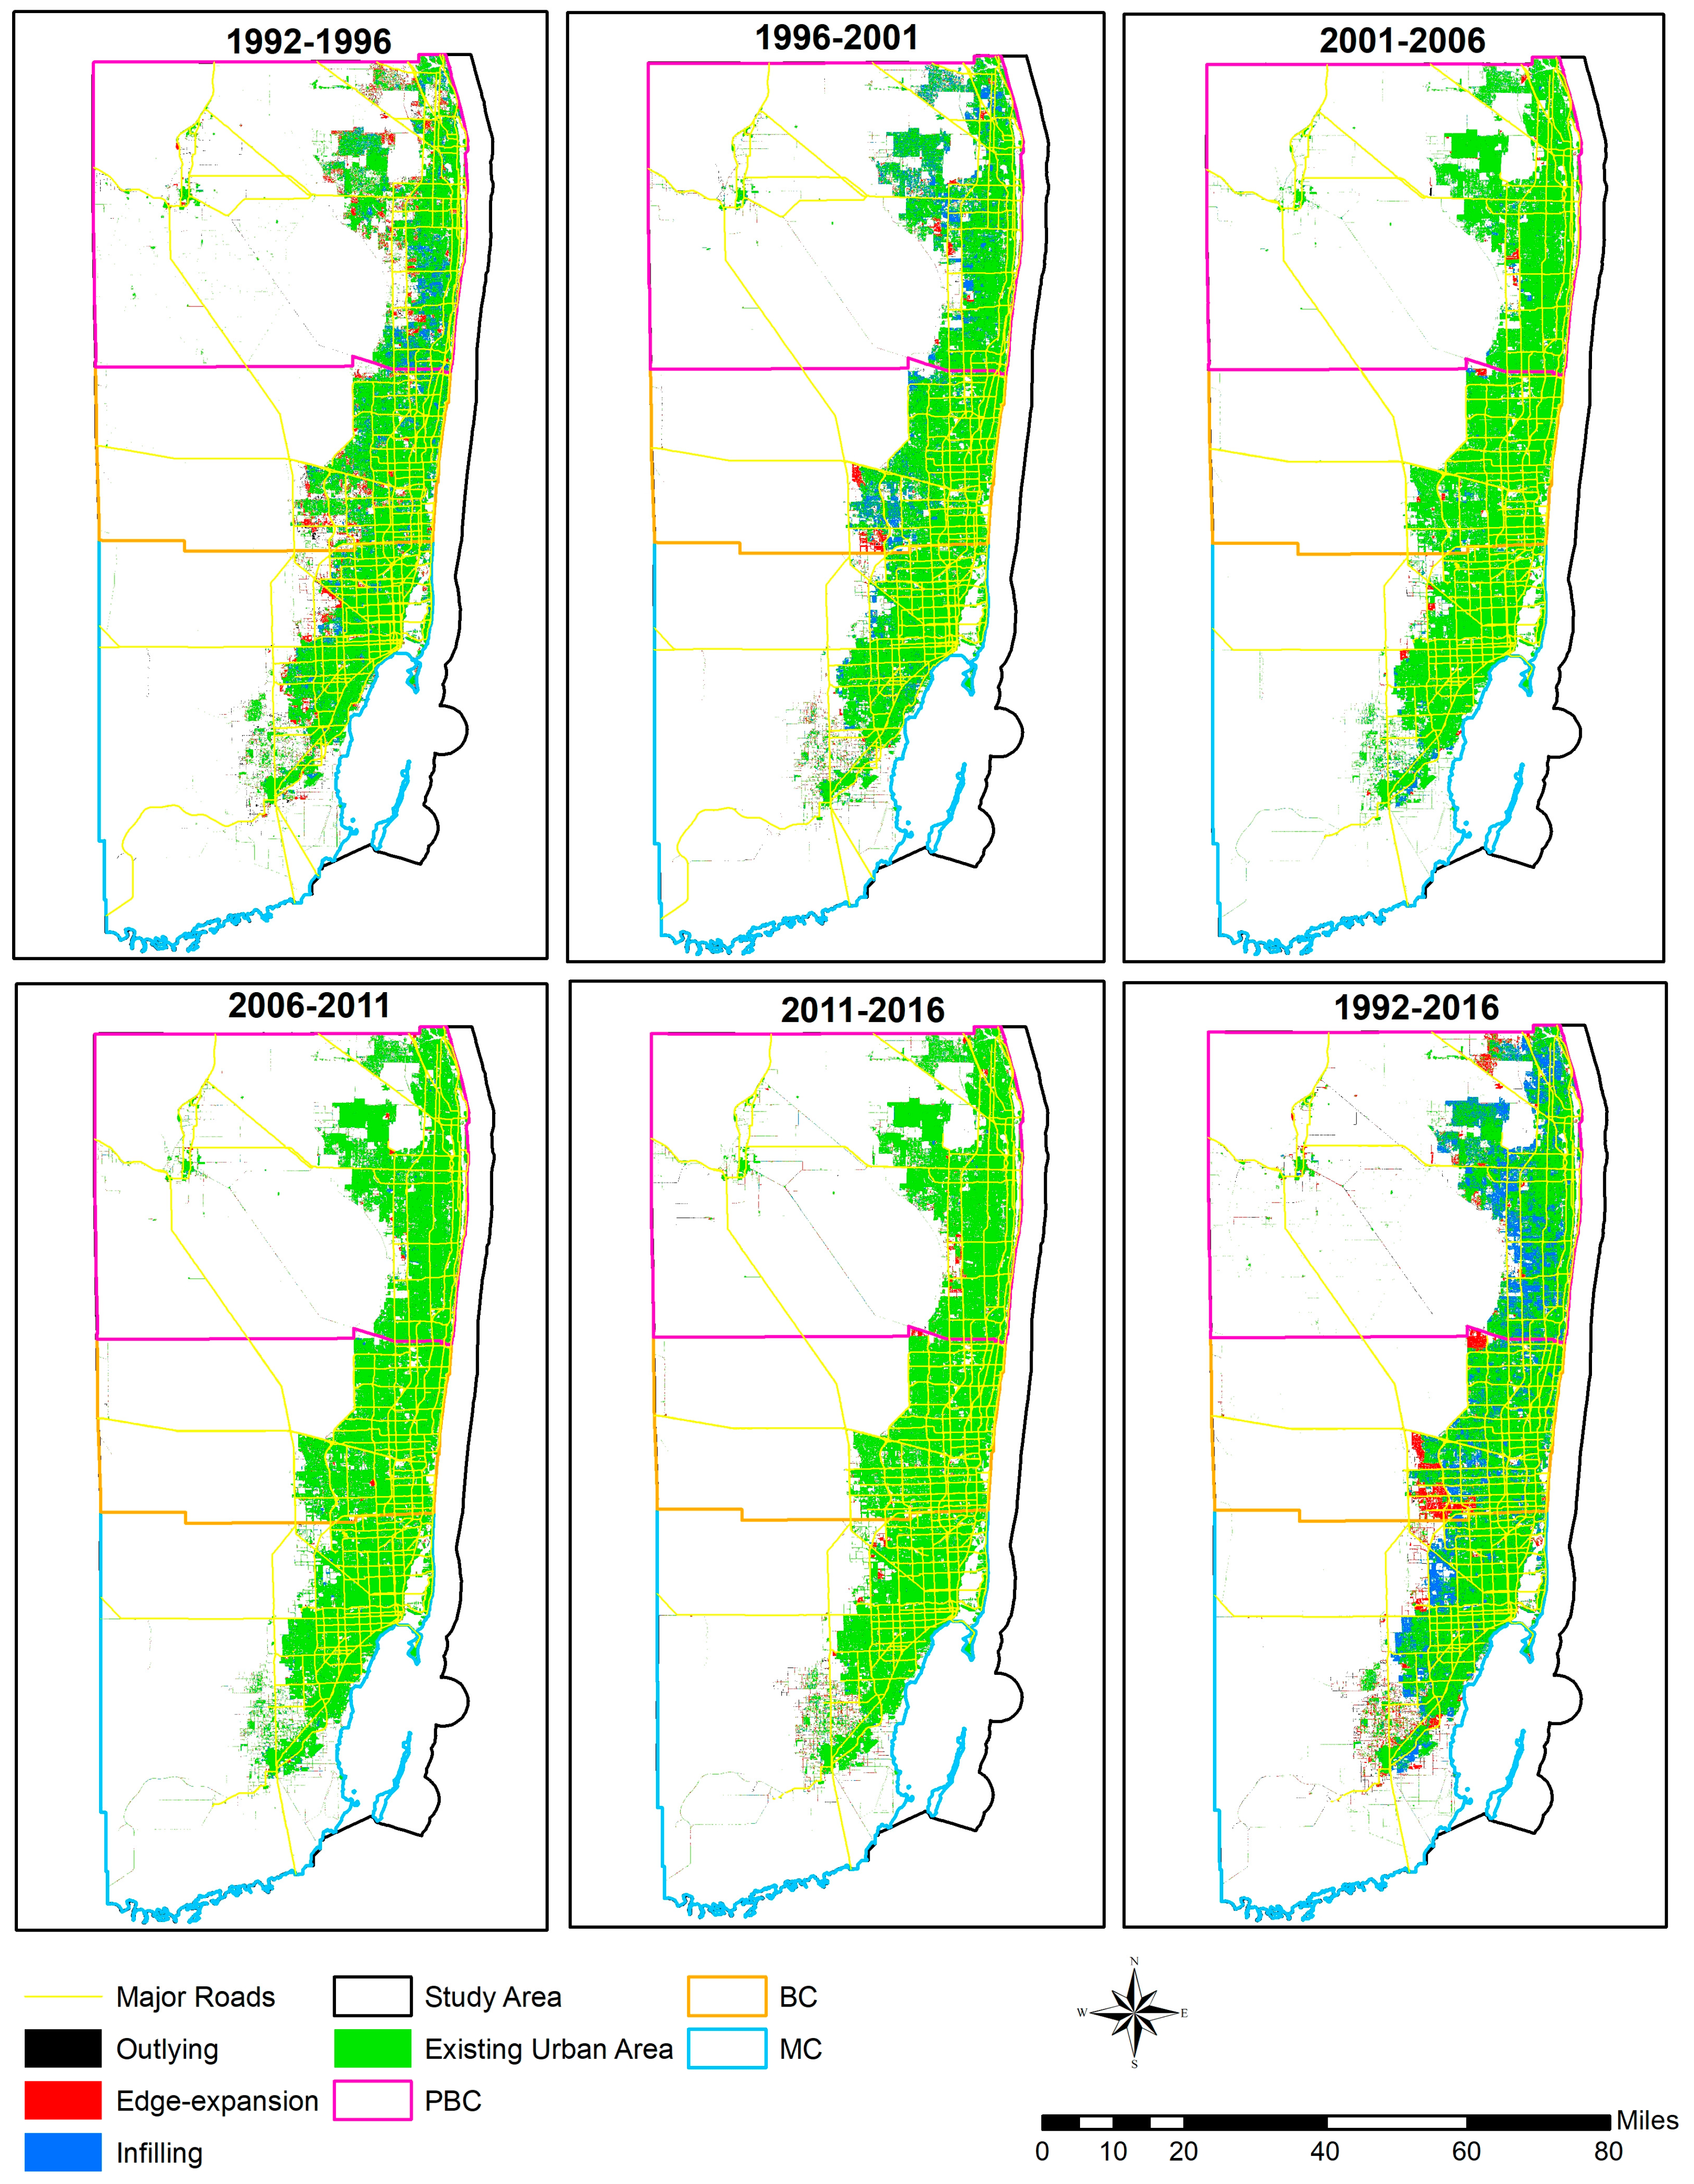
Figure 4 shows the percentages of urban expansion types for the newly developed urban lands in Miami MSA, PBC, BC, and MC area over the five different time periods. Infilling was found as the leading urban expansion type (more than 50%) and outlying as the least dominant expansion type in all the time periods for all the areas. In Miami MSA, the infilling expansion type accounts for 65.06% in 1992–1996. Then it continues to increase till 2006 when the infilling type accounts for over 87% of the total proportion of extension types. During 2006–2011, it decreased to 57.65% and then again increased to 64.42% during 2011–2016 making the overall average of infilling type as 84.4% in Miami MSA. The outlying type in Miami MSA during 1992–1996 was 13.44%. It then started to decrease until 2011 when the proportion of outlying type was below 1%. During 2011–2016, it again increased to 2.14% in this area. The proportion of edge-expansion ranges from 12.53% (2001–2006) to 41.36% (2006–2011) in Miami-MSA.
All three counties (PBC, BC, and MC) more or less follow the same trend as the overall study area (Miami MSA) as infilling was the dominant expansion type over all the study periods. Outlying was the least dominant type of expansion in PBC as it was 15.9% during 1992–1996. Then it started to decrease in the following periods until 2006 when it was almost zero (0.13%). During 2006–2011, it increased to almost 1% and then between 2011–2016 it increased to 2.14%. During 1992–1996, the infilling expansion type accounted for 65.06% of the total expansion types. It then increased to 87.34% during 2001–2006. The lowest proportion of infilling type was during 2006–2011 (56.68%). It then again increased to almost 65% during the following period (2011–2016). In BC, the highest proportion of infilling type (93.37%) and the lowest proportion of outlying type (0.06%) was during 2001–2006. Outlying was the highest during 1992–1996 (7.35%) and infilling was the lowest during the period 2006–2011 (70.6%). In MC, infilling was also the highest during 2001–2006 (almost 83%). However, during 2006–2011, edge-expansion was the very dominant type of expansion type as it accounted for almost 47% of the total proportion and infilling was the lowest (51.82%). Edge-expansion was 38.62% during 2011–2016 in MC and outlying was the highest at the beginning (1992–1996) as it accounted for almost 15% of the total proportion.
3.3. Urban Expansion Intensity Index
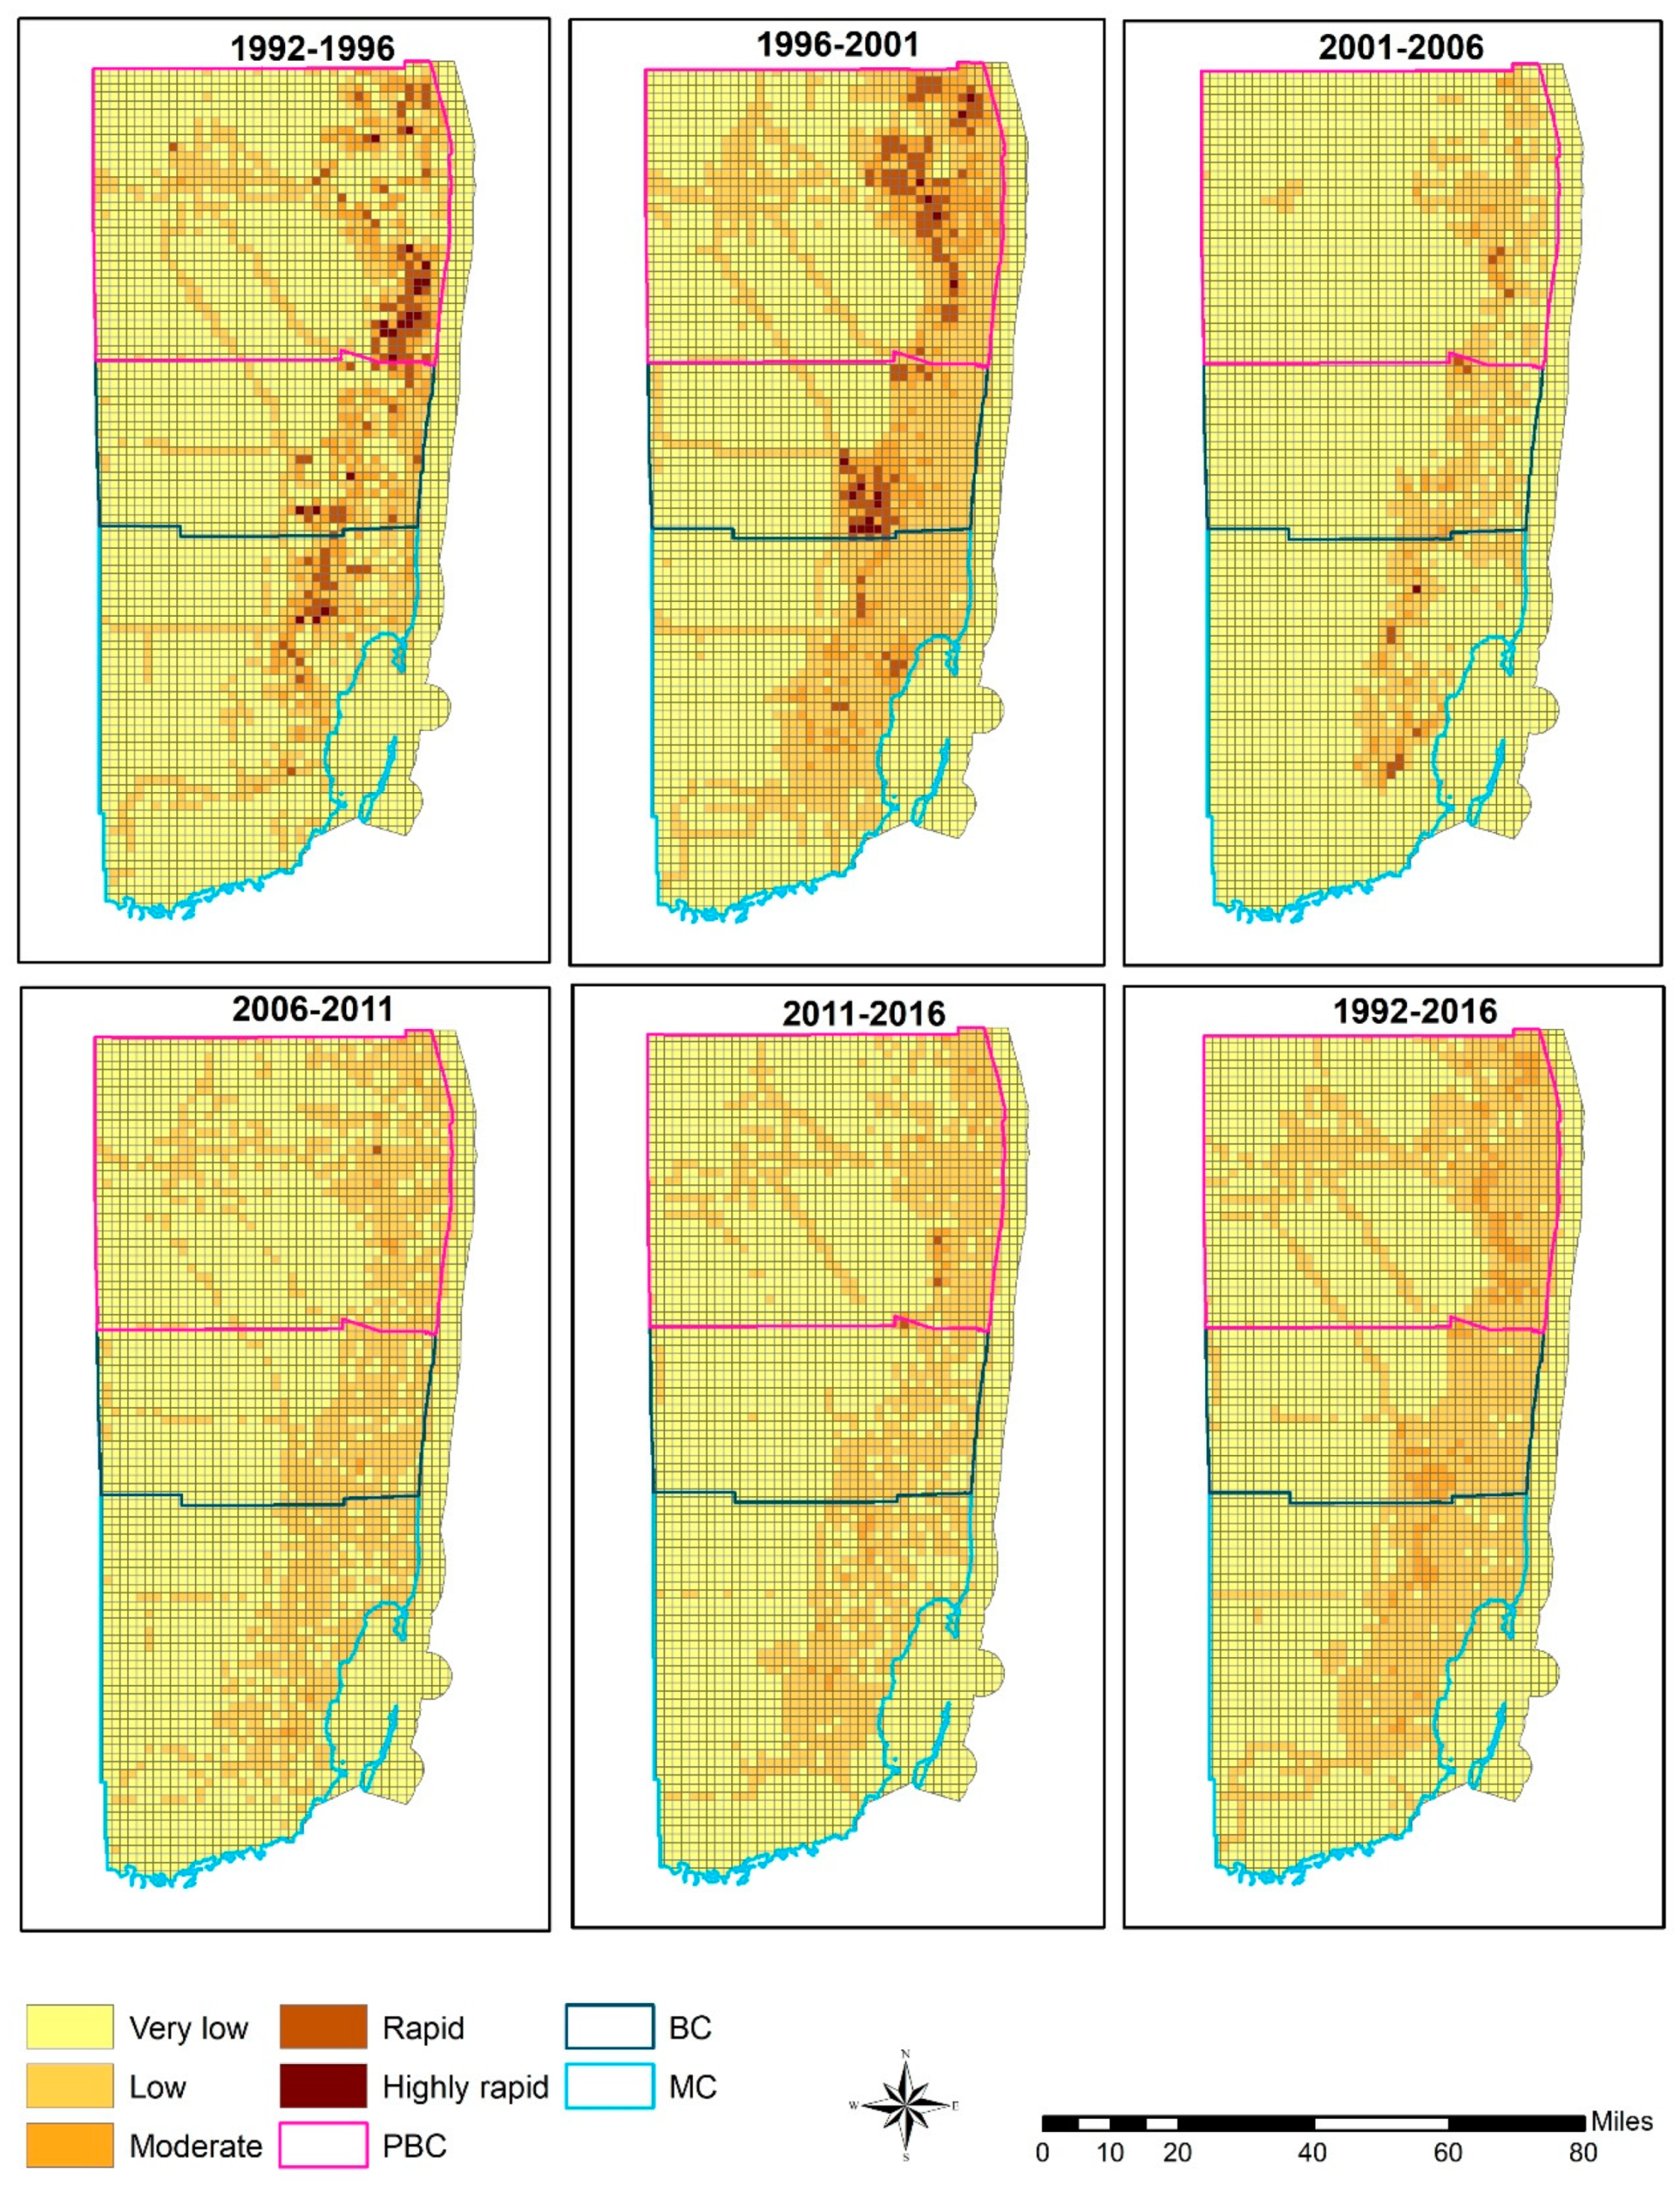
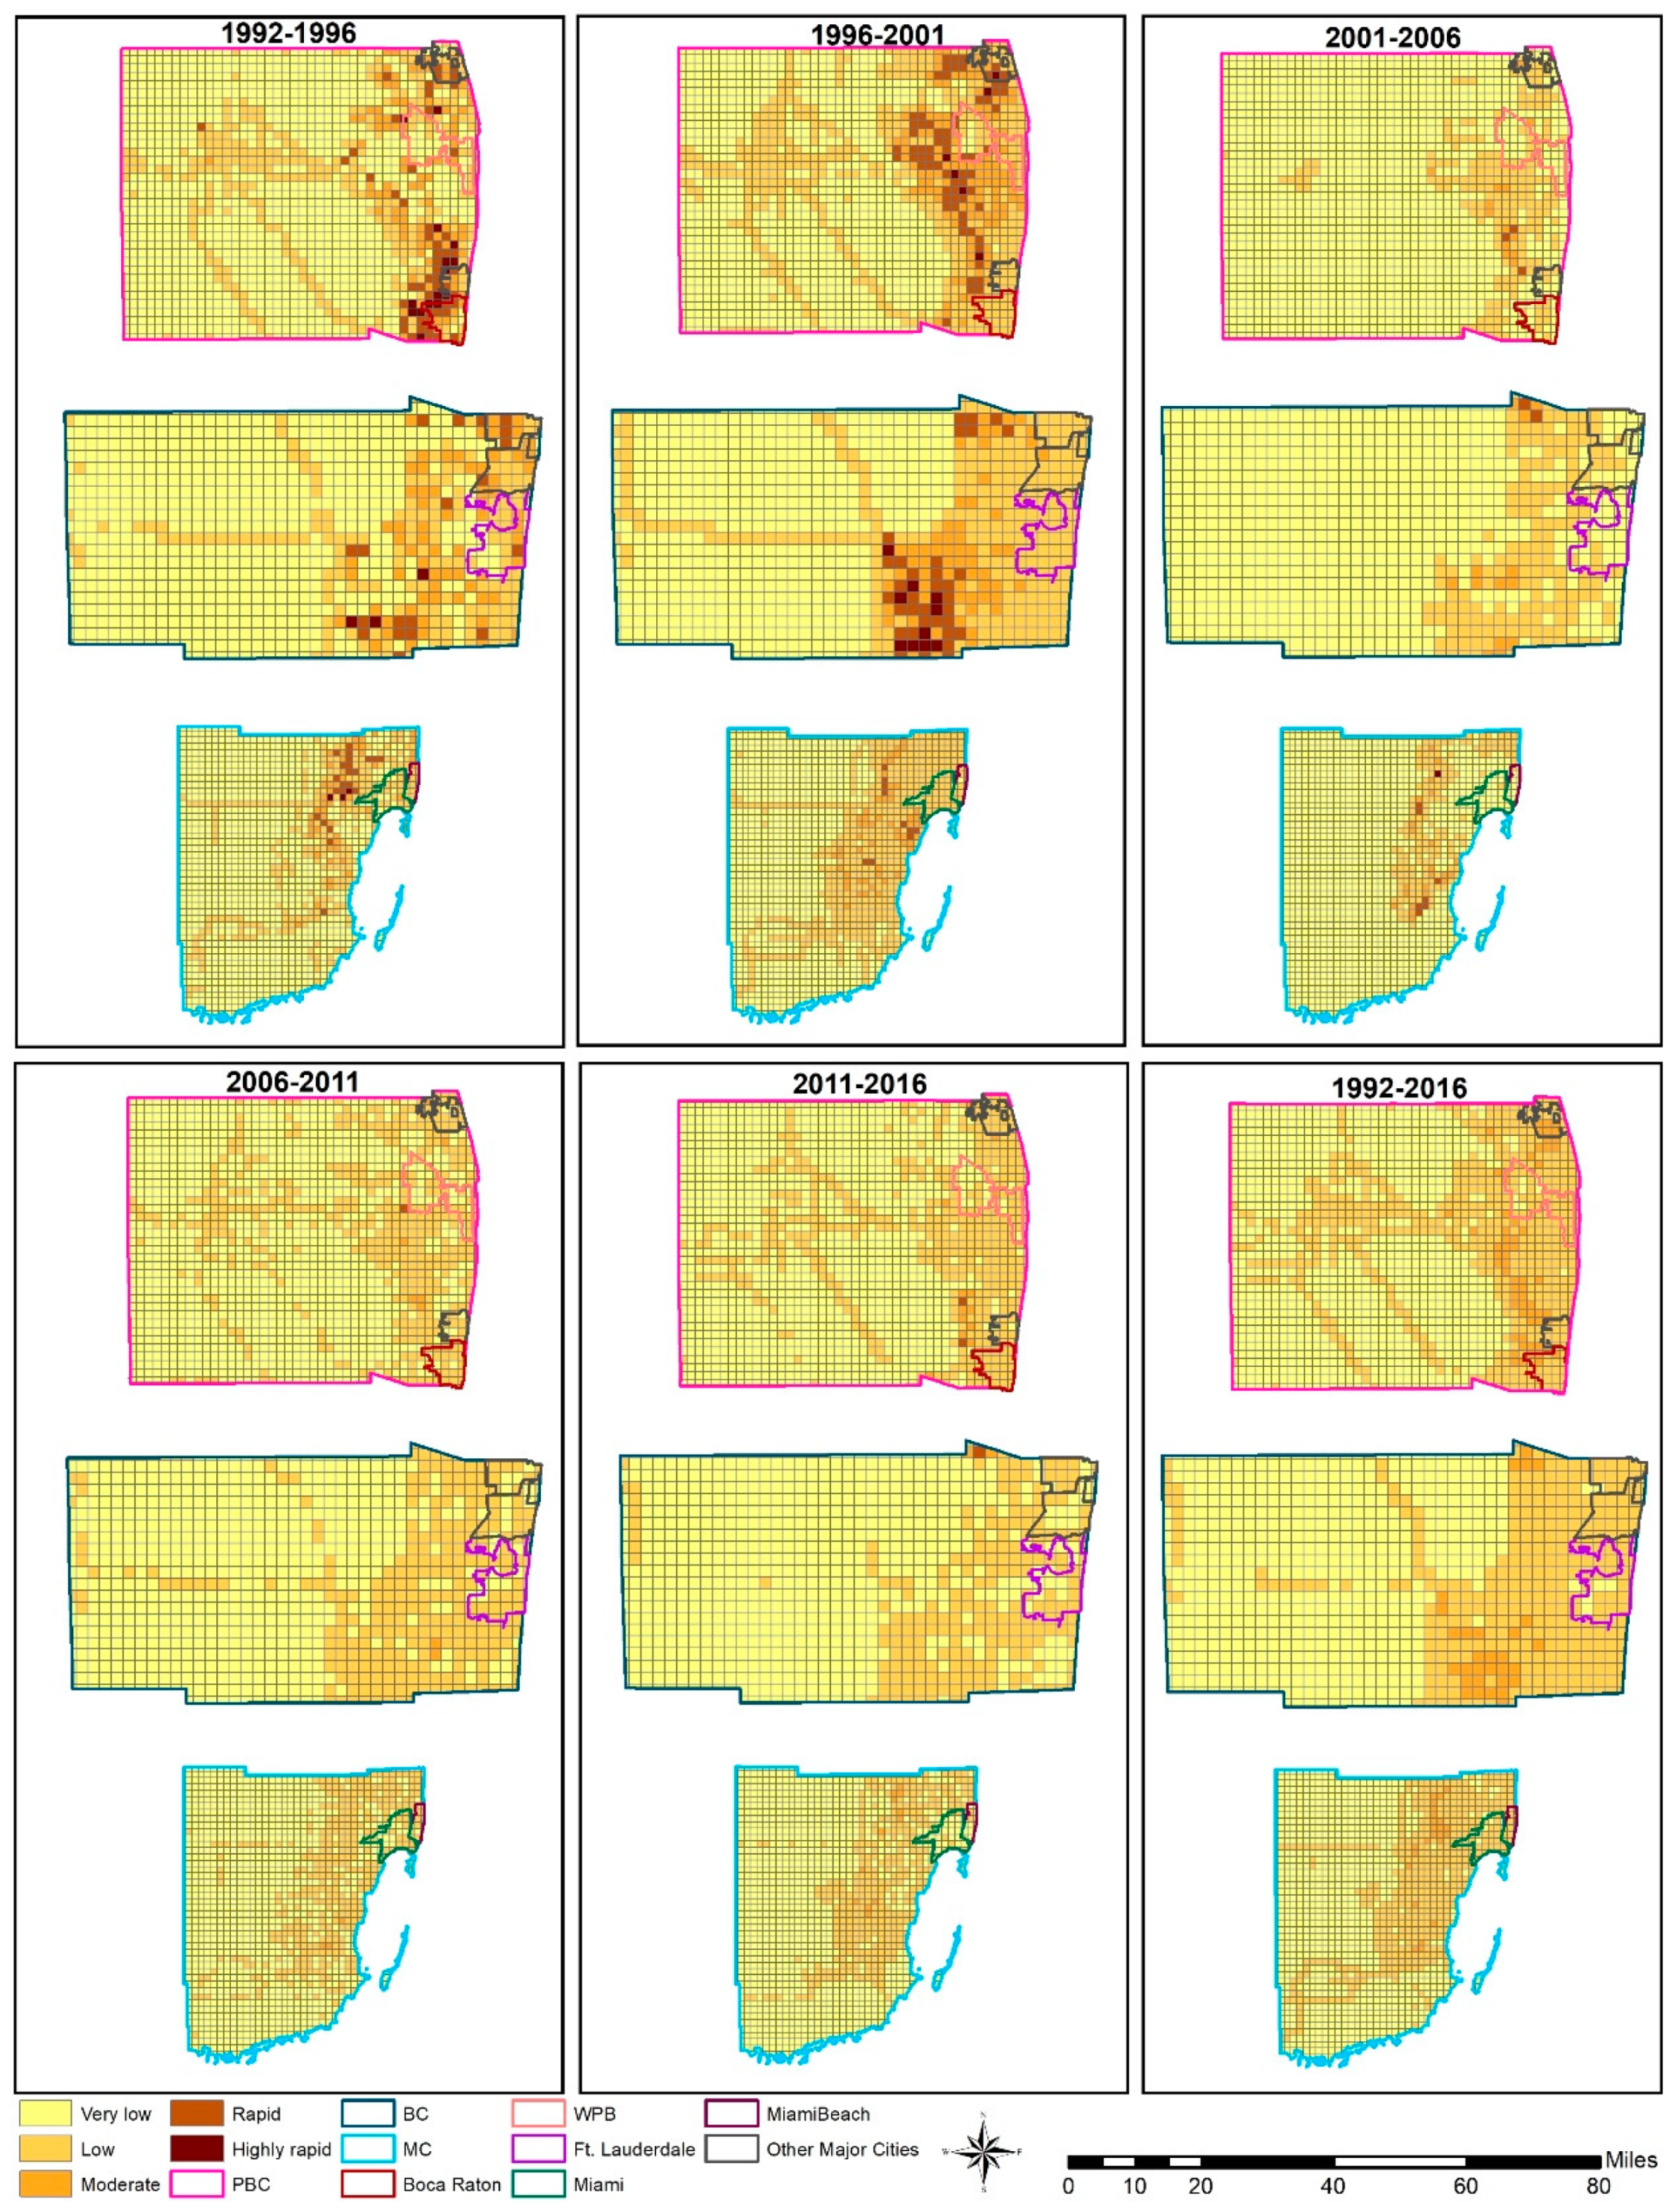
Urban expansion intensity has been examined to evaluate the spatial distribution of urban expansion over the study area from 1992 to 2016 in a five-year interval. To understand the pattern of urban expansion intensity more locally, we overlayed the county boundary over the MSA map (
Figure 5) and boundaries of most historical and populous cities over the county map (
Figure 6).
Figure 5 shows that urban expansion mainly occurred on the east coast of the study area. Most of the rapid and highly rapid urban expansion grids are between 1992–2001 in Miami MSA (
Figure 5 and
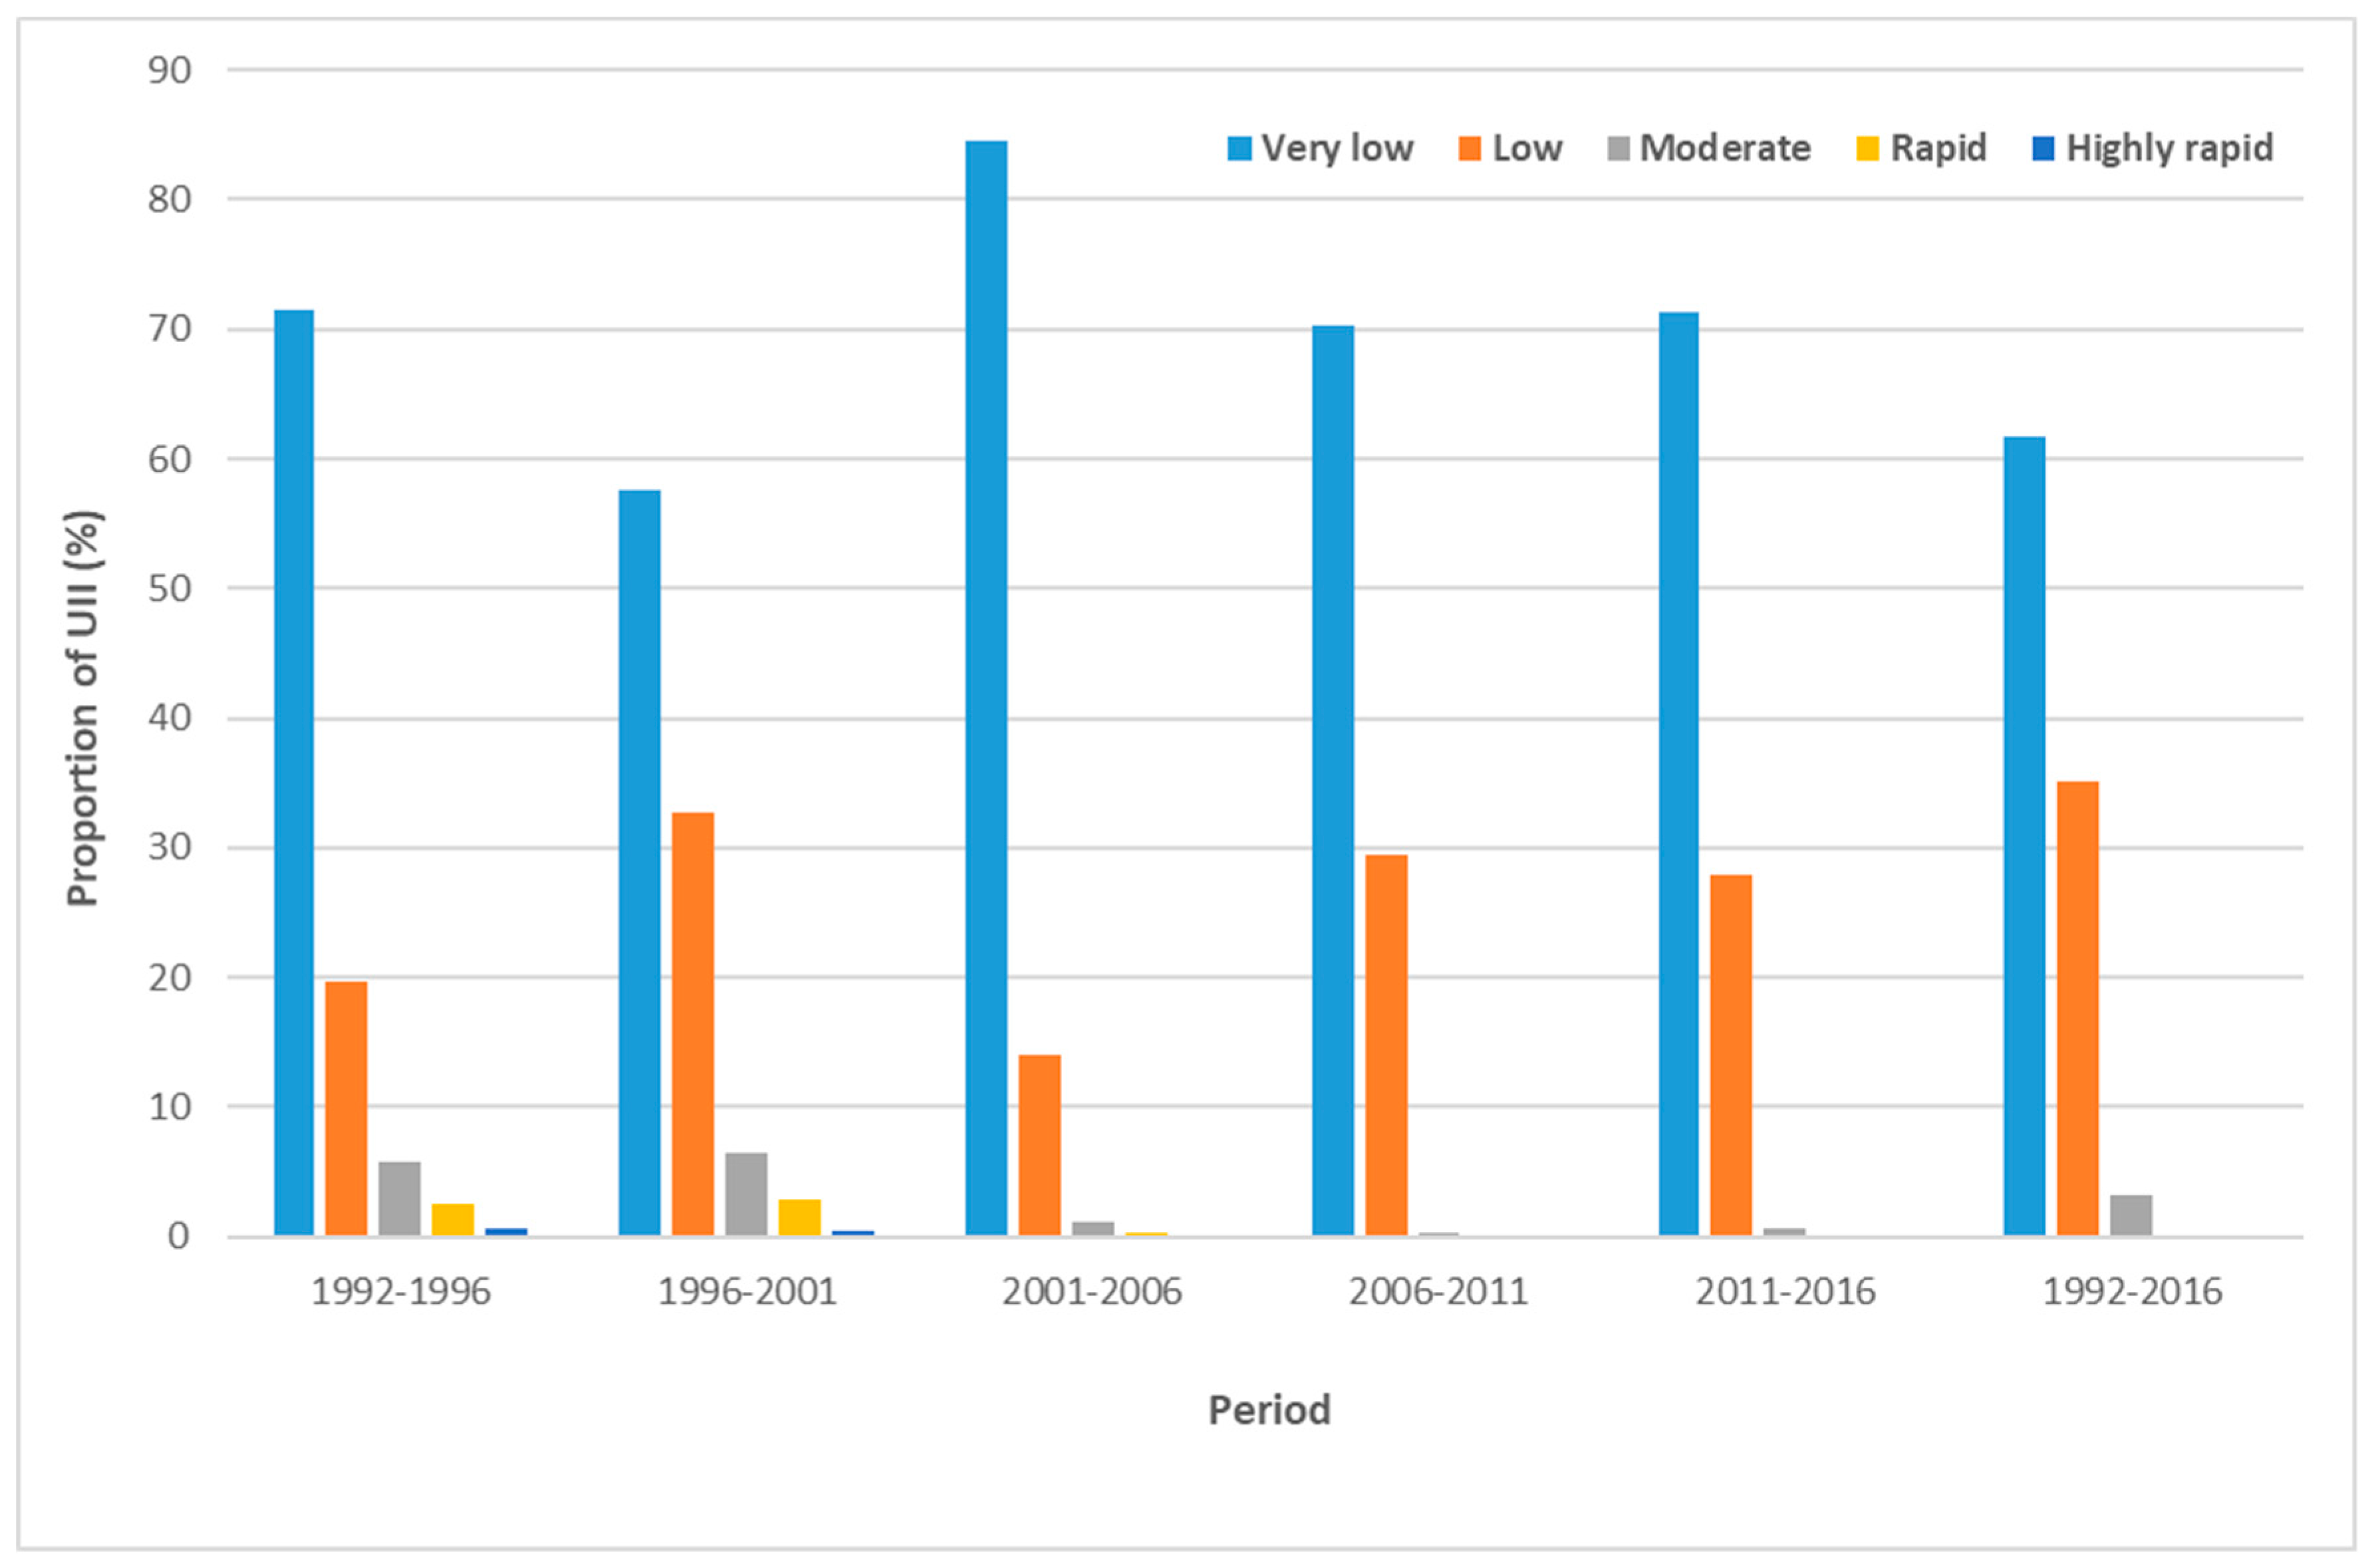
Figure 7). More specifically, rapid and highly rapid expansion grids account for over 3% in the periods 1992–1996 and 1996–2001. After 2001, rapid and highly rapid urban expansion grids decreased significantly.
The proportion of rapid and highly rapid grids in the following periods and there were no rapid and highly rapid expansion grids overall (1992–2016) in this region (
Figure 7). Very low and low urban expansion grids account for over 85% of the total proportion over all the study periods in this region. There are some ‘hotspots’ of rapid and highly rapid urban expansion grids during 1992–1996 and 1996–2001 (
Figure 5). In PBC, rapid and highly rapid urban expansion grids are clustered together in the south-eastern part of the county which is near the coast during 1992–1996. During 1996–2001, the ‘hotspots’ of rapid and highly rapid urban expansion grids were moved away from the coast and can be seen in the northern part of the county. In BC, rapid and highly rapid expansion grids are dispersed during the period 1992 to 1996. During 1996–2001, there is clearly a cluster of the grids of such kinds at the southern part of the county which is further away from the east coast. In MC, most of the rapid and highly rapid expansion grids are located in the northern part of the county during 1992–1996 and they are away from the coast. During 1996–2001, that cluster is no longer available, and the grids of rapid and highly rapid expansions are rather dispersed. After 2001, the cluster of rapid and highly rapid urban expansion grids started to diminish in this county like the other two counties. However, during 2001–2006, there were still some rapid and highly rapid dispersed grids in this county which completely disappeared after 2006.
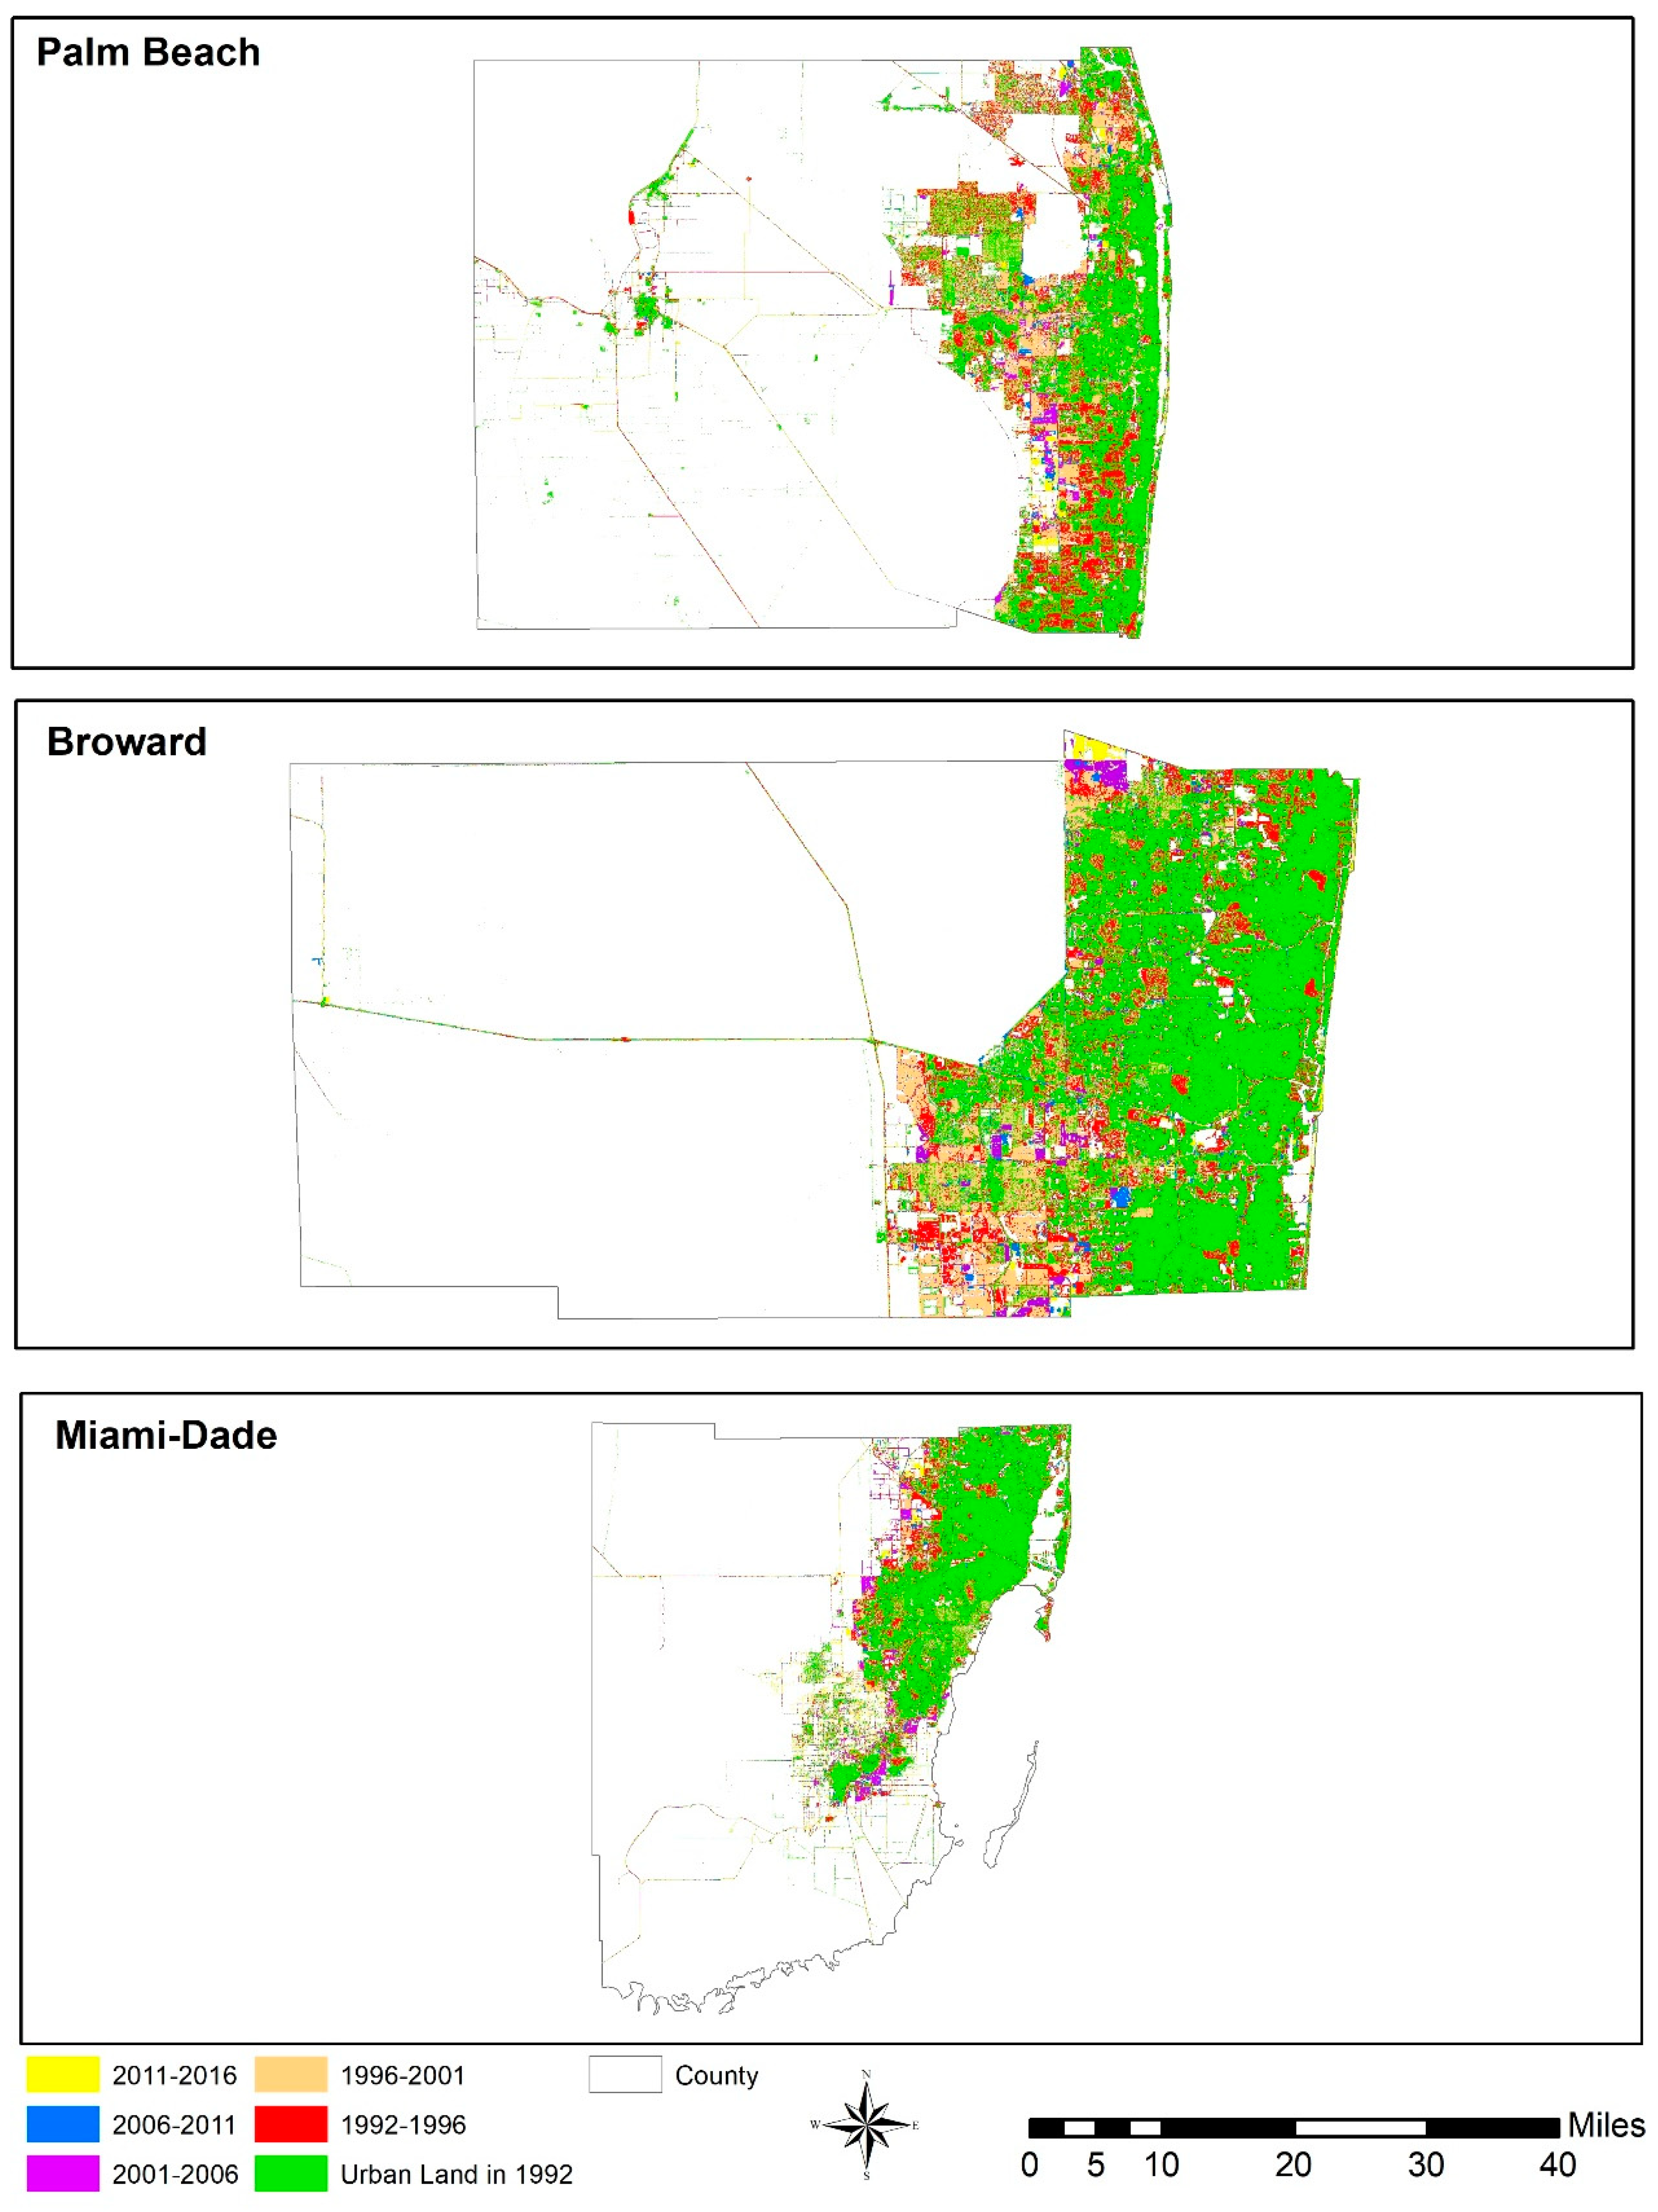
Figure 6 shows the spatial pattern of urban expansion intensity at the city level. In PBC, most of the rapid and highly rapid expansion grids are located within or around some major city areas like Boca Raton during 1992–1996. Interestingly, during 1996–2001, most of these grids were shifted away from the major city areas. Since all these major cities are adjacent to the east coast of the study area, it means that most of these grids were shifted away from the beach as well. The same happens in the cities in BC. Although the rapid and highly rapid expansions in this county are dispersed during 1992–1996, it was still within or around the major cities in the county (e.g.,: Fort Lauderdale). However, during 1996–2001, there was a clustered pattern of these grids which was further away from the major cities and the coast. This dispersed pattern of rapid and highly rapid urban expansion grids suggests that high-intensity urban expansion was occurring outside the major city areas in the study area. Cities in the MC follows the same pattern as well. After 2001, rapid and highly rapid urban expansion grids are no longer visible in this region.
3.4. Landscape Metrics
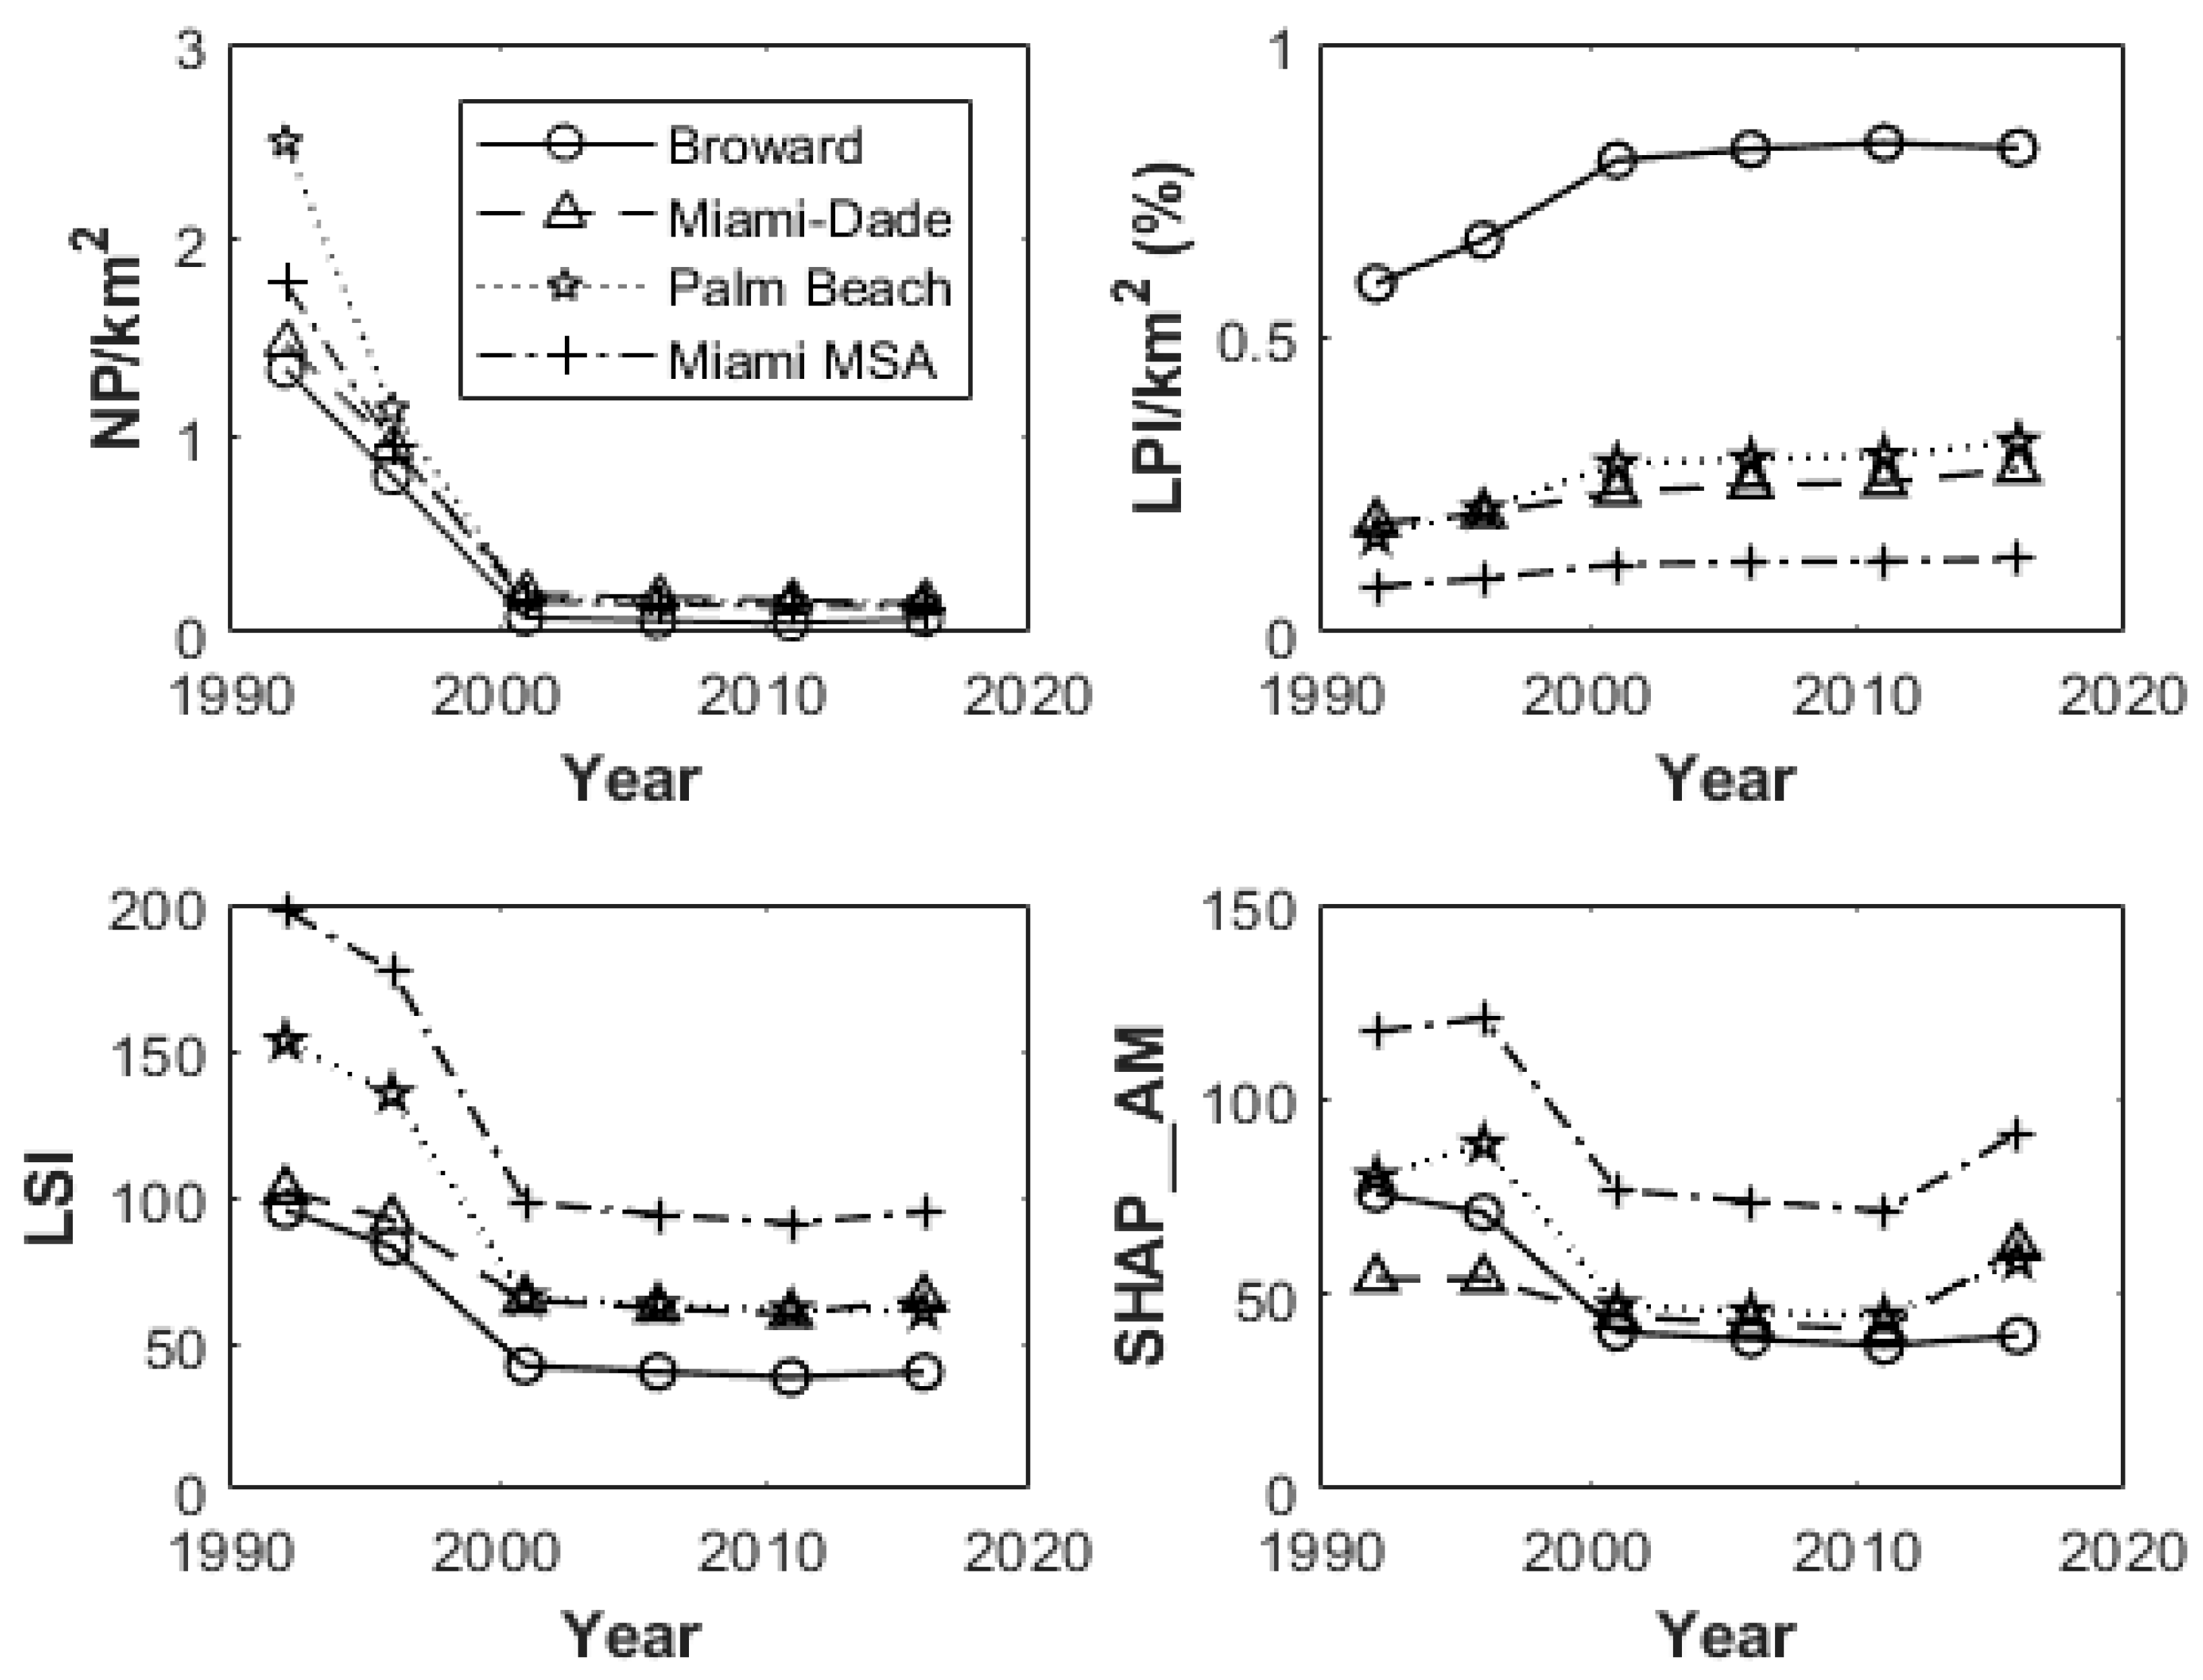
To further examine the patterns of urban expansion in the study area, three class-level metrics including NP, LPI, and SHAP_AM and one landscape-level metric (LSI) are calculated at the MSA and County level (
Figure 8). To minimize the size effect, NP and LPI were divided by the respective MSA and County area. NP decreased from 1992 to 2001 and then it was stable for the Miami MSA. The three counties (PBC, BC, and MC) follows the same pattern. However, the highest value of NP was different for the three counties. PBC had the highest value of NP among these three counties followed by MC, and then BC. LPI increased rapidly from 1992 until 2001 in Miami MSA which means rapid urban expansion in this period. After 2001, LPI increased very slowly in this area. Although all the counties followed this pattern more or less exactly, BC among the three counties had the highest percentages of LPI in all the time periods. PBC had the lowest percentage of LPI at the beginning (1992). After 1996, it had higher percentages of LPI than MC. SHAP_AM, which measures the mean shape complexity of discrete patches, decreased from 1996 to 2001 in Miami MSA. After 2001, it was almost stable till 2011. From 2011 to 2016, it increased rapidly (
Figure 8). In PBC, it shows a noticeable increase from 1992 to 1996, then decreased rapidly till 2001. During 2001–2011, it was stable and then increased again in the last period (2011–2016). In BC, SHAP_AM decreased right after 1992 till 2011. After 2001, it shows almost a flat line, which means that it was stable till 2016. In MC, it was slowly decreasing from 1996 until 2001. From 2001 to 2011, it was stable and had a rapid increase in the last period (2011–2016).
LSI shows a rapid decreasing pattern from 1992 to 2011 in Miami MSA where LSI decreased in almost half (from almost 200 to 100). After 2001, it was stable till the end (2016) which indicates patch shape was becoming complex. PBC and BC follow the same exact pattern as Miami MSA. In MC, LSI was still decreasing during 1992–2001, but it was rather a slow decrease compared to other two counties. After 2011, it shows a slight increase in LSI also.
The decreasing number of NP throughout the study period suggests that newly developed urban lands became more aggregated after 1992 in Miami MSA and in all three counties. After a sharp decrease until 2001, the rate of decrease in NP slowed down till the end (2016). Unlike NP, LPI increased during the entire study period at all administrative levels (MSA and County) which indicates an increase in urban centers in the study area. The decreasing trend in LSI and SHAP_AM leads to simplified form of urban patches and land areas in the study area.
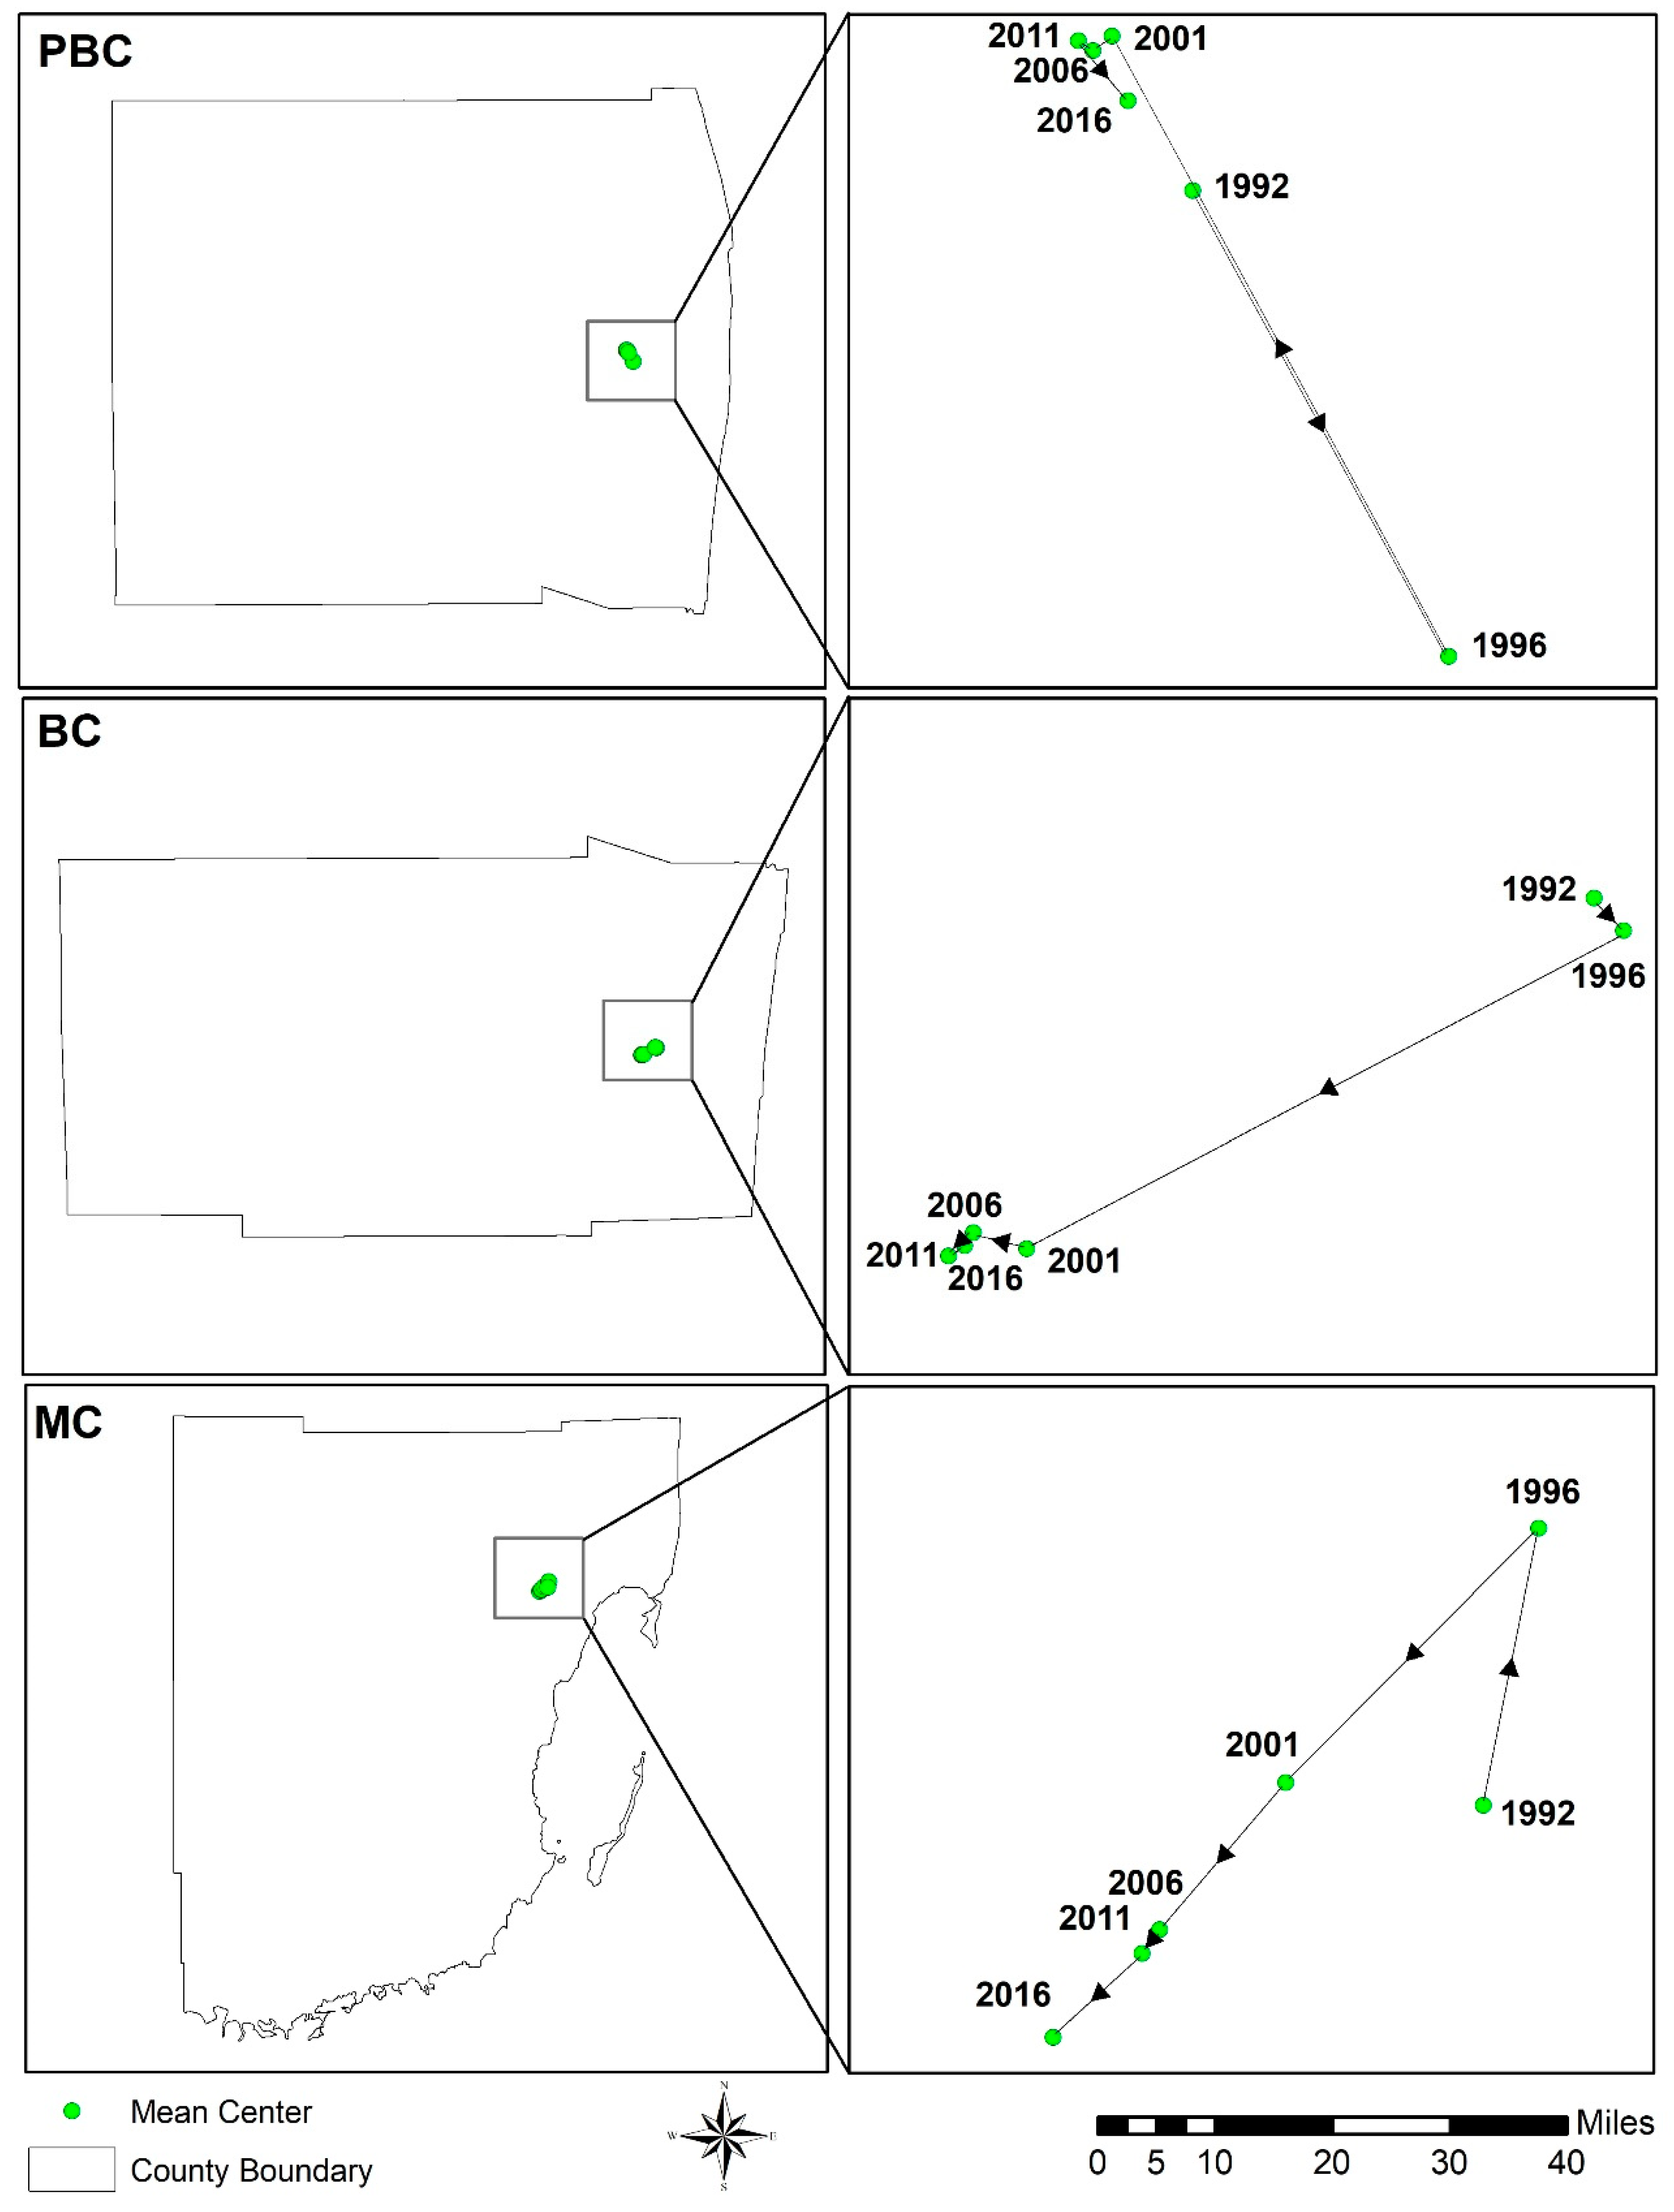
3.5. Urban Expansion Direction
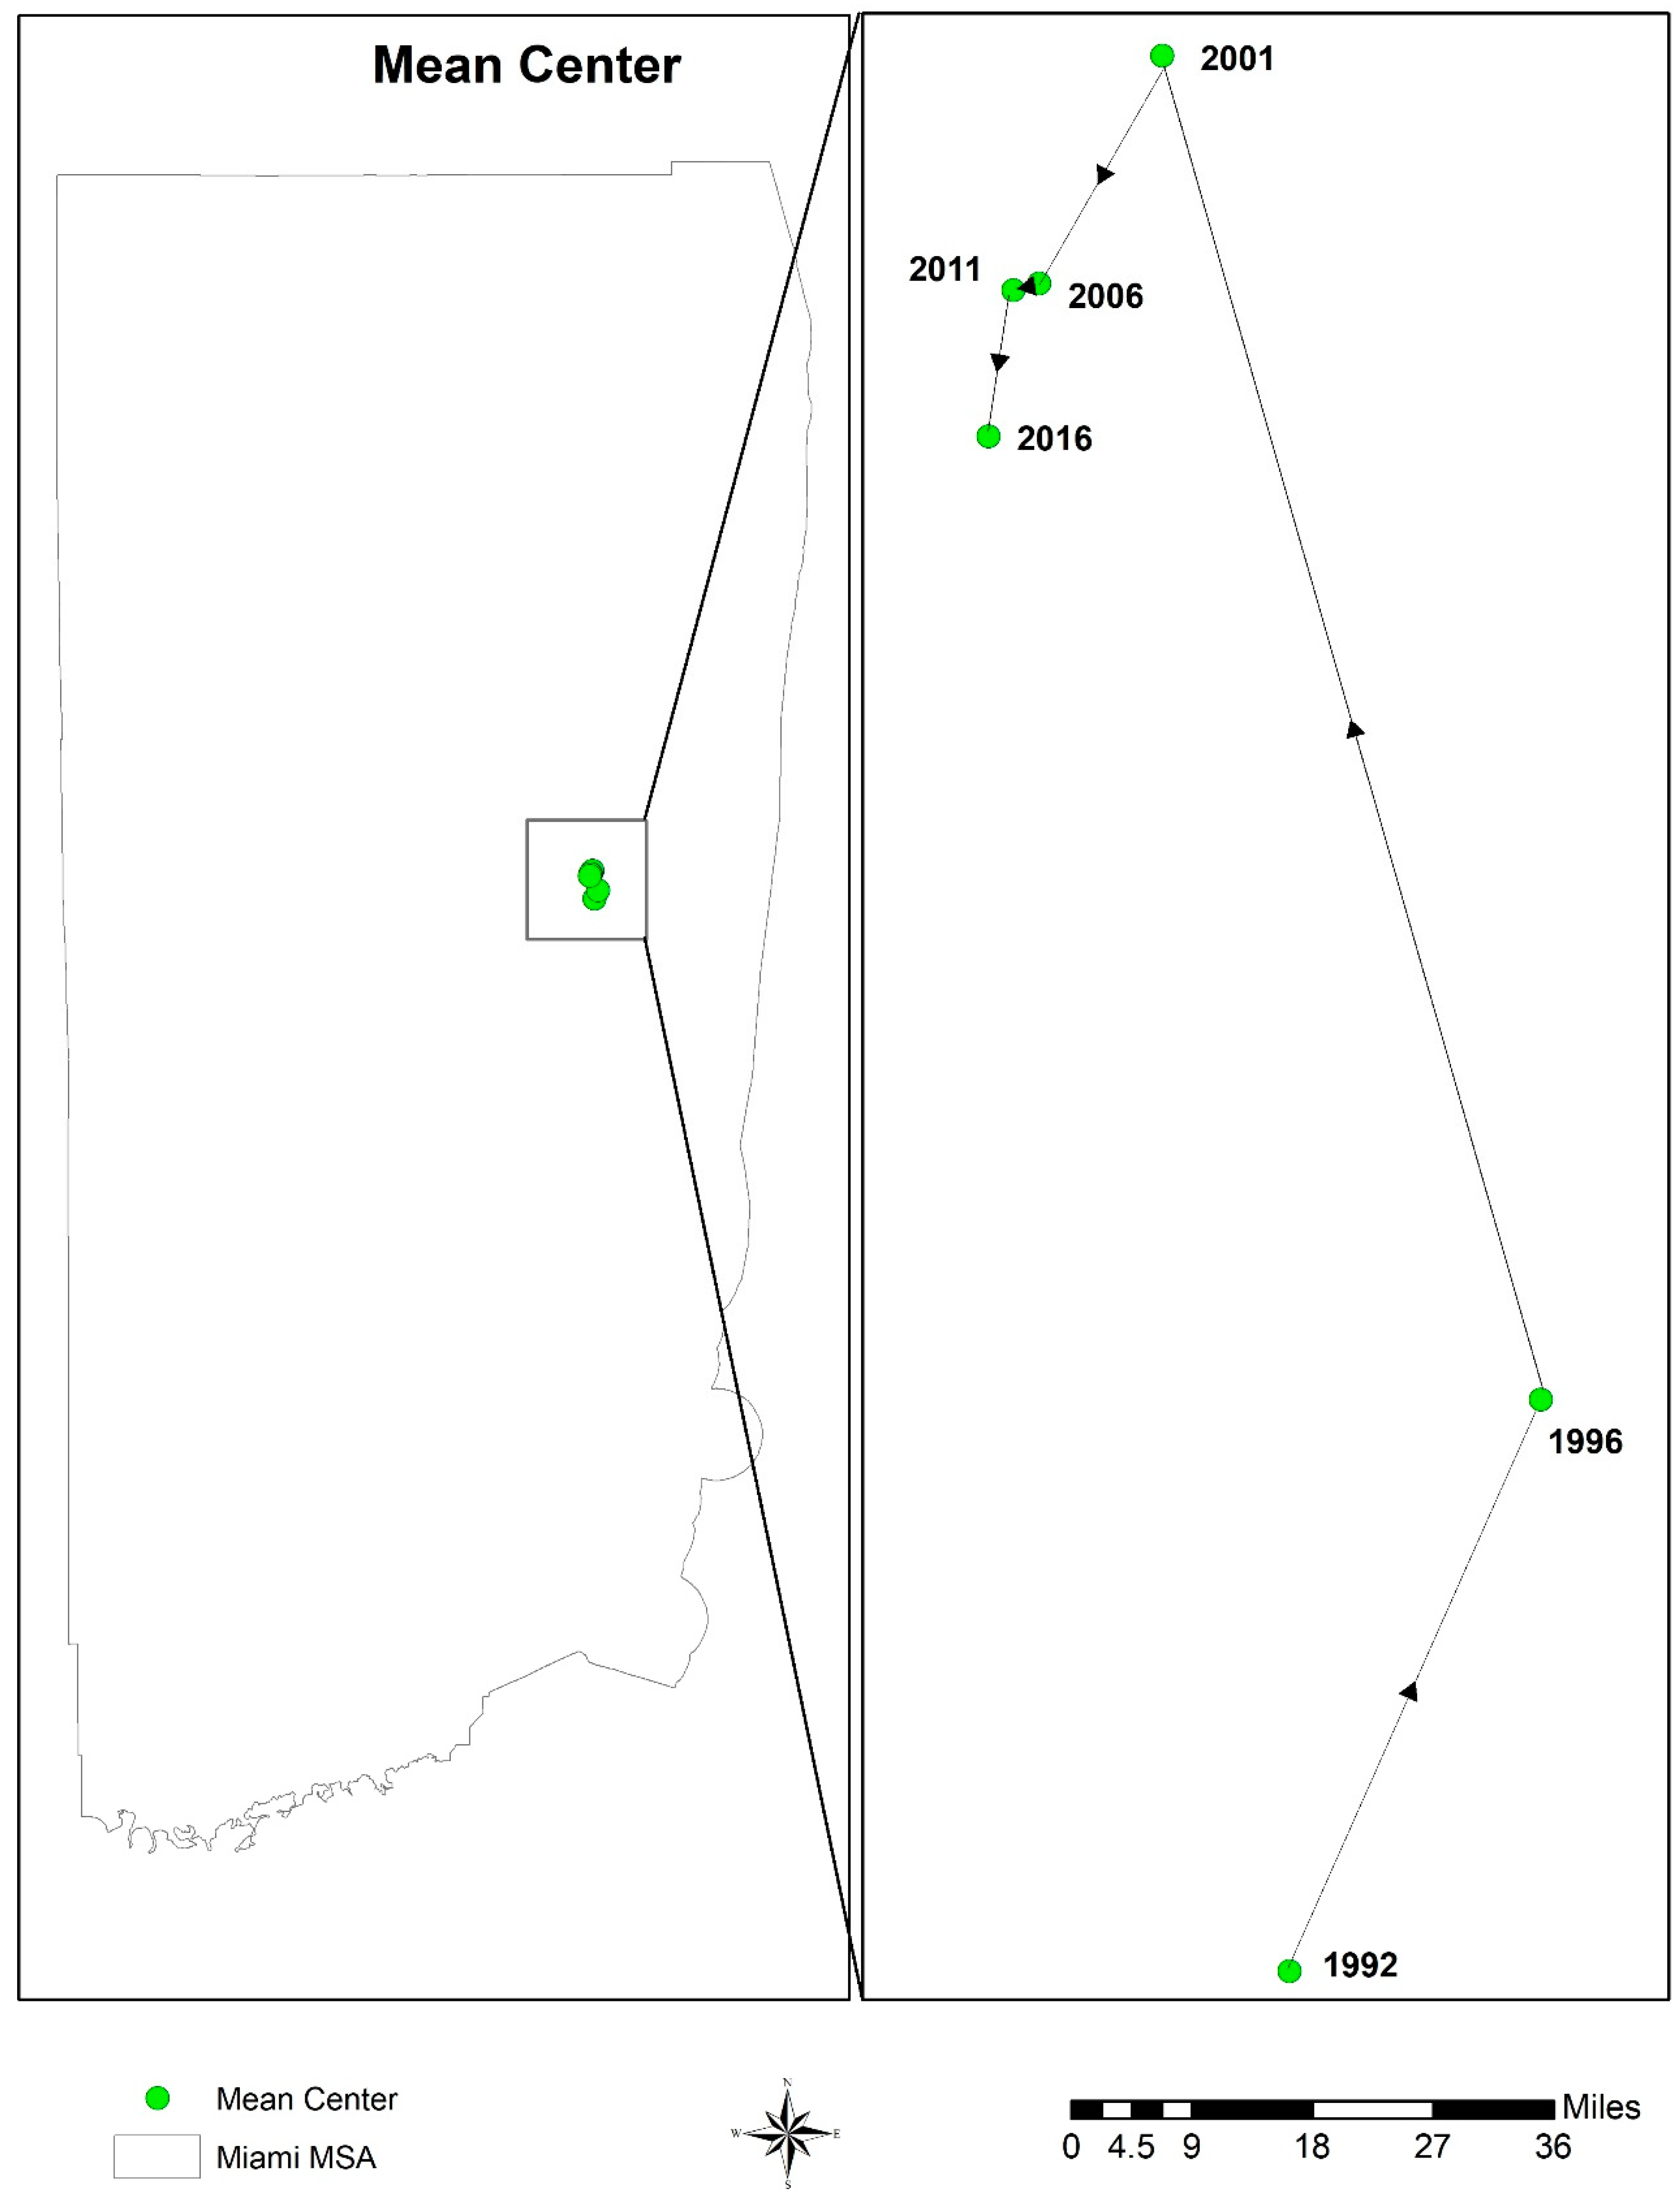
Figure 9 shows the shift in the mean center of the urban areas in Miami MSA from 1992 to 2016. There is a northward shift in the mean center of urban areas from 1992 to 2001. During this period (1992–2001), the mean center first turned towards the east in 1992–1996 and then towards west in 1996–2001. After 2001, the mean center displays a slightly inverse shift from north to south in 2001–2016 while turning towards further west. Although the mean center in the entire study period remained almost stable, there is clearly a westward turn in the mean center in this period. We then further explored the change in mean center of urban areas at the county level.
Figure 10 shows the mean center change from 1992–2016 in PBC, BC, and MC. In PBC, the mean center of urban areas shifted towards southeast in 1992–1996. After 1996, there is a significant opposite turn in the mean center in 1996–2001 when it shifted towards a northwest direction. The period 2001–2011 remained steady until 2016 when the mean center in PBC shows a slight turn towards southeast direction. Unlike PBC, BC shows a southwest shift in mean center of urban areas overall (1992–2016). Although after 2001, the mean center remained almost stable in BC while turning towards further west. In MC, urban area means center shifts towards north in 1992–1996. After 1996, it experienced a reverse change towards southwest until 2016.
3.6. Statistical Analyses
The results of the correlation and regression analysis are portrayed in
Table 5. Six multiple linear stepwise regression models were built, one for each study year from 1992 to 2016. Each model explained more than half (Adjusted R
2 is above 0.5) of the total variation in urban land. The population was found as the variable that explains most of the variance in urban land area in each year except at the end (year 2016). In 2016, variable Distance to Coast was the most significant variable in explaining the total variance. In 1992 and 1996, Distance to Coast entered in the model as the second explanatory variable followed by Distance to Roads. Median Income was not an entry variable in the first two years’ model (1992 and 1996) and last year’s model (2016). From 2001 to 2011, Distance to Coast was the second entry variable in each year’s model followed by Distance to Roads and Median Income, respectively. In 2016, Population was the second entry variable in the model and Distance to Roads was the last to enter the model. Elevation (DEM) did not have any statistically significant strong correlation with urban land and therefore, elevation was not selected as one of the independent factors in the models. Since the land surface is mostly flat in the south Florida region and elevation does not change very frequently, our findings of elevation not having any strong relationship with urban land area are admissible.
In all models, Population, Distance to Coast, and Distance to Roads are accounted for approximately 90% of the total variation of urban land explained. Median Income was not found influential to the variation of urban land areas explained in 1992, 1996, and 2016. For the rest of the years (2001–2011), Median Income had a weak positive correlation with urban land areas and limited influence in explaining the variance in urban land areas. The population had a strong positive correlation with urban land areas and positive model coefficients in all the study areas indicating that higher population increases urban land areas in each of the study periods. Additionally, Distance to Coast and Distance to Roads had strong negative correlations with urban land areas and negative model coefficients in each year indicating that shorter distances from coast and major roads increase urban land areas regardless of the study year. High tolerance value (close to 1) and low VIF values (1<VIF>3) in the correlation matrix in each year’s model suggest that there was a very low degree of multicollinearity among the independent variables.
5. Conclusions
Urban expansion is one of the most irretrievable land transformation processes in the world and poses major impacts on the environment and challenges for the entire world at global, regional, and local scale. There is still a lack of research that focuses on urban expansion process at local scale in the US. Being a developed country, less attention has been paid on the dynamics of urban expansion in this region than necessary and timely monitoring and evaluation of urban land expansion is extremely important.
In this study, we used NLCD data and C-CAP data combined with urban growth type and landscape metrics analysis to quantify the dynamics of the spatiotemporal pattern of urban expansion in the moderately developed Miami MSA. We then further extended our analysis to examine the spatiotemporal patterns of urban growth at the county level and compared the results between the three counties (PBC, BC, and MC) that are located within the MSA area. More specifically, we analyzed and compared the spatial and temporal distribution of urban expansion rate, pattern, expansion types, urban expansion intensity, and landscape metrics. Results suggest that this region experienced a moderate but noticeable urban expansion over the last 25 years. Urban expansion in this region can be divided into two phases: pre-2001 phase when urban expansion rate was very rapid in this MSA and post-2001 phase when urban expansion rate was moderate/slow. Urban expansion at the county level was almost the same as the MSA where the overall annual urban expansion rate in PBC was the highest (16.15 km2 year−1) followed by BC and MC (9.08 and 9.04 km2 year−1, respectively). The standardized annual urban growth rate for PBC, BC, and MC are 1.68%, 1.13%, and 0.97%, respectively, which suggests a moderate urban expansion overall in these counties.
Similarly, infilling was the dominant expansion type in all the study periods in the MSA and in all three counties. Additionally, they all followed the same pattern of decreasing amount of NP and LSI from the beginning of the study period (1992) which suggests that as the urban land expanded and time progressed in this region, they became more aggregated and simplified. Another interesting finding from the analysis was that the newly developed urban lands were generated away from the east coast in this region over the entire study period which was further corroborated by mean center analysis.
As per the cities were concerned, it was evident that the newly developed urban lands were moving away from the major historical and prominent cities in this region. As urban growth creates pressure on the existing population and increases the cost of living and environmental pollution, people might have forced to move away from the city areas to sub-urban areas and eventually created new ‘urban cores’. Statistical analysis of the major explanatory factors of urban expansion reveals that Population and Distance to Coast had strongest relationships with urban lands where the former had a positive relationship and latter had a negative relationship. Distance to Roads was another variable that had a strong relationship with urban lands followed by Median Household Income in this region. With continuous population growth and economic development, dealing with urban expansion and environment and biodiversity protection in this region would be perplexing in the coming years. Future research should emphasize the improvement of the spatial and spectral resolution of remote sensing data in order to more accurately portray the urban expansion patterns and should include additional factors of urban expansion including that are used in this research to explain the urban expansion characteristics comprehensively. Finally, the methods and techniques utilized in this research could be applied in future studies focusing on the urban expansion patterns in other metropolitan areas.


