Evaluation of the Multi-Angle Implementation of Atmospheric Correction (MAIAC) Aerosol Algorithm for Himawari-8 Data


Abstract
:
1. Introduction
2. Data and Methods
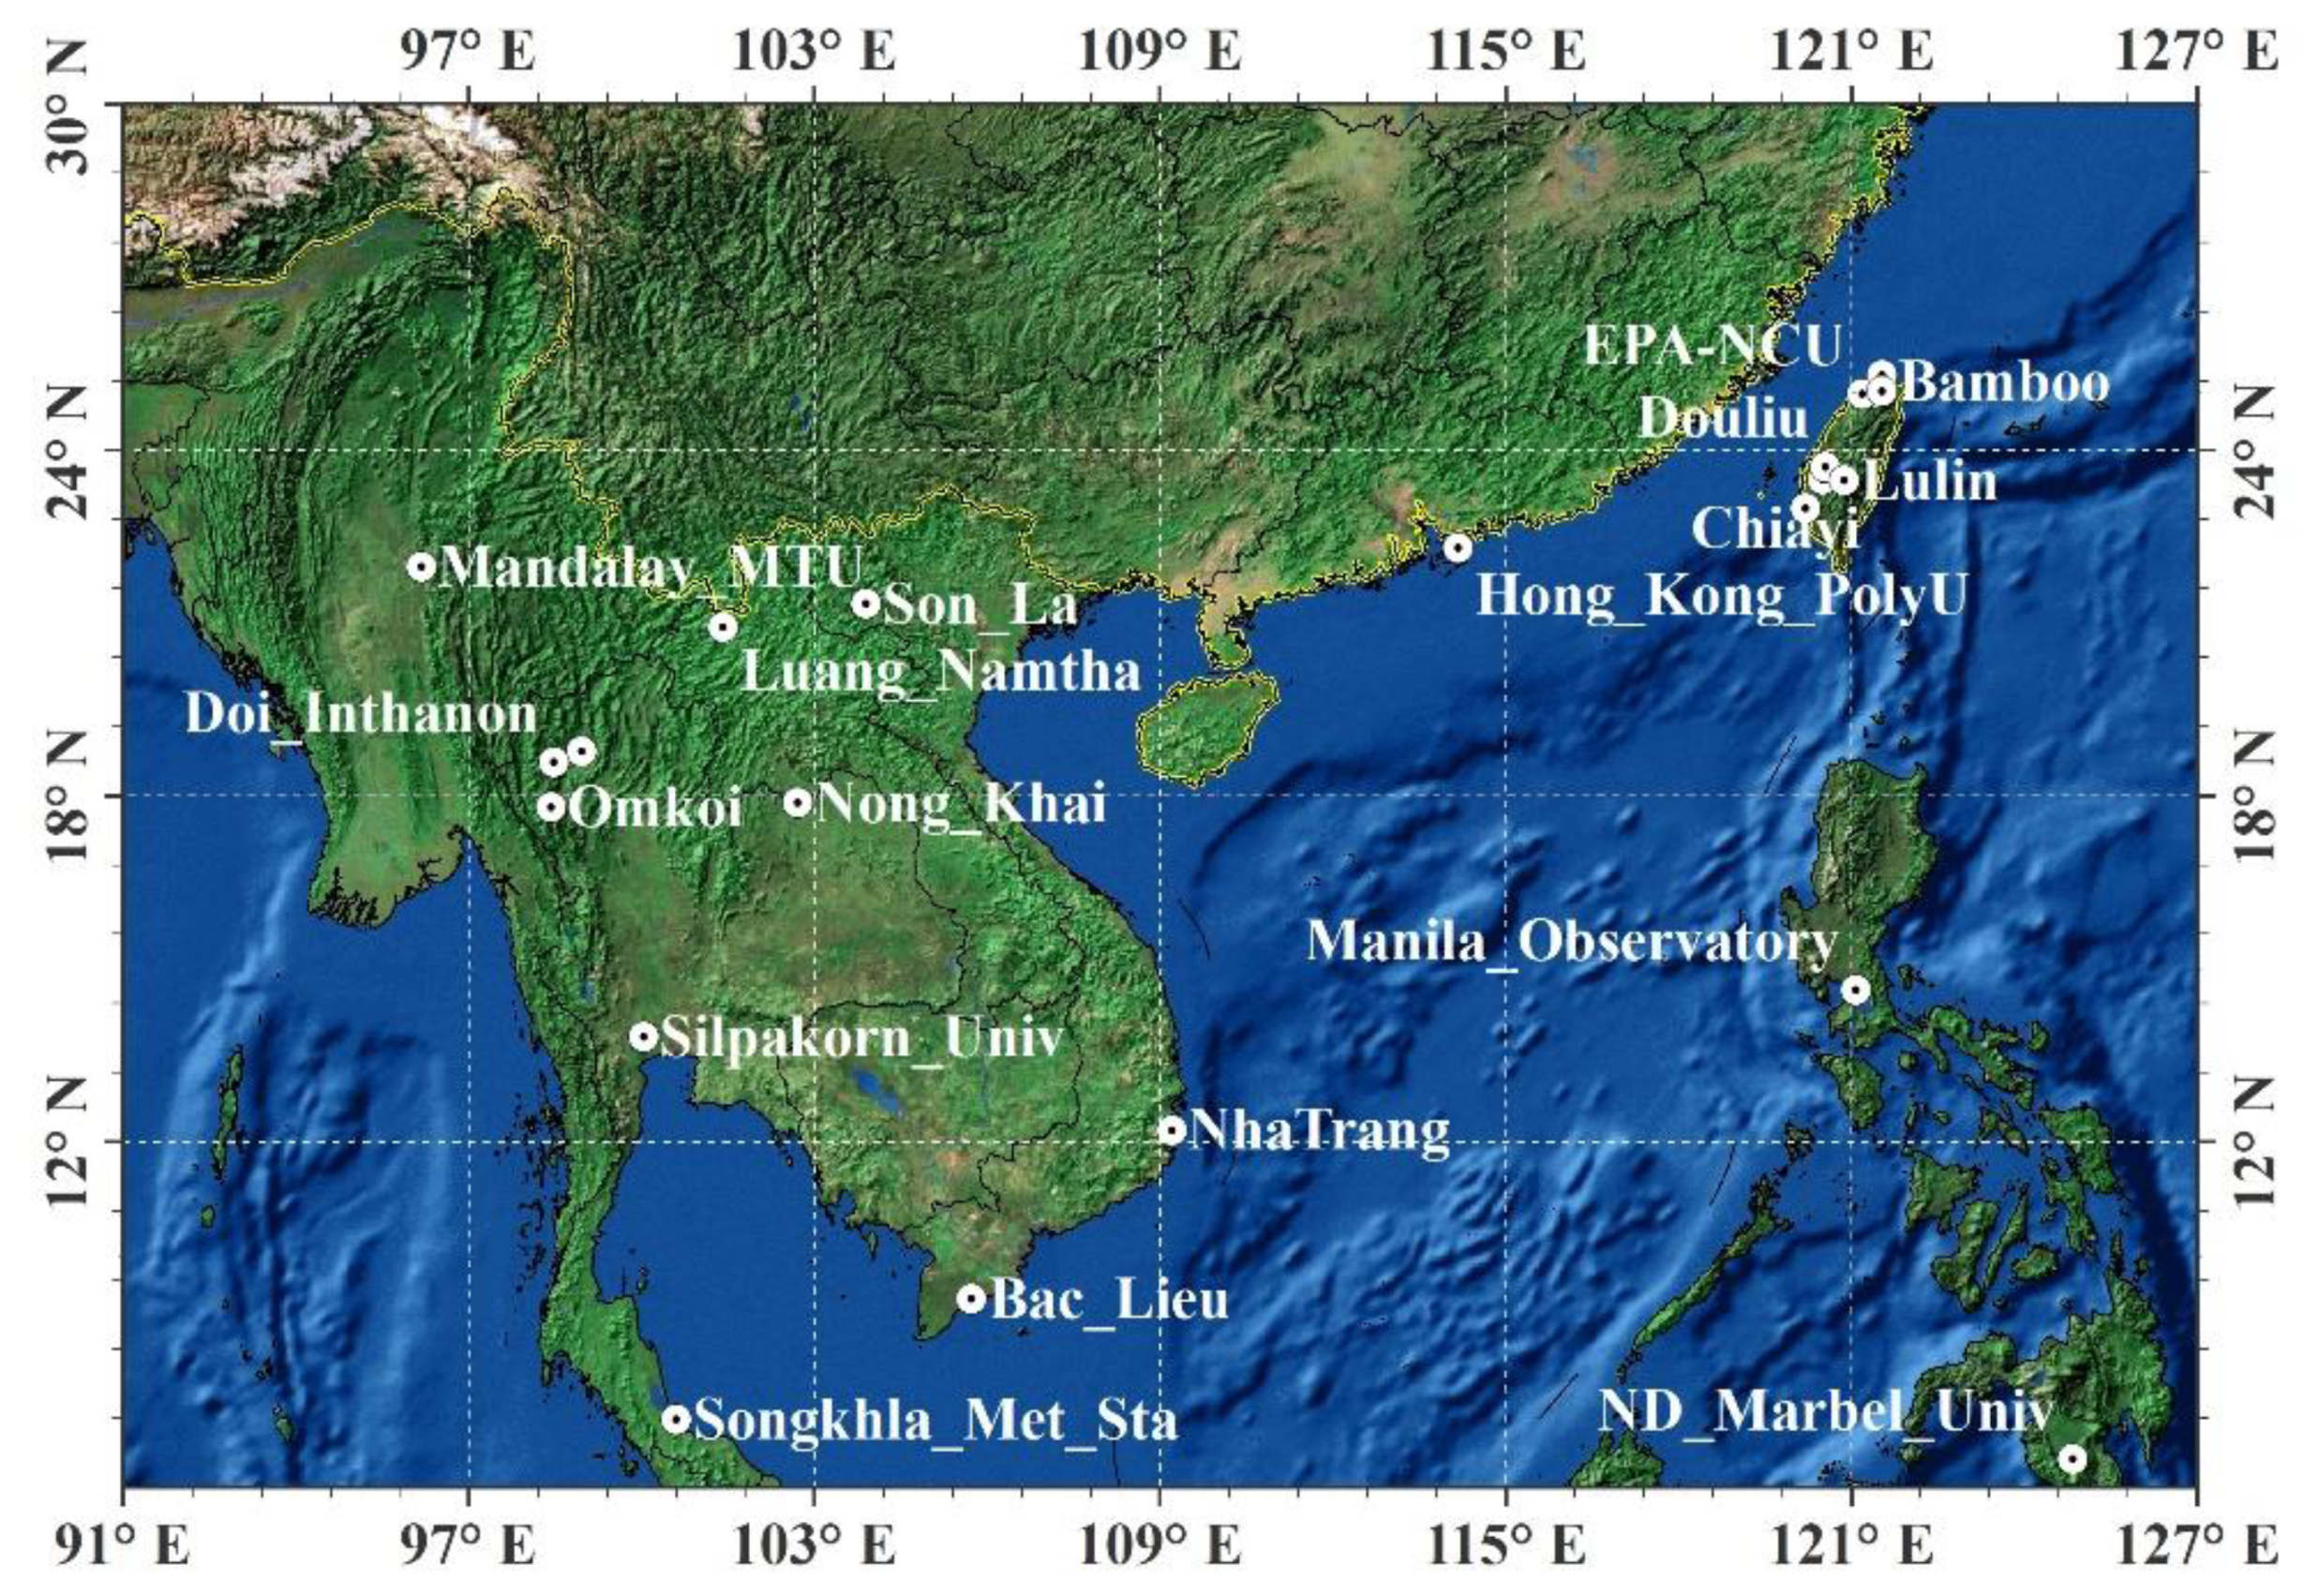
2.1. AERONET Data
2.2. JMA AHI AOD Products
2.3. GeoNEX AHI AOD Products
2.4. Comparison of Contemporaneous AERONET and Satellite Retrieved AOD
3. Results
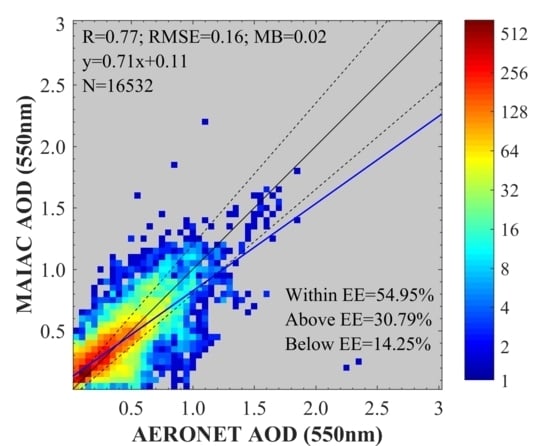
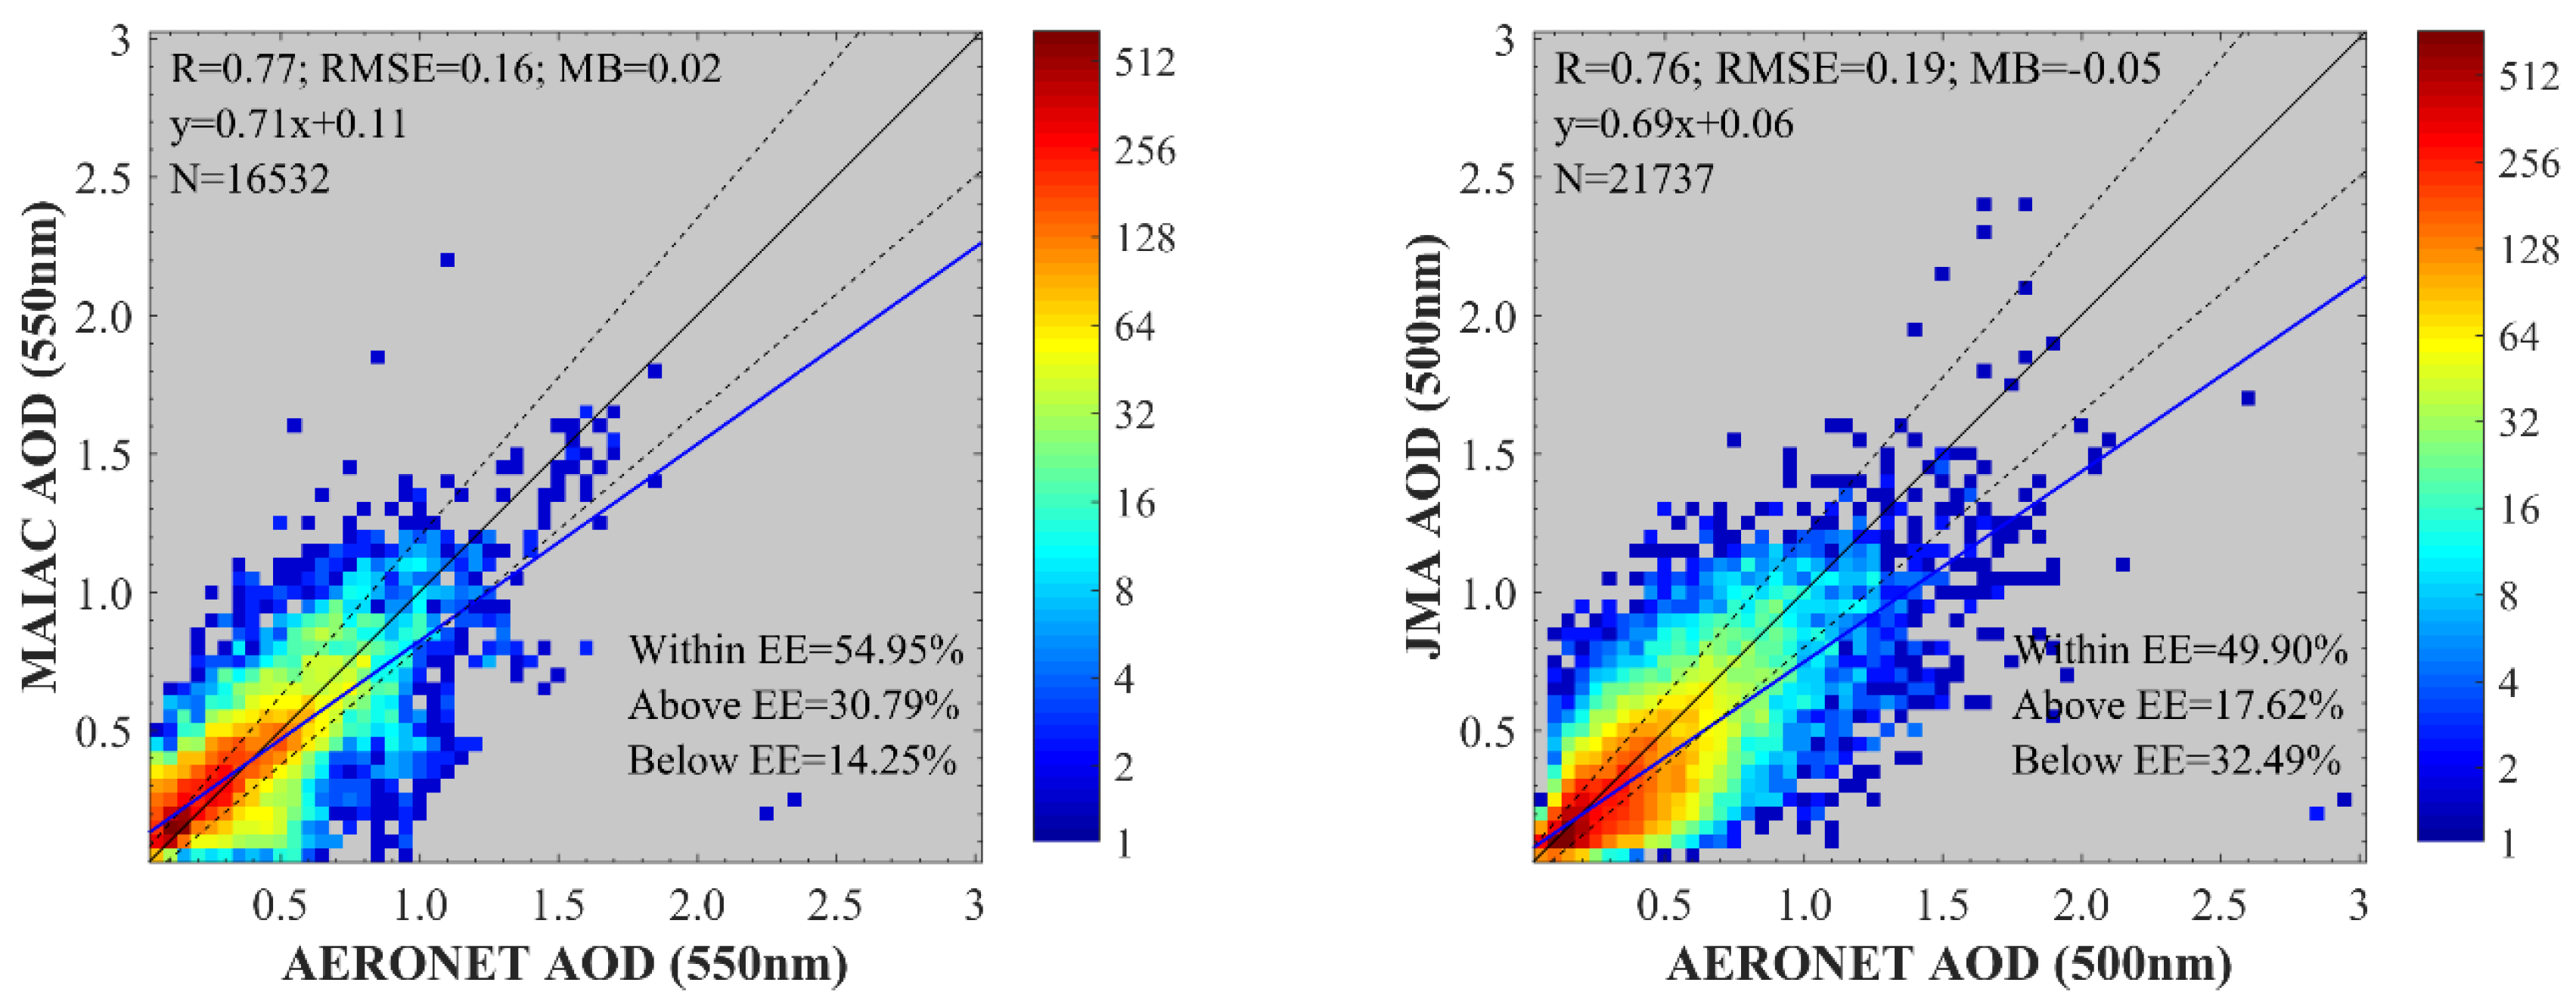
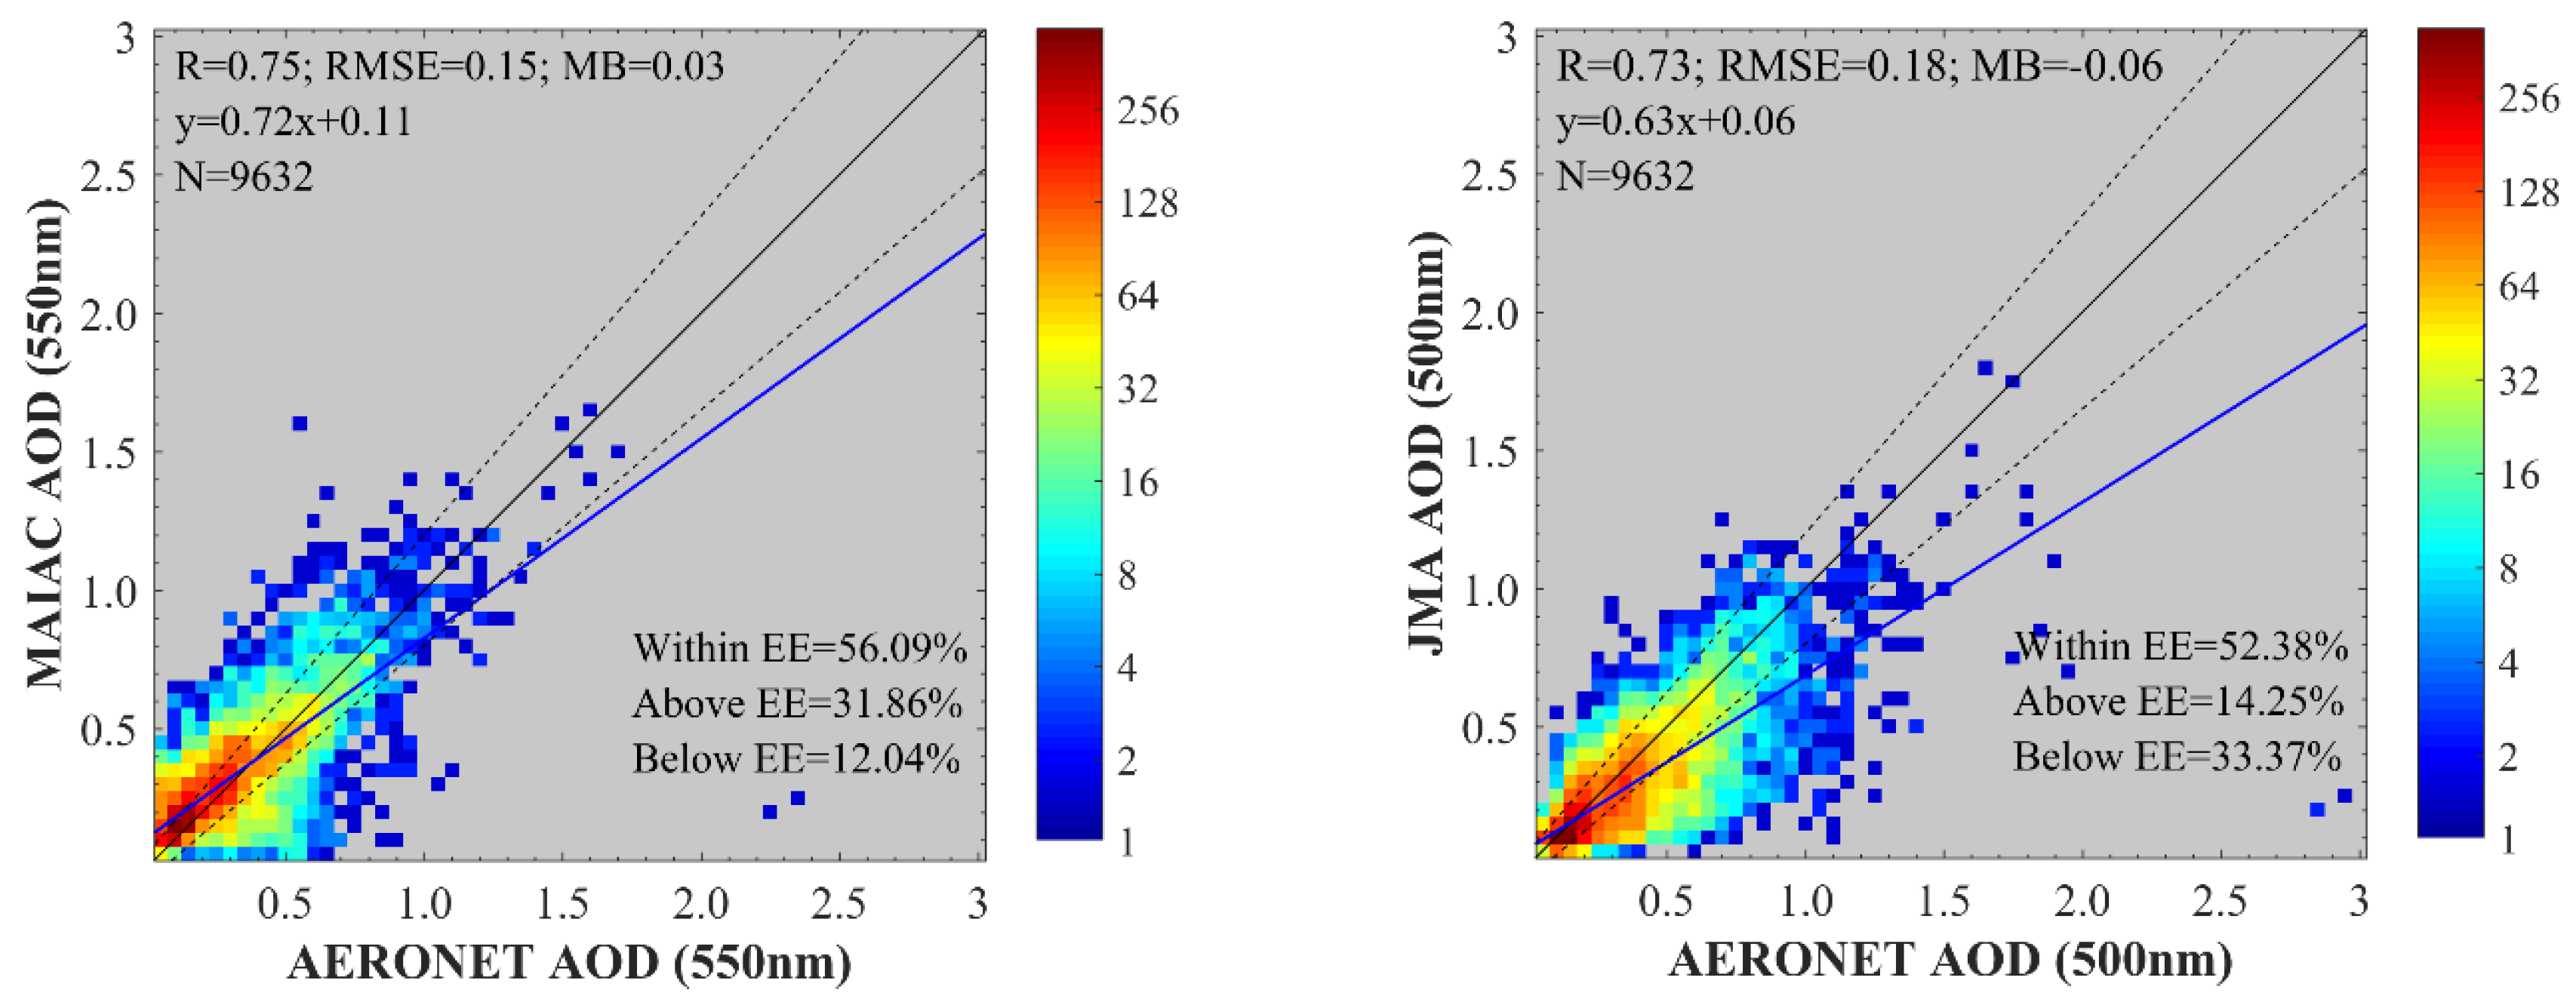
3.1. MAIAC and AERONET AOD Comparison
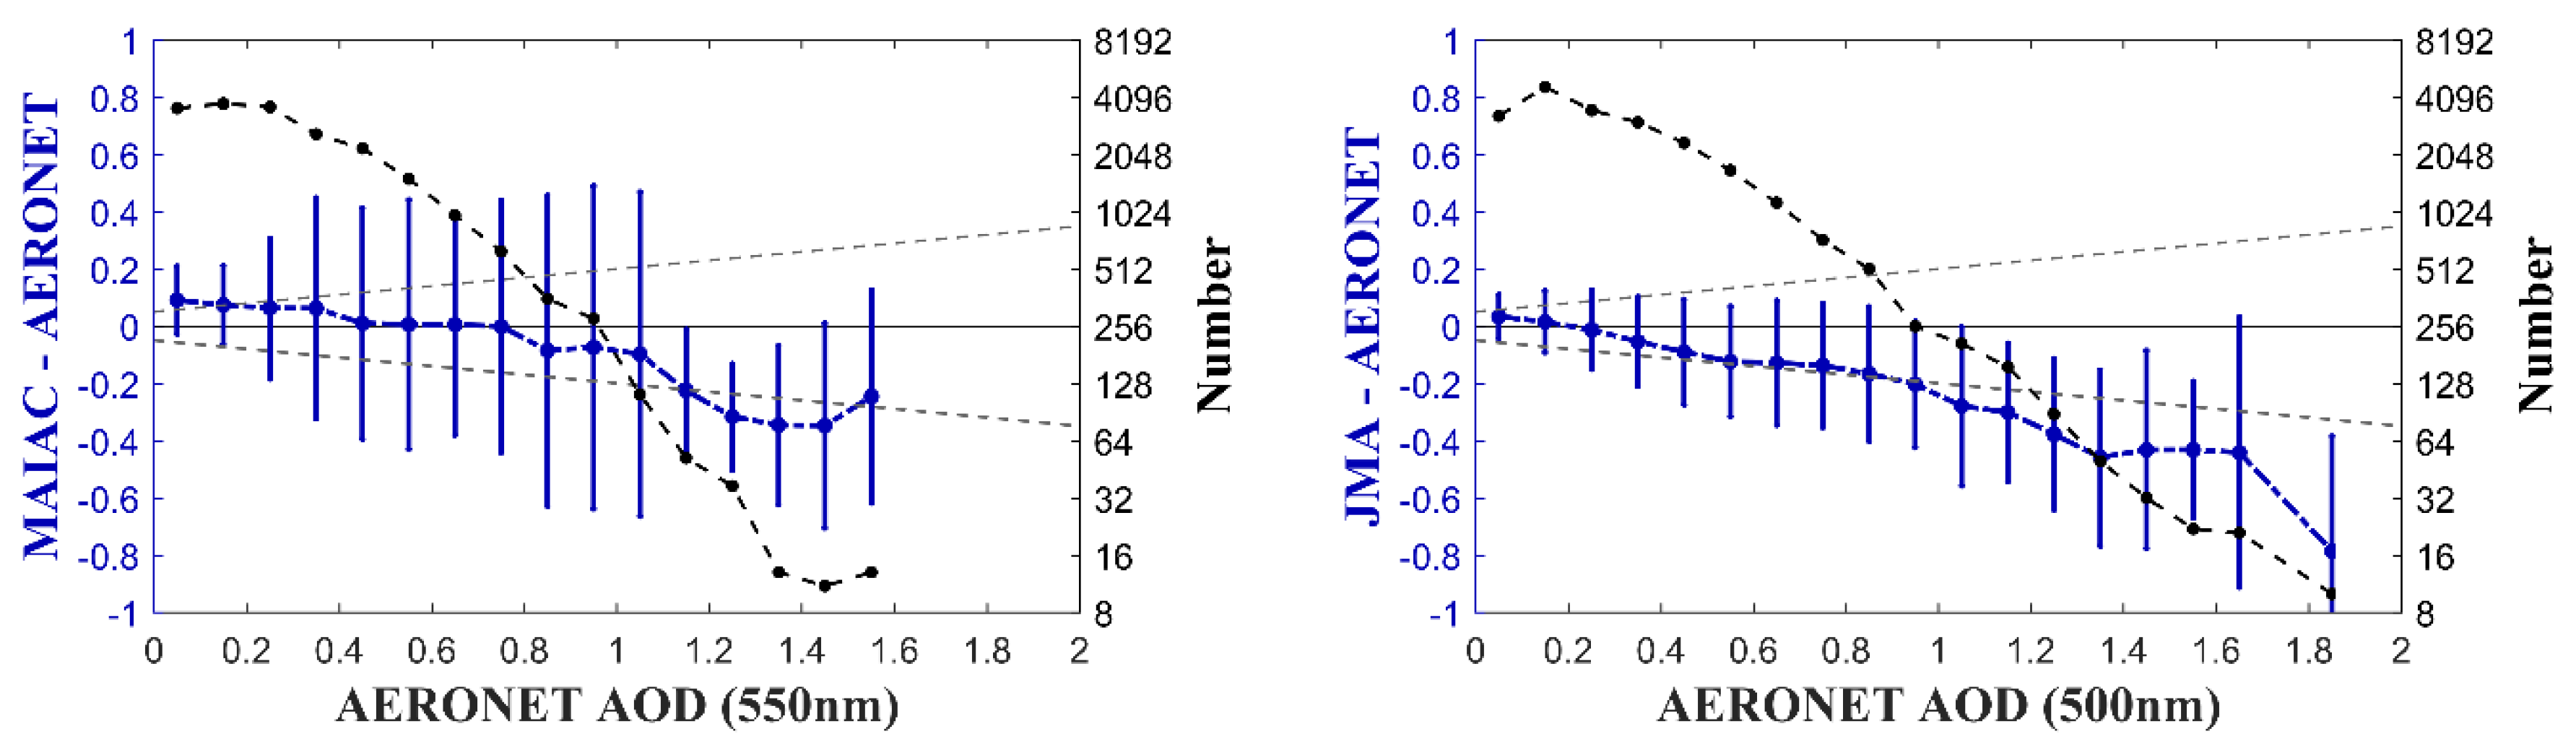
3.2. Error Dependence on AERONET AOD
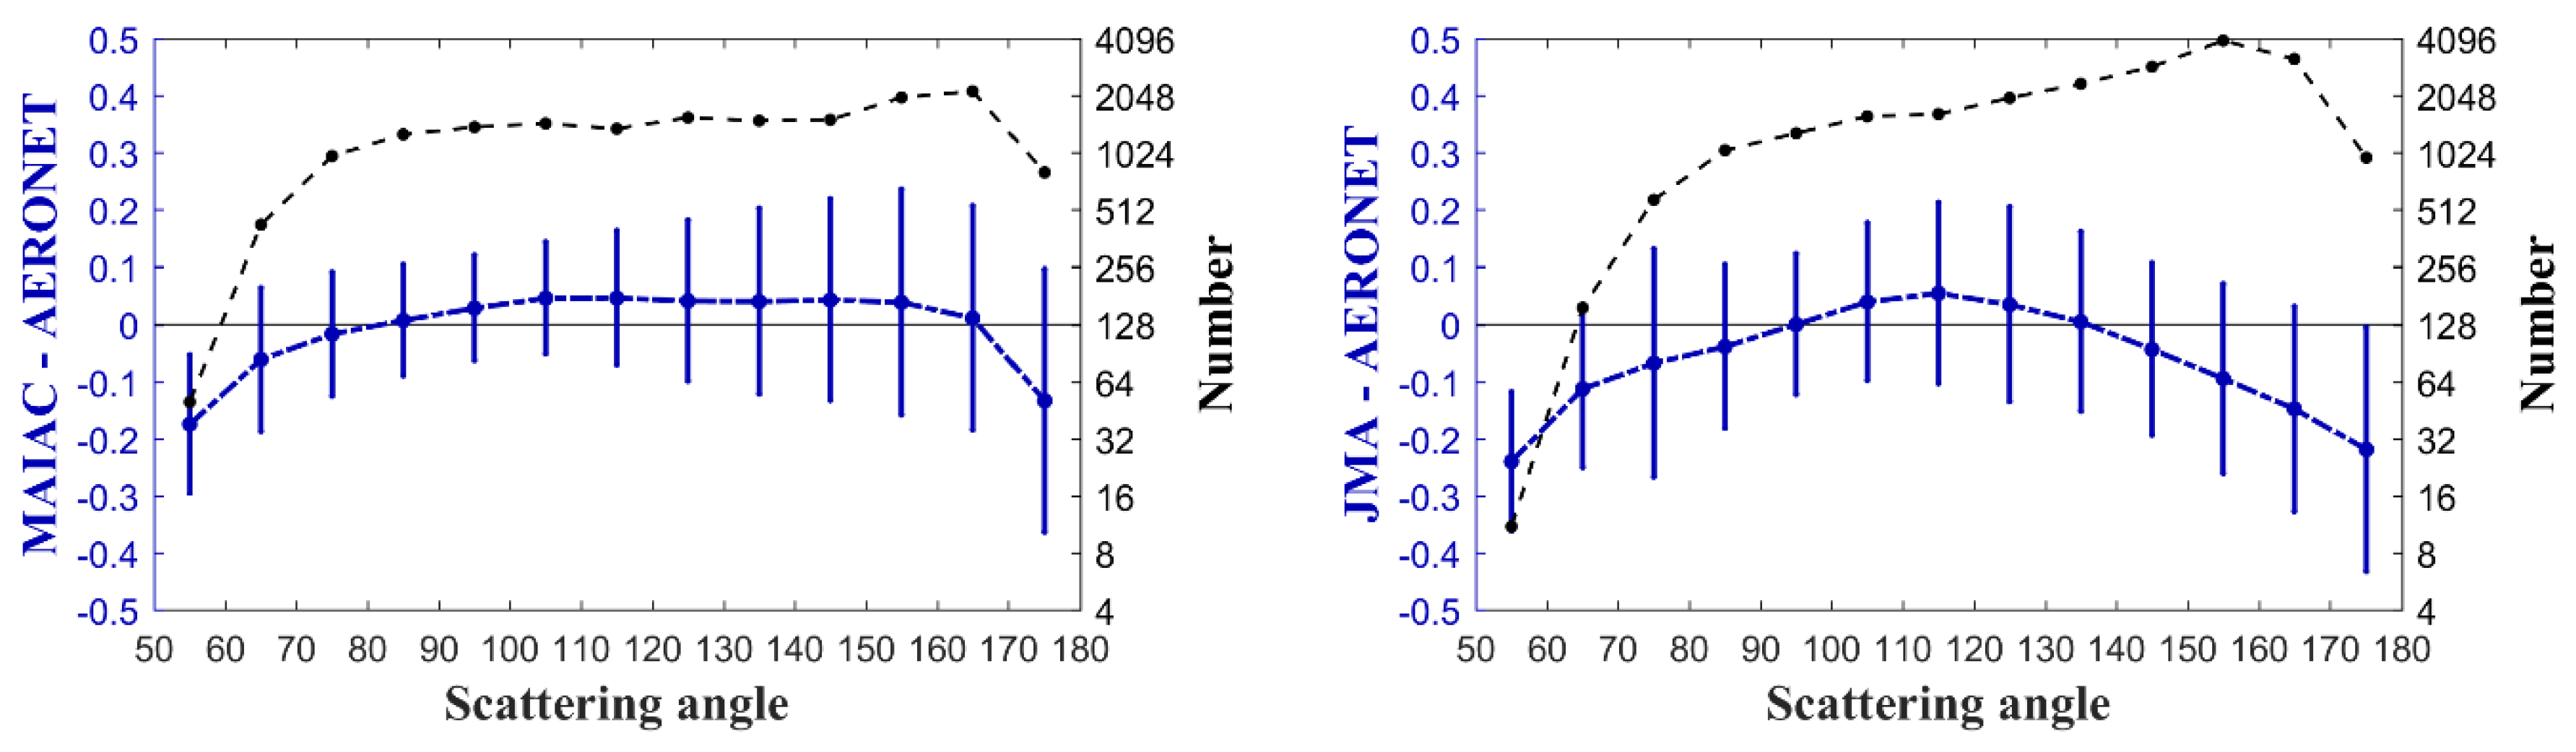
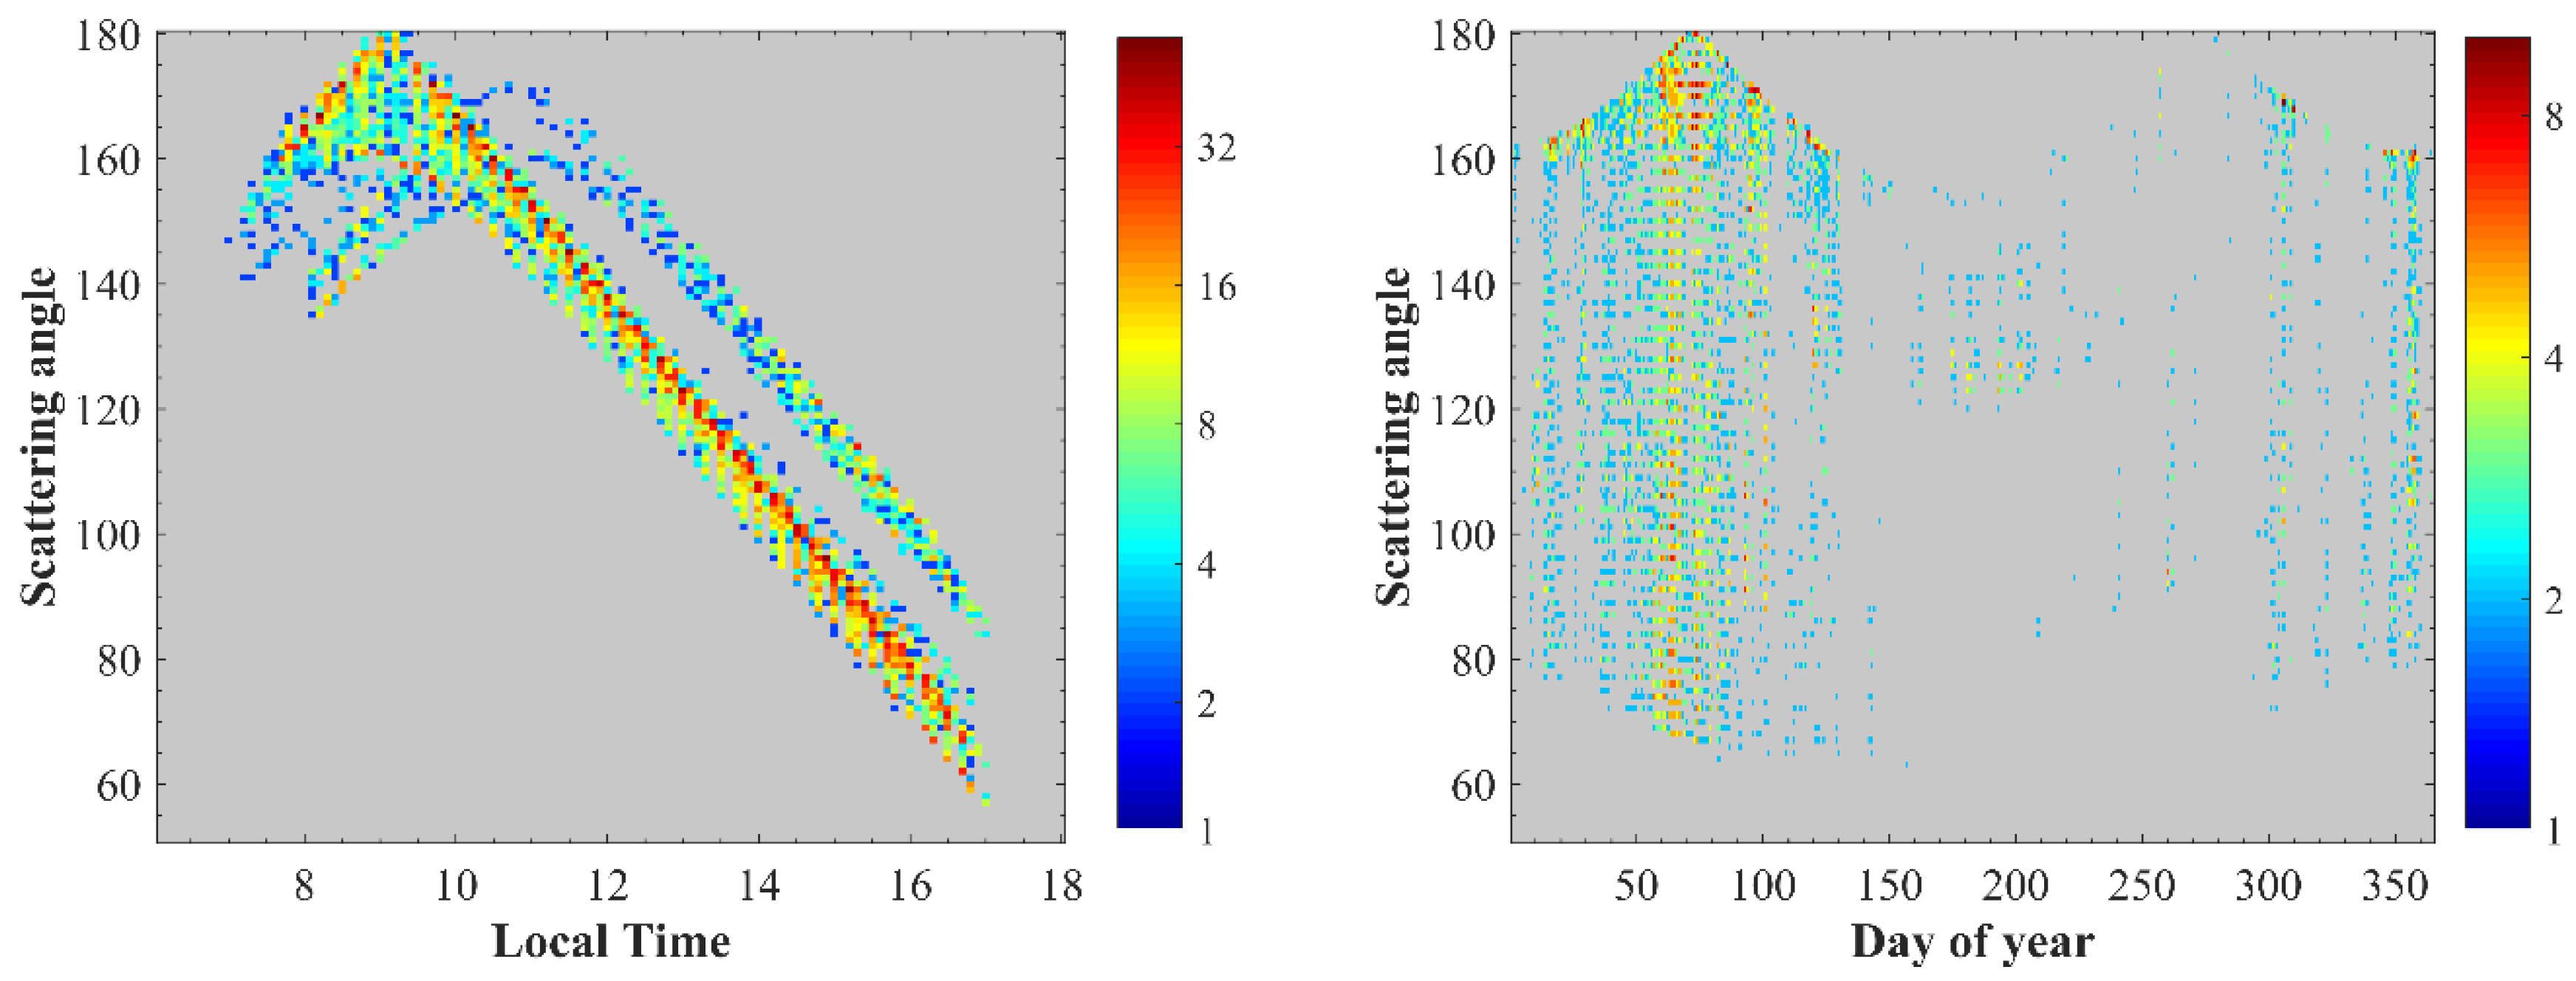
3.3. Error Dependence on Scattering Angle
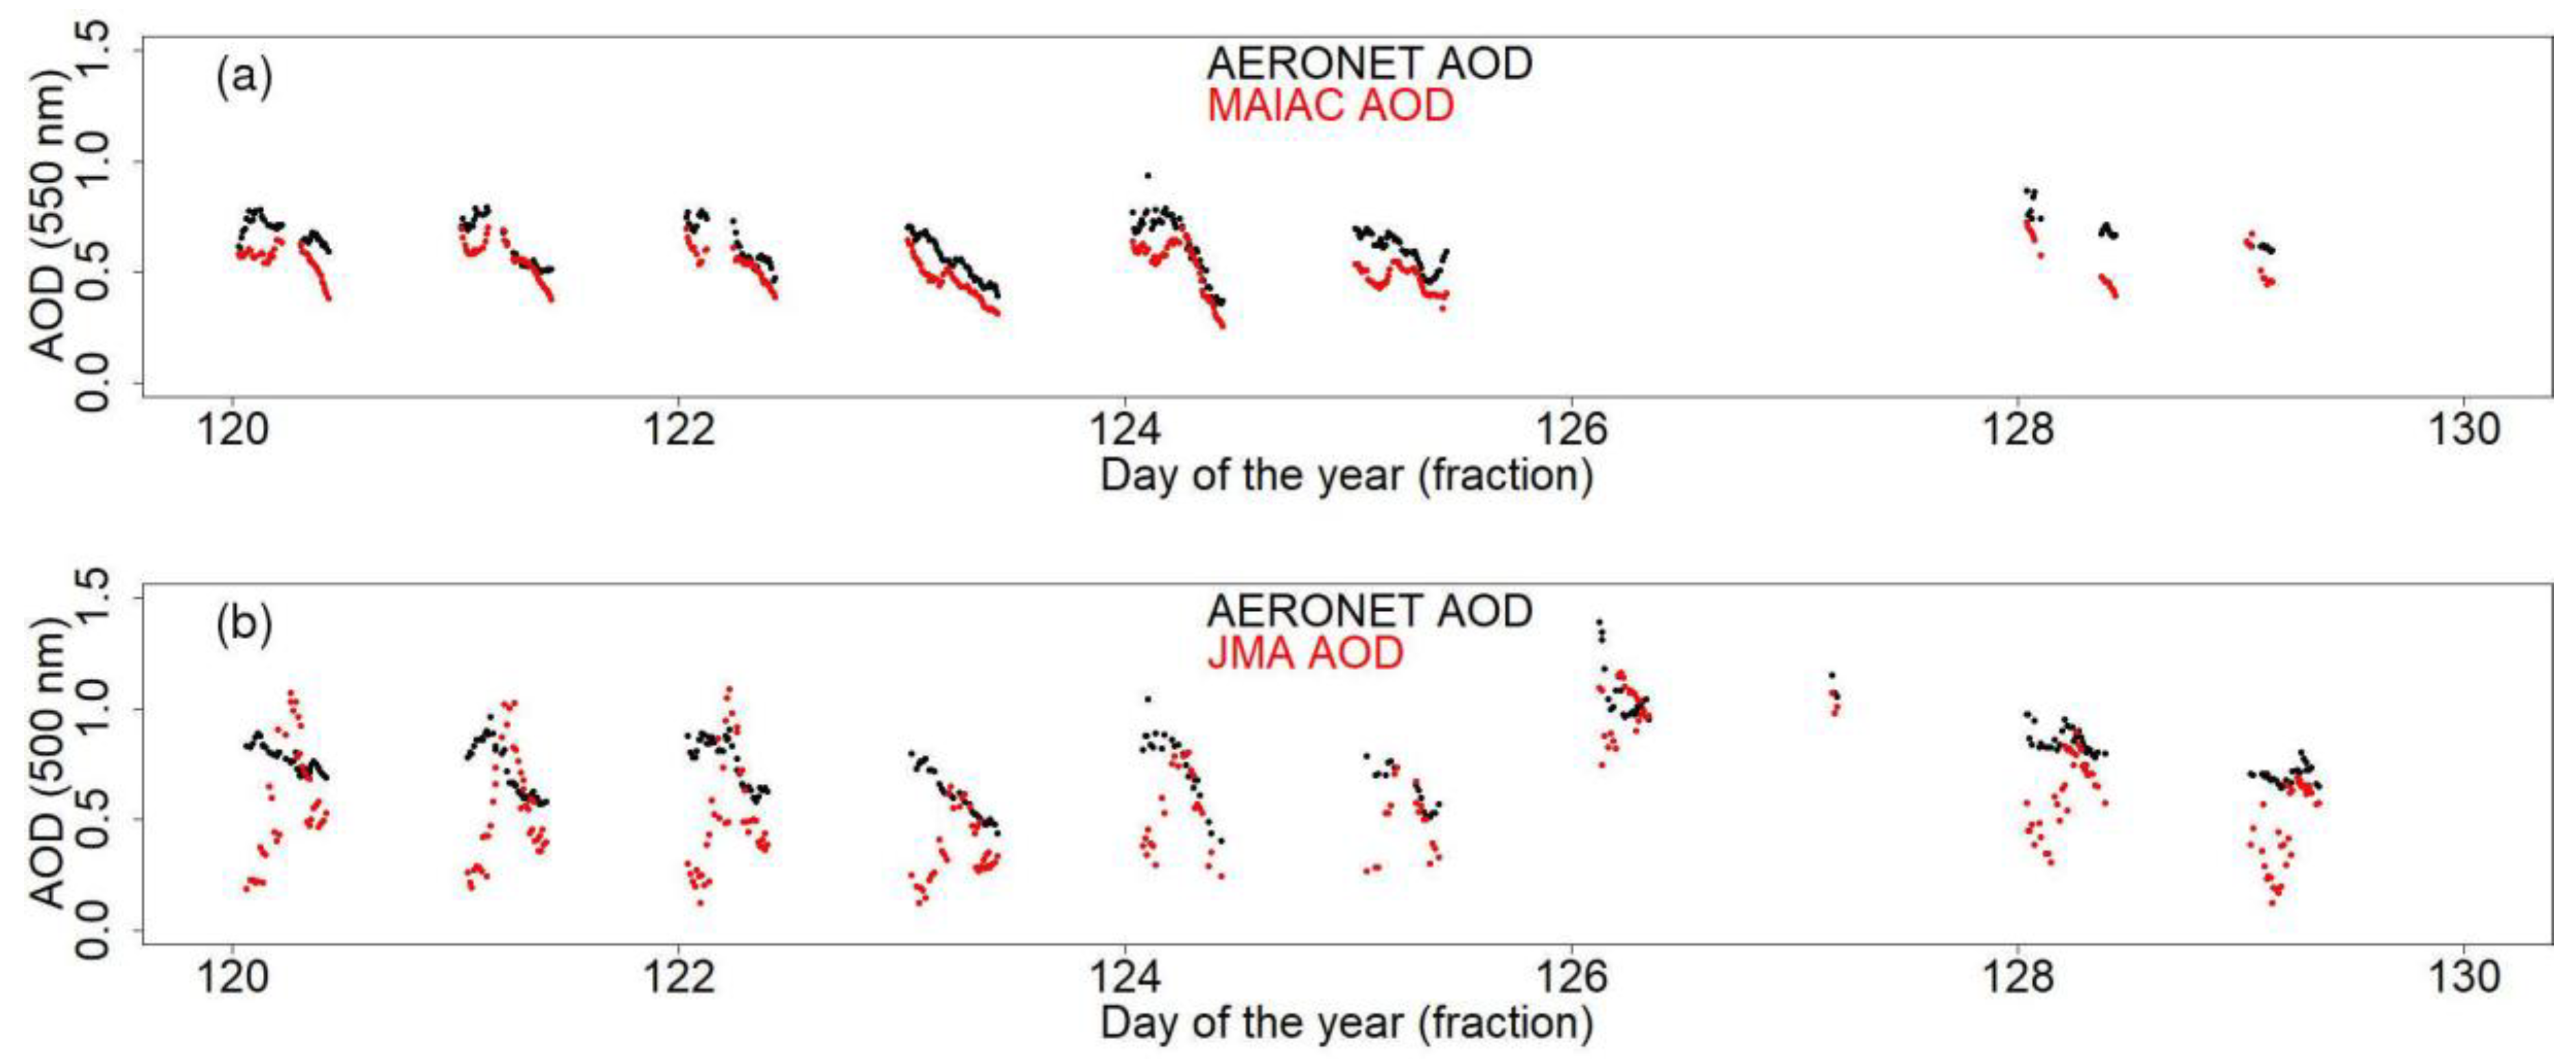
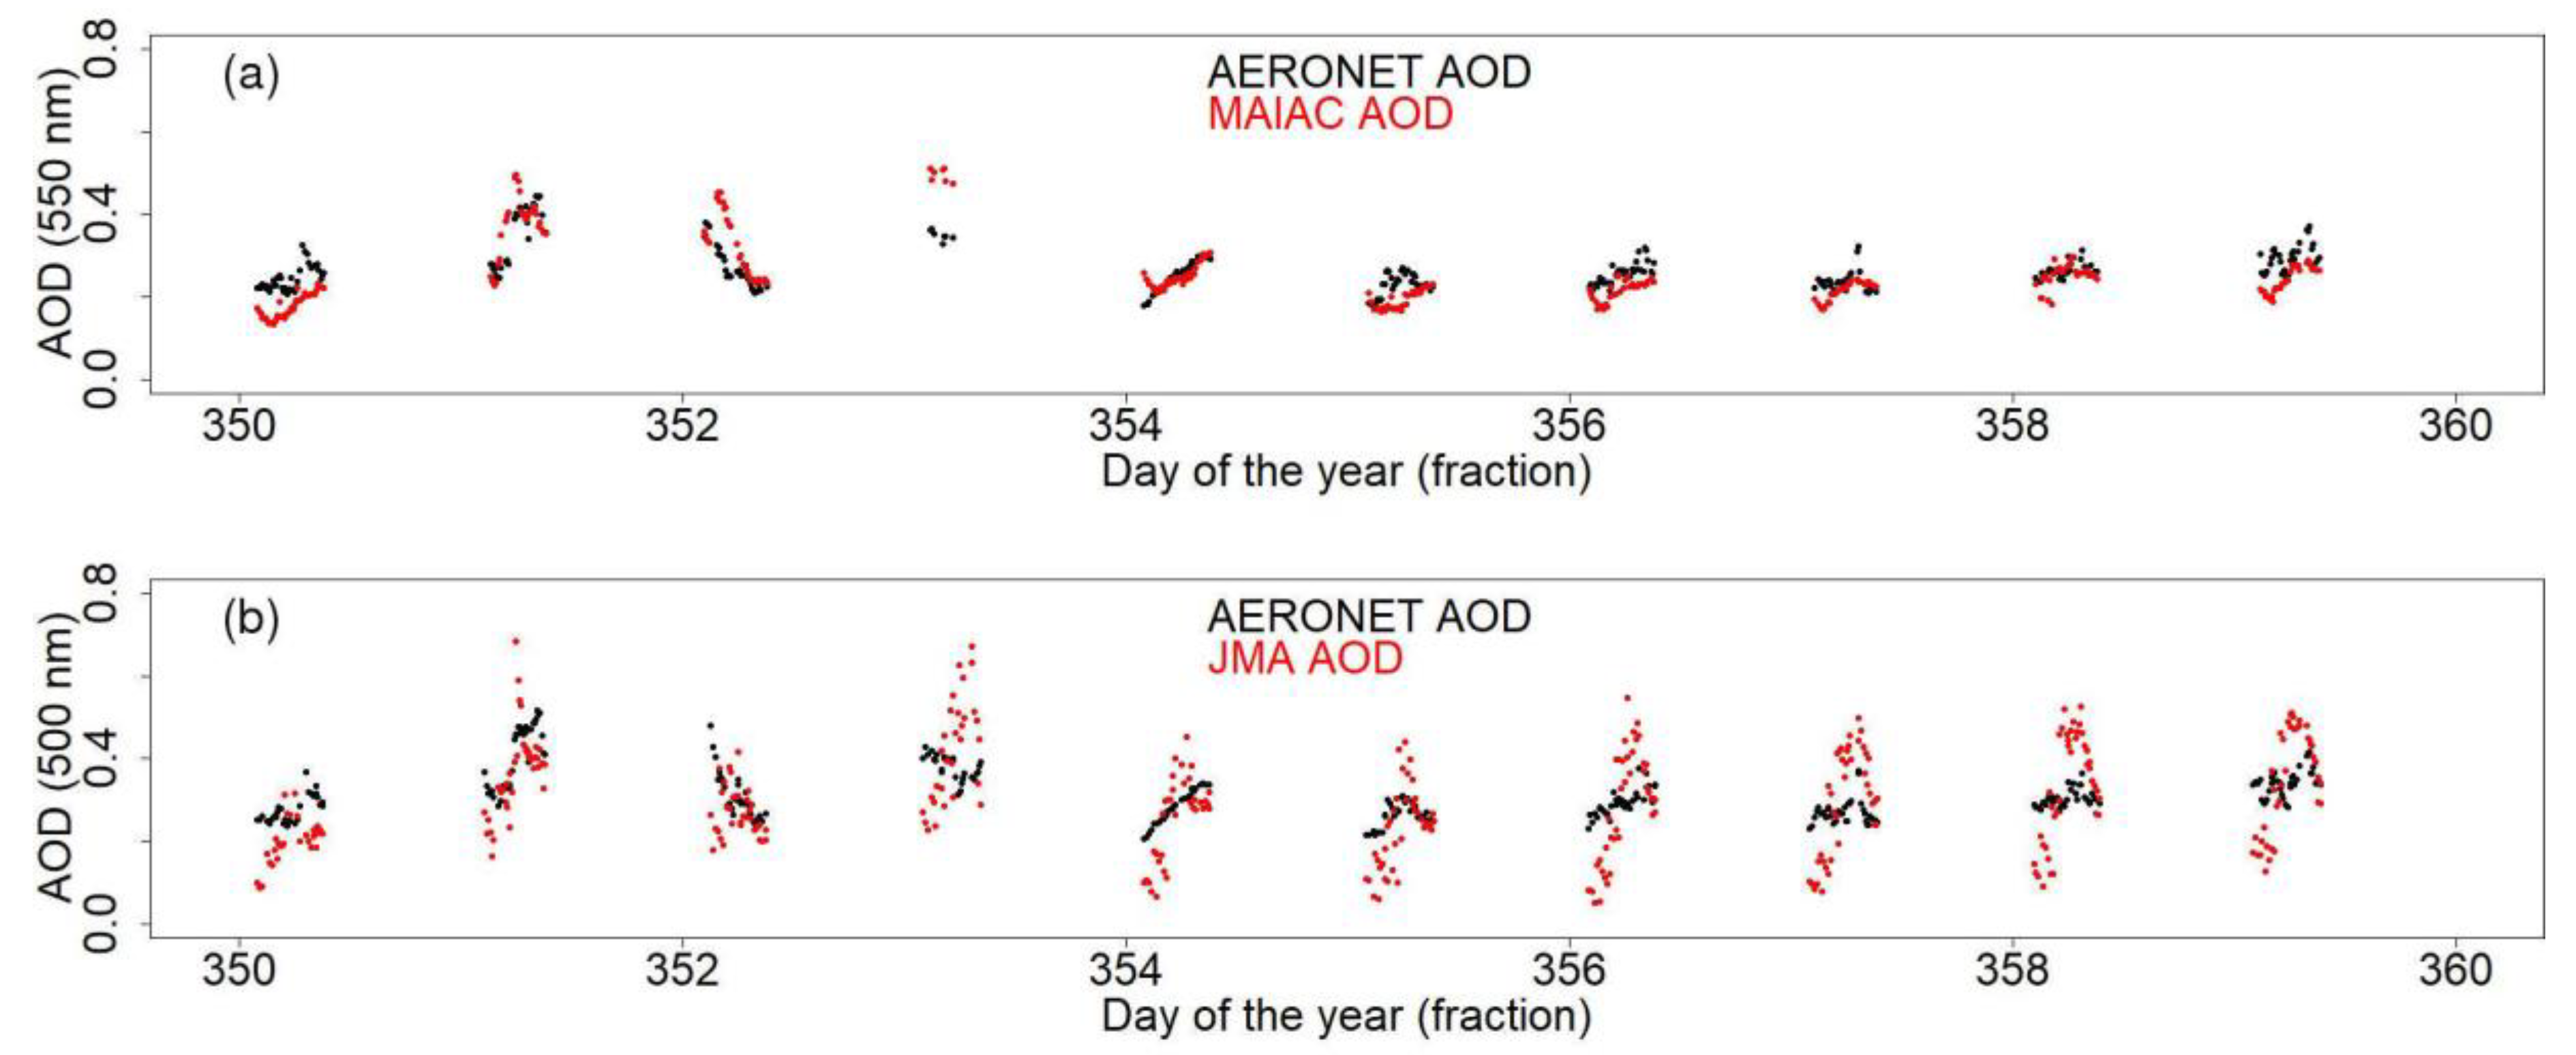
3.4. Time Series Examples
4. Discussion
4.1. MAIAC Algorithm Accuracy
4.2. MAIAC Algorithm Error Dependence on Scattering Angle
4.3. MAIAC and JMA Comparison
5. Conclusions
Author Contributions
Funding
Acknowledgments
Conflicts of Interest
References
- Stocker, T. (Ed.) Climate Change 2013: The Physical Science Basis: Working Group I Contribution to the Fifth Assessment Report of the Intergovernmental Panel on Climate Change; Cambridge University Press: Cambridge, UK, 2014. [Google Scholar]
- Highwood, E.J.; Kinnersley, R.P. When smoke gets in our eyes: The multiple impacts of atmospheric black carbon on climate, air quality and health. Environ. Int. 2006, 32, 560–566. [Google Scholar] [CrossRef] [PubMed]
- Lee, K.H.; Li, Z.; Kim, Y.J.; Kokhanovsky, A. Atmospheric aerosol monitoring from satellite observations: A history of three decades. In Atmospheric and Biological Environmental Monitoring; Springer: Dordrecht, The Netherlands, 2009; pp. 13–38. [Google Scholar]
- Diner, D.J.; Abdou, W.; Ackerman, T.; Crean, K.; Gordon, H.; Kahn, R.; Martonchik, J.; McMuldroch, S.; Paradise, S.; Pinty, B.; et al. MISR Level 2 Aerosol Retrieval Algorithm Theoretical Basis; JPL D11400; NASA: Greenbelt, MD, USA, 1999.
- Mei, L.; Rozanov, V.; Vountas, M.; Burrows, J.P.; Levy, R.C.; Lotz, W. Retrieval of aerosol optical properties using MERIS observations: Algorithm and some first results. Remote Sens. Environ. 2017, 197, 125–140. [Google Scholar] [CrossRef] [PubMed]
- Jackson, J.M.; Liu, H.; Laszlo, I.; Kondragunta, S.; Remer, L.A.; Huang, J.; Huang, H.C. Suomi-NPP VIIRS aerosol algorithms and data products. J. Geophys. Res. Atmos. 2013, 118, 12678–12689. [Google Scholar] [CrossRef]
- Gupta, P.; Remer, L.A.; Levy, R.C.; Mattoo, S. Validation of MODIS 3 km land aerosol optical depth from NASA’s EOS Terra and Aqua missions. Atmos. Meas. Tech. 2018, 11, 3145–3159. [Google Scholar] [CrossRef]
- Pandithurai, G.; Pinker, R.T.; Devara, P.C.S.; Takamura, T.; Dani, K.K. Seasonal asymmetry in diurnal variation of aerosol optical characteristics over Pune, western India. J. Geophys. Res. Atmos. 2007, 112, D08208. [Google Scholar] [CrossRef]
- Xia, X.A.; Chen, H.B.; Wang, P.C.; Zhang, W.X.; Goloub, P.; Chatenet, B.; Eck, T.F.; Holben, B.N. Variation of column-integrated aerosol properties in a Chinese urban region. J. Geophys. Res. Atmos. 2006, 111, D05204. [Google Scholar] [CrossRef]
- Kaufman, Y.J.; Tanré, D.; Remer, L.A.; Vermote, E.F.; Chu, A.; Holben, B.N. Operational remote sensing of tropospheric aerosol over land from EOS moderate resolution imaging spectroradiometer. J. Geophys. Res. Atmos. 1997, 102, 17051–17067. [Google Scholar] [CrossRef]
- Ge, B.; Li, Z.; Liu, L.; Yang, L.; Chen, X.; Hou, W.; Zhang, Y.; Li, D.; Li, L.; Qie, L. A dark target method for himawari-8/ahi aerosol retrieval: Application and validation. IEEE Trans. Geosci. Remote Sens. 2018, 57, 381–394. [Google Scholar] [CrossRef]
- Zhang, W.; Xu, H.; Zheng, F. Aerosol optical depth retrieval over East Asia using Himawari-8/AHI data. Remote Sens. 2018, 10, 137. [Google Scholar] [CrossRef]
- Hsu, N.C.; Tsay, S.C.; King, M.D.; Herman, J.R. Aerosol properties over bright-reflecting source regions. IEEE Trans. Geosci. Remote Sens. 2004, 42, 557–569. [Google Scholar] [CrossRef]
- Yoshida, M.; Kikuchi, M.; Nagao, T.M.; Murakami, H.; Nomaki, T.; Higurashi, A. Common retrieval of aerosol properties for imaging satellite sensors. J. Meteorol. Soc. Jpn. Ser. II 2018, 96B, 193–209. [Google Scholar] [CrossRef]
- Lyapustin, A.; Martonchik, J.; Wang, Y.; Laszlo, I.; Korkin, S. Multiangle implementation of atmospheric correction (MAIAC): 1. Radiative transfer basis and look-up tables. J. Geophys. Res. Atmos. 2011, 116, D03210. [Google Scholar] [CrossRef]
- Lyapustin, A.; Wang, Y.; Laszlo, I.; Kahn, R.; Korkin, S.; Remer, L.; Levy, R.; Reid, J.S. Multiangle implementation of atmospheric correction (MAIAC): 2. Aerosol algorithm. J. Geophys. Res. Atmos. 2011, 116, D03211. [Google Scholar] [CrossRef]
- Lyapustin, A.; Wang, Y.; Korkin, S.; Huang, D. MODIS Collection 6 MAIAC algorithm. Atmos. Meas. Tech. 2018, 11, 5741–5765. [Google Scholar] [CrossRef]
- Mhawish, A.; Banerjee, T.; Sorek-Hamer, M.; Lyapustin, A.; Broday, D.M.; Chatfield, R. Comparison and evaluation of MODIS Multi-angle Implementation of Atmospheric Correction (MAIAC) aerosol product over South Asia. Remote Sens. Environ. 2019, 224, 12–28. [Google Scholar] [CrossRef]
- Nemani, R.R.; Kalluri, S.N.; Lee, T.J.; Lyapustin, A.; Wang, W.; Ganguly, S.; Xiong, J. GEONEX: A NASA-NOAA Collaboration for Producing Land Surface Products from Geostationary Sensors Using Cloud Computing; AGU: Washington, DC, USA, 2018. [Google Scholar]
- Holben, B.N.; Eck, T.F.; Slutsker, I.; Tanre, D.; Buis, J.P.; Setzer, A.; Vermote, E.; Reagan, J.A.; Kaufman, Y.J.; Nakajima, T.; et al. AERONET—A federated instrument network and data archive for aerosol characterization. Remote Sens. Environ. 1998, 66, 1–16. [Google Scholar] [CrossRef]
- Dubovik, O.; Holben, B.; Eck, T.F.; Smirnov, A.; Kaufman, Y.J.; King, M.D.; Tanré, D.; Slutsker, I. Variability of absorption and optical properties of key aerosol types observed in worldwide locations. J. Atmos. Sci. 2002, 59, 590–608. [Google Scholar] [CrossRef]
- Giles, D.M.; Sinyuk, A.; Sorokin, M.G.; Schafer, J.S.; Smirnov, A.; Slutsker, I.; Eck, T.F.; Holben, B.N.; Lewis, J.R.; Campbell, J.R.; et al. Advancements in the Aerosol Robotic Network (AERONET) Version 3 database–automated near-real-time quality control algorithm with improved cloud screening for Sun photometer aerosol optical depth (AOD) measurements. Atmos. Meas. Tech. 2019, 12, 169–209. [Google Scholar] [CrossRef]
- Li, Z.; Roy, D.P.; Zhang, H.K.; Vermote, E.F.; Huang, H. Evaluation of Landsat-8 and Sentinel-2A aerosol optical depth retrievals across Chinese cities and implications for medium spatial resolution urban aerosol monitoring. Remote Sens. 2019, 11, 122. [Google Scholar] [CrossRef]
- Kaufman, Y.J.; Gobron, N.; Pinty, B.; Widlowski, J.L.; Verstraete, M.M. Relationship between surface reflectance in the visible and mid-IR used in MODIS aerosol algorithm-theory. Geophys. Res. Lett. 2002, 29, 31-1–31-4. [Google Scholar] [CrossRef]
- Okuyama, A.; Andou, A.; Date, K.; Hoasaka, K.; Mori, N.; Murata, H.; Tabata, T.; Takahashi, M.; Yoshino, R.; Bessho, K. Preliminary validation of Himawari-8/AHI navigation and calibration. Earth Obs. Syst. 2015, 9607, 96072E. [Google Scholar]
- Okuyama, A.; Takahashi, M.; Date, K.; Hosaka, K.; Murata, H.; Tabata, T.; Yoshino, R. Validation of Himawari-8/AHI Radiometric Calibration Based on Two Years of In-Orbit Data. J. Meteorol. Soc. Jpn. Ser. II 2018, 96, 91–109. [Google Scholar] [CrossRef]
- Nakajima, T.; Tanaka, M. Matrix formulations for the transfer of solar radiation in a plane-parallel scattering atmosphere. J. Quant. Spectrosc. Radiat. Transf. 1986, 35, 13–21. [Google Scholar] [CrossRef]
- Huete, A.R. Soil and sun angle interactions on partial canopy spectra. Int. J. Remote Sens. 1987, 8, 1307–1317. [Google Scholar] [CrossRef]
- Zhang, H.K.; Roy, D.P. Landsat 5 Thematic Mapper reflectance and NDVI 27-year time series inconsistencies due to satellite orbit change. Remote Sens. Environ. 2016, 186, 217–233. [Google Scholar] [CrossRef]
- Omar, A.H.; Won, J.G.; Winker, D.M.; Yoon, S.C.; Dubovik, O.; McCormick, M.P. Development of global aerosol models using cluster analysis of Aerosol Robotic Network (AERONET) measurements. J. Geophys. Res. Atmos. 2005, 110, D10S14. [Google Scholar] [CrossRef]
- Sayer, A.M.; Smirnov, A.; Hsu, N.C.; Holben, B.N. A pure marine aerosol model, for use in Remote Sens. applications. J. Geophys. Res. Atmos. 2012, 117, D05213. [Google Scholar] [CrossRef]
- Govaerts, Y.M.; Wagner, S.; Lattanzio, A.; Watts, P. Joint retrieval of surface reflectance and aerosol optical depth from MSG/SEVIRI observations with an optimal estimation approach: 1. Theory. J. Geophys. Res. Atmos. 2010, 115, D02203. [Google Scholar] [CrossRef]
- She, L.; Xue, Y.; Yang, X.; Leys, J.; Guang, J.; Che, Y.; Fan, C.; Xie, Y.; Li, Y. Joint Retrieval of Aerosol Optical Depth and Surface Reflectance Over Land Using Geostationary Satellite Data. IEEE Trans. Geosci. Remote Sens. 2019, 57, 1489–1501. [Google Scholar] [CrossRef]
- Ishida, H.; Nakajima, T.Y. Development of an unbiased cloud detection algorithm for a spaceborne multispectral imager. J. Geophys. Res. Atmos. 2009, 114, D07206. [Google Scholar] [CrossRef]
- Wang, W.; Mao, F.; Pan, Z.; Gong, W.; Yoshida, M.; Zou, B.; Ma, H. Evaluating Aerosol Optical Depth from Himawari-8 With Sun Photometer Network. J. Geophys. Res. Atmos. 2019, 124, 5516–5538. [Google Scholar] [CrossRef]
- Jiang, T.; Chen, B.; Chan, K.K.Y.; Xu, B. Himawari-8/AHI and MODIS Aerosol Optical Depths in China: Evaluation and Comparison. Remote Sens. 2019, 11, 1011. [Google Scholar] [CrossRef] [Green Version]
- Wei, J.; Li, Z.; Sun, L.; Peng, Y.; Zhang, Z.; Li, Z.; Su, T.; Feng, L.; Cai, Z.; Wu, H. Evaluation and uncertainty estimate of next-generation geostationary meteorological Himawari-8/AHI aerosol products. Sci. Total Environ. 2019, 692, 879–891. [Google Scholar] [CrossRef] [PubMed]
- Zhang, Z.; Wu, W.; Fan, M.; Tao, M.; Wei, J.; Jin, J.; Tan, Y.; Wang, Q. Validation of Himawari-8 aerosol optical depth retrievals over China. Atmos. Environ. 2019, 199, 32–44. [Google Scholar] [CrossRef]
- Zhang, W.; Xu, H.; Zhang, L. Assessment of Himawari-8 AHI Aerosol Optical Depth Over Land. Remote Sens. 2019, 11, 1108. [Google Scholar] [CrossRef] [Green Version]
- Wang, W.; Li, S.; Hashimoto, H.; Takenaka, H.; Higuchi, A.; Kalluri, S.; Nemani, R.R. An Introduction to the Geostationary-NASA (GeoNEX) Products: 1. Top-of-Atmosphere Reflectance and Brightness Temperature. Remote Sens. 2019, 11, 1517. [Google Scholar]
- Lucht, W.; Schaaf, C.B.; Strahler, A.H. An algorithm for the retrieval of albedo from space using semiempirical BRDF models. IEEE Trans. Geosci. Remote Sens. 2000, 38, 977–998. [Google Scholar] [CrossRef] [Green Version]
- Lyapustin, A.; Knyazikhin, Y. Green’s function method in the radiative transfer problem. I: Homogeneous non-Lambertian surface. Appl. Opt. 2001, 40, 3495–3501. [Google Scholar] [CrossRef] [Green Version]
- Lyapustin, A.; Wang, Y.; Laszlo, I.; Korkin, S. Improved cloud and snow screening in MAIAC aerosol retrievals using spectral and spatial analysis. Atmos. Meas. Tech. Discuss. 2012, 5, 843–850. [Google Scholar] [CrossRef] [Green Version]
- Wang, W.; Wang, Y.; Lyapustin, A.; Li, S.; Hashimoto, H.; Kalluri, S.; Nemani, R.R. An Introduction to the Geostationary-NASA (GeoNEX) Products: 2. Atmospheric Correction and Level 2 Products. Remote Sens. 2019, 11, 1517. [Google Scholar]
- Chu, D.A.; Kaufman, Y.J.; Ichoku, C.; Remer, L.A.; Tanré, D.; Holben, B.N. Validation of MODIS aerosol optical depth retrieval over land. Geophys. Res. Lett. 2002, 29, MOD2-1–MOD2-4. [Google Scholar] [CrossRef] [Green Version]
- Key, J.R.; Schweiger, A.J. Tools for atmospheric radiative transfer: Streamer and FluxNet. Comput. Geosci. 1998, 24, 443–451. [Google Scholar] [CrossRef] [Green Version]
- Levy, R.C.; Remer, L.A.; Kleidman, R.G.; Mattoo, S.; Ichoku, C.; Kahn, R.; Eck, T.F. Global evaluation of the Collection 5 MODIS dark-target aerosol products over land. Atmos. Chem. Phys. 2010, 10, 10399–10420. [Google Scholar] [CrossRef] [Green Version]
- Fraser, R.S.; Kaufman, Y.J. The relative importance of aerosol scattering and absorption in Remote Sensing. IEEE Trans. Geosci. Remote Sens. 1985, GE-23, 625–633. [Google Scholar] [CrossRef]
- Al-Saadi, J.; Szykman, J.; Pierce, R.B.; Kittaka, C.; Neil, D.; Chu, D.A.; Remer, L.; Gumley, L.; Prins, E.; Weinstock, L.; et al. Improving national air quality forecasts with satellite aerosol observations. Bull. Am. Meteorol. Soc. 2005, 86, 1249–1262. [Google Scholar] [CrossRef]
- Bilal, M.; Nichol, J.E.; Bleiweiss, M.P.; Dubois, D. A Simplified high resolution MODIS Aerosol Retrieval Algorithm (SARA) for use over mixed surfaces. Remote Sens. Environ. 2013, 136, 135–145. [Google Scholar] [CrossRef]
- Bilal, M.; Nazeer, M.; Nichol, J.E.; Bleiweiss, M.P.; Qiu, Z.; Jäkel, E.; Campbell, J.R.; Atique, L.; Huang, X.; Lolli, S. A Simplified and Robust Surface Reflectance Estimation Method (SREM) for Use over Diverse Land Surfaces Using Multi-Sensor Data. Remote Sens. 2019, 11, 1344. [Google Scholar] [CrossRef] [Green Version]
- Barnsley, M.J.; Strahler, A.H.; Morris, K.P.; Muller, J.P. Sampling the surface bidirectional reflectance distribution function (BRDF): 1. Evaluation of current and future satellite sensors. Remote Sens. Rev. 1994, 8, 271–311. [Google Scholar] [CrossRef]
- Mishra, N.; Haque, M.D.; Leigh, L.; Aaron, D.; Helder, D.; Markham, B. Radiometric cross calibration of Landsat 8 operational land imager (OLI) and Landsat 7 enhanced thematic mapper plus (ETM+). Remote Sens. 2014, 6, 12619–12638. [Google Scholar] [CrossRef] [Green Version]
- Li, Z.; Zhang, H.K.; Roy, D.P. Investigation of Sentinel-2 bidirectional reflectance hot-spot sensing conditions. IEEE Trans. Geosci. Remote Sens. 2019, 57, 3591–3598. [Google Scholar] [CrossRef]
- Shi, S.; Cheng, T.; Gu, X.; Letu, H.; Guo, H.; Chen, H.; Wang, Y.; Wu, Y. Synergistic Retrieval of Multitemporal Aerosol Optical Depth Over North China Plain Using Geostationary Satellite Data of Himawari-8. J. Geophys. Res. Atmos. 2018, 123, 5525–5537. [Google Scholar] [CrossRef]

| Product | QA Band Bit | Definition |
|---|---|---|
| JMA | 4-5 | AOD confidence 00--very good 01--good 10--Marginal 11--no confidence (or no retrieval) |
| MAIAC | 8-11 | QA for AOD 0000 --- Best quality 0001 --- Water Sediments are detected (water) 0011 --- There is 1 neighbor cloud 0100 --- There are >1 neighbor clouds 0101 --- No retrieval (cloudy, or whatever) 0110 --- No retrievals near detected or previously detected snow 0111 --- Climatology AOD: altitude above 3.5 km (water) and 4.2 km (land) 1000 --- No retrieval due to sun glint (water) 1001 --- Retrieved AOD is very low (<0.05) due to glint (water) 1010 --- AOD within ±2 km from the coastline (may be unreliable) 1011 --- Land, research quality: AOD retrieved but CM is possibly cloudy |
© 2019 by the authors. Licensee MDPI, Basel, Switzerland. This article is an open access article distributed under the terms and conditions of the Creative Commons Attribution (CC BY) license (http://creativecommons.org/licenses/by/4.0/).
Share and Cite
She, L.; Zhang, H.; Wang, W.; Wang, Y.; Shi, Y. Evaluation of the Multi-Angle Implementation of Atmospheric Correction (MAIAC) Aerosol Algorithm for Himawari-8 Data. Remote Sens. 2019, 11, 2771. https://doi.org/10.3390/rs11232771
She L, Zhang H, Wang W, Wang Y, Shi Y. Evaluation of the Multi-Angle Implementation of Atmospheric Correction (MAIAC) Aerosol Algorithm for Himawari-8 Data. Remote Sensing. 2019; 11(23):2771. https://doi.org/10.3390/rs11232771
Chicago/Turabian StyleShe, Lu, Hankui Zhang, Weile Wang, Yujie Wang, and Yun Shi. 2019. "Evaluation of the Multi-Angle Implementation of Atmospheric Correction (MAIAC) Aerosol Algorithm for Himawari-8 Data" Remote Sensing 11, no. 23: 2771. https://doi.org/10.3390/rs11232771