1. Introduction
Forest ecosystems are dominated by trees and other woody plants. As an important natural resource on Earth, forests bring economic, ecological, and social benefits and are of great significance to human livelihoods, economic development, and social progress. Forests dominate terrestrial ecosystems, play a supporting role in maintaining terrestrial ecosystem balance, and provide the material basis for forestry development.
Tree crown shape and size are usually related to photosynthesis, nutrient cycling, energy transfer, and light transmission to the understory vegetation, and these properties affect tree growth [
1]. Commonly used crown size parameters include crown length, crown width, crown volume, and crown surface area. Crown width refers to the space occupied by an individual tree. Crown width rate and crown ratio (i.e., ratio of crown length to total tree height) are indicators of stand density, stand competition, and stand survival. The crown profile is a predictor of crown size and can reflect crown length, crown ratio, crown width, crown surface area, crown volume, leaf surface area, and biomass distribution [
2,
3,
4]. Therefore, the crown profile is an important indicator variable for the management of stand spatial structure and the adjustment of crown structure [
5]. Adding crown surface area to the allometric growth equation for estimating the biomass of tropical trees can greatly enhance prediction accuracy, particularly trees with a diameter at breast height (DBH) greater than 95 cm [
6]. In addition, biomass equations that include crown size can improve the biomass predictions of branches (dead, live, and all branches) and leaves [
7]. When crown surface area was added to the biomass equation with tree height as the only dependent variable, the coefficient of determination (R
2) of the equation increased from 0.898 to 0.966 [
8].
As the importance of the tree crown has become more apparent, researchers [
9,
10,
11] have increasingly conducted in-depth studies on crowns and have proposed the concept of the effective crown. The effective crown refers to the crown above the lower limit of the forest crown that includes the maximum vertical distribution density of branches and leaves. The effective crown plays an important role in tree growth, particularly trunk growth. In larch plantations, the effective crown height is stable within a given stand and is similar to the average minimum contact height with adjacent trees within the stand [
9]. The contact height is the height at which adjacent individual trees contact each other. In this paper, the minimum contact height and the maximum contact height are used as variables in a biomass model. The effective crown can be used as an index of individual-tree competition to improve the fitting of individual-tree models [
10] and to predict the pruning time and intensity in larch plantations [
11]. Nevertheless, the current method of surveying plantation resources is time consuming and laborious, which makes it error prone, and requires field operations that are highly labor intensive. Using conventional forest survey tools to accurately determine the irregular shape of the crown surface is a challenging task [
1]. The emergence of light detection and ranging (LiDAR) technology has brought new opportunities and challenges to forest resource surveys.
LiDAR is an active remote sensing technique that accurately measures the geographic positions of objects on the Earth’s surface by emitting and receiving laser pulses. LiDAR has unparalleled advantages in measuring forest crowns because laser pulses can penetrate forest crowns, and detailed information about the three-dimensional forest structure from the crown layer to the understory can be obtained [
12,
13,
14]. Terrestrial laser scanning (TLS) employs a distribution of base stations to acquire point cloud data by base station-centered spherical scanning; these data are then used to observe the three-dimensional spatial structure of individual trees or forests in sample plots. At present, TLS is used to directly measure or estimate variables such as DBH, tree height, crown height, crown diameter, stand basal area, aboveground biomass, crown cover, tree density, and tree volume [
15,
16,
17,
18]. There are no significant differences between DBH measurements using TLS and those made manually in sample plots [
19]. Oveland et al. [
20] automatically extracted tree positions and DBH from laser scanning data collected by a single moving instrument by improving the identification of individual trees and iterating the closest point estimates of center points. Using five-station point cloud data, Calders [
21] showed that TLS-derived tree heights better reflected the actual tree heights than the tree height measurements by an ultrasonic hypsometer. A TLS system can generate millions of laser pulses to measure the crown, whereas traditional field measurements are commonly based on single measurements of the tallest part of the tree. Raumonen et al. [
22] approximated the branch structure and size properties of the whole tree or certain parts of the tree by scanning five trees in three locations and reconstructing the surface of the visible parts of the tree and the topological branch structure. Kankare et al. [
23] found that using stem curves and crown size geometric measurements from 15 trees with 5–7 TLS scan positions as a basis for allometric biomass models could enhance the accuracy of biomass estimations. Feliciano et al. [
24] modeled stems as frustums of paraboloids and modeled prop roots (Rhizophora mangle) as toroids and cylinders. Aboveground biomass (AGB) was estimated by multiplying the three-station TLS-derived volume by the specific density of the wood. Abd et al. [
25] calculated the biomass of the stem by multiplying the four-station TLS-derived stem volume by wood density for 16 tree species. The biomass of the branches was estimated from the wood density of the 16 tree species and branch volume, and the biomass of the leaves was estimated from leaf density and leaf volume
. The presence of dense understory vegetation significantly decreases the numbers of point clouds obtained in the upper part of the forest, which causes uncertainty in the estimations of branch and leaf biomass.
To extend the derivation of sample plot level biomass to large-scale biomass, airborne laser scanning (ALS) can be a useful tool for monitoring large-scale AGB. ALS can rapidly acquire tree height and partial canopies over large areas, but it cannot directly measure DBH. Currently, most biomass equations based on ALS data only use tree height as the key parameter for estimation [
26,
27]. Therefore, in this study, point cloud information for trees was obtained using TLS, and three-dimensional crown parameters at different heights were extracted from the point clouds. These parameters were used to construct a single-factor biomass model based on tree height and a multifactor biomass model based on tree height and the effective crown, which significantly influences tree growth. The differences between these two biomass models were studied to improve the fit of the individual-tree biomass model by adding crown-related variables and to investigate how the biomass estimation accuracy could be enhanced using remote sensing methods without obtaining DBH. The results will help improve the accuracy of acquiring large-scale biomass in future studies.
3. Methods
A flow chart of techniques used in the research is shown in
Figure 2. This chart summarizes the steps for estimating forest AGB using TLS data. The main steps were the extraction of crown parameters and the fitting of the forest AGB model.
3.1. Processing of TLS Point Cloud Data
To facilitate the splicing of TLS data, five target balls are arranged in each sample plot during the TLS process. If the target balls of two stations overlap more than three point clouds, the two stations’ laser point clouds have been spliced successfully. The point cloud data from all five stations are spliced into one forest in the same way. The resulting point cloud data were processed using LiDAR360 software. The LiDAR point cloud data were cropped based on sample plot areas, and noise was removed by setting high thresholds. Ground point filtering was conducted based on a slope threshold. Point clouds underwent normalization based on a digital elevation model (DEM) generated from ground points to remove terrain influence. Due to the large volume of the TLS point cloud data, 2 days were required to segment each sample plot into individual trees. However, after point cloud thinning was performed while retaining information on the forest characteristics for individual-tree segmentation, the processing time was shortened from 2 days to 4 hours. The output of individual-tree point clouds was visually inspected; if necessary, unrelated vegetation adjacent to trees was manually removed, and point clouds separated by mistakes were removed.
3.2. Individual-Tree Matching
The area of data scanned by TLS was much larger than the area of the sample plots. However, because the position of each measured tree was only the relative position between sample trees, it was difficult to identify sample plots in the TLS point cloud data, let alone match individual trees to the sample trees in the sample plots. Hence, in this study, backpack LiDAR data were used to match individual trees extracted from TLS data to individual sample trees. The point cloud image from the backpack LiDAR is the same as that of the TLS and is combined with the backpack LiDAR transect. Thus, it is easy to find the position of the sample plot and to match individual trees in the TLS LiDAR data with sample trees in the sample plots. As backpack laser scanning began at the position of the ‘number 1’ tree, we know the ‘number 1’ tree in the TLS LiDAR data. Subsequently, the point cloud data of individual trees that underwent TLS segmentation were matched with tallied individual trees through the relative position between sample trees and tree number. The backpack LiDAR data are only used for position matching, and time has no effect on position matching. Consequently, the point cloud data of individual trees that underwent TLS segmentation were matched with tallied individual trees.
Individual trees that were dead (both standing and fallen), broken, inclined, and species other than larch were removed from the individual-tree data obtained from tallying in the sample plots. The number of remaining trees was the number of sample trees in the sample plots. After individual-tree matching, the number of individual trees segmented by TLS that matched the tallied individual trees was the number of correctly matched trees. The results of individual-tree matching are shown in
Table 2.
In sample plot 3, dead branches were distributed between the top part of the roots and the living branches, which blocked LiDAR scanning and possibly caused errors in recognition. Sample plots 5 and 6 had relatively large areas, so trees farther away from laser scanners might have been blocked or the point clouds might have been sparse, resulting in the inaccurate identification of individual trees. Moreover, only four terrestrial laser scanners were used in sample plot 5; consequently, the degree of obstruction and sparseness of the point clouds was more severe in sample plot 5 than in other sample plots.
3.3. Derivation of Individual-Tree Biomass
According to the existing individual-tree biomass Equation (2) [
28], individual-tree biomass is related to tree height and DBH. The greatest advantage of using ALS data is the direct acquisition of effective crown height information, but this method has difficulty obtaining DBH, which must be calculated indirectly:
where H is tree height, D is DBH, ρ is the density of wood (units: g/cm
3), β<1, and F is a coefficient that indicates the extent of the decrease in trunk cross-sectional area with increasing height, the value of which varies among tree species.
Researchers have demonstrated that during tree growth, the effective crown is related to DBH [
10]:
In particular, the effective crown surface area (ECSA) is closely related to DBH (D), effective crown height (HEC), and effective crown length (ECL).
Assuming sufficient sampling of TLS point clouds, H
1 and H
2 in Equation (4) are the effective crown height and maximum crown height, respectively, of an individual tree. The height difference is the ECL. The ECSA can be derived through feature extraction from the LiDAR point cloud using Equation (4), where F
aPP refers to the density distribution function of the individual-tree crown component:
Equation (5) can be obtained from Equations (2), (3), and (4):
If we let
, Equation (5) is simplified to the following:
As shown in Equation (6), individual-tree biomass is closely related to crown, ECSA, effective crown height (HEC), and ECL.
3.4. Extraction of Crown Parameters
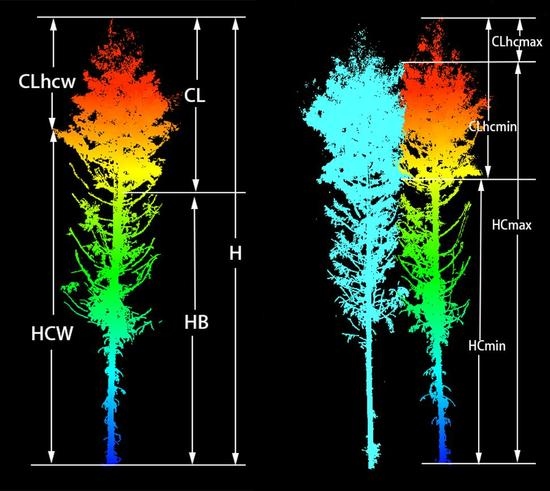
To investigate the influence of tree canopies of different heights on tree growth and to determine the effective crown height, 15 different variables from three different height levels were extracted to estimate biomass. Some of these variables could be directly extracted from individual-tree TLS point clouds, including the height of the first living branch (HB), the height at the maximum crown width (HCW), the minimum contact height of the crown (HCmin), the maximum contact height of the crown (HCmax), tree height (H), and differences between H and various heights extracted from the point cloud, which give crown length (CL), crown length from the crown at maximum width (CLhcw), crown length from minimum contact height (CLhcmin), and crown length from maximum contact height (CLhcmax). Crown volume and crown surface area were calculated using the geometric method, the sectional quadrature method, and crown shape models [
29,
30,
31]. In the geometric method and the sectional quadrature method, the crown is divided into several layers by considering the entire crown as a regular geometry and summing the volume and surface area of each layer of the crown to obtain the total crown volume and surface area. The crown shape model is used to construct the crown equation based on the crown structure analysis, and the crown volume and surface area are calculated by the equation. However, because crown shape changes with tree age [
32], the same model may not be suitable for trees of different ages. Furthermore, under the influence of light incidence, intertree competition, and other factors, tree crowns can have asymmetrical shapes [
33]. The usage of the geometric method or the sectional quadrature method cannot accurately describe crown shape. In this study, the crown surface point cloud was obtained using MATLAB R2018a programming, and based on the convex hull, we calculated the crown surface area at maximum crown width (CSCW), crown volume above the maximum crown width (CVCW), crown surface area from minimum contact height (CSCmin), crown volume from minimum contact height (CVCmin), crown surface area from maximum contact height (CSCmax), and crown volume from maximum contact height (CVCmax) (
Figure 3,
Table 3).
3.5. Model Construction
Crown parameters of different heights obtained from the sample trees were used as study data. First, a biomass model that contained tree height as the sole variable was established. A correlation analysis of dependent and independent variables was performed to evaluate the correlations between 15 crown parameters and the biomass, and the correlation coefficient (r) values were computed according to Equation (7). The five crown parameters lnH, lnHCmin, lnCLhcmin, lnCSCmin, and lnCVCmin were used as the independent variables for the minimum contact height of the crown, lnAGB was used as the dependent variable, and stepwise regression models at the minimum contact height of the crown were fitted using Equation (8). STEPWISE mode was used and this mode is similar to FORWARD model except the columns in the model do not necessarily remain. lnH was consistently used as a forcing variable in the model. STEPWISE mode sequentially selects the optimal variables to include the model according to the Akaike Information Criterion (AIC). The stepwise process ends when none of the effects outside the model has an F statistic significant at the SLENTRY=level and every effect in the model is significant at the SLSTAY=level. The output results include the univariate optimal model, the bivariate optimal model, the three-variable optimal model and the four-variable optimal model. The same method was then employed with the seven crown parameters lnH, lnHB, lnCL, lnHCW, lnCLhcw, lnCSCW, and lnCVCW as the independent variables for crown width to fit stepwise regression models. Similarly, the five crown parameters lnH, lnHCmax, lnCLhcmax, lnCSCmax, and lnCVCmax were used as the independent variables for the maximum contact height of the crown to fit stepwise regression models. Moreover, all 15 crown parameters were also used as independent variables to fit stepwise regression models.
The stepwise regression biomass models that use tree height as the sole variable and multifactor equations including crown factors were compared, and adjusted coefficient of determination (
) and root-mean-square error (RMSE) values were used to evaluate model fit with Equations (9) and (10).
where β
j is a model coefficient, x
j is a crown parameter, and ε is an error term.
where y
i,
, and
are the observed, average, and predicted value, respectively, of the dependent variable for i = 1, …, n; x
i and
are the observed and average value, respectively, of the independent variable for i = 1,…,n; and n and p are the number of observations and model parameter variables, respectively.
5. Discussion
In trees, photosynthesis mainly occurs in the crown and is one of the indicators of tree vitality. CL, crown height, crown volume, and crown surface area reflect the level of competition between trees and are important indicators for estimating biomass. Single-factor equations that include only tree height cannot fully reflect the growth conditions of individual trees. Therefore, the addition of effective crown height and length can reveal the area of tree photosynthesis, transport distance of organic matter, and net photosynthesis, which can closely link biomass with tree photosynthesis, respiration, and other physiological processes. The addition of crown surface area data can reflect crown size, the level of competition with adjacent trees, and tree growth conditions. Multiple variables can reflect horizontal and vertical individual-tree information and help more accurately estimate biomass.
Goodman et al. [
6] added crown elliptical area to the biomass equation with tree height as the sole variable to predict tropical tree biomass. Regarding the model fit results, R
2 increased from 0.828 to 0.938, and RSE decreased from 0.760 to 0.462. Paul et al. [
8] added crown area to the biomass equation with tree height as the sole variable, which increased R
2 from 0.898 to 0.966 and decreased AIC from −91.68 to −148.69. In the present study, R
2 increased from 0.846 to 0.899, and RMSE decreased from 0.372 kg to 0.294 kg. The results of this study are consistent with Goodman’s and Paul’s findings that indicate the importance of crowns for individual-tree biomass. The difference between this article and those two articles is the way in which the data were collected. Goodman’s and Paul’s data were obtained through destructive methods that are cumbersome and expensive and are fatal to trees. In this study, crown parameters were acquired via nondestructive methods, and for the first time, on the basis of an allometric growth equation, the effective crown (which is important to tree growth) was added to enhance the accuracy of derived individual-tree biomass.
Among the correlation coefficients of crown parameters and biomass, the correlation between biomass and crown height was the strongest, followed by crown surface area, crown volume, and CL. However, when fitting the model with tree height as the sole variable, crown surface area (not crown height) was added to the equation first. This is because crown height and tree height are both parameters describing vertical height, and crown surface area incorporates horizontal width. Given the presence of tree height as a variable, the addition of crown surface area better explained biomass than the addition of crown height. The reason why CL was added to the model before crown height is because crown height mainly included the lower part of the trunk with a small proportion of the crown, and CL accounted for the main part of the crown and thus better described the crown. There was a strong linear relationship between crown volume and crown surface area, and either one could explain crown variation.
Fengri Li (1996) [
9] determined the effective crown height by analyzing the cross-sectional growth at different trunk heights, the vertical distribution of leaf volume, and the growth of branches at different relative depths into the crown. The critical height above which trunk cross-sectional growth and leaf volume no longer differed significantly with increasing relative depth into the crown was the effective crown height. Above this height, branches could continue to grow, whereas below this height, the photosynthetic products of branches made no contribution to the trunk growth. Within the same stand, the position of the effective crown height was approximately the same as that of the minimum contact height of the crown. In this study, the results of fitting different crown parameters to individual-tree biomass models indicated that the biomass models with parameters at the minimum contact height of the crown had the best fit, as
increased from 0.846 to 0.91, which is consistent with the results of Li. Dong [
34] determined the contribution of branches and leaves in each pseudowhorl to the trunk based on the cumulative photosynthetic production and corresponding increase in carbon of branches and leaves for each pseudowhorl in the growing season. The height at which the contribution is 0 is considered the effective crown height, which is consistent with the concept of the effective crown. The cumulative photosynthetic production of branches and leaves at different locations and their contributions to the trunk were calculated based on the perspective of tree physiology, which had a strong theoretical basis and high credibility. Study findings indicated that the effective crown ratio ((tree height-effective crown height)/crown length) was concentrated at approximately 0.6–0.85, and the average crown ratio was 0.75. In this study, the average crown ratio was calculated for three different heights: the crown ratio was 0.79 at the minimum contact height of the crown, 0.64 at the maximum crown width, and 0.28 at the maximum contact height of the crown. The minimum contact height of the crown obtained from the spatial structure analysis in this study was very similar to the effective height obtained from the physiological structure analysis by Dong. The fit of models with parameters at the maximum contact height of the crown was slightly worse than those with parameters at the minimum contact height of the crown. The crown ratio at the maximum crown width was 0.64, which approximated the effective crown height. The results of this study on effective crown height were consistent with those of Dong and Li. In this study, TLS was used to reconstruct the three-dimensional structure of trees, and the effective height and other crown parameters were obtained from point clouds, which provide a new method for the extraction of effective crown height.
Equation (6) was constructed by joint derivation from the allometric growth equation and the effective crown equation. It has a certain physical meaning and is not a completely empirical equation. Surface area in the equation was obtained through program computations using LiDAR-extracted point cloud data of the crown surface. Its value was more accurate than the surface area obtained from the many individual-tree biomass equations that treat the crown as a geometric object. On the basis of the allometric growth equation, the effective crown was incorporated into Equation (6). It has been experimentally demonstrated that the effective crown had a greater influence on biomass and on enhancing the accuracy of the biomass estimation than the other crown parameters. Equation (6) contains information about tree height and the crown. Crown surface area can reflect the spatial use of individual trees and the level of competition with adjacent trees and may better reflect tree growth conditions and enhance the accuracy of biomass estimation. The value of the coefficient α in Equation (6) is related to tree species, and the equation can be applied to different tree species with strong versatility.
6. Conclusions
Biomass was strongly correlated with crown parameters, including crown height at both the lowest contact point and the widest part of the crown. Detailed descriptions of crown information based on laser pulses emitted and received by TLS and the strong correlations between crown parameters and biomass could explain why crown parameters extracted from point cloud data were strongly correlated with biomass. Correlation analysis between crown parameters and biomass indicated that the tree crown played an important role in the estimation of individual-tree biomass.
In this study, TLS was used to obtain three-dimensional point cloud data of trees. Because TLS has the advantage of describing the spatial structure of trees in detail, crown parameters of three different heights were extracted, and a multiple stepwise regression was performed to determine the position of the effective crown. Among the three parameters, minimum contact height of the crown, height at maximum crown width, and maximum contact height of the crown, the minimum contact height of the crown was very similar to the effective crown height. Biomass models with effective crown factors were constructed by combining the allometric growth equation and the effective crown equation. The results showed that when the minimum contact height of the crown was used as the effective crown height, the
of the biomass model (including crown surface area, CL, and crown height) increased from 0.846 to 0.910, and RMSE decreased from 0.372 kg to 0.286 kg. This finding indicated that the model including both tree height and crown information better reflects tree growth conditions and enhances the accuracy of the derived biomass. Moreover, in comparison with other crown parameters, the effective crown played a major role in influencing tree growth, particularly trunk growth. The effective crown can be used as an indicator of intertree competition to improve the fitting of individual-tree models [
16], to predict the growth status of larch forests, and to derive biomass. This study provides a new method for extracting effective crown height through the derivation of biomass.
In this study, in-depth research was conducted under the current limitation that DBH cannot be obtained using ALS. TLS point cloud data were used to investigate the use of tree height and crown information to enhance the accuracy of forest biomass estimates. This study aimed to improve the accuracy of obtaining forest biomass using large-scale remote sensing, which can help prepare for the development of large-scale remote sensing monitoring of forest resources. Understanding how to obtain the variables in Equation (6) from ALS data is an urgent problem that needs to be solved.


